

Sample Category Title
AUD/USD: Aussie Dollar Keeps Bullish Bias ahead of US Inflation Report
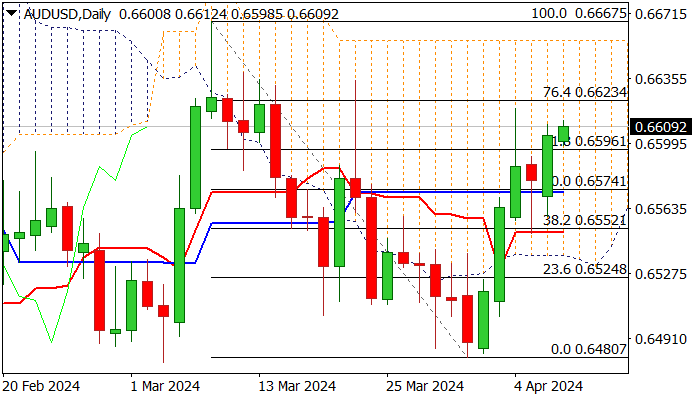
AUDUSD is trading within a narrow range on Tuesday morning but keeps slight bullish bias following Monday’s 0.5% advance and a positive signal on daily close above 0.6597 (100DMA / Fibo 61.8% of 0.6675/0.6480 bear-leg).
Aussie dollar was boosted by rise in iron ore, but markets are likely to reduce the speed until release of US inflation data on Wednesday, which will provide more information for the US central bank about the timing of the first rate cut and impact the dollar.
Immediate support lays at 0.6597, ahead of daily Kijun-sen (0.6574), which should hold and keep near-term bias with bulls, guarding lower pivot at 0.6552 (daily Tenkan-sen / broken Fibo 38.2%).
Initial resistances at 0.6623/34 (Fibo 76.4% / Mar 23 spike high) mark upper pivots, violation of which to expose key barriers at 0.6656/67 (daily cloud top / Mar 8 high).
Res: 0.6623; 0.6634; 0.6656; 0.6667.
Sup: 0.6597; 0.6574; 0.6552; 0.6524.
SPX Perfect Buying Opportunity At The Blue Box Area
In this technical blog, we will look at the past performance of the 1-hour Elliott Wave Charts of SPX. We presented to members at the elliottwave-forecast. In which, the rally from the 05 January 2024 low unfolded as an impulse structure and showed a bullish sequence. Suggested that the index should see more upside extension to complete the impulse sequence. Therefore, we advised members not to sell the index & buy the dips in 3, 7, or 11 swings at the blue box areas. We will explain the structure & forecast below:
SPX 1-Hour Elliott Wave Chart From 4.05.2024
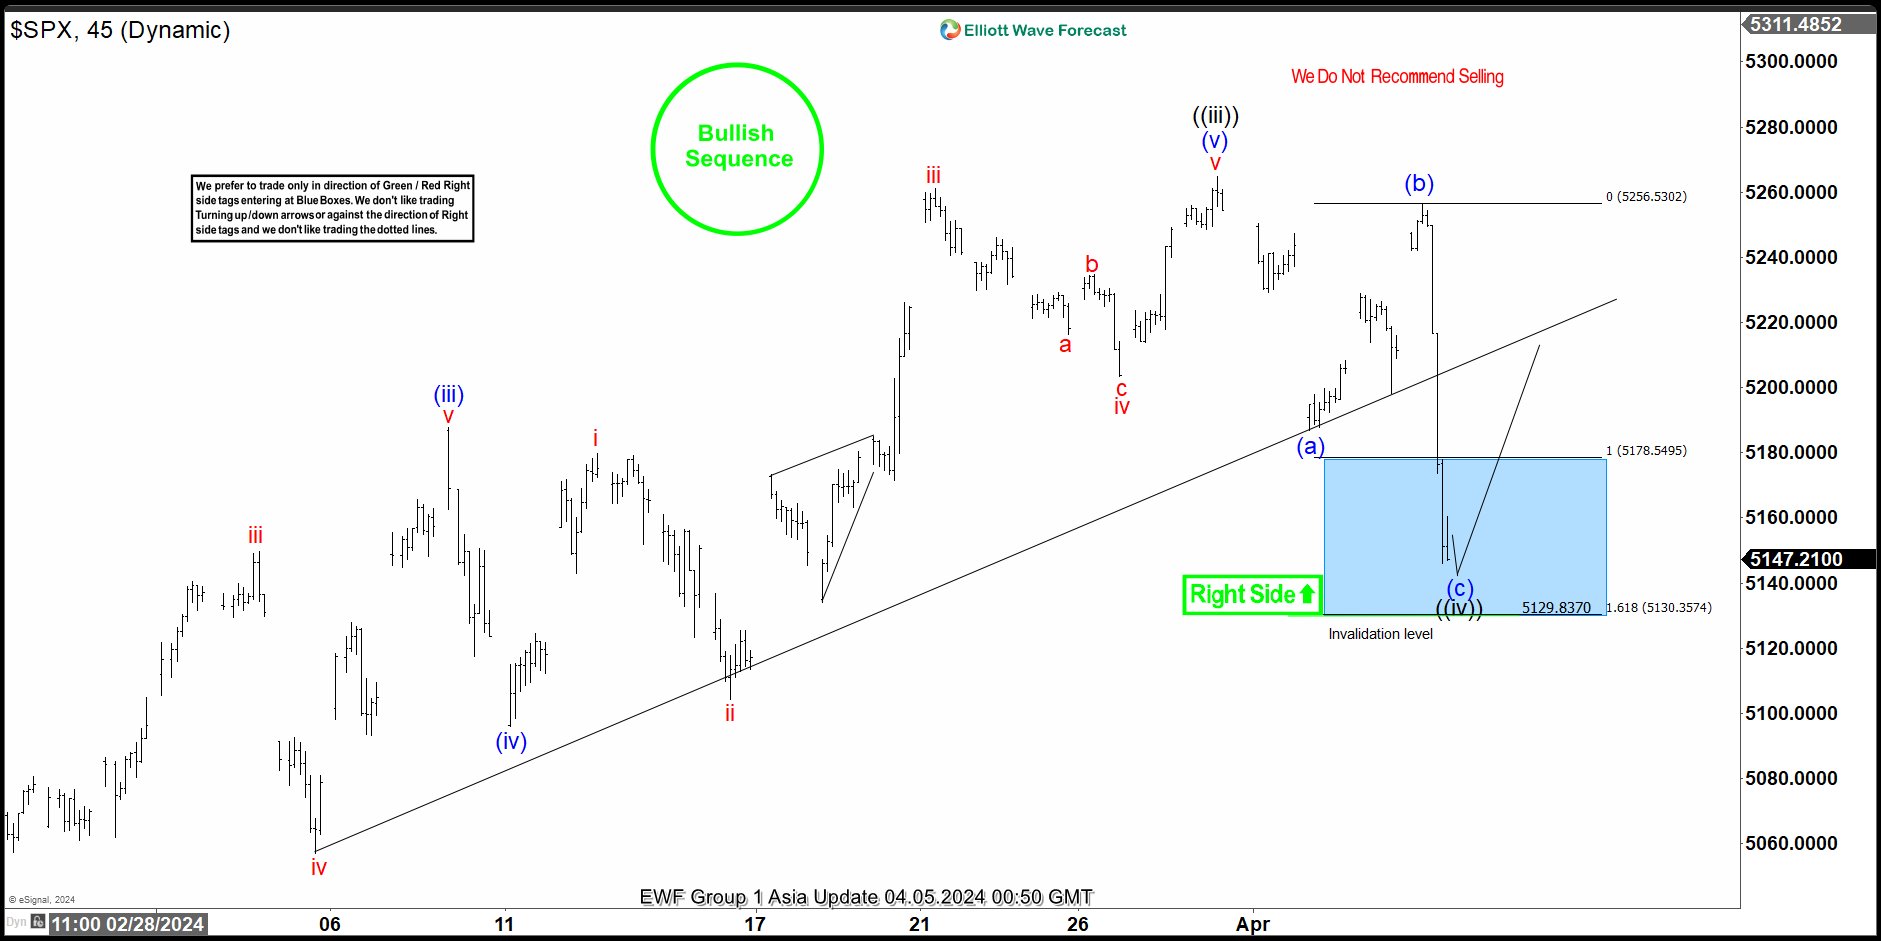
Here’s the 1-hour Elliott wave chart from the 4/05/2024 Asia update. In which, the short-term cycle from the 1/17/2024 low ended in wave ((iii)) as impulse at $5264.85 high. Down from there, the index made a pullback in wave ((iv)) to correct that cycle. The internals of that pullback unfolded as Elliott wave zigzag structure where wave (a) ended at $5186.71 low. Wave (b) bounce ended at $5256.59 high and wave (c) managed to reach the blue box area at $5178.54- $5130.35. From there, buyers were expected to appear looking for the next leg higher or for a 3 wave bounce minimum.
SPX Latest 1-Hour Elliott Wave Chart 4.09.2024
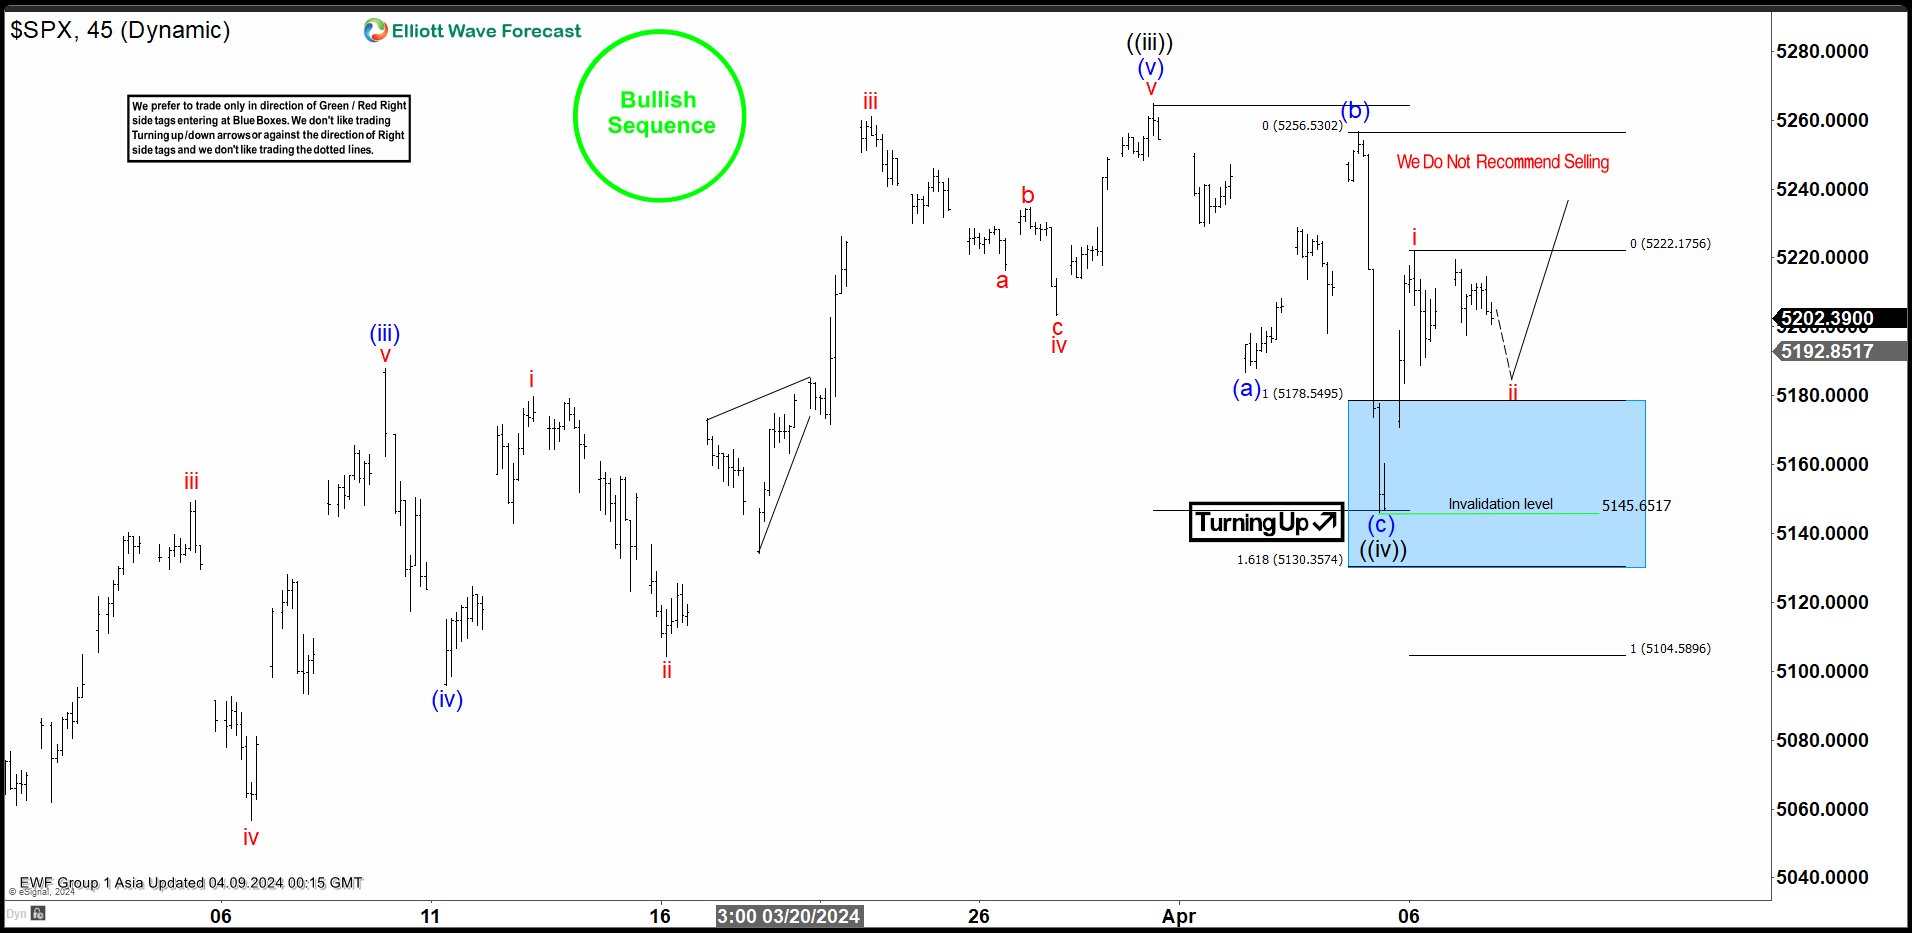
This is the latest 1-hour Elliott wave Chart from the 4/09/2024 Asia update. In which the index is showing a reaction higher taking place, right after ending the zigzag correction within the blue box area. Allowed members to create a risk-free position shortly after taking the long position at the blue box area. However, a break above $5264.85 high is still needed to confirm the next extension higher towards $5292- $5338 area higher and avoid double correction lower.
EUR/USD: Holds in Extended Sideways Mode, Initial Negative Signals Developing on Daily Chart
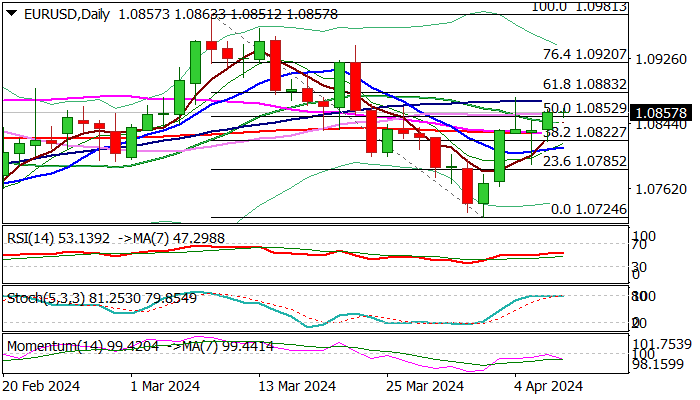
Near-term action remains in a directional mode and ranging between converged 55/200DMA’s (1.0831) and 100DMA (1.0871).
Strong rejections in both directions in past few sessions add to neutral stance, with the pair looking for fresh direction signals.
Daily studies are mixed, though 14-d momentum bearish divergence and overbought stochastic seen as warning.
Expect initial bearish signal on break of 1.0831 pivot, which will need a confirmation on extension and close below 10DMA (1.0813).
Conversely, sustained break above 100DMA and Fibo barrier at 1.0883 (61.8% retracement of 1.0981/1.0724) to signal continuation of bull-leg from 1.0724 (Apr 2 low).
Res: 1.0871; 1.0883; 1.0820; 1.0942.
Sup: 1.0852; 1.0831; 1.0813; 1.0800.
GBPUSD Capped by 50-day SMA
- GBPUSD trades sideways between parallel SMAs
- Remains within its medium-term neutral pattern
- Momentum indicators improve but stay in negative zones
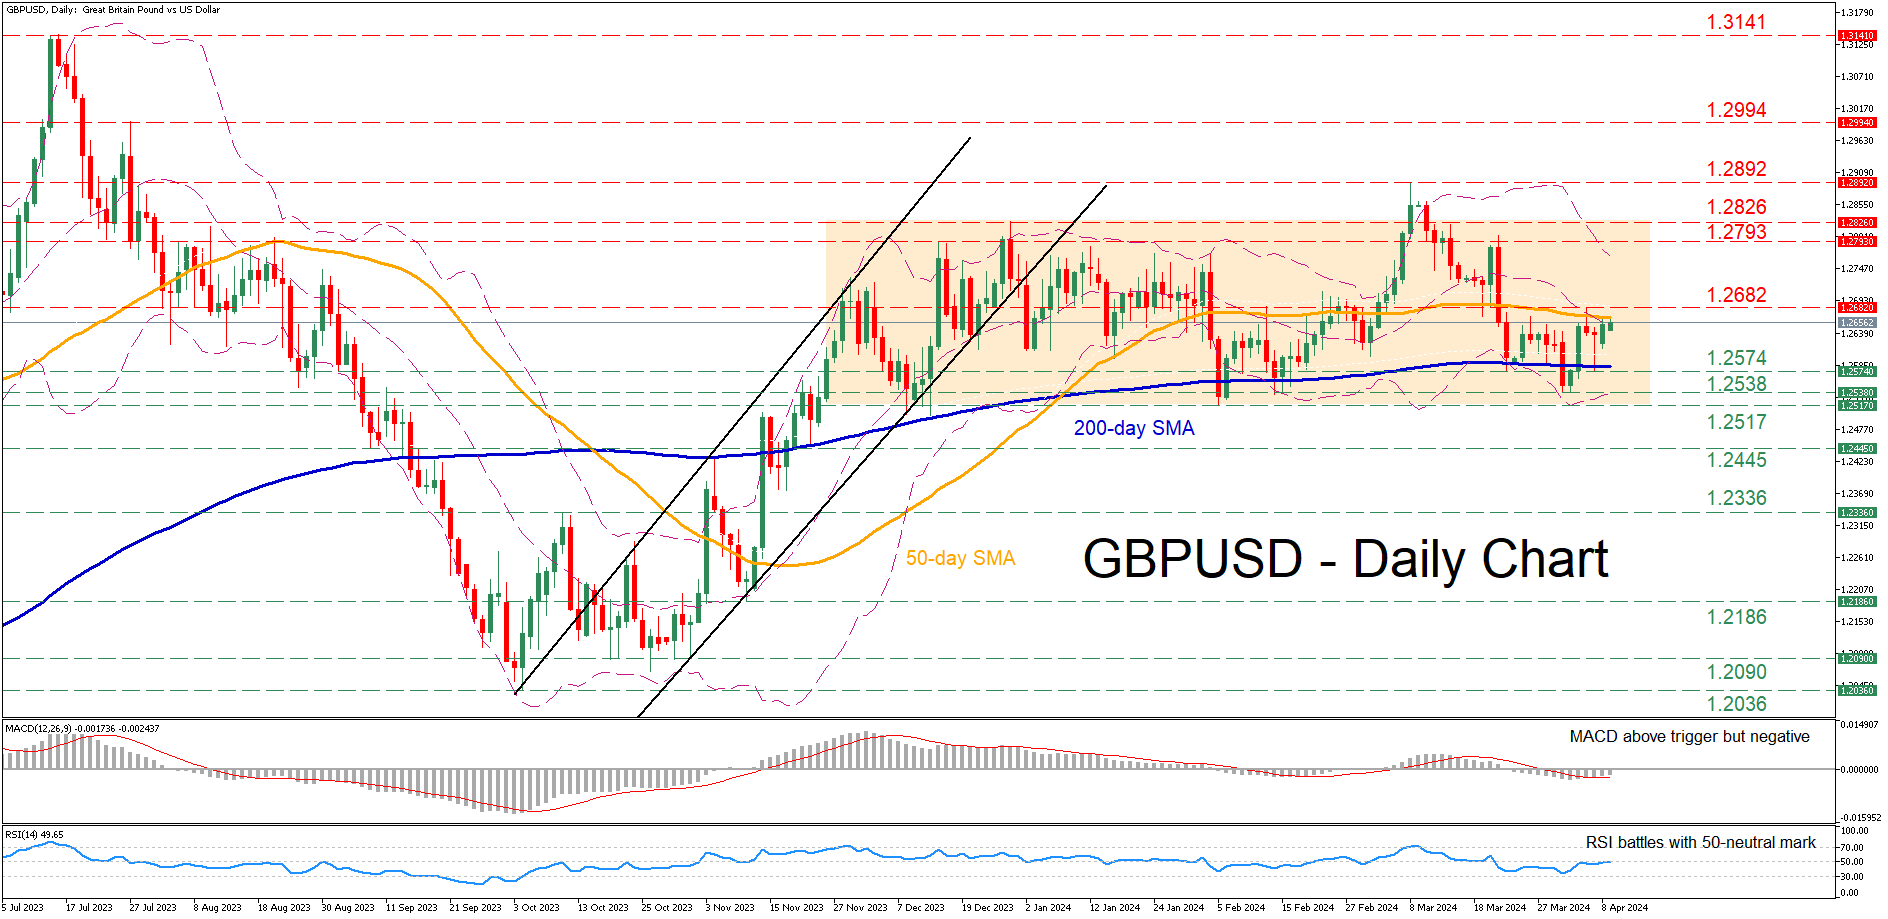
GBPUSD experienced a strong decline following its break above the rangebound structure in place since November. Despite the temporary violation of the 200-day simple moving average (SMA), the pair reversed back higher before the 50-day SMA curbed its upside.
Should bullish pressures persist, the pair could violate the 50-day SMA and challenge the recent resistance of 1.2682. Higher, the December resistance of 1.2793 could prove to be the next barricade for the price to overcome. Further advances may come to a halt at 1.2826 ahead of the 2024 peak of 1.2892.
On the flipside, bearish actions could send the price to test the March-April support of 1.2574, which overlaps with the 200-day SMA. A dive below that region could open the door for the April bottom of 1.2538 before the 2024 low of 1.2517 comes under scrutiny.
In brief, GBPUSD has been trading sideways within a range defined by the 50- and 200-day SMAs in the past few sessions. Therefore, for the technical picture to improve, the pair needs to break above the recent range.
GBP/JPY Daily Outlook
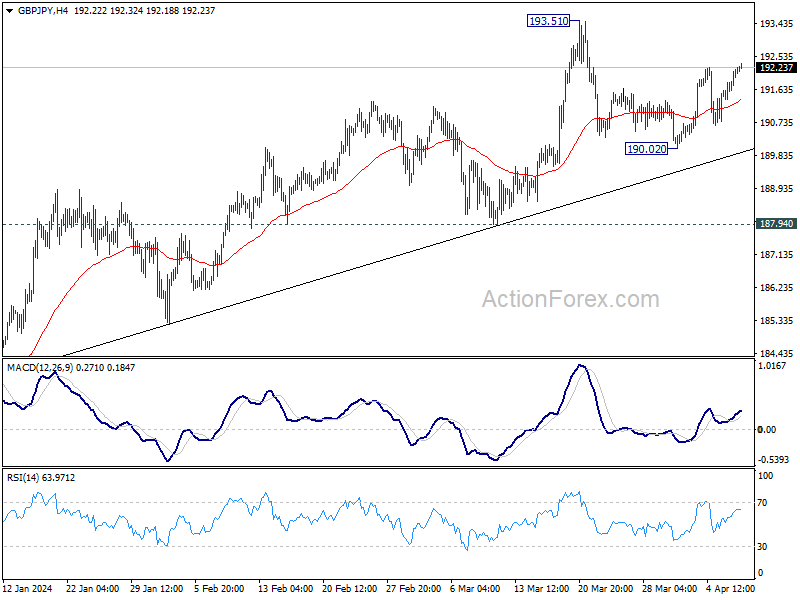
Daily Pivots: (S1) 191.63; (P) 191.92; (R1) 192.45; More.....
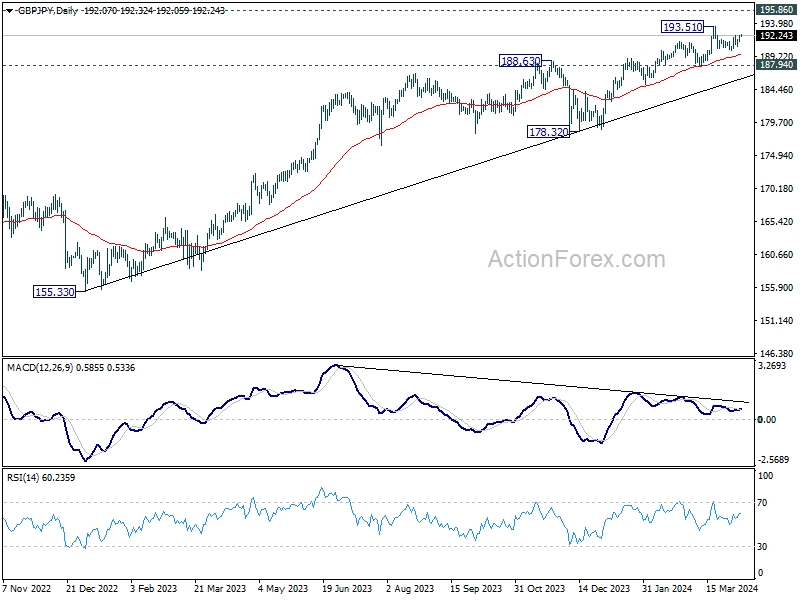
Intraday bias in GBP/JPY stays neutral as consolidations continue below 193.51. On the upside, break of 193.51 will resume larger up trend to 195.86 long term resistance. On the downside, though, break of 190.02 will turn bias to the downside for 187.94 support instead.
In the bigger picture, current rally is part of the up trend from 123.94 (2020 low), and is in progress for 195.86 long term resistance (2015 high). Break of 187.94 support is needed to be the first sign of medium term topping. Otherwise, outlook will remain bullish in case of retreat.
EUR/JPY Daily Outlook
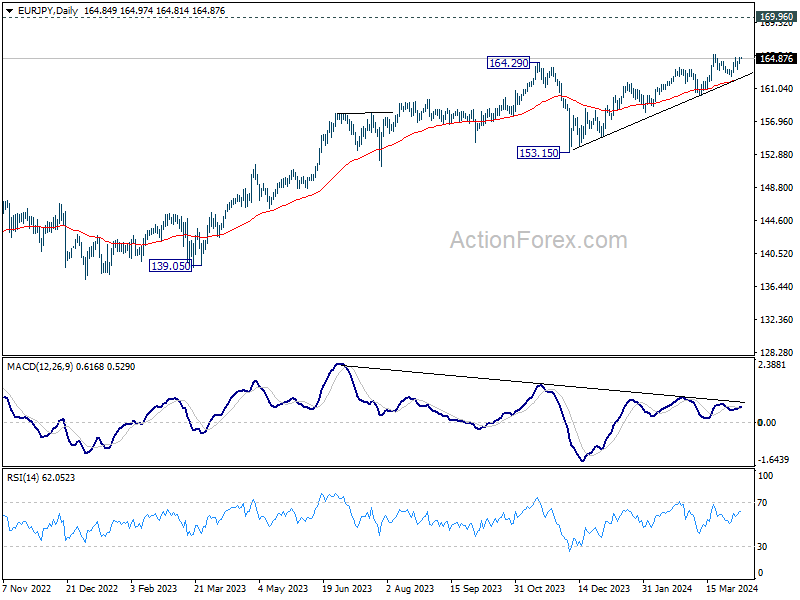
Daily Pivots: (S1) 164.42; (P) 164.67; (R1) 165.14; More...
Range trading continues in EUR/JPY and intraday bias remains neutral. More consolidations could be seen below 165.33.On the upside, firm break of 165.33 will resume larger up trend towards 169.96 key resistance next. On the downside, though, break of 162.59 will turn bias to the downside for 160.20 support next.
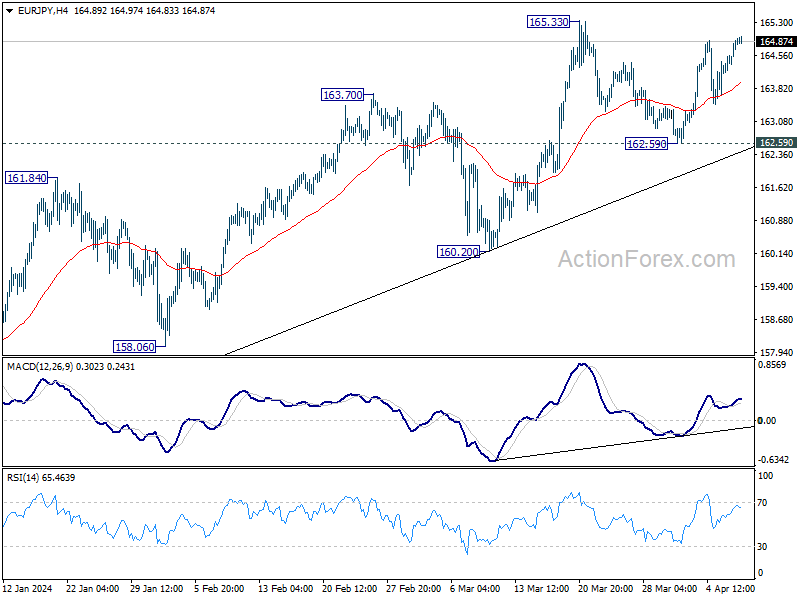
In the bigger picture, current rally is part of the up trend from 114.42 (2020 low), which is still in progress. Next target is 169.96 (2008 high). Break of 160.20 support is needed to be the first sign of medium term topping. Otherwise, outlook will stay bullish in case of retreat.
EUR/GBP Daily Outlook
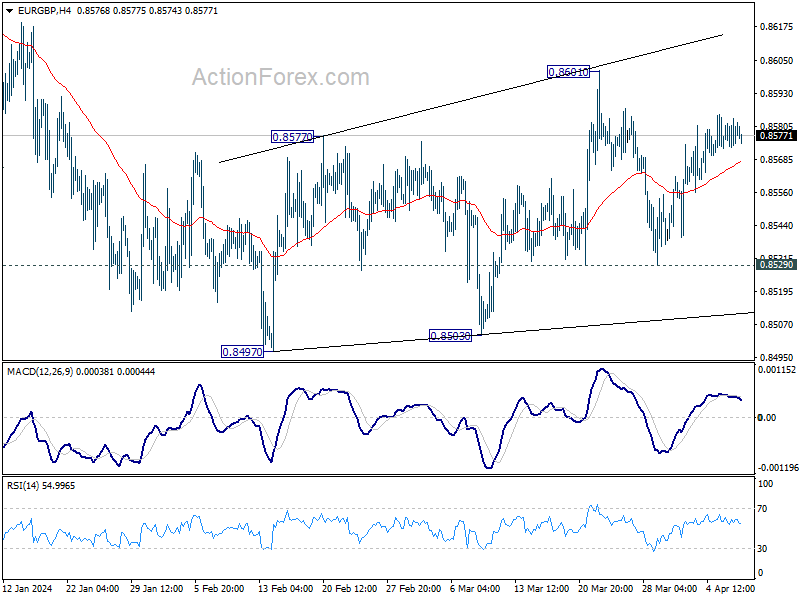
Daily Pivots: (S1) 0.8575; (P) 0.8580; (R1) 0.8587; More...
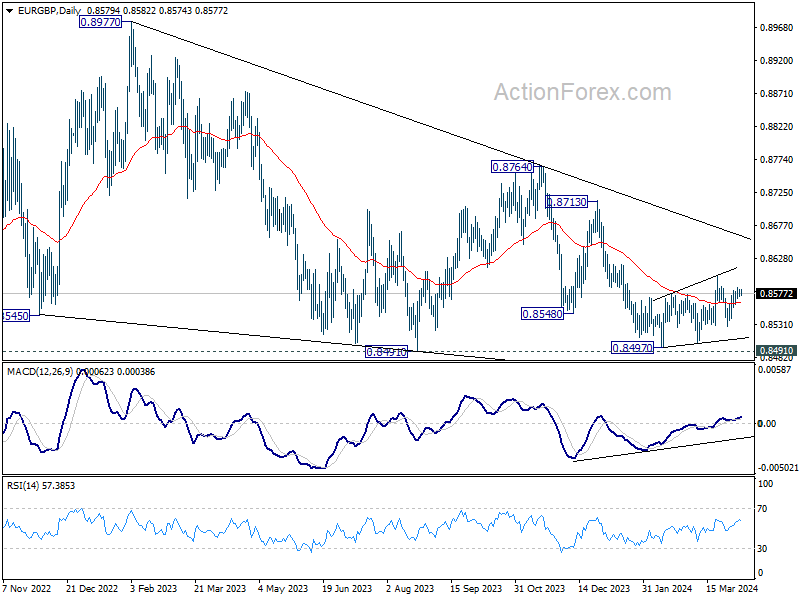
Range trading continues in EUR/GBP and intraday bias stays neutral. On the downside, firm break of 0.8529 support will argue that the corrective recovery from 0.8497 has completed at 0.8601. Intraday bias will be back on the downside for retesting 0.8497 low next. On the upside, break of 0.8601 will resume the rebound instead.
In the bigger picture, there is no clear sign that down trend from 0.9267 has completed, despite loss of downside momentum as seen in D MACD. As long as 0.8713 resistance holds, the down trend will remain in favor to resume through 0.8491 low at la later stage.
EUR/AUD Daily Outlook
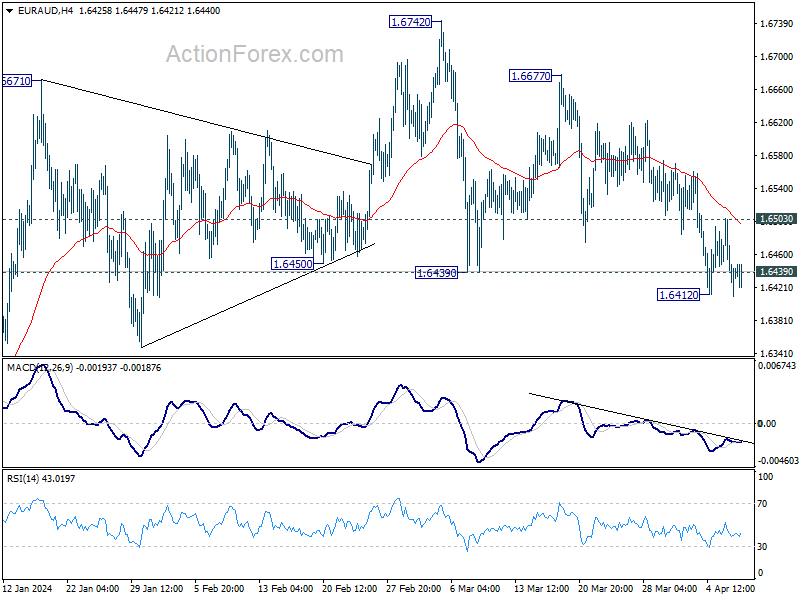
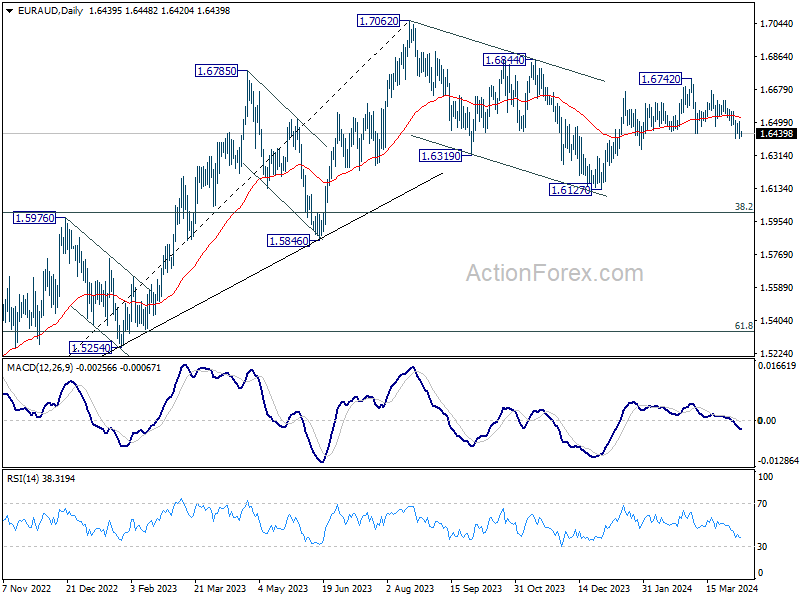
Daily Pivots: (S1) 1.6398; (P) 1.6456; (R1) 1.6500; More..
Intraday bias in EUR/AUD remains neutral first. On the downside, break of 1.6412 and sustained trading below 1.6439 support will argue that whole rebound from 1.6127 has completed, and turn near term outlook bearish for this support again. Nevertheless, strong rebound from current level, followed by break of 1.6503 minor resistance, will turn bias back to the upside for retesting 1.6742.
In the bigger picture, fall from 1.7062 medium term top is seen as a correction to the up trend from 1.4281 (2022 low). Break of 1.6844 resistance will argue that this up trend is ready to resume through 1.7062 high. In case of another fall, strong support should be seen around 1.5846 and 38.2% retracement of 1.4281 to 1.7062 at 1.6000 to bring rebound.
EUR/CHF Daily Outlook
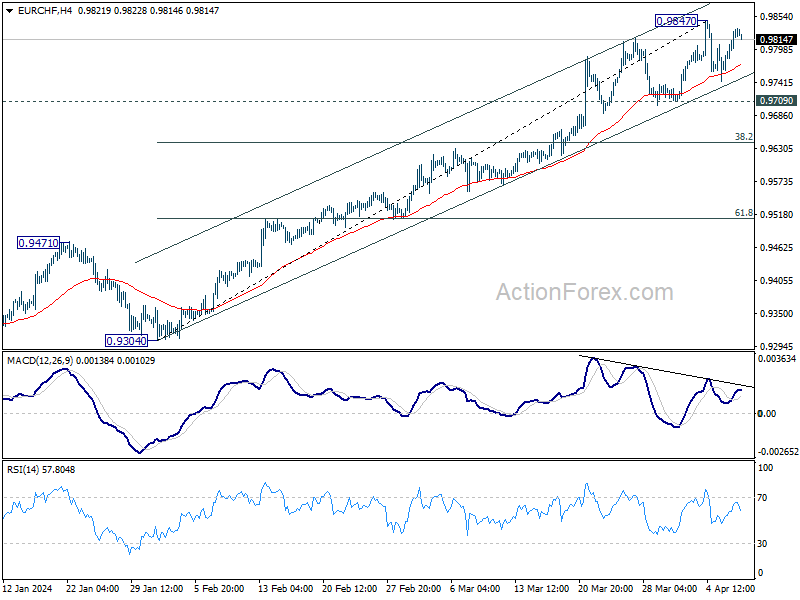
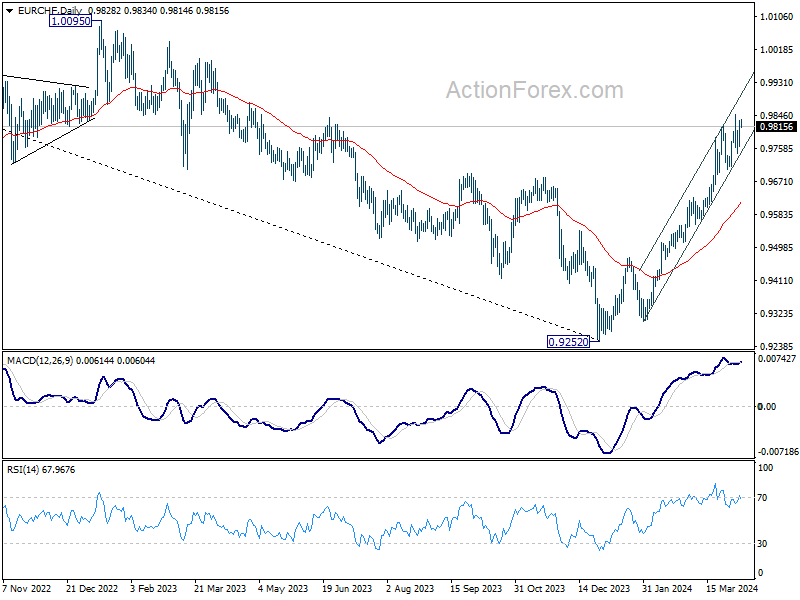
Daily Pivots: (S1) 0.9784; (P) 0.9810; (R1) 0.9858; More...
Range trading continues in EUR/CHF and intraday bias stays neutral. Near term outlook will stay bullish as long as 0.9709 support holds. However, considering bearish divergence condition in 4H MACD, break of 0.9709 will confirm short term topping, and turn bias back to the downside for deeper pullback.
In the bigger picture, a medium term bottom should be in place at 0.9252 already, on bullish convergence condition in W MACD. Rise from there would now target 38.2% retracement of 1.2004 (2018 high) to 0.9252 (2023 low) at 1.0303, even as a correction to the down trend from 1.2004. This will remain the favored case as long as 55 D EMA (now at 0.9603) holds.
Japanese Government and BoJ Officials Hit the Wires on a Near-Daily Basis
Markets
US yields powered through yesterday with new year-to-date highs for all maturities in the 2y-10y range. The post-payrolls gains increased between 1.8 and 4.1 bps with the front end of the curve underperforming. Tenors from the 5y on did ease from intraday highs when US dealings were running warm, eventually resulting in the typical inversion you’d expect when the Fed is being forced to keep rates high for a while longer. Today’s kick-off to the US mid-month refinancing operation with a $58 bn 3-year auction could trigger more of the same ahead of the widely anticipated US March CPI on Wednesday. Tomorrow and Thursday has a $39 bn 10-y and $22bn 30-y sale scheduled. German Bunds underperformed with yields rising 1.6 (30y) to 5.2 bps (2y). They had some catching up to do with the US. Domestically, German industrial production rose for a second month straight. That didn’t happen for a year, suggesting Europe’s largest economy may have seen the worst. Interest rate differentials developing in favour of the euro combined with a mild risk sentiment (European stocks +0.6%) helped EUR/USD to rebound from as low as 1.0821 towards 1.086. The combination isn’t going anywhere this morning. We don’t expect that to improve later today given the vast emptiness on the economic calendar. The typical risk-off currencies bit the dust. USD/JPY hit an intraday high of 151.94, less than an inch away from critical resistance at 151.95. Japanese government and BoJ officials hit the wires on a near-daily basis, this morning included, with verbal warnings against excessive yen moves. Central bank governor Ueda reiterated the need for supportive monetary policy with the price trend being still below 2%. It’s necessary now to check how wage growth evolves in the hard data after the spring talks (which resulted into a 5.24% negotiated wage increase). EUR/CHF surged from 0.976 to 0.983 for a first, decisive close north of 0.98 since mid-2023. The Swedish krona outperformed G10 peers yesterday. Riksbank officials increasingly pay attention to the currency risk of a delayed Fed (and ECB) cutting cycle. It may mean that the earlier flagged May cut could be either too soon or shouldn’t be seen as the beginning of a rapid easing cycle, or perhaps both. EUR/SEK hit an intraday low of 11.43 from an open at 11.53 before paring losses to 11.47. The pair did close below the 200dMA though. The likes of the Aussie dollar profited from sharply rising copper and iron prices and continue to do so this morning. Brent oil only temporarily dropped below the $90/b level after reports that Israeli forces would leave southern Gaza. It is currently trading back at $90.54 with the market still being extremely tight.
News & Views
One-year ahead consumer inflation expectations in the NY Fed survey remained unchanged at 3.0% for the third consecutive month. In contrast, three-year ahead inflation expectations increased to 2.9% from 2.7% whereas the five-year ahead measures decreased to 2.6% from 2.9%. Median home price growth expectations were unchanged for the sixth consecutive month at 3.0%. The series remained within a narrow range of 2.8% to 3.1% since June 2023. With respect to other economic variables monitored in the survey, the perceived probability of losing one’s job in the next 12 months increased by 1.2 percentage points to 15.7%, the highest reading since September 2020. However, the probability of leaving one’s job voluntarily increased by 1.1 percentage points to 20.6%. Medium expected household income growth was unchanged at 3.1% while household spending growth was seen easing 0.2% to 5.0%. Perceptions of credit access compared to a year ago improved slightly. The average perceived probability of missing a minimum debt payment over the next three months rose by 1.5 percentage points to 12.9%, the highest since the start of the pandemic.
The British Retail Consortium retail sales growth monitor showed a 3.2% Y/Y increase in March on a like-for-like basis, up from 1% in February and beating 1.8% consensus. It was the fastest Y/Y-pace since August. Retail spending figures are not seasonally adjusted. The improvement was largely driven by Easter falling unusually early (March 31) and the subsequent uplift to food sales in the week preceding the long weekend. Food sales were up 6.4% Y/Y in the 3 months to March whereas non-food sales were down 2.9% Y/Y over that same reference period.