

Sample Category Title
RBNZ’s Orr: Restrictive policy to stay, expects normalization next year
RBNZ Governor Adrian Orr affirmed today that the economy is "evolving as anticipated", with inflation expectations declined. However, he reiterated inflation "is still too high".
The governor emphasized the necessity of maintaining a restrictive monetary policy stance "for some time." He added that he expects to "begin normalizing policy in 2025."
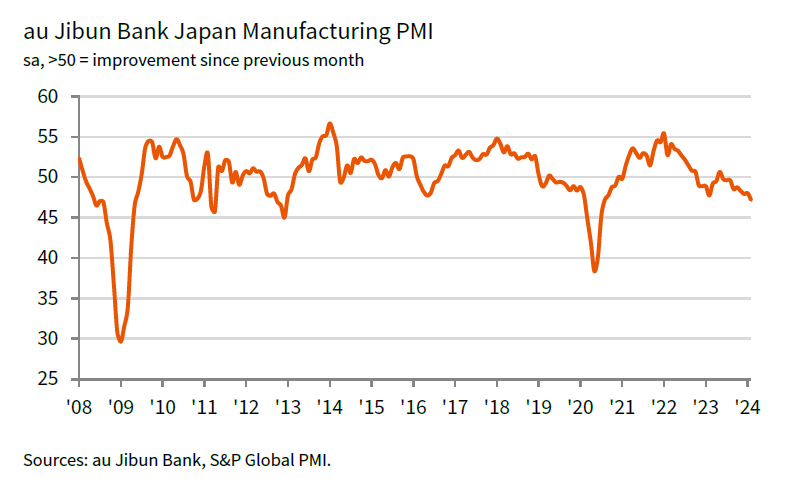
Japan’s PMI manufacturing finalized at 47.2, worst since Aug 2020
Japan's PMI Manufacturing was finalized at 47.2 in February, down from January's 48.0. This marks the ninth consecutive month of contraction, presenting the most significant downturn since August 2020.
According to S&P Global, the decline was characterized by sharper falls in both output and new orders. Additionally, the sector experienced the most substantial decline in employment seen in over three years, indicating that the downturn is having a tangible impact on workforce. Furthermore, rate of increase in output prices slowed to the lowest level since June 2011, suggesting that price pressures are easing amid weakened demand.
USD/JPY Retreats Lower As Dollar Bulls Take Back Seat
Key Highlights
- USD/JPY failed to clear the 150.85 resistance zone.
- It traded below a connecting bullish trend line with support at 150.30 on the 4-hour chart.
- Gold prices are moving higher above the $2,035 resistance.
- The US ISM Manufacturing Index could increase from 49.1 to 49.5 in Feb 2024.
USD/JPY Technical Analysis
The US Dollar remained well-bid above the 148.50 level against the Japanese Yen. USD/JPY climbed above 150.00 but struggled to continue higher above 150.85.
Looking at the 4-hour chart, the pair formed a high at 150.88 before there was a bearish reaction. The pair declined below the 150.25 support. It also traded below a connecting bullish trend line with support at 150.30.
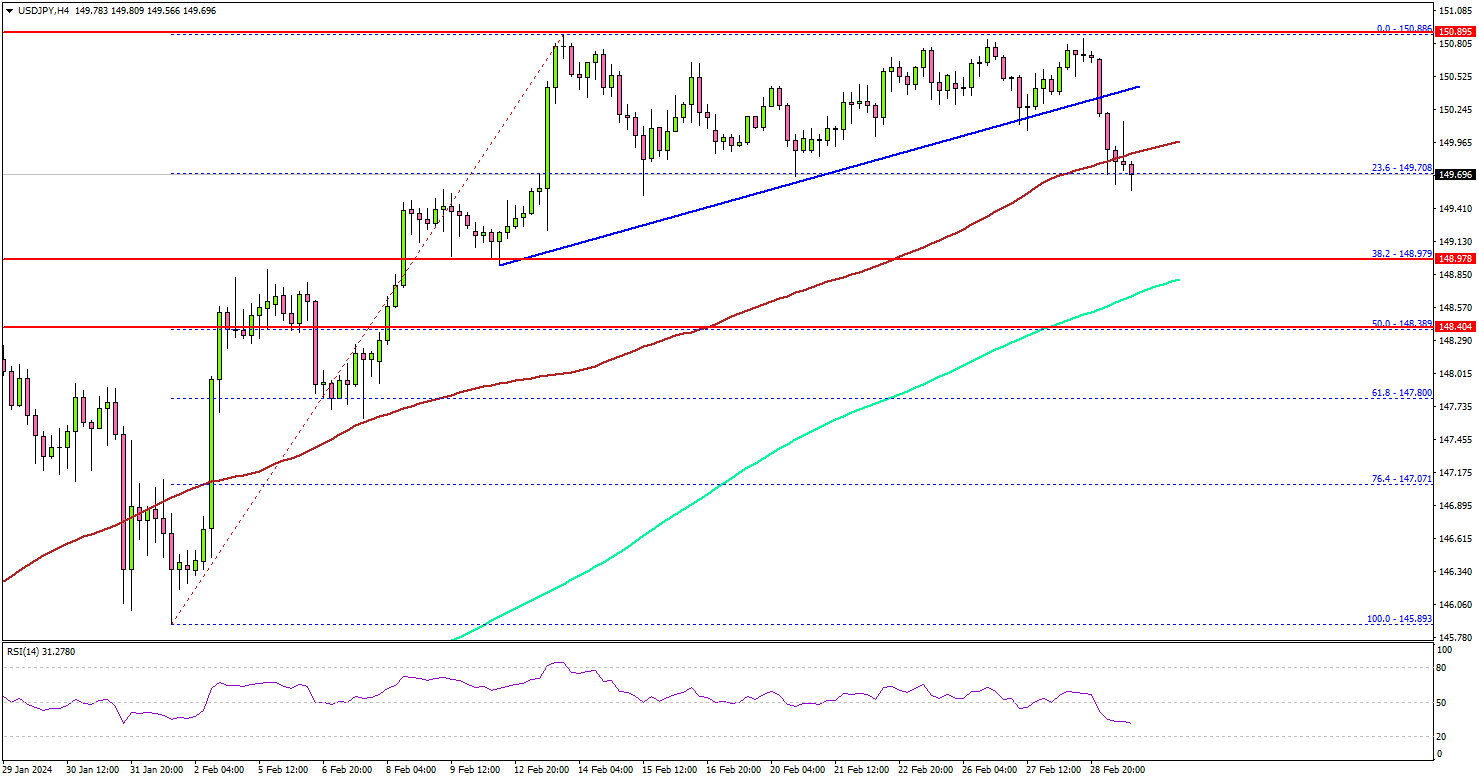
The pair spiked below the 100 simple moving average (red, 4-hour) and the 23.6% Fib retracement level of the upward move from the 145.89 swing low to the 150.88 high.
Immediate support is near the 149.50 level. The next major support is at 148.80 or the 200 simple moving average (green, 4-hour). If there is a downside break below the 148.80 support, the pair could decline toward the 50% Fib retracement level of the upward move from the 145.89 swing low to the 150.88 high.
Any more gains might send USD/JPY toward 147.00. On the upside, the pair is facing resistance near the 150.25 level. The main resistance is near 150.85. A close above the 150.85 zone could open the doors for more upsides. The next stop for the bulls might be 152.00.
Looking at Gold, there was a decent increase above the $2,035 resistance and the bulls might aim for a move toward $2,065.
Economic Releases
- Euro Zone Manufacturing PMI for Feb 2024 – Forecast 46.1, versus 46.1 previous.
- UK Manufacturing PMI for Feb 2024 – Forecast 47.1, versus 47.1 previous.
- US Manufacturing PMI for Feb 2024 – Forecast 51.5, versus 51.5 previous.
- US ISM Manufacturing Index for Feb 2024 – Forecast 49.5, versus 49.1 previous.
BoJ’s Ueda stays cautious on achieving sustainable inflation
BoJ Governor Kazuo Ueda reiterated that Japan has not yet achieved sustainable 2% inflation. "I don't think we are there yet," he said after G20 finance ministers' meeting.
A significant focus for BoJ in the near term will be the outcome of upcoming annual wage negotiations between companies and unions. Ueda pointed out the importance of these negotiations in determining the potential for a positive wage-inflation cycle in Japan.
"We need to confirm whether a positive wage-inflation cycle would kick off and strengthen," he noted, acknowledging the rising demands from unions for pay increases exceeding last year's and the apparent willingness among many firms to comply.
However, Ueda also stressed the need for a comprehensive review of the collective results of these wage negotiations, alongside other economic data, to gauge whether wages and inflation will sustainably rise in tandem.
Fed’s Williams sees rate cut this year, stresses lack of urgency
New York Fed President John William reiterated that he expected rate cuts to start this year, but emphasized there is "no sense of urgency to do that".
"I think that makes sense with inflation coming down, the economy being in better balance, that we're going to move interest rates back to more normal levels," he said at an event overnight.
Williams noted that monetary policy is "in good place", and the focus now is to gain confidence that inflation is on track to 2% target.
Fed’s Mester: Inflation fight continues, yet three rate cuts still expected in 2024
Cleveland Fed President Loretta Mester remains steadfast in her view that inflation is on track to Fed's target, despite a month-over-month jump in the preferred inflation gauge.
Nevertheless, "it does show you there is a little more work for the Fed to do," Mester said in a Yahoo Finance interview overnight.
Mester reiterated her December forecast of three rate cuts in 2024, suggesting that this remains a plausible scenario if the economy progresses as she expects. "Right now that feels about right to me if the economy evolves as I anticipate it will," she stated.
Fed’s Daly sees greenshoots yet rate cuts await clearer signals
San Francisco Fed President Mary Daly highlighted the shift towards a more data-dependent approach, a move away from extensive forward guidance. She underscored the importance of being "methodical" in decision-making, emphasizing Fed's intention to "hold on just right" without being locked into predefined commitments.
In a Bloomberg TV interview overnight, Daly articulated the need for "a collage of evidence" to confirm a sustainable downward trend in inflation, relying not just on published economic statistics but also on insights from business contacts. Although she acknowledged the emergence of positive signs, or "green shoots," in the economy, she cautioned, "we're not there yet," indicating that more evidence is needed to confirm that inflation is on a consistent decline.
Furthermore, Daly discussed the implications of adjusting the nominal interest rate as inflation begins to ease. She argued for the necessity of reducing interest rates in a timely manner to prevent overly tightening monetary policy that could inadvertently trigger an economic downturn.
Fed’s Goolsbee optimistic about US economy’s golden path in 2024
Chicago Fed President Austan Goolsbee, at an even overnight, highlighted the scope for the US economy to maintain what he terms the "golden path," a scenario where inflation falls in conjunction with sustained labor market strength and economic growth. This balance, he notes, is historically rare but remains a viable outcome for the current year.
Goolsbee's confidence stems from anticipated improvements in supply chain efficiency and labor supply impacts, which he believes will bolster this optimistic economic scenario.
"I still feel like there is supply benefit coming through the system on both the supply chain, and the impact of labor supply," Goolsbee remarked.
Ripples and Waves
Ripple effects from the pandemic are not over and underlying trends are not fixed. It would be a mistake to assume otherwise.
Whenever one reads commentary about what policymakers should do, rather than what they will do, one should always consider the author’s unstated assumptions. Two such assumptions seem especially pervasive currently.
The first is the belief that pandemic-related effects have already washed through and are no longer affecting outcomes. Increased working from home is usually acknowledged as an exception.
The second assumption is that the post-pandemic economy will fluctuate around the same average levels of key metrics as prevailed before the pandemic.
Neither can be assumed. The first is demonstrably false and the second cannot be justified by the evidence.
Statements that rest on these unstated assumptions include the idea that most of Australia’s current high inflation is demand driven. According to this view, monetary policy is still not tight enough and unemployment is too low. Yet the ripple effects of supply constraints unwinding are still evident. Attributing all, or even most, of the current high inflation to strong demand ignores this.
It also ignores the signs that growth in domestic demand was soft in the second half of 2023, particularly in the household sector. As Westpac Economics Senior Economists Andrew Hanlan and Jarek Kowcza flagged this week and the Treasurer has also indicated, we expect the December quarter GDP result to be soft – most likely flat in the quarter. The momentum in domestic demand is only barely positive.
Domestically, these ripple effects include the surge in population early last year, as Australia and China reopened borders. Because so much migration to Australia is by students, population flows are seasonal, spiking at the start of each university semester. This makes it hard to know the underlying trend in real time. We will only see this post-pandemic effect unwinding in the data over the course of this year. Rent inflation should ease in line with this, but it will take a while.
Related to this, the decline in average household size in Australia’s largest cities is also yet to unwind fully. Some of the decline was probably a response to lower rents during the height of the pandemic, as well as lockdowns and a desire for more living space when other options were curtailed. Some, however, could be a more lasting response to increased working from home. Because it is more pleasant to spread out than to crowd back in again, the reversal of the temporary part of the response is likely to be more drawn out than the original shift.
Together with the population surge, smaller households mean upward pressure on rents and housing prices for at least a while yet. But we can be confident that at least some of that pressure will unwind over time, regardless of what policy does. Historical norms are therefore not yet the right benchmark to use when assessing the current stance of policy.
The lingering ripple effects of the pandemic are not limited to the demand for housing. The supply side of this sector is also still constrained. The result is a backlog of partly built homes that is being worked down only slowly. The pandemic-era HomeBuilder program contributed to this by bringing forward some demand. Supply capacity in the industry is also constricted. This is partly because non-residential construction activity is competing for many of the same resources. In addition, bankruptcies and other exits from the industry have disrupted the networks of suppliers and subcontractors. These networks take a while to stitch themselves back together. In this way, temporary shocks can have lingering effects.
Pandemic ripple effects go beyond the housing market. Supply chains may have largely healed globally, but in some areas domestically things are still far from normal. For example, industry sources suggest that wait times for delivery of some makes of car are still well above pre-pandemic levels. Multiple disruptions at domestic ports have also degraded supply chain functioning.
The faults in our stars
Even once the ripple effects from the pandemic have faded completely, there is no guarantee that economic behaviour reverts to previous norms. Past experience is not worthless, but it would be a mistake to assume a static world where key economic metrics and relationships never change. Identifying shifts in these relationships – especially changes in trends – is one of the key challenges of forecasting.
Some of these trend shifts are more or less permanent, such as the invention and adoption of new technologies, the adoption of inflation targets at low rates, or financial deregulation. Step changes in one factor can also instigate ‘waves’: drawn-out responses in other factors. The step change to low inflation targets and financial deregulation induced a permanent increase in the sustainable ratio of household debt to income in Australia and other industrialised economies. This transition to higher actual debt took more than a decade to complete. The green transition will likewise induce a wave of investment for years.
Integration with the European Union induced rapid increases in income in Ireland and Spain, and so a wave of home-building to replace existing housing stock with higher-quality homes more suitable to current income levels. China is coming to the end of a similar secular ‘wave’ of high demand for new construction, in addition to the authorities’ policy actions to slow this sector. I have never seen that transition to a smaller construction sector end well, but perhaps the Chinese authorities can ensure theirs is the exception.
And some trends are a continuous evolution not a one-off shift. One example of this kind of wave is the increase in longevity, which has no obvious end point although it could revert under certain conditions.
So it is with the structure of interest rates and the feasible level of unemployment. These are not external factors handed down from the heavens: they are outcomes of the system. They evolve continuously.
There are reasons to believe that the structure of real and nominal interest rates will be a bit higher in the period ahead than it was in the years leading up to the pandemic. Shifting fiscal policy stances matter here, along with risk appetite (in part influenced by regulation) and technological change.
There are also reasons to believe that periods of low unemployment drag the feasible rate of unemployment down, as both new workers and employers gain experience in working with each other during tight labour markets. The RBA seems to understand this, even though the standard models they use are not well-placed to capture this particular dynamic.
The key point here is that these underlying trends – the ‘star’ variables – are not fixed. Both policymakers and policy-watchers would do well to continually test their views about these factors against the broadest possible range of data. Forecasters who do not allow for these potential changes risk being blindsided by them.
US100: Has the Correction Ended?
Bullish Scenario: Buys above 17910 with TP:18098.07, TP2:18277, and TP3: 18415 with S.L. below 17890 or at least 1% of account capital*. Apply trailing stop.
Bearish Scenario: Sells below 17850 with TP1:17730, TP2: 17700 with S.L. above 17900 or at least 1% of account capital*.
Analysis from the daily chart: volume Profile and Structure.
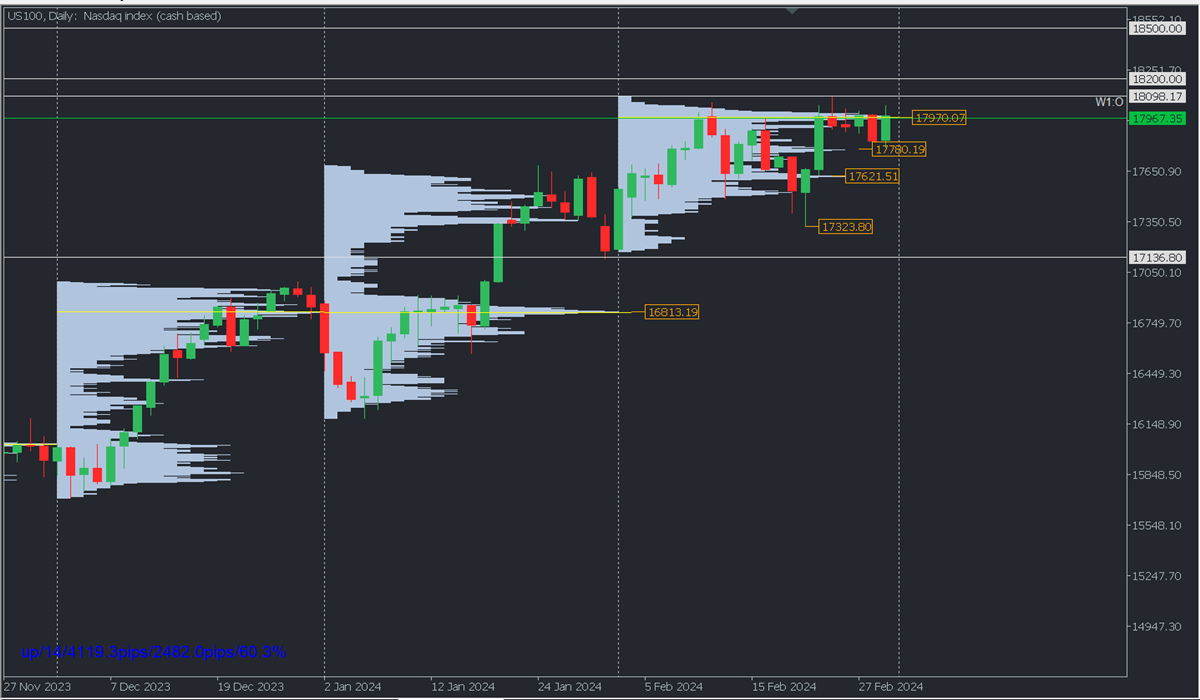
At the close of February, the index set a new all-time high at 18098.17 and a monthly volume profile with an uncovered POC* at the top around 17970.07, implying that as long as prices remain below that volume concentration, sales are expected with targets at nearby high volume nodes like 17780.19, from where it rebounded today, with a possible bullish renewal.
However, if the price falls below 17900, it is possible to consider the renewal of sales towards the next high volume node of the month at 17621.51, noting that as long as the last relevant macro support at 17322.94 is not broken, the index will continue in an uptrend, seeking to renew the ascent from one of the indicated points to create new all-time highs in March.
On the other hand, the anticipated surpassing of February's POC at 17971.89 will confirm the market's intention to extend the trend with 18200 as a short-term target and 18500 to be reached in March.
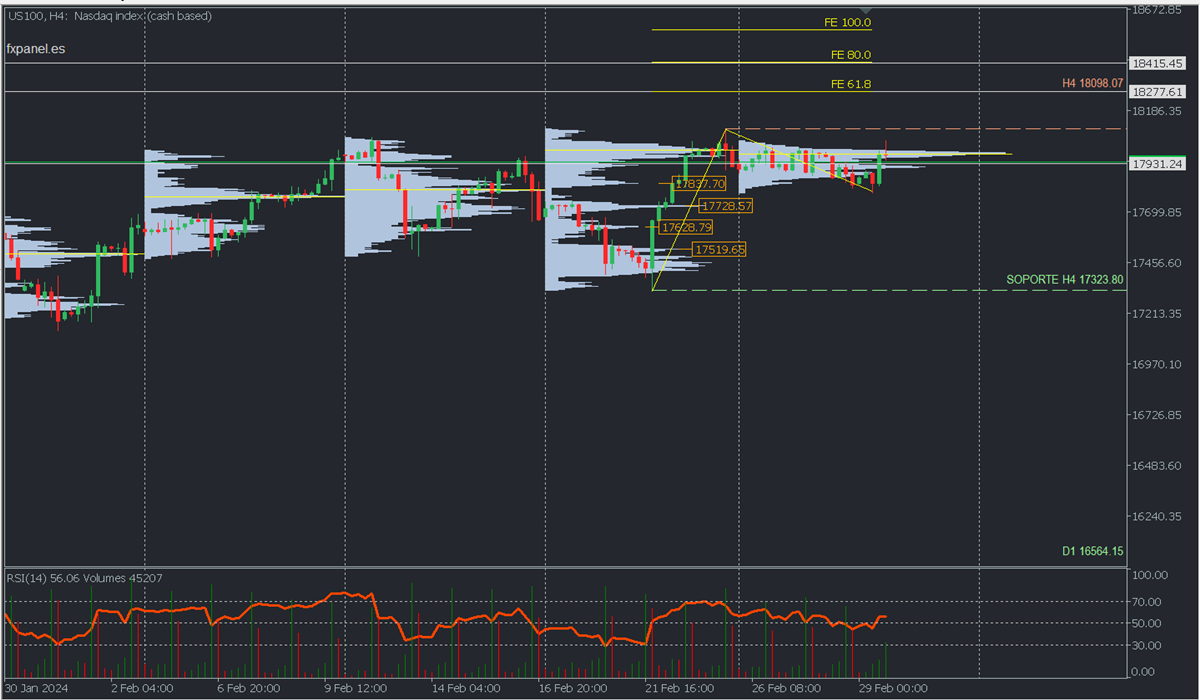
Scenario from H4 chart:
Observe on the chart the high volume buyer nodes from last week, which are objective levels in case prices fall again below 17850. The bulls will defend these high-volume nodes to provoke new price rebounds to break the current all-time high and seek Fibonacci extensions of 61.8 at 18277, and 80% at 18415.45. Generally, a second touch to each zone tends to break it, causing the descent towards the next high-volume node or buying zone.
*Uncovered POC: POC = Point of Control: It is the level or zone where the highest volume concentration occurred. If there was a bearish movement from it previously, it is considered a selling zone and forms a resistance zone. Conversely, if there was a bullish impulse previously, it is considered a buying zone, usually located at lows, thus forming support zones.
**Consider this risk management suggestion:
It is essential that risk management be based on capital and traded volume. Therefore, a maximum risk of 1% of the capital is recommended. It is suggested to use risk management indicators such as Easy Order.