Sample Category Title
Fed Minutes Confirm that FOMC Will Take a Cautious Approach to Rate Cuts
The minutes from the January 30-31, 2024 Federal Open Market Committee (FOMC) highlight that the Fed has not declared victory in its fight against inflation, and that curtailing price pressures remains the current focus for the Fed.
On the current economic backdrop, Committee members noted that "recent indicators suggested that economic activity had been expanding at a solid pace. Real GDP growth in the fourth quarter of last year came in above 3 percent at an annual rate, below the strong growth posted in the third quarter but still above most forecasters’ expectations."
When discussing the appropriate policy actions, "all participants judged it appropriate to maintain the target range for the federal funds rate at 5¼ to 5½ percent at this meeting." This was supported by the progress made on inflation and that the labor market had continued to come into better balance.
On the future path of policy, Committee members viewed " that the policy rate was likely at its peak for this tightening cycle." Additionally, FOMC members stated that it is unlikely to reduce the target rate until they gained "greater confidence" that inflation is on a sustainable path to its target.
When discussing the risks to achieving their dual mandate, FOMC members stated that "the risks to achieving the Committee’s employment and inflation goals were moving into better balance, they remained highly attentive to inflation risks." Additionally, "most" participants noted the risks of moving prematurely, while a "couple" pointed to the risks of leaving rates in a restrictive position for too long.
Key Implications
With rate cuts highly expected in 2024, the timing and pace of cuts has become the focus of financial markets. Today's minutes reiterated that the Fed will take a patient approach to easing policy stating "they did not expect it would be appropriate to reduce the target range for the federal funds rate until they had gained greater confidence that inflation was moving sustainably toward 2 percent". This has been echoed by Chair Powell and several FOMC speakers. The cautious rhetoric can be seen in financial markets with the U.S. 2-year treasury yield adding close to 40 basis points since the beginning of February.
Since the January FOMC meeting, employment and inflation data have both surprised to the upside underscoring the need for the Fed to take a prudent approach to easing policy as the path to price stability will likely be uneven. This has also been reflected in financial markets, which have pared back their expectations for rate cuts in 2024. While economic resilience was the theme for the U.S. economy in 2023, we expect a modest slowdown in economic growth in 2024, setting the stage for the Fed to begin easing policy in the second half of the year.
S&P 500 (US500): Consolidates in Buying Zone. Watch for a Surge Towards 5000 Intraday
Bullish Scenario: Buying above 4980 with TP1: 4993, TP2: 5005, and TP3: 5014 (Intraday levels). TP (Swing Trading): 5031.90, 5045.66, and 5054. It is recommended to set a stop loss (S.L.) below 4965 or at least 1% of the account capital**.
Bearish Scenario: Selling below 4960 with TP1: 4935, TP2: 0.6487, and TP3: 4924 (Intraday levels). TP (Swing Trading): 4910 and 4865. It is recommended to place a stop loss above 4975, at least 1% of the account capital**. A trailing stop can be used.
The high valuation of indices has been driven since the last quarter of the year by expectations that the Fed would cut rates early in the first quarter of 2024. Subsequently, with the start of the fourth-quarter earnings season of 2023, the optimism and momentum of technology companies have almost exclusively led the rally to new historic highs. Today, Nvidia, the last of the high-cap technology companies, publishes results with very high expectations that could either renew the indices' momentum to continue the bullish phase or, conversely, extend corrections in the event of results below market expectations. In this analysis, we address possible scenarios from the perspective of liquidity with volume profile and price action.
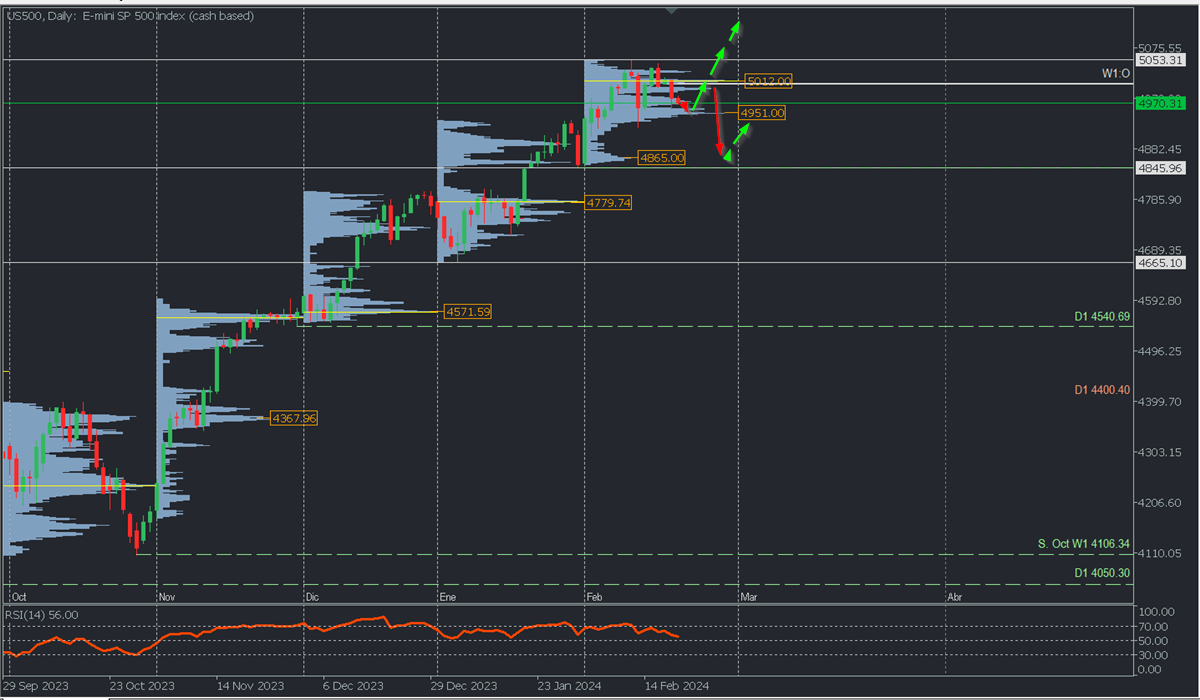
Analysis from the daily chart. Volume Profile and Structure.
The US500 continues in an uptrend, leaving the last resistance and historical high at 5053.31 on February 12th, trading below a high volume concentration zone or POC* around 5012, which coincides with the week's opening. The high volume node around 4951 represents a support from where bulls could trigger a new price rally seeking to break the macro selling zone around 5012 and thereby possibly breaking the resistance at 5053.31 to extend purchases towards the new psychological level at 5100.
On the other hand, a decisive breakthrough below 4951/50 will pave the way for a more extensive correction towards 4865, the origin buying zone of the February rally. The last support of the uptrend is located at 4844.60.
Scenario from the H2 chart:
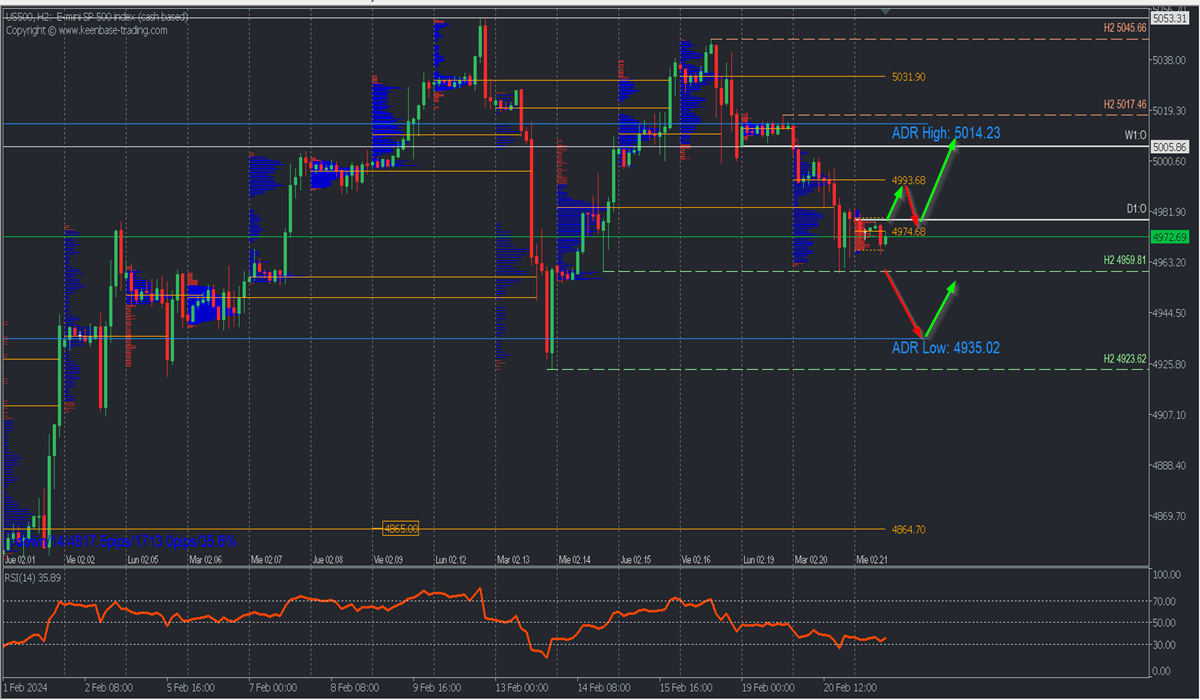
The bearish correction reached support at 4959.81 with a moderate bullish reaction that could extend if quotes decisively surpass the POC of the first sessions of the day at 4974.68 and of course the day's opening, paving the way for more purchases with the target at yesterday's uncovered POC* at 4993.68, a selling zone that on initial touch may provoke a retreat as previously positioned bears defend it.
However, after a second touch, a decisive breakthrough is likely to occur, taking quotes towards the week's opening at 5005.86 and the daily bullish average range at 5014.23, a scenario that will remain valid as long as quotes do not break the support at 4959.81, in which case we will see the extension of the bearish correction at least towards the bearish average range at 4935.02. The RSI in negative territory could bounce from oversold to the midpoint, confirming not only the bearish momentum but also its temporary exhaustion.
*Uncovered POC: POC = Point of Control: It is the level or zone where the highest volume concentration occurred. If there was a bearish movement from it previously, it is considered a selling zone and forms a resistance zone. On the contrary, if there was a bullish impulse previously, it is considered a buying zone, usually located at lows, forming support zones.
**Consider this risk management suggestion
**It is imperative that risk management is based on capital and traded volume. For this, a maximum risk of 1% of capital is recommended. It is suggested to use risk management indicators such as the Easy Order.
AUDUSD Challenges 200-day SMA
- AUDUSD rebounds from its lowest level since November
- Price jumps above descending trendline to test 200-day SMA
- Momentum indicators improve but remain in negative zones
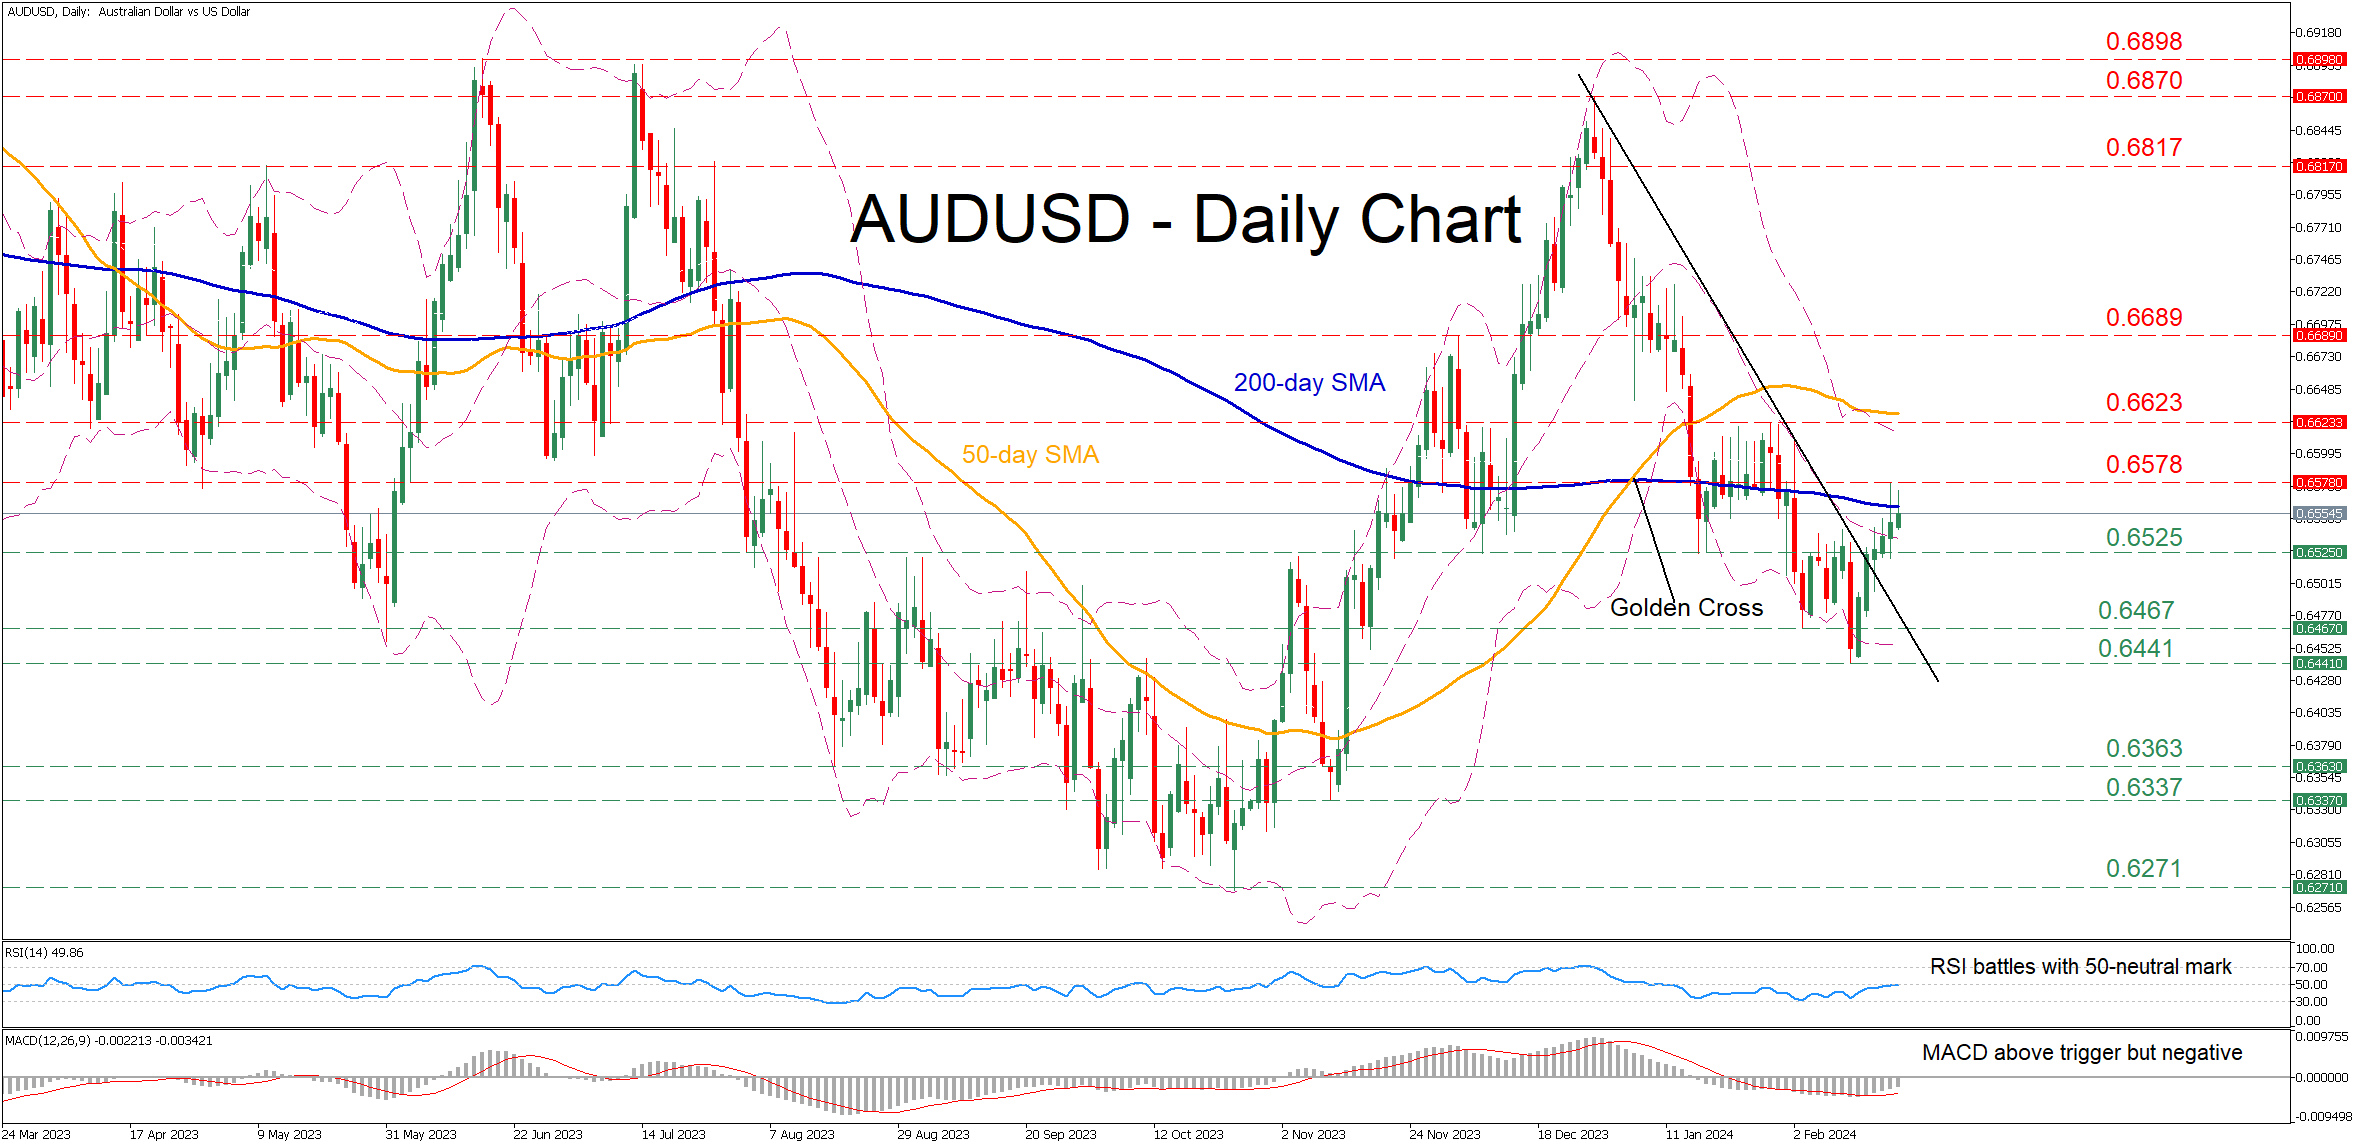
AUDUSD had been in a constant decline after peaking at 0.6870 in December, breaking below both its 50- and 200-day simple moving averages (SMAs). Nevertheless, the pair managed to find its feet and rotate back above its descending trendline, currently attempting to claim the crucial 200-day SMA.
Should the price break above the 200-day SMA, the recent resistance of 0.6578 could prove to be the first barrier for the bulls to clear. Further advances could then cease at the January resistance of 0.6623 ahead of the 0.6689 hurdle. Surpassing that region, the pair might challenge the May peak of 0.6817.
On the flipside, if the pair reverses back lower, initial support could be found at 0.6525, which held strong both in December and January. A violation of that region could open the door for 0.6467 before the 2024 bottom of 0.6441 comes under examination. Sliding beneath that floor, the pair may descend towards the August low of 0.6363.
Overall, AUDUSD has regained traction following its bounce off the 2024 low of 0.6441. However, a break above the 200-day SMA is needed for the bulls to regain confidence for a full-scale reversal.
NZDJPY Hits Nine-Year High as Bullish Run Continues
- NZDJPY extends bullish streak above 92.00 level
- Bulls remain firmly in control
- Overbought signals begin to flash red
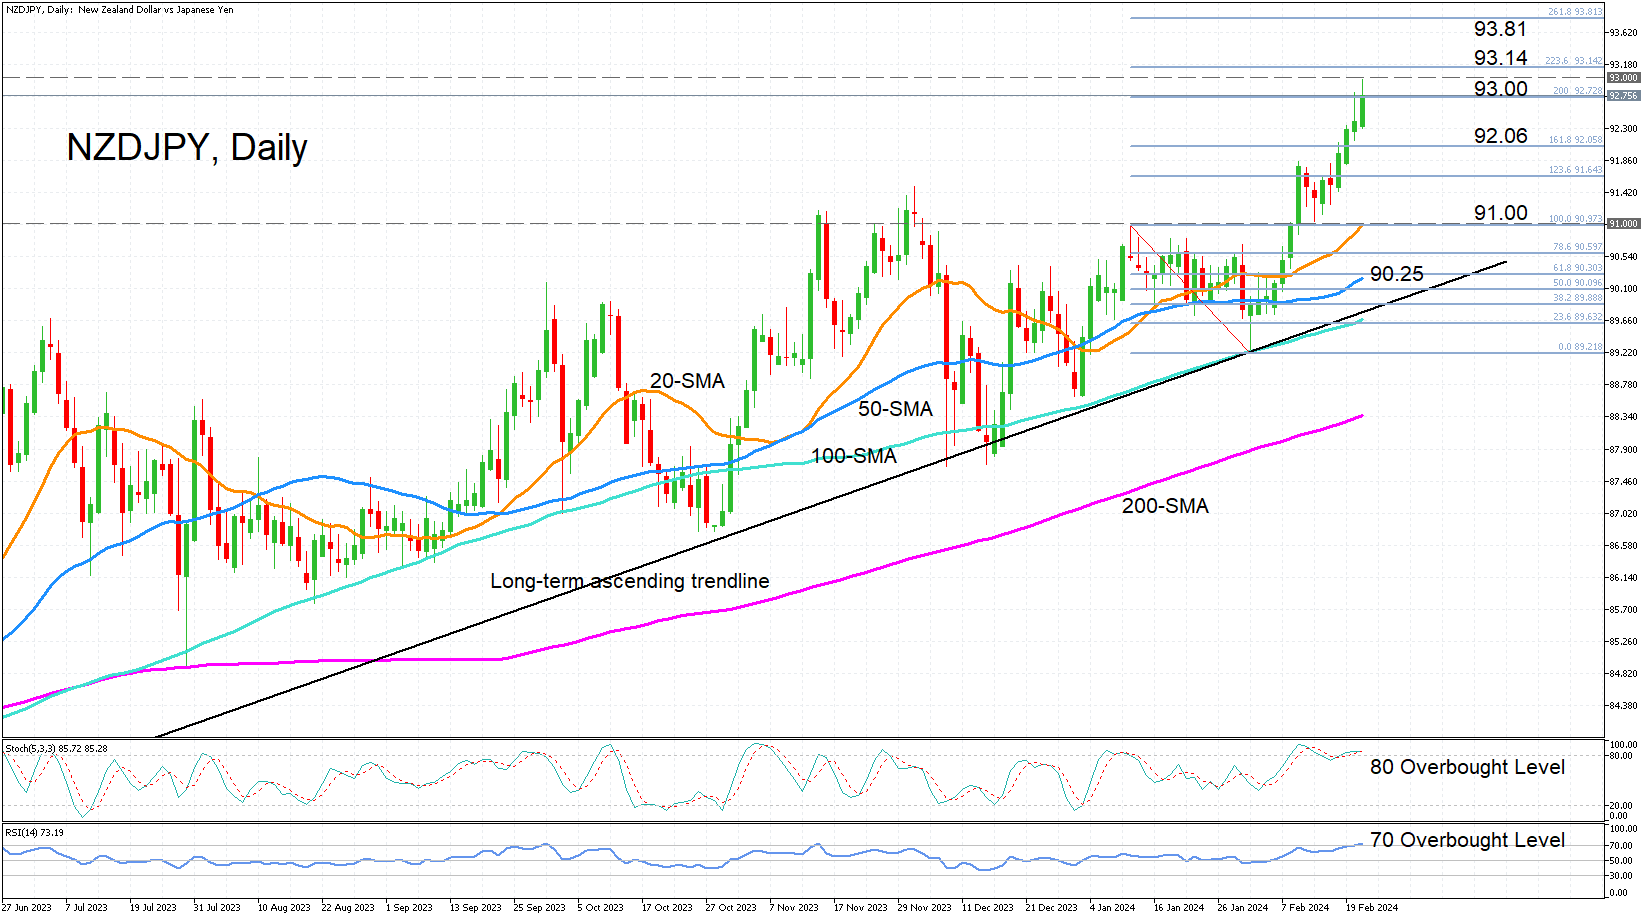
NZDJPY has been recording fresh highs all week and scaled a nine-year high of 92.98 earlier on Wednesday. The momentum indicators suggest that the bullish bias isn’t likely to fade in the near term. However, both the RSI and the stochastics have entered overbought territory, pointing to increased risk of a downside correction.
If the pair makes a renewed push towards the 93.00 handle, there could be stiff resistance until the 93.14 mark, which is the 223.6% Fibonacci extension of the January downleg. Successfully clearing this area would turn the focus to the 261.8% Fibonacci extension of 93.81.
However, if the rally runs out of steam and the price heads south, there’s likely to be some support around the 161.8% Fibonacci of 92.06. A slip below it could accelerate the decline, dragging the pair towards the 20-day simple moving average (SMA) just below the 91.00 level. Further down, the 50-day SMA might try to stem the losses at 90.25 before the long-term ascending trend line is tested.
In a nutshell, a drop below the 20- and 50-SMAs would shift the short-term picture to negative but as long as the price holds above the uptrend line, the bullish outlook in the long term should stay intact.
CHFJPY Wave Analysis
- CHFJPY reversed from support level 169.65
- Likely to rise to resistance level 171.45
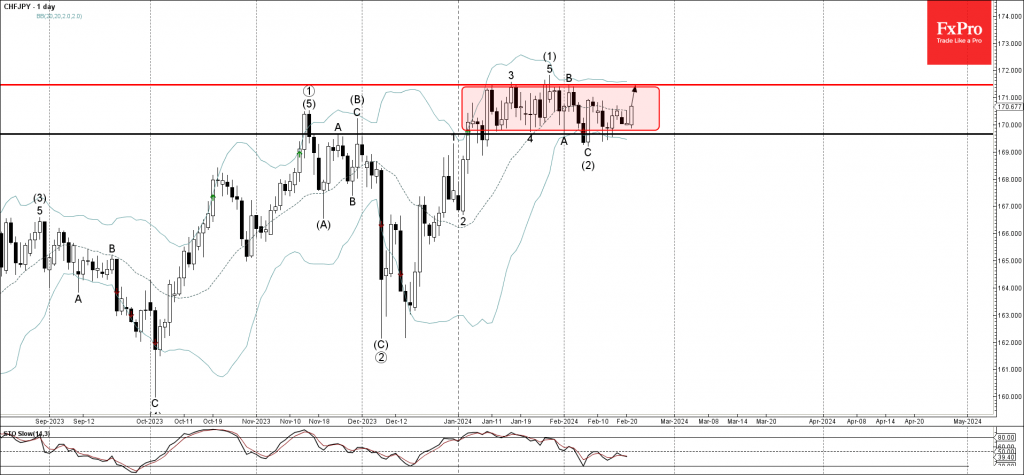
CHFJPY currency pair recently reversed up from the key support level 169.65 (lower boundary of the narrow sideways price range inside which the pair has been trading from the start of January).
The support level 169.65 was strengthened by the lower daily Bollinger Band.
Given the clear daily uptrend and the continued yen sales, CHFJPY currency pair can be expected to rise further to the next resistance level 171.45, upper border of this price range.
S&P 500 Wave Analysis
- S&P 500 reversed from resistance level 5035.00
- Likely to fall to support level 4920.00
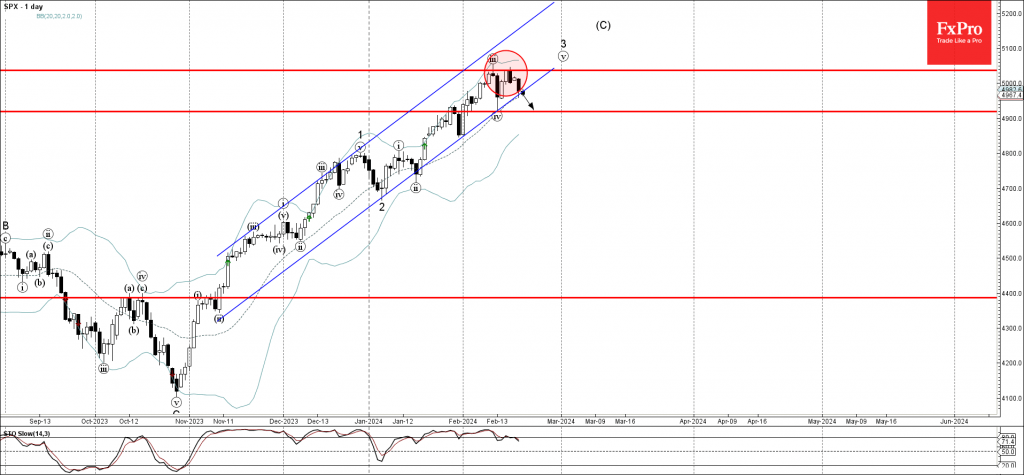
S&P 500 index recently reversed down from the pivotal resistance level 5035.00 (which stopped the previous minor impulse wave iii at the start of this month).
The downward reversal from the resistance level 5035.00 created the daily Japanese candlesticks reversal pattern Bearish Engulfing, which was preceded by the daily Evening Star near this price level.
Having just broken the sharp daily up channel from November, S&P 500 index can be expected to fall further to the next support level 4920.00 (low of the previous wave iv).
BoE’s Dhingra pushes for rate cut, citing inflation decline and consumption woes
BoE's known dove, Swati Dhingra, reinforced her stance on the necessity for a rate cut in her speech today, underscoring a cautiously optimistic inflation outlook and highlighting concerns over living standards and consumption.
Dhingra described the trajectory of headline inflation as "bumpy but downwards," emphasizing that consumer price inflation has been on a "firm downward path" for some time, with expectations of further declines. This perspective is supported by producer price inflation trends, which typically precede changes in consumer prices, suggesting that the easing of inflation pressures is set to continue.
She also raised concerns over the "downside risks to living standards" that could result from maintaining tight monetary policy stance. She pointed out that, despite reduction in inflation rates and some recovery in real wages, consumption in the UK remains subdued, still "below its pre-pandemic level." This situation presents a "striking contrast" to Eurozone and US, where consumption has already rebounded.
In her critique of the current policy direction, Dhingra argued against the inclination to err on the side of overtightening monetary policy. She cautioned that such an approach often leads to "hard landings and scarring of supply capacity," which could further deteriorate living standards.
Sunset Market Commentary
Markets
The Japanese Cabinet Office downgraded its growth assessment for the first time since November in today’s monthly report. Weakness in private consumption and production are to blame. The economic recovery is likely to remain tepid after unexpectedly slipping in recession in H2 2023. The first downgrade of production in almost a year comes as manufacturing activities, and especially carmakers, had to temporarily halt production and shipments. The sluggish economic outlook suggests that the window of opportunity for the BoJ to finally get rid of negative policy rates and/or yield curve control in the wake of >2% inflation is rapidly closing. The central bank meets next on March 19, but that meeting risks coming too soon lacking the outcome of the annual “Shunto”, the spring wage offensive. That leaves the April 26 BoJ-meeting as the preferred option given availability of new quarterly growth and inflation forecasts as well. Unless of course markets force the BoJ’s hand by sending an already weak Japanese yen (USD/JPY) into tailspin. Officials can still swap current verbal intervention warnings for effective ones, but they are aware of their limited use if not backed by a proper monetary policy. USD/JPY 151.91/95 (2023/2022 top) is still at risk of giving away, bringing the 1990 (!) top at 159.30 as next technical reference.
Opening our report with the monthly eco update by the Japanese government is testament to the anemia of market relevant economic updates so far this week. It shows in limited daily changes on main FI, FX and stock markets. US Treasury yields lose 0.8 bps (30-yr) to 1.9 bps (2-yr) in technical rebound action after testing YTD highs at the end of last week. German Bunds underperform US T’s with yields adding 2 to 2.5 bps across the curve. EUR/USD fails to profit from the slight advantage, treading water just above 1.08. European stock markets cling to small gains, whereas major WS benchmarks again show some vulnerability. Minutes of the January FOMC meeting are unlikely to change the status quo later today given sharp market repricing since. Nvidia earnings after WS close can leave a stamp on risk sentiment tomorrow.
News & Views
The National Bank of Belgium’s consumer confidence indicator slipped in February, extending a weak start of the year. The general index eased from -2 to -5, the lowest since October of last year and as such barely holding above the long-term average (around -7). There was a significant deterioration in the expected development of the general economic situation, which is nearing the 2023 lows again. The NBB reported a sharp drop in consumers’ saving intentions, wiping out much of the improvement registered in the final months of last year. Expectations for households’ financial situation were downgraded too. Unemployment expectations were a rare bright spot though, with the indicator improving to levels last seen mid-2022.
South African assets are among the better performers today. Government bonds gain ground, prompting yields to drop between 13-16 bps at the long end of the curve. The South African rand appreciates against the dollar with USD/ZAR easing to 18.81. This outperformance follows the Finance Minister Godongwana’s annual budget speech, the last one before the May 29 general election – where the ruling African National Congress party risks losing a majority for the first time since 1994. The most cheered upon budget decision is that Treasury will tap the contingency reserves at the central bank to decrease the amount of debt needed to fund deficits. The latter are seen shrinking from 4.5% this FY to 3.3% in the FY ending March 2027. The debt ratio is now expected to peak lower at 75.3% in 2026 instead of 77.7%. The Gold and Foreign Exchange Contingency Reserve Account (GFECRA) to be tapped has risen from just ZAR 1.8bn in 2006 to about 500bn in 2023. These (unrealized) profits reflect the slump of the ZAR against the dollar over the years. ZAR 150bn will be used immediately while an additional ZAR 100bn is set aside for later. That leaves ZAR 250bn in the coffers, provided the move today hasn’t set a precedent for future governments. Other announcements include increased spending for health and security as well as a two-year extension (2027) to monthly grants that date back to the coronavirus era. Something’s got to give, though, and Treasury, amongst others, opted for a stealth tax hike by not adjusting personal income tax brackets for inflation.
EUR/USD Mid-Day Outlook
Daily Pivots: (S1) 1.0767; (P) 1.0803; (R1) 1.0844; More...
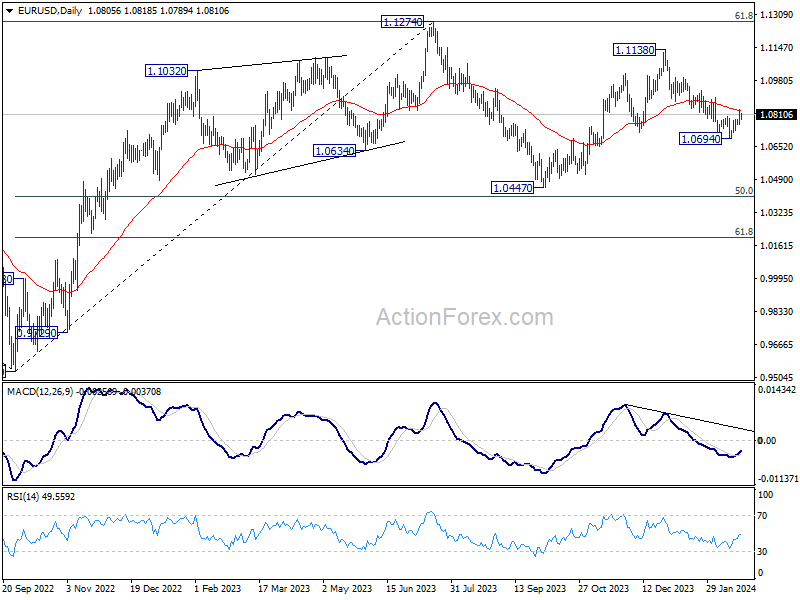
EUR/USD's rebound from 1.0694 is still in progress and intraday bias stays mildly on the upside. Sustained trading above above 55 D EMA (now at 1.0832) will argue that fall from 1.1138 has completed and target this resistance. Meanwhile, rejection by 55 D EMA, followed by break of 1.0761 minor support will retain near term bearishness, and bring retest of 1.0694 first.
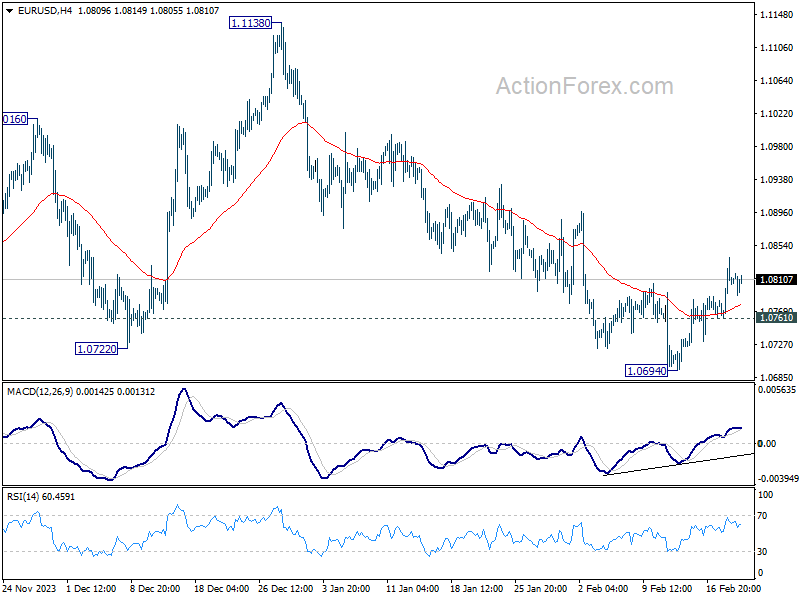
In the bigger picture, price actions from 1.1274 are viewed as a corrective pattern to rise from 0.9534 (2022 low). Rise from 1.0447 is seen as the second leg. While further rally could cannot be ruled out, upside should be limited by 1.1274 to bring the third leg of the pattern. Meanwhile, sustained break of 1.0722 support will argue that the third leg has already started for 1.0447 and possibly below.