Sample Category Title
Gold Encounters Resistance at 50.0% Fibo
- Gold rebounds strongly from 2-month bottom
- Price breaks above 50- and 200-period SMAs
- Oscillators tilt to the positive side
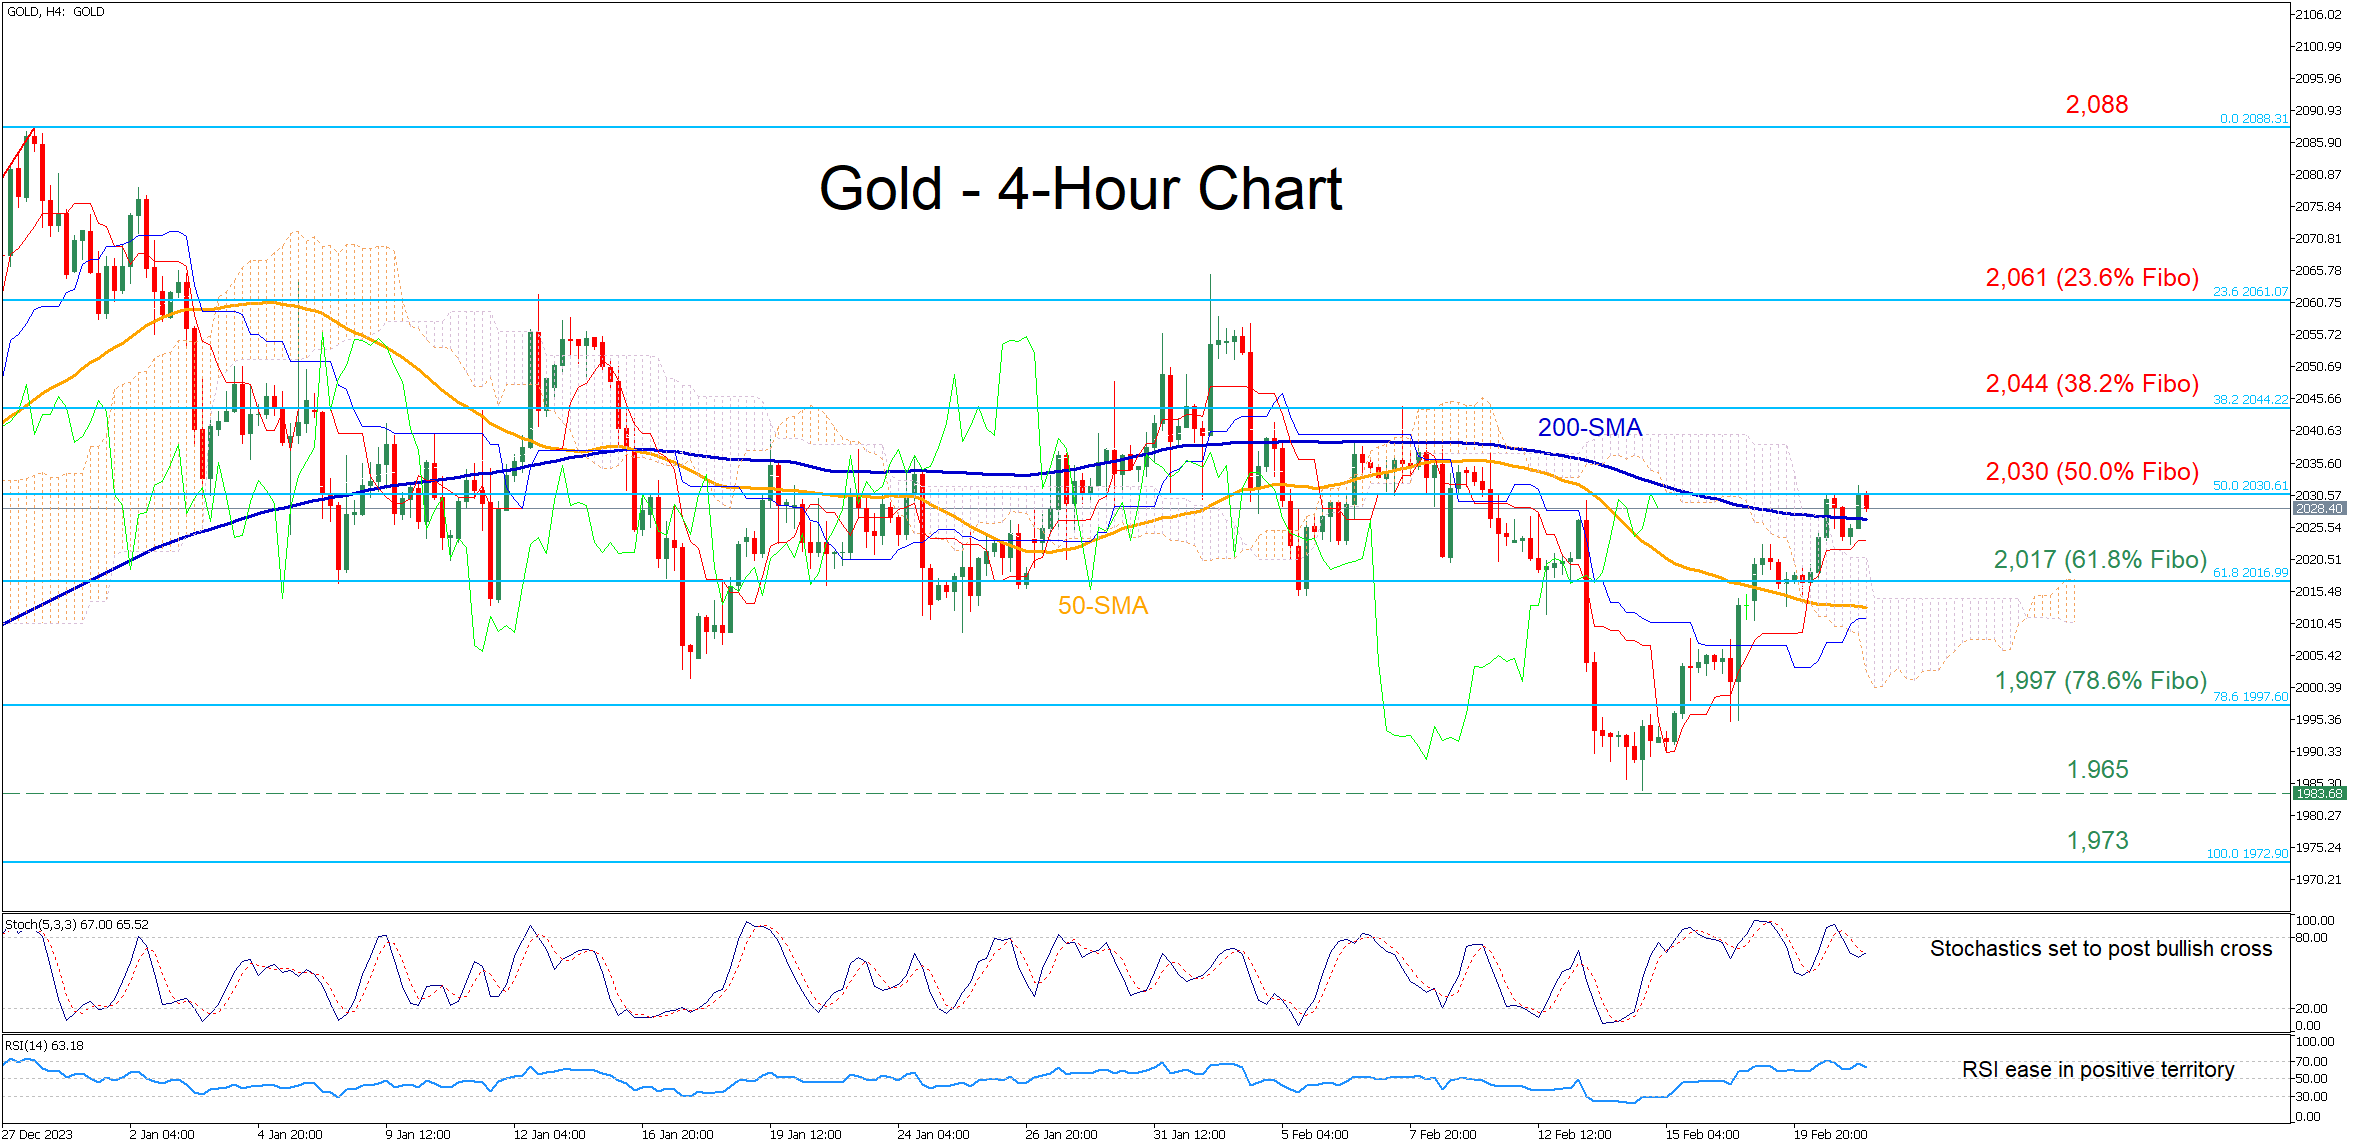
Gold had been trading within a range in the four-hour chart, but a hotter-than-expected US inflation report triggered a downward spike to a fresh two-month low of 1,984. However, bullion managed to post a swift recovery, jumping above both 50- and 200-period simple moving averages (SMAs) before encountering strong resistance at 2,030.
For the rebound to resume, the bulls need to conquer 2,030, which is the 50.0% Fibonacci retracement of the 1,973-2,086 upleg. Surpassing that area, the price may ascend towards the 38.2% Fibo of 2,044. Further advances could then cease at the 23.6% Fibo of 2,060, a region that held strong three times in January.
On the flipside, should gold reverse back below its 200-period SMA, immediate support could be met at the 61.8% Fibo of 2,017, which has prevented retreats multiple times throughout January. Lower, the 78.6% Fibo of 1,997 could prove to be a tough barrier for the bears to overcome. Failing to halt there, the price may challenge the recent two-month low of 1,984.
In brief, gold has been regaining lost ground after finding its feet at a fresh two-month low. However, its repeated failure to claim the 2,030 mark could result in another round of weakness.
Ethereum Price Falls after Exceeding $3,000
We previously wrote about the reasons for the positive sentiment in the ETH/USD market.
Optimism was added by a post on X (Twitter) by Vitalik Buterin about the so-called Werkle trees. This technology, which should (according to the information in the roadmap) be introduced in the future, it includes the advantages of:
→ reduced requirements for validators;
→ faster network synchronization, and others.
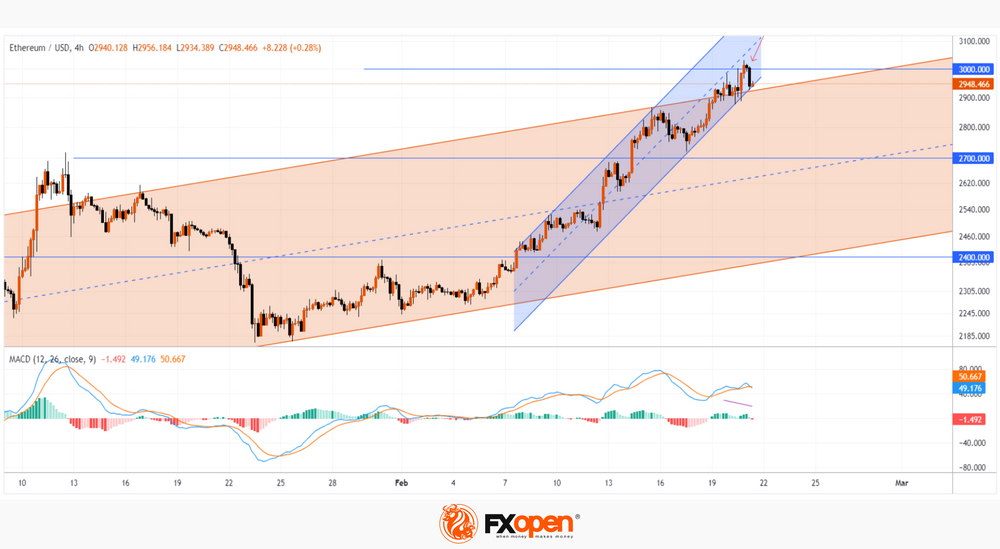
The ETH/USD chart shows that:
→ ETH price is within a larger uptrend (shown in orange);
→ the price is within the February bullish trend (shown by blue lines);
→ the market is in an overbought state, judging by the bearish divergence on the MACD indicator.
These arguments suggest that the market is vulnerable to a pullback.
Notice the wide bearish candle (shown by the red arrow) that is pushing the ETH price down from above the psychological USD 3,000 level. It may indicate a change in mood.
Since the beginning of February, the price of ETH has increased by approximately 30%. Therefore, some market participants could take profits from long positions at the psychological level. If a pullback occurs and is about 50% of the February rise, the price of Ethereum may fall to the median line of the orange channel to the support area of 2,700.
FXOpen offers the world's most popular cryptocurrency CFDs*, including Bitcoin and Ethereum. Floating spreads, 1:2 leverage — at your service. Open your trading account now or learn more about crypto CFD trading with FXOpen.
*At FXOpen UK and FXOpen AU, Cryptocurrency CFDs are only available for trading by those clients categorised as Professional clients under FCA Rules and Professional clients under ASIC Rules respectively. They are not available for trading by Retail clients.
This article represents the opinion of the Companies operating under the FXOpen brand only. It is not to be construed as an offer, solicitation, or recommendation with respect to products and services provided by the Companies operating under the FXOpen brand, nor is it to be considered financial advice.
Japan’s government reports stall in consumption and manufacturing slide
The Japanese government maintains its assessment that the economy is "recovering at a moderate pace", but with a of caution with the observation that the recovery "recently appears to be pausing."
A critical shift noted in the Monthly Economic Report concerns private consumption, which has been downgraded from "picking up" to "pausing for picking up." Additionally, while there was optimism surrounding industrial production, the report highlights a recent decline in manufacturing activities attributed to production and shipment suspensions by some automotive manufacturers.
The report maintains unchanged assessments in several other economic indicators. Business investment and exports, similar to private consumption and industrial production, are described as "pausing for picking up."
On a positive note, corporate profits are reported to be improving overall, and firms' judgments on current business conditions are becoming more favorable.
Additionally, employment situation is showing signs of improvement. Consumer prices, meanwhile, continue to rise "moderately".
EUR/USD Starts Increase While USD/JPY Dips
EUR/USD gained bullish momentum above the 1.0800 resistance. USD/JPY is declining and showing bearish signs below the 150.40 level.
Important Takeaways for EUR/USD and USD/JPY Analysis Today
- The Euro remained in a bullish zone and climbed above the 1.0800 resistance zone.
- There is a key bullish trend line forming with support near 1.0790 on the hourly chart of EUR/USD at FXOpen.
- USD/JPY is trading in a bearish zone below the 150.40 and 150.15 levels.
- There is a major bearish trend line forming with resistance near 150.15 on the hourly chart at FXOpen.
EUR/USD Technical Analysis
On the hourly chart of EUR/USD at FXOpen, the pair started a fresh increase above the 1.0745 zone. The Euro climbed above the 1.0800 resistance zone against the US Dollar.
The pair even settled above the 1.0800 resistance and the 50-hour simple moving average. Finally, it tested the 1.0840 resistance. A high is formed near 1.0838 and the pair is now consolidating gains. There was a minor decline below the 23.6% Fib retracement level of the upward move from the 1.0761 swing low to the 1.0838 high.
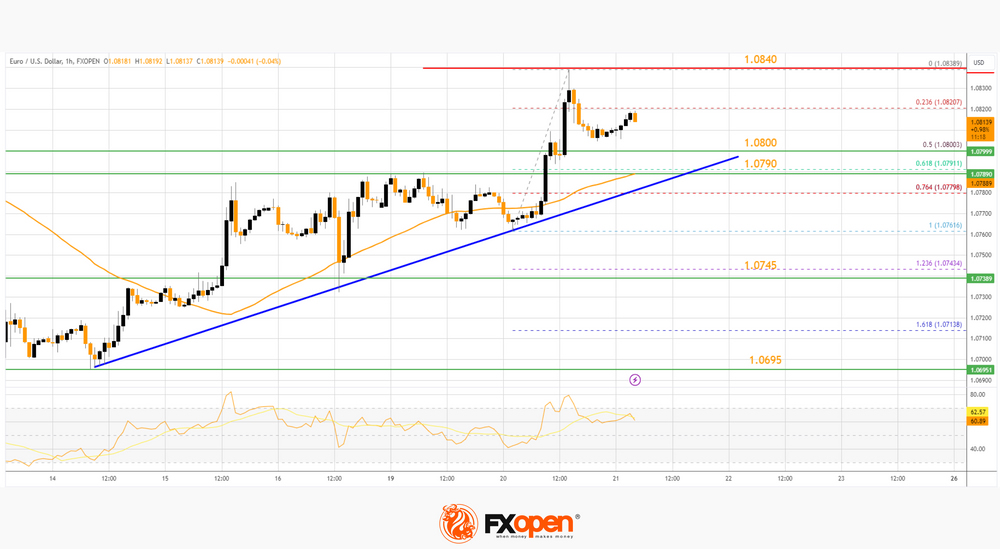
Immediate support is near the 1.0800 level. The next major support is at 1.0790. There is also a key bullish trend line forming with support near 1.0790 and the 50-hour simple moving average. It coincides with the 61.8% Fib retracement level of the upward move from the 1.0761 swing low to the 1.0838 high.
If there is a downside break below 1.0790, the pair could drop toward the 1.0745 support. The main support on the EUR/USD chart is near 1.0695, below which the pair could start a major decline.
On the upside, the pair is now facing resistance near 1.0840. The next major resistance is near the 1.0885 level. An upside break above 1.0885 could set the pace for another increase. In the stated case, the pair might rise toward 1.0950.
USD/JPY Technical Analysis
On the hourly chart of USD/JPY at FXOpen, the pair started a steady decline well above the 150.80 zone. The US Dollar gained bearish momentum below the 150.40 support against the Japanese Yen.
The pair even settled below the 150.00 level and the 50-hour simple moving average. There was a spike below the 50% Fib retracement level of the upward move from the 148.92 swing low to the 150.88 high.
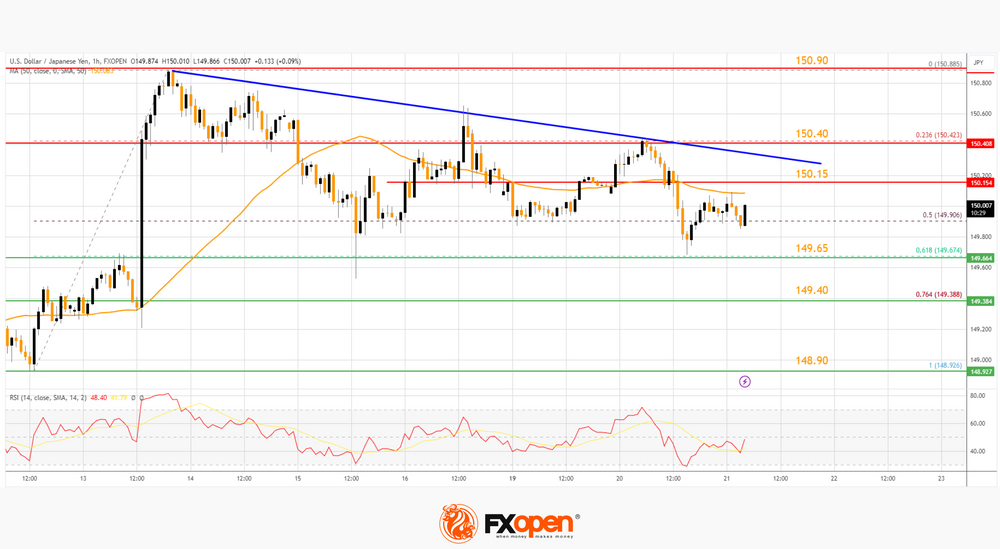
On the downside, the first major support is near 149.65. It is close to the 61.8% Fib retracement level of the upward move from the 148.92 swing low to the 150.88 high. The next major support is near the 149.40 level.
If there is a close below 141.90, the pair could decline steadily. In the stated case, the pair might drop toward the 148.90 support.
Immediate resistance on the USD/JPY chart is near the 50-hour simple moving average. The first major resistance is near a bearish trend line at 150.15. If there is a close above the 150.15 level and the hourly RSI moves above 50, the pair could rise toward 150.40. The next major resistance is near 150.90, above which the pair could test 152.50 in the coming days.
Trade over 50 forex markets 24 hours a day with FXOpen. Take advantage of low commissions, deep liquidity, and spreads from 0.0 pips. Open your FXOpen account now or learn more about trading forex with FXOpen.
This article represents the opinion of the Companies operating under the FXOpen brand only. It is not to be construed as an offer, solicitation, or recommendation with respect to products and services provided by the Companies operating under the FXOpen brand, nor is it to be considered financial advice.
USDJPY Hovers Above a Key Trendline
- USDJPY trades sideways, hovering around the 150 level
- It remains close to its recent peak and it is comfortably above a key trendline
- Momentum indicators are mixed, all eyes on the stochastic oscillator
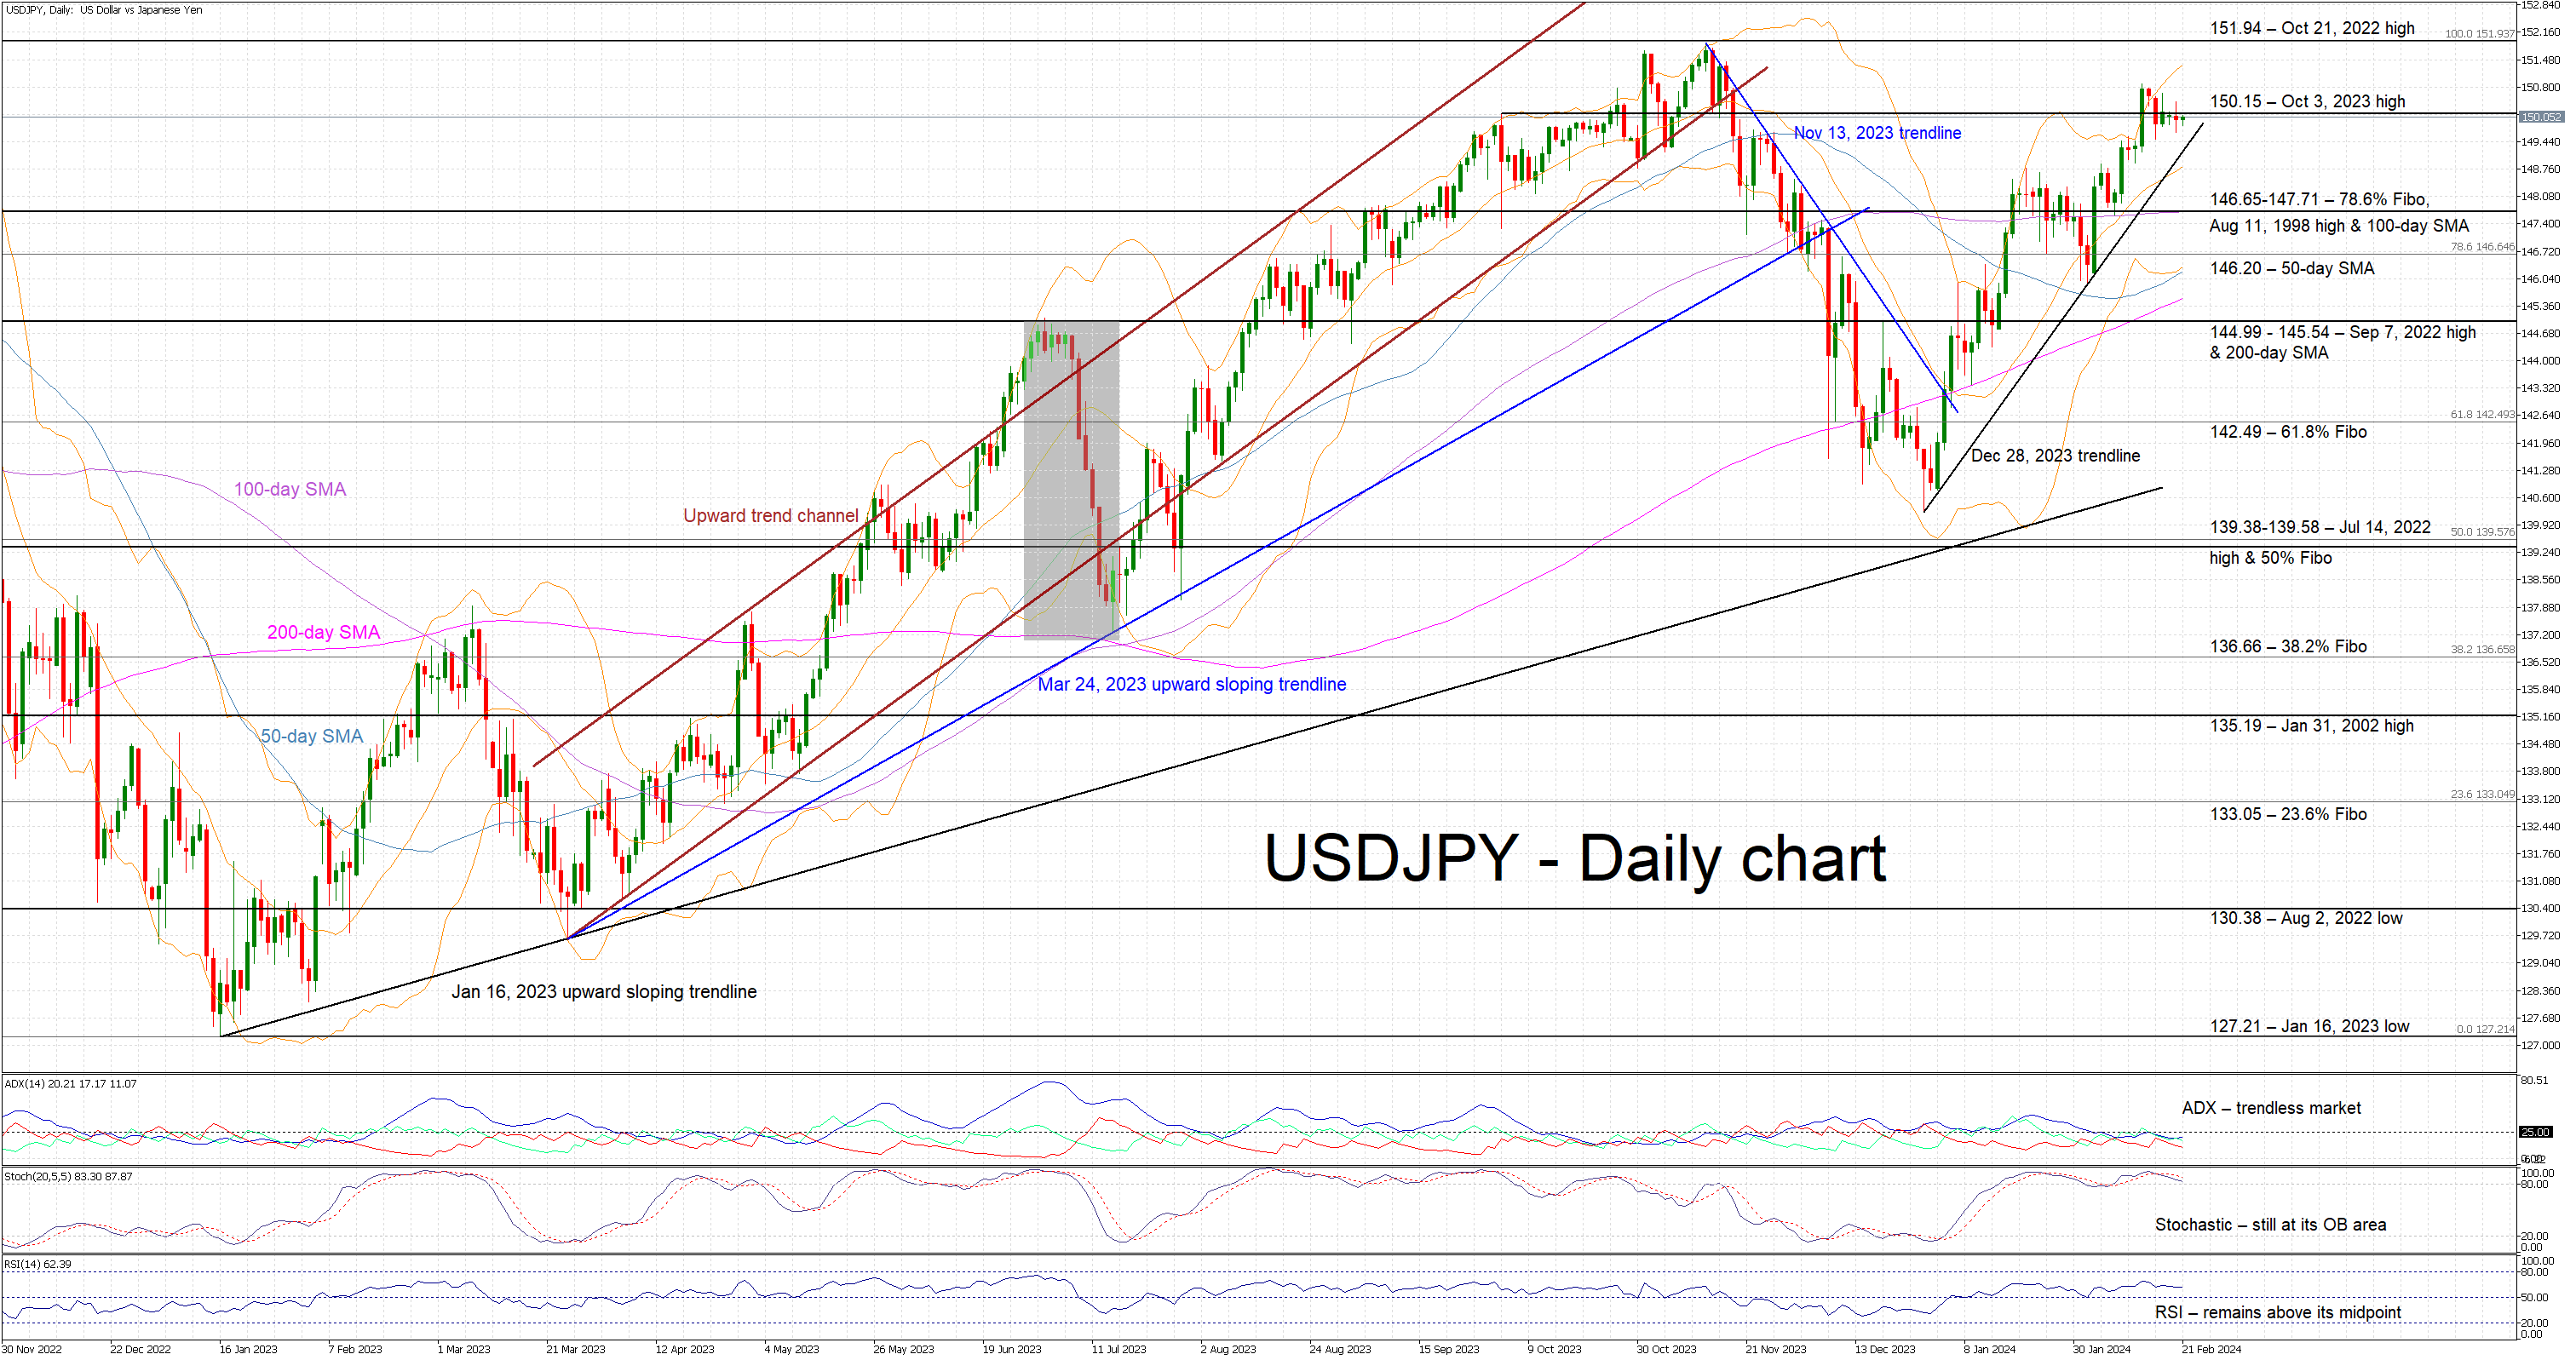
USDJPY is trying to record a green candle as it continues to range trade and to respect the aggressive December 28, 2023 ascending trendline. It remains a tad below the October 3, 2023 high at 150.15, a level that appears to provoke verbal interventions from Japanese officials.
In the meantime, the momentum indicators are mostly mixed. More specifically, the Average Directional Movement Index (ADX) appears uninterested in the recent upleg as it continues to hover in trendless territory. The RSI continues to trade comfortably above its 50-midpoint and, more importantly, the stochastic oscillator remains stuck in its overbought (OB) territory. It is edging lower, but it needs a more forceful move in order to break below its OB area and send a bearish signal.
Should the bulls remain confident, they could try to overcome the October 3, 2023 high at 150.15. USDJPY bulls could then stage a rally towards the October 21, 2022 high at 151.94 and, if successful, open the door to a new 30-year high.
On the flip side, the bears are keen to push USDJPY below the December 28, 2023 ascending trendline and then test the support set by the 146.65-147.71 area, which is populated by the 78.6% Fibonacci retracement of the October 21, 2022 - January 16, 2023 downtrend, the August 11, 1998 high and the 100-day simple moving average (SMA). Even lower, the bears could then lead USDJPY towards the 144.99-145.54 region, provided they overcome the 50-day SMA at 146.20.
To sum up, USDJPY bulls are keen to record another upleg, but they need stronger support from the momentum indicators and to avoid provoking the Japanese authorities.
Minutes of January Fed Meeting the Only Item Worth Mentioning Today
Markets
US stock markets performed well this year despite the hawkish repositioning on bond markets. The Dow Jones, S&P 500 and Nasdaq are off their YTD/all-time highs, but record YTD gains of respectively 2.32%, 4.31% and 4.13%. One of the reasons is that stocks have been backed by a strong Q4 earnings season. Unfortunately, this support is gradually petering out. AI-frontrunner NVidia is the final bellwether tonight, after which remaining earnings will be downgraded to playing second fiddle. Following an astronomic (stock price) rise, investors took a more guarded approach yesterday going into tonight’s release. The stock fell around 4%, pulling Nasdaq almost 1% lower. Once the result is out, for better or for worse, we believe that stock markets and risk sentiment in general could be prone for some short-term correction. This can help US Treasuries temporarily off the sell-off lows, though we don’t think that investors will be rapidly tempted into piling Fed rate cuts bets again ahead of the June policy meeting. From a data point of view, we have tomorrow’s global PMI’s but then the wait stretches to PCE deflators published next Thursday (Feb 29). The US dollar had a solid start to the year but showed first signs of weakness yesterday, easily giving up to 1.08 first resistance area against a still weak euro. The pair is trying to escape the YTD downward trend channel. First support in the trade-weighted dollar around 104 survives for now. USD/JPY holds north of 150.
Today’s eco calendar fails to inspire. Minutes of the January Fed meeting are the only item worth mentioning. We expect them to align with the recent Fed push against dovish market bets. Fed chair Powell strongly suggested that the base case scenario of “only” three 25 bps rate cuts, as plotted in December Dots, remains in play going into the March update. More and more Fed members indicate summer as the preferred starting point. From a market point of view, we fear that they won’t contain much new, guiding, info though, setting the stage for another session of sentiment-driven trading within technical boundaries.
News & Views
The Australian Bureau of Statistics this morning reported its wage price index. Wages rose 0.9% in Q4 of last year, bringing the Y/Y measure at 4.2%. The outcome was marginally higher than expected and follows a strong 1.3% quarterly gain in Q3. Y/Y growth was the strongest since the March 2009 quarter. Private sector wage growth was comparable to December 2022 (also 0.9%). The public sector had the highest quarterly rise in 15 years (1.3%). The Reserve Bank of Australia in its February monetary policy report expected wage growth at 4.1%. Today’s data suggest the RBA might take some more time to assess the impact of wages on inflation going forward. Yesterday, Minutes of the February meeting showed that the RBA still didn’t completely rule out the option of a final rate hike, even as markets see the chance for such a move as non-existent.
Japanese exports beat expectations in January, rising by 11.9% from the same month in 2022. The improvement was mainly driven by shipments of cars and car parts and chipmaking equipment. Exports to the US rose 15.6%, to Europe 13.8% and exports to China even jumped 29.2%. However, with respect to the latter some calendar effects related to timing of the Lunar New year were in play. On the other hand imports declined by a bigger than expected 9.6% Y/Y. The data might give some comfort after Japan fell into recession in the second half of last year, mainly due to poor domestic demand. A solid export performance and a weak yen keep the option for the BOJ to start policy normalization/leaving the negative interest rate policy at one of the upcoming meetings. The yen is going nowhere this morning, with USD/JPY hovering near the 150 pivot.
Nasdaq 100 Technical: Torpedoed by Nvidia, At Risk of Undergoing Multi-Week Corrective Decline
- Nasdaq 100 has remained sluggish and underperformed the Dow Jones Industrial Average since last Friday, 16 February.
- The recent underperformance of the Nasdaq 100 has been triggered by the concentration risk of its significant YTD return contributor, Nvidia.
- The options market has priced in around an 11% move in either direction on the share price of Nvidia after it reports its Q4 2023 earnings results later today.
- Nasdaq 100 faces the risk of a potential multi-week corrective decline unfolding; immediate supports to watch will be at 17,350 and 17,160.
The Nasdaq 100, the top outperformer among the major US benchmark stock indices has remained sluggish since last Friday, 16 February.
Yesterday, the mega-cap technology stocks heavy-weighted Nasdaq 100 slipped by -0.79% after shedding as much as -1.62% intraday. In contrast, the Dow Jones Industrial Average only recorded a minor loss of -0.17%
Concentration risk in Nvidia
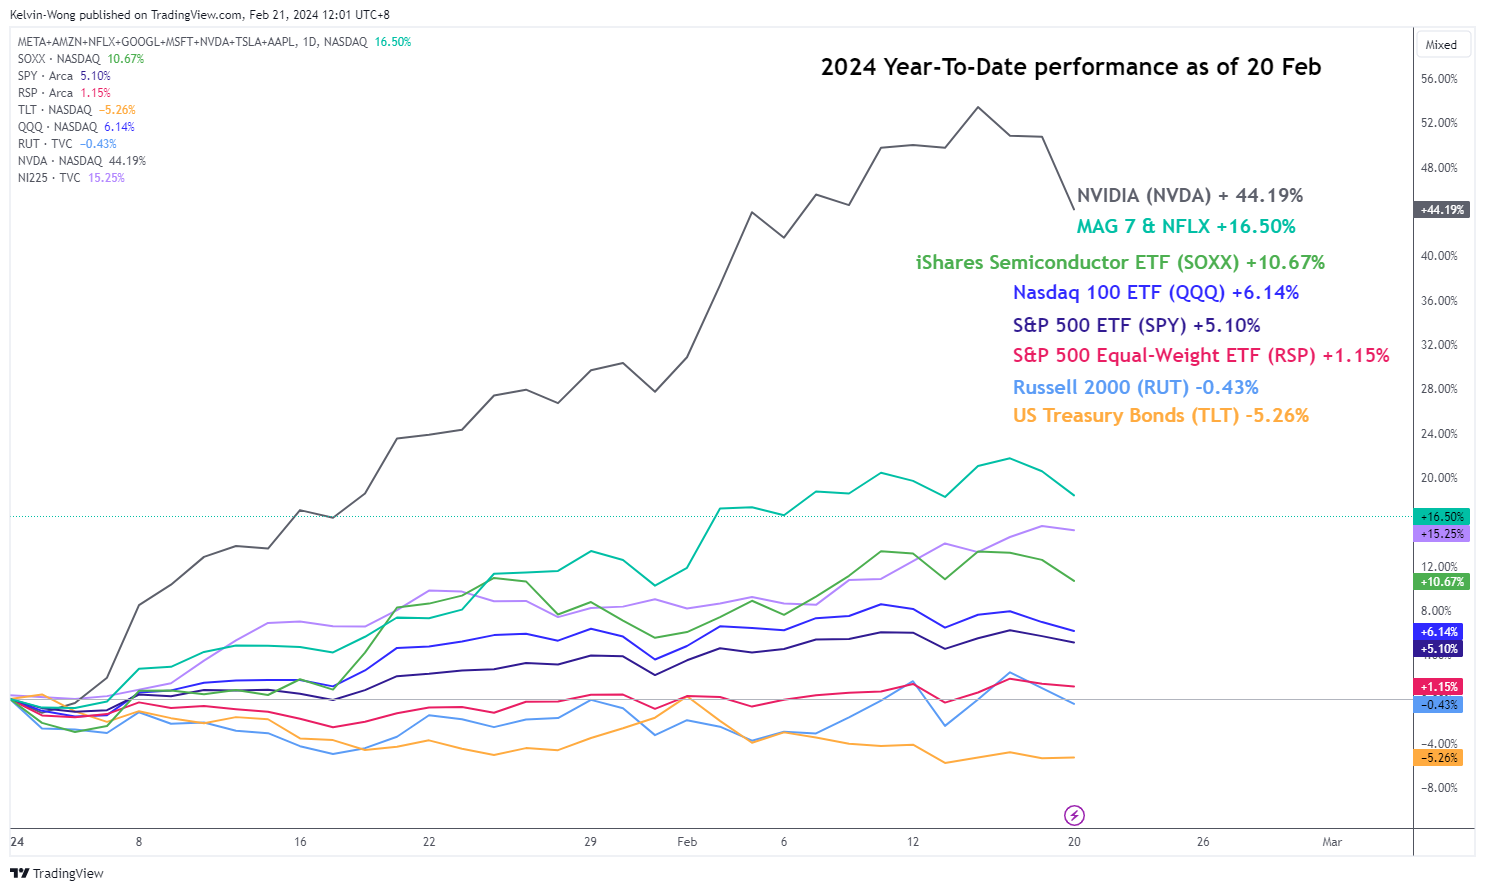
Fig 1: YTD performance of major US benchmark stock indices & key ETFs as of 20 Feb 2024 (Source: TradingView, click to enlarge chart)
The main culprit to blame for the Nasdaq 100’s current short-term underperformance over the Dow Jones Industrial Average has been the horrendous sell-off seen in the share price of Nvidia yesterday where it plummeted by -4.35% with a maximum intraday loss of -6.58%, its worst daily return since 17 October 2023 ahead of its Q4 2023 earnings result release today after the close of the US session.
Market participants have started to remain weary of the high growth earnings expectations being placed on Nvidia, being the leader of the ongoing Artificial Intelligence (AI) high productivity and business cycle revolution optimism theme play. Analysts’ consensus expectations have set a high bar for Nvidia’s Q4 2023 earnings per share to come in at $4.59, that’s a whopping gain of +420% y/y over the same quarter a year ago.
A Wall Street Journal report dated yesterday, 20 February has cited data obtained from Cboe Global Markets that the options market has priced in around an 11% move in either direction on the share price of Nvidia after it reports its earnings later today at the close of the US session. The expected 11% move is based on an option trade known as a straddle which entails purchasing puts and calls at the same strike price.
Notably, market participants have turned cautious about the state of the US stock market as a significant portion of the current year-to-date (YTD) of the S&P 500 has been contributed by a huge portion from Nvidia’s YTD return of +44 % with a current peak of +53% seen earlier on 14 February (see Fig 1) that surpassed the YTD returns of Nasdaq 100 by 7 times, and a wider margin of 38 times on the equal-weight S&P 500.
Bearish “Ascending Wedge” breakdown
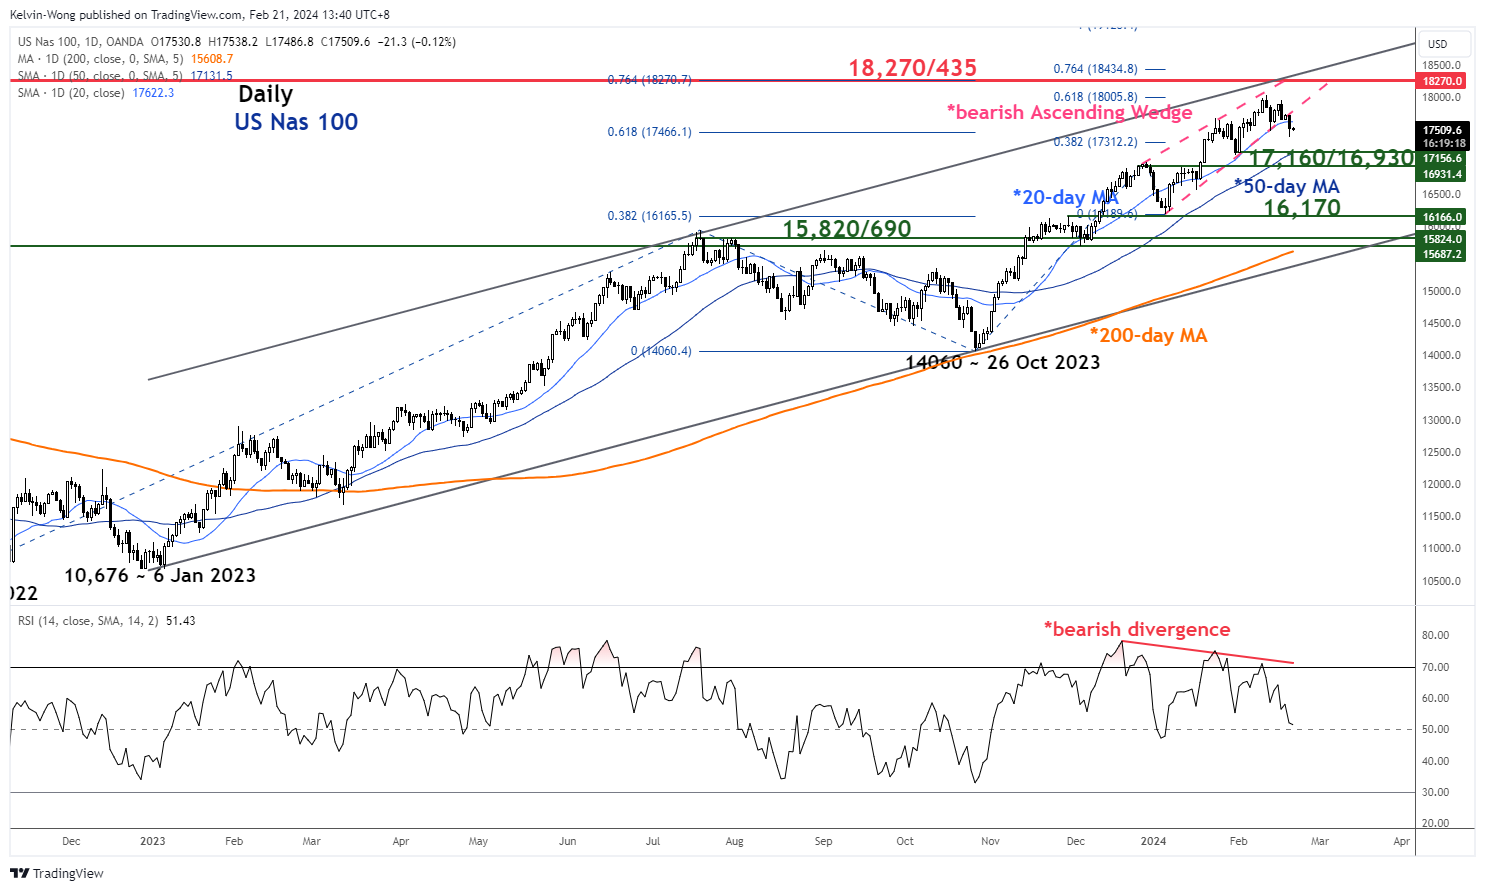
Fig 2: US Nas 100 medium-term & major trends as of 21 Feb 2024 (Source: TradingView, click to enlarge chart)
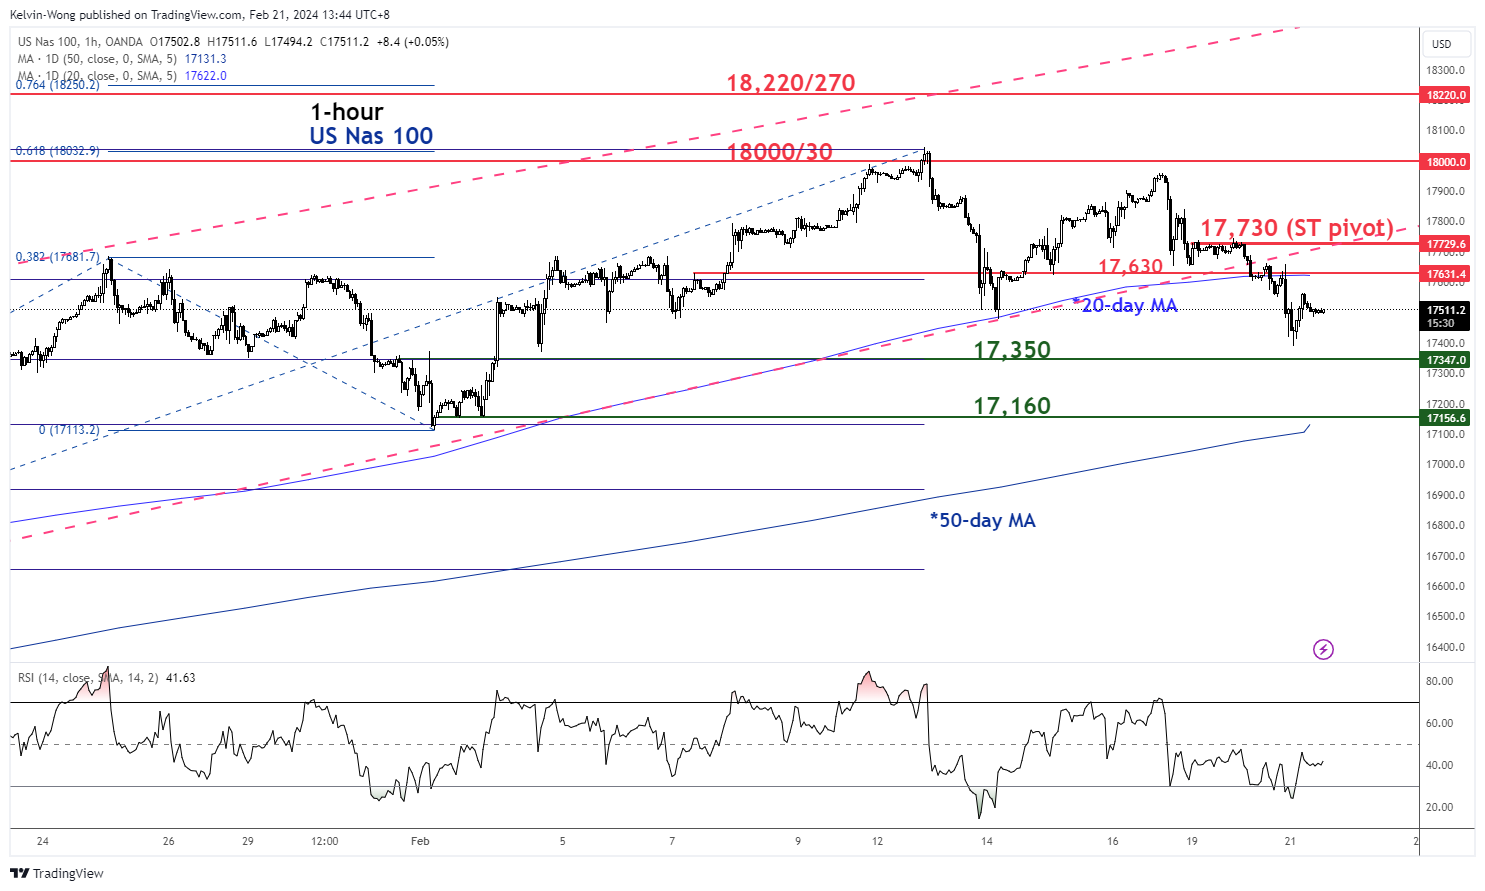
Fig 3: US Nas 100 short-term trend as of 21 Feb 2024 (Source: TradingView, click to enlarge chart)
Yesterday’s sell-off seen in the US Nas 100 Index (a proxy for the Nasdaq 100 futures) has led to a breakdown on the lower boundary of its medium-term bearish “Ascending Wedge” configuration that also confluences with the 20-day moving average that acted as a prior support at 17,630.
In addition, the daily RSI momentum indicator has flashed a bearish divergence condition since 24 January at its overbought region. These observations have increased the risk of a potential medium-term (multi-week) corrective decline unfolding within the Index’s ongoing major uptrend phase in place since the 6 January 2023 swing low.
On a short-term horizon, as seen in the hourly chart, the key short-term pivotal resistance to watch will be at 17,730 (pull-back of the former “Ascending Wedge” support & 61.8% Fibonacci retracement of the recent slide from 16 February 2024 high to 21 February 2024 low).
If 17,730 is not surpassed to the upside, the Index may exhibit further weakness to expose the next intermediate supports at 17,350 and 17,160 (also the upward-sloping 50-day moving average) in the first step.
On the other hand, a clearance above 17,730 invalidates the bearish tone to see a retest on the current all-time high area of 18,000/18,030.
Will FOMC Minutes Give Clues on the Timing of Rate Cuts?
In focus today
Today, we receive euro area consumer confidence figures for February. Consumer confidence is still at a low level which is likely the reason for the sluggish consumption ratio. Consumer confidence rebounded strongly during the first half of 2023 but has since stagnated. An increase in consumer confidence could be the trigger for higher private consumption in 2024 as real incomes improve.
Tonight, minutes from the FOMC's January meeting will be released. Markets will keep a close eye on any clues regarding the timing of the first rate cut, which we now expect to come in May. In addition, the Fed's Bostic and Bowman will be on the wires ahead of the release.
Overnight, Japanese PMI figures kick off the slew of PMI data that is due tomorrow.
Economic and market news
What happened overnight
Japanese export volumes declined 4.6% in January indicating a slow start to the year following the technical recession in 2023H2. That said, January PMIs were more uplifting but have not been a good GDP indicator recently.
What happened yesterday
Yesterday we got Q4 GDP figures for Denmark, which showed an impressive rebound with a growth rate of 2.0% q/q. Furthermore, Q3 growth was revised up to 0.4% from -0.7%. The development was largely driven by pharmaceuticals, where manufacturing GVA increased almost 8% q/q in Q4, which also drove exports higher. Consumption also ticked up with quarterly growth of 1.7%, indicating somewhat less cautious consumers. All in all, this means the economy grew 1.8% for the year 2023, which is substantially more than the Eurozone. However, when excluding pharmaceuticals, the numbers show a decline of 0.1%.
Euro Area negotiated wage growth declined to 4.46% in Q4 from 4.7% y/y in Q3. This was in line with other trackers from the ECB and suggests that wage growth peaked in Q3. The ECB has repeatedly told markets that they await more data on wage growth, so this should provide some comfort, though they will likely still be cautious as we have yet to get the full overview of wage growth in Q4, which we will get with the "compensation per employee" print, due for release on 8 March. The market reaction was muted, with pricing still suggesting the first rate cut in June.
Finally, we got somewhat dovish comments from Bank of England governor Andrew Bailey who said that it was "not necessary" to wait for inflation to come back to target before cutting rates, adding also that the Bank was particularly focused on whether services inflation and wage growth were on a sustained path towards headline inflation. The market reaction was muted.
Equities: Global equities were lower yesterday with DM underperforming EM. DM is driven by macro and inflation data while EM is driven by China and the next step of policy support for the property sector. Defensive value outperforming globally on the higher for longer narrative but also boosted by earnings reports and earnings expectations yesterday. Investors embracing the earnings from retailers while taking some chips of the table in tech space ahead of tonight's reporting from Nvidia. Yesterday in the US Dow -0.2%), S&P 500 -0.6%, Nasdaq -0.9% and Russell 2000 -1.4%. Asian markets are mixed as the tech sector is dragging down most indices. Chinese indices are mostly higher as property developers are rising on the back of the last batch of policy support. Futures in US and Europe are mixed this morning with the tech-heavy indices trailing the rest.
FI: There was a modest decline in global bond yields yesterday, where 10Y US Treasury yields declined 3-4bp relative to the opening level on Tuesday morning. 10Y German govt yield also declined 4-5bp. There was also a bullish steepener between 2Y and 10Y for both the US and European government bond yield curves.
FX: SEK gained for the second straight day versus the rest of the G10 closely followed by the EUR, NZD and AUD. CAD and USD lost some ground yesterday, with EUR/USD rising to a two-week high just below 1.0840.
Nvidia Hasn’t Said Anything Yet, and Market Already Making Big Swings
Nvidia hasn’t said anything yet, and the market is already making big swings – to give you an idea on the potential of a positive or a negative move when the results finally arrive. Yesterday, Nvidia tumbled nearly 6% out of the blue, and closed the session more than 4% down, as some investors – who were obviously long Nvidia - preferred to take their profits in their pockets and move to the sidelines to avoid taking the risk of a major move that could spoil their profits – if the move happens toward the wrong direction.
Nvidia will release the most expected earnings of the quarter today, after the bell. Nvidia is expected to announce a sales revenue of around $20bn in the Q4 and earnings per share of $4.60. The numbers are huge if you think that sales were worth around $6 billion, and EPS was just 88 cents a year ago. We are talking about a more than 200% sales growth – which, no matter if the company meets expectations or not – is HUGE. But of course, the price action was big too. Nvidia is up by more than 400% since the beginning of 2023. This is why any correction could be massive. According to options positioning we could see a 10% move to the upside or to the downside – which is totally acceptable for a tech giant, mind you. Meta rallied 20% after reporting its own earnings this season. Still, the capital shake is expected to be impressive. Nvidia results could trigger a quake of a magnitude of $200bn, and a tsunami of tens and potentially hundreds of billion dollars across the market. Mixed earnings and – God Forbid – an earnings miss has potential to send Nvidia’s stock price tumbling, while an earnings beat could fail to gather enough positive momentum – if the beat is not enough strong. This is HOW STRONG the expectations are.
Zooming out, Nvidia’s 4% drop yesterday sent an early warning to the market. The S&P500 retreated 0.6% and settled below the 5000 at the close, while Nasdaq fell nearly 0.80%. It almost feels like Nvidia earnings could be a decisive moment in the AI rally as many expect the AI bubble to burst at some point. But it’s worth noting that, whatever happens today, the AI revolution is happening. Massive investments are being made in the sector and money will continue to follow. The question won’t be whether demand for AI businesses will be enough, it is whether the companies have enough capacity to satisfy the exploding demand.
Did someone say a ‘hike’?
Besides Nvidia, the Federal Reserve (Fed) will release its latest meeting minutes in the middle of confused expectations. The year started with the expectation that the Fed would start cutting the rates as soon as March. These expectations got quickly scaled back on the back of very strong jobs data, otherwise strong economic data and an uptick in latest inflation updates. And now we can feel the winds changing direction as not only that the first Fed cut expectation has been pushed back to June – with some 80% chance attached to it – but some start saying that the next move from the Fed could even be a rate hike!
That’s clearly now what currency traders think right now. The US dollar index is giving back strength, and the EURUSD is back above the 1.08 level before the surprised eyes of the euro bears - who were expecting the morose European growth outlook to at least keep the EURUSD within the ytd bearish trend. The dollar appetite will determine whether the pair deserves to extend gains above the 200-DMA or not.
And one more thing about the rate HIKE discussion. The Reserve Bank of Australia (RBA) and the Reserve Bank of New Zealand (RBNZ) have both left the door open to the possibility of further policy tightening. At this stage, it is just an idea and not a maturing decision, but desolation would be massive if the RBNZ decided to hike on February 28.
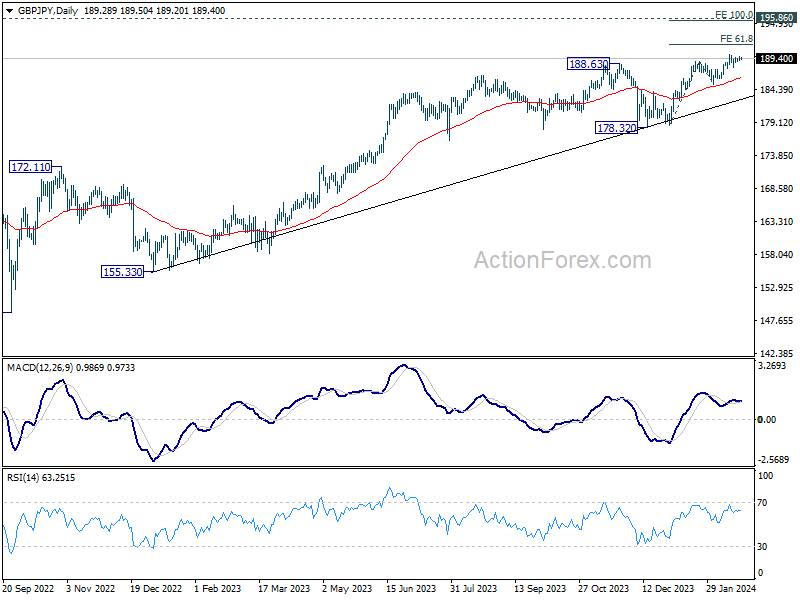
GBP/JPY Daily Outlook
Daily Pivots: (S1) 188.99; (P) 189.36; (R1) 189.70; More...
Intraday bias in GBP/JPY remains neutral as consolidations continue below 190.05. Further rally is expected with 187.83 minor support intact. Break of 190.05 will target 61.8% projection of 178.71 to 188.90 from 185.21 at 191.50. However, break of 187.83 will turn bias to the downside for deeper correction back to 185.21 support instead.
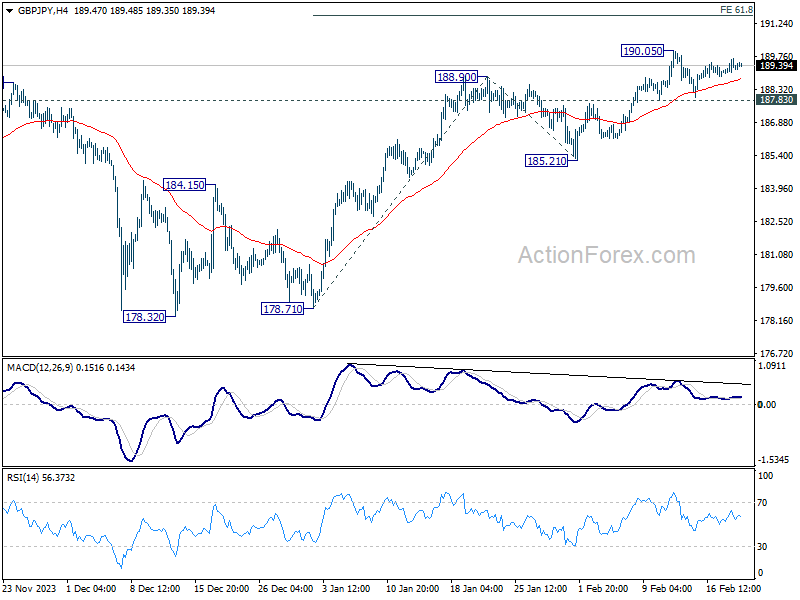
In the bigger picture, up trend from 123.94 (2020 low) in in progress. Medium term outlook will stay bullish as long as 178.32 support holds. Next target is 195.86 long term resistance (2015 high).