Sample Category Title
GBP/USD Mid-Day Outlook
Daily Pivots: (S1) 1.2578; (P) 1.2623; (R1) 1.2668; More...
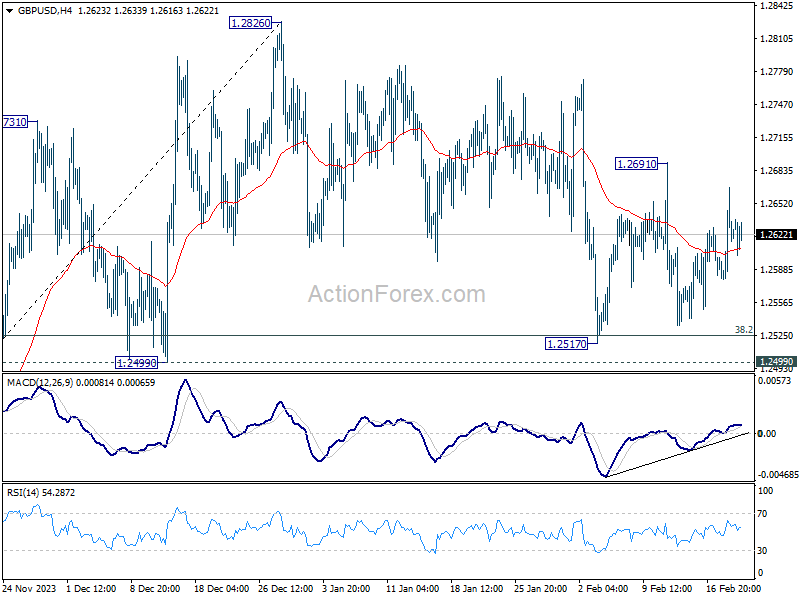
Outlook in GBP/USD is unchanged as range trading continues. Intraday bias stays neutral at this point. On the upside, break of 1.2691 resistance will indicate that correction from 1.2826 has completed. Intraday bias will be back on the upside for retesting 1.2826. Nevertheless, decisive break of 1.2499 will argue that whole rise from 1.2036 has completed and turn near term outlook bearish.
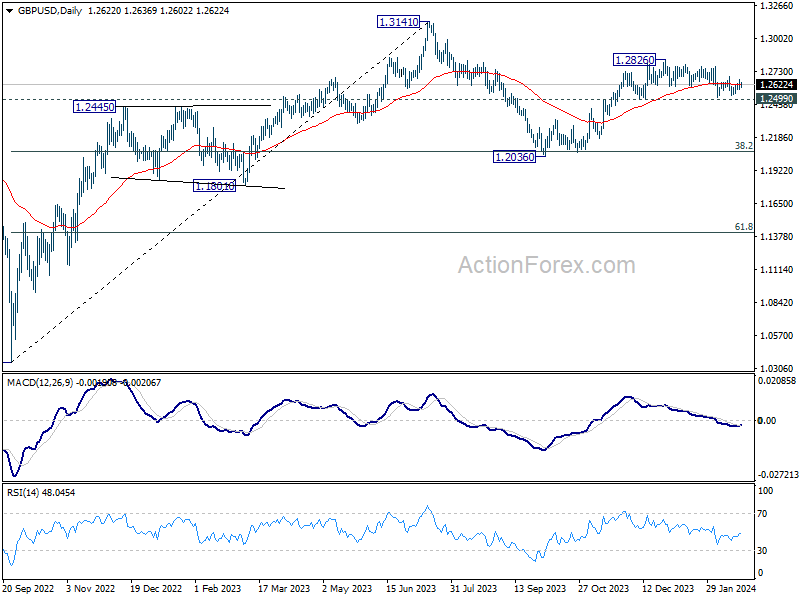
In the bigger picture, price actions from 1.3141 medium term top are seen as a corrective pattern to up trend from 1.0351 (2022 low). Rise from 1.2036 is seen as the second leg, which could be still in progress. But upside should be limited by 1.3141 to bring the third leg of the pattern. Meanwhile, break of 1.2499 support will argue that the third leg has already started for 38.2% retracement of 1.0351 (2022 low) to 1.3141 at 1.2075 again.
USD/JPY Mid-Day Outlook
Daily Pivots: (S1) 149.65; (P) 150.04; (R1) 150.40; More...
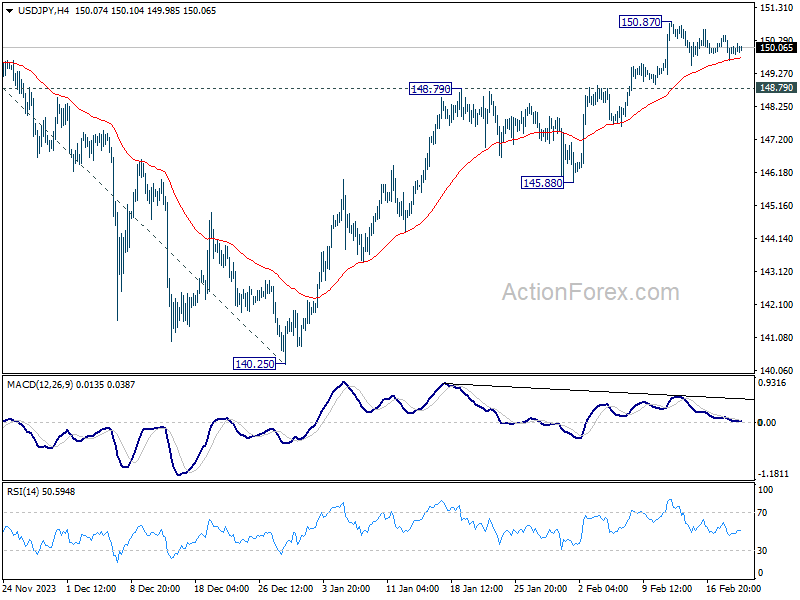
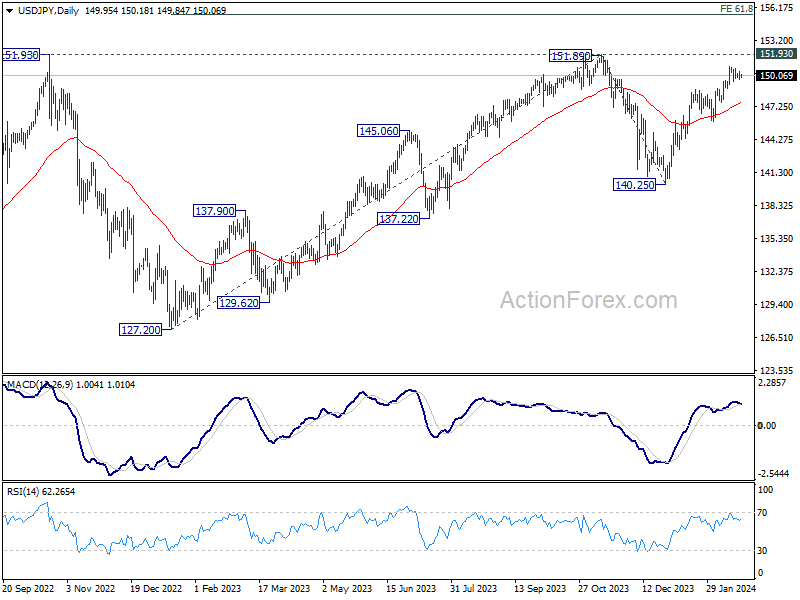
No change in USD/JPY's outlook as consolidation from 150.87 is still in progress. Intraday bias remains neutral at this point. In case of another retreat, downside should be contained by 148.79 resistance turned support to bring another rally. Above 150.87 will resume the rise from 140.25 to 151.89/93 key resistance zone. Decisive break there will confirm larger up trend resumption of 155.50 projection level next. However, firm break of 148.79 will turn bias to the downside for 145.88 support.
In the bigger picture, fall from 151.89 is seen as a correction to the rally from 127.20, which might have completed at 140.25 already. Firm break of 151.89/93 resistance zone will confirm up trend resumption, and next target will be 61.8% projection of 127.20 to 151.89 from 140.25 at 155.50. This will now remain the favored case as long as 140.25 support holds.
USD/CHF Mid-Day Outlook
Daily Pivots: (S1) 0.8791; (P) 0.8814; (R1) 0.8843; More....
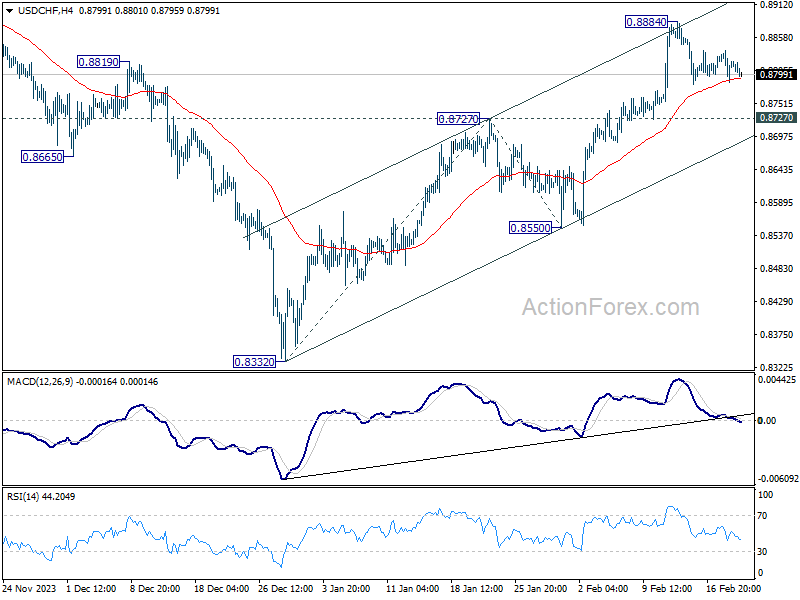
USD/CHF dips mildly today but stays in range of 0.8727/8884. Intraday bias remains neutral and more consolidations could be seen. With 0.8727 resistance turned support intact, further rally is still expected. On the upside, break of 0.8885 will resume the rise from 0.8332 and target and 100% projection of 0.8332 to 0.8727 from 0.8550 at 0.8954. However, sustained break of 0.8727 will dampen this bullish view, and turn bias back to the downside for 0.8550 support instead.
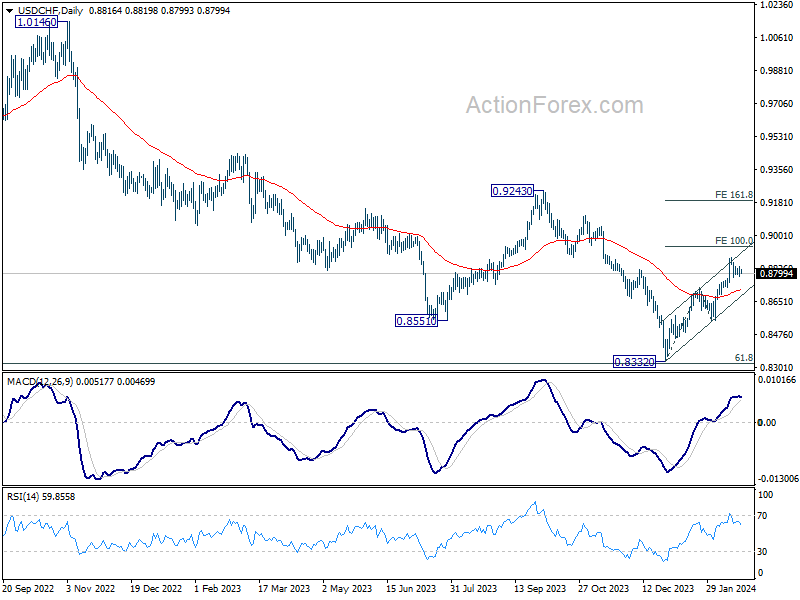
In the bigger picture, a medium term bottom should be formed at 0.8332, on bullish convergence condition in W MACD, just ahead of 0.8317 long term fibonacci support. It's still early to decide if the larger down trend from 1.0146 (2022 high) is reversing. But further rise should be seen to 0.9243 resistance even as a correction.
Speculations Over Fed’s Next Move Grow Increasingly Complex
Trading activity is relatively subdued today, with most major currency pairs and crosses hovering within the previous day's range. Australian and New Zealand Dollars are showing some resilience, maintaining their position as the firmer currencies, albeit without significant momentum. Swiss Franc has also edged higher in the daily performance chart, benefiting a recovery against both the Euro and the Sterling. On the other hand, Dollar and Yen find themselves on the softer side, while Euro and the Pound show mixed performances.
The spotlight for the rest of the day is firmly on the upcoming FOMC minutes. Investors and traders alike will dissect for clues regarding the timing of the first rate cut, although expectations for concrete hints are tempered. However, it should also be pointed out that the narrative within certain market segments is increasingly complex.
Discussions are emerging around the possibility of Fed's next move being a rate hike rather than a cut. This debate gained traction following comments from former US Treasury Secretary Lawrence Summers, who last week suggested a "meaningful chance" of the next adjustment being an "upside in rates, not downwards."
This perspective is echoed by some economists who acknowledge the formidable challenges that lie in the final stages of the inflation battle. However, more would believe, at least at this stage, that maintaining the current interest rate level for an extended period may be more pragmatic than implementing another hike, only to revert to cuts more swiftly.
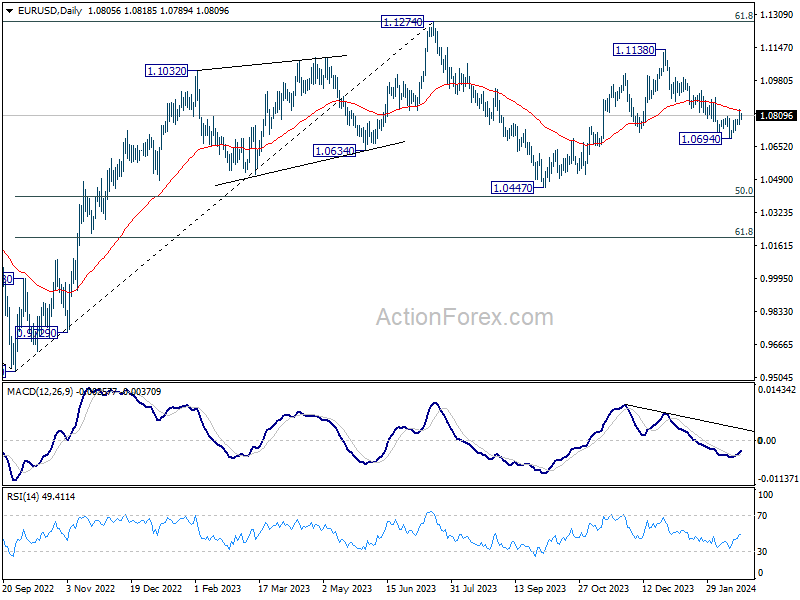
From a technical standpoint, EUR/USD's response to FOMC minutes will be particularly telling. Sustained, decisive break of 55 D EMA (now at 1.0832) will argue that the pull back from 1.1138 has completed at 1.0694. That would also argue that rise from 1.0447 is ready to resume through 1.1138 to retest 1.1274 high. Meanwhile, rejection by 55 D EMA will retain near term bearishness for another fall through 1.0694. We could know the answer very soon. The market's reaction to the FOMC minutes could provide clarity on this front shortly.
In Europe, at the time of writing, FTSE is down -0.95%. DAX is up 0.17%. CAC is flat. UK 10-year yield is up 0.0132 at 4.057. Germany 10-year yield is up 0.0212 at 2.398. Earlier in Asia, Nikkei fell -0.26%. Hong Kong HSI rose 1.57%. China Shanghai SSE rose 0.97%. Singapore Strait Times fell -0.83%. Japan 10-year JGB yield fell -0.0070 to 0.726.
Fed's Barkin: Recent data makes things harder for Fed
Richmond Fed President Thomas Barkin characterized the stronger-than-expected inflation data for January as a significant challenge.
At an interview, Barkin acknowledged that the recent date "definitely did not make things easier" for Fed. Instead, "it made things harder." Nevertheless, he was still cautious about overemphasizing the significance of these figures, citing "seasonal measurement issues" that might distort the month's data.
Barkin also emphasized that the US States is "on the back end of its inflation problem." The critical question is "how much longer it will take" for inflation to align with Fed's target.
Japan's government reports stall in consumption and manufacturing slide
The Japanese government maintains its assessment that the economy is "recovering at a moderate pace", but with a of caution with the observation that the recovery "recently appears to be pausing."
A critical shift noted in the Monthly Economic Report concerns private consumption, which has been downgraded from "picking up" to "pausing for picking up." Additionally, while there was optimism surrounding industrial production, the report highlights a recent decline in manufacturing activities attributed to production and shipment suspensions by some automotive manufacturers.
The report maintains unchanged assessments in several other economic indicators. Business investment and exports, similar to private consumption and industrial production, are described as "pausing for picking up."
On a positive note, corporate profits are reported to be improving overall, and firms' judgments on current business conditions are becoming more favorable.
Additionally, employment situation is showing signs of improvement. Consumer prices, meanwhile, continue to rise "moderately".
Australia Westpac leading index falls to -0.25%, sub-par growth to continue
Australia's economy is bracing for continued "sub-par growth" into 2024, as indicated by the downturn in the Westpac Leading Index, which dipped from -0.01% to -0.25% in January. Westpac anticipates the economic growth rate to hover around an annualized 1.3% in the first half of this year, marking an improvement from the latter half of 2023's 0.8%, yet remaining significantly below the usual trend rate of about 2.5%.
In the realm of monetary policy, Westpac's analysis suggests a measured approach by RBA. The central bank is expected to take additional time to gain "sufficient confidence" that inflation will revert to target range within a reasonable timeframe. Economic indicators leading up to the March meeting are projected to reinforce a narrative of "weak growth and demand environment domestically," which would justify RBA's decision to maintain its current policy stance.
This cautious period of observation is likely to precede any shift towards a more definitive "on hold" position by the Board, with considerations for interest rate cuts anticipated to emerge further down the line.
Japan's exports rises 11.9% yoy in Jan, imports down -9.6% yoy
Japan's export recorded 11.9% yoy increase to JPY 7333B in January, marking the second consecutive month of growth. However, imports saw a contrasting trend, decreasing by -9.6% yoy to JPY 9091B. This resulted in a trade deficit of JPY -1758B for the month.
A notable highlight from the trade data was Japan's trade surplus with the US, amounting to JPY 415B, as exports reached an all-time high for the month at JPY 1.42T.
Conversely, Japan faced a JPY -959.52B trade deficit with China, another significant trading partner. Despite this deficit, exports to China were supported by strong demand for chip-making equipment and cars.
On seasonally adjusted basis, exports registered decline of -3.6% mom to JPY 8765B, while imports fell more sharply by -10.5% mom to JPY 8230B. This shift led to trade surplus of JPY 235B.
Australia's Q4 wage growth hits 4.2%, driven by sharp public sector increase
Australia's wage price index rose 0.9% qoq in Q4, decelerating from the previous quarter's 1.3% qoq increase, but in line with market expectations. Annually, wage growth ticked up from 4.1% yoy to 4.2% yoy, marking the highest rate since Q1 2009.
A closer look at sector-specific data reveals that private sector annual wage growth slowed slightly from 4.3% yoy to yoy. In contrast, public sector wage growth accelerated sharply from 3.5% yoy to 4.3% yoy, the highest rate since Q1 2010.
The surge in public sector wages underscores the impact of cyclical patterns of enterprise bargaining, as highlighted by Michelle Marquardt, ABS head of prices statistics. She noted, "In the December quarter 2023, 38 percent of public sector jobs saw a wage rise, considerably higher than the 29 percent from the same quarter in the previous year."
Furthermore, average hourly wage change for these jobs escalated to 4.3%, surpassing 2.8% recorded at the same time last year and achieving the highest level since September 2008.
USD/CHF Mid-Day Outlook
Daily Pivots: (S1) 0.8791; (P) 0.8814; (R1) 0.8843; More....
USD/CHF dips mildly today but stays in range of 0.8727/8884. Intraday bias remains neutral and more consolidations could be seen. With 0.8727 resistance turned support intact, further rally is still expected. On the upside, break of 0.8885 will resume the rise from 0.8332 and target and 100% projection of 0.8332 to 0.8727 from 0.8550 at 0.8954. However, sustained break of 0.8727 will dampen this bullish view, and turn bias back to the downside for 0.8550 support instead.
In the bigger picture, a medium term bottom should be formed at 0.8332, on bullish convergence condition in W MACD, just ahead of 0.8317 long term fibonacci support. It's still early to decide if the larger down trend from 1.0146 (2022 high) is reversing. But further rise should be seen to 0.9243 resistance even as a correction.
Economic Indicators Update
| GMT | Ccy | Events | Actual | Forecast | Previous | Revised |
|---|---|---|---|---|---|---|
| 21:45 | NZD | PPI Input Q/Q Q4 | 0.90% | 0.40% | 1.20% | |
| 21:45 | NZD | PPI Output Q/Q Q4 | 0.70% | 0.40% | 0.80% | |
| 23:50 | JPY | Trade Balance (JPY) Jan | 0.24T | -0.23T | -0.41T | -0.44T |
| 00:00 | AUD | Westpac Leading Index M/M Jan | -0.10% | 0.00% | ||
| 00:30 | AUD | Wage Price Index Q/Q Q4 | 0.90% | 0.90% | 1.30% | |
| 07:00 | GBP | Public Sector Net Borrowing (GBP) Jan | -17.6B | -18.4B | 6.8B | 6.5B |
| 13:30 | CAD | New Housing Price Index M/M Jan | -0.10% | 0.10% | 0.00% | |
| 15:00 | EUR | Eurozone Consumer Confidence Feb P | -16 | -16 | ||
| 19:00 | USD | FOMC Minutes |
Fed’s Barkin: Recent data makes things harder for Fed
Richmond Fed President Thomas Barkin characterized the stronger-than-expected inflation data for January as a significant challenge.
At an interview, Barkin acknowledged that the recent date "definitely did not make things easier" for Fed. Instead, "it made things harder." Nevertheless, he was still cautious about overemphasizing the significance of these figures, citing "seasonal measurement issues" that might distort the month's data.
Barkin also emphasized that the US States is "on the back end of its inflation problem." The critical question is "how much longer it will take" for inflation to align with Fed's target.
WTI Oil: Price Eases Further, as US Rate Outlook Offsets Persisting Middle East Worries
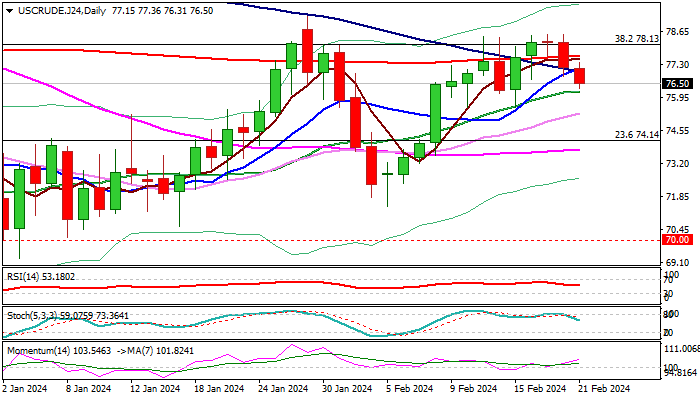
WTI Oil extends pullback into second consecutive day after recent rally repeatedly failed to clearly break pivotal Fibo barrier at $78.13.
Subsequent easing is generating an initial signal of reversal and formation of a lower platform at $78.50 zone, as fresh bears broke below 200DMA ($77.65) and converged 10/100DMA’s ($77.12), though close below these levels is required to verify signal.
Technical indicators on daily chart are conflicting as MA’s are in mixed setup, positive momentum is still strong and stochastic is heading south, after forming a bearish divergence, which requires further evidence of near-term direction.
Fresh weakness eyes next targets at $75.81/64 (Fibo 38.2% of $71.40/$78.53 / daily cloud top), which guard lower pivot at $74.97 (50% retracement / daily Kijun-sen), loss of which will weaken near-term structure and open way for deeper fall.
Conversely, return and close above 200DMA would improve near-term picture, but sustained break above recent tops at $78.50 zone will be required to bring bulls back to play.
Oil’s sentiment soured on signs that the Fed is not in hurry to start cutting interest rates, which offset oil-supportive factors from persisting fears about supply from the Middle East and tensions in the Red Sea.
This suggests that fundamentals will remain oil price’s key drivers, with focus turning on comments from FOMC minutes, which would further deflate the price if the US policymakers maintained hawkish stance and signal no changes in the monetary policy in the near future, but also no hints about the time of start of rate cuts.
Res: 76.99; 77.65; 78.50; 79.27.
Sup: 76.17; 75.81; 74.97; 74.12.
Australian Dollar Pares Gains after Strong Wage Growth
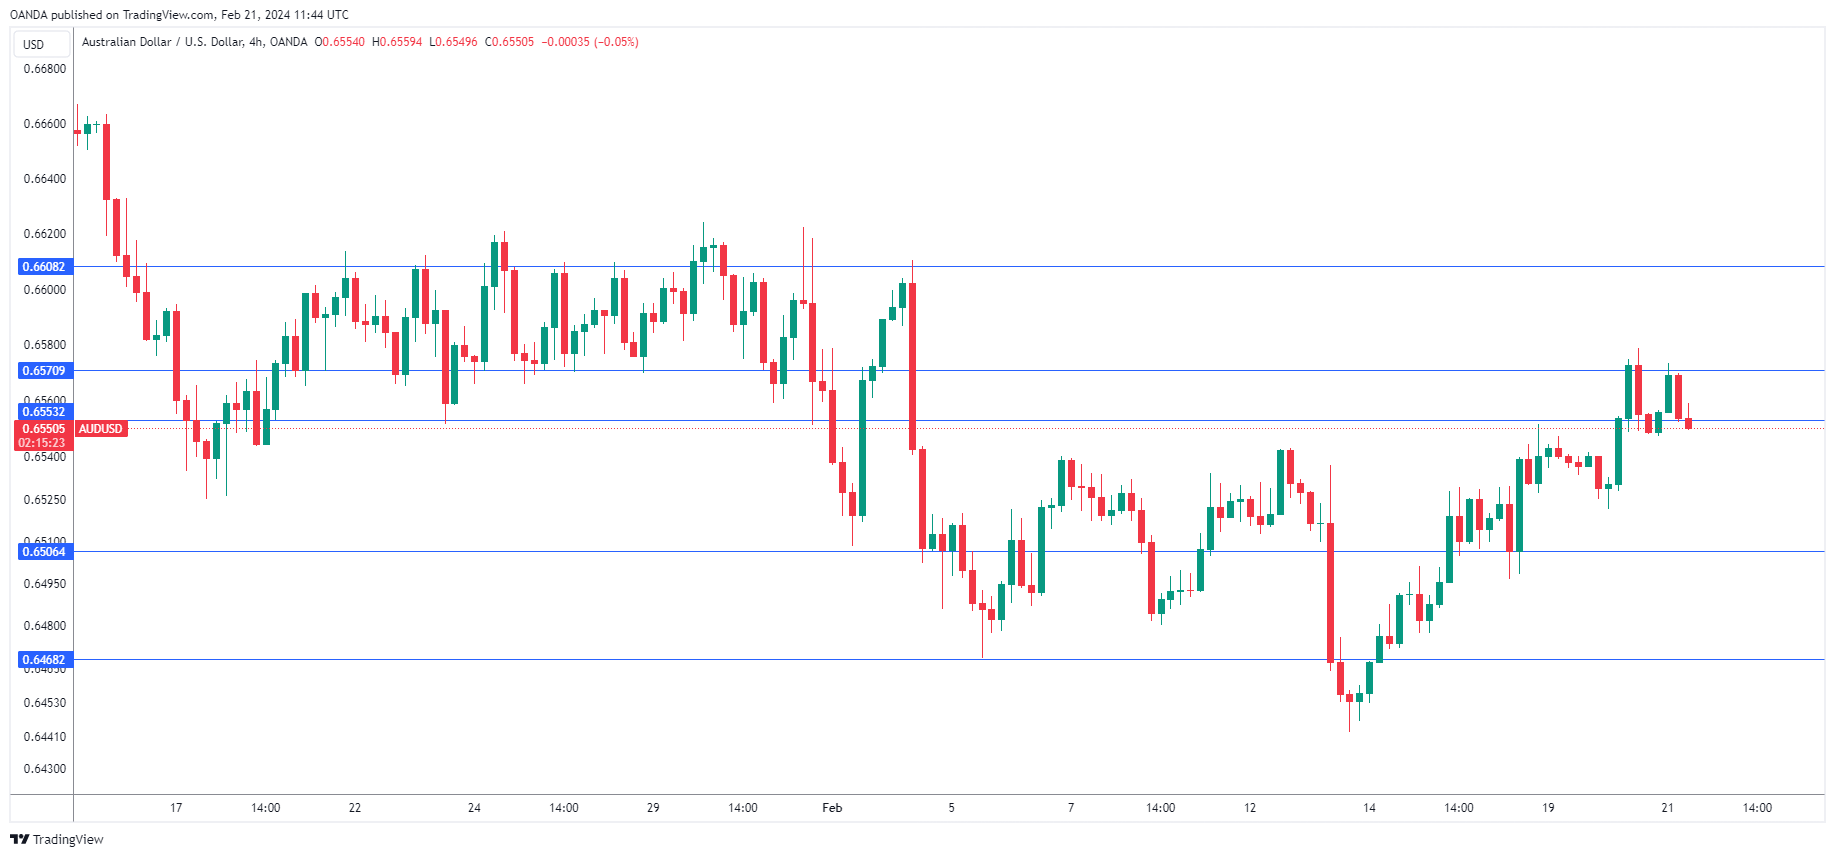
The Australian dollar continues to climb and has put together a five-day winning streak. The Aussie rose as much as 0.36% earlier but has pared most of these gains and is currently trading at 0.6552 in the European session, up 0.05%.
Wage Price Index climbs 4.2% in Q4
Australia’s wage price index (WPI) rose 4.2% y/y in the fourth quarter, up from a revised 4.1% gain in the third quarter and above the market estimate of 4.1%. This was the highest reading since Q1 of 2009, as wages rose in both the public and private sectors. Significantly, this was the first time since 2021 that the WPI has exceeded consumer price inflation, which is running at 4.1%.
The rise in annual wage growth grabbed the headlines and gave a boost to the Australian dollar, but on a quarterly basis the numbers paint a different picture. Wages rose 0.9%, easing from the 1.3% gain in the fourth quarter. The decline in wage growth could signal that robust labour market is showing cracks, which would be a welcome sign for the Reserve Bank of Australia in its campaign to bring inflation back down to the 1 to 3 percent target band.
The markets believe that the RBA’s tightening cycle is over but aren’t expecting interest rates to come down in the near term. Investors have priced in only 38 basis points in cuts in 2024, with an initial cut not expected until August or September. The RBA is unlikely to jump on the rate-cut bandwagon until it is convinced that inflation will continue to fall or the strong labour market shows signs of cooling.
AUD/USD Technical
- AUD/USD tested resistance at 0.6570 earlier. Next, there is resistance at 0.6608
- 0.6570 and 0.6608 are providing support
WTI and Brent React To a Key Pivot
Brent oil is currently on a bullish trend, facing resistance near $84 and supported by the 200-day EMA. Breaking above this level could lead to a climb towards $90. Short-term support is observed around $80, backed by the 50-day EMA. As summer approaches and travel increases, crude oil tends to benefit from seasonal patterns. Despite temporary setbacks, buying opportunities are anticipated in a market with declining supply. Traders are also watching for potential economic stimulus from central bank rate cuts, which could lift commodity prices, especially oil. While the oil market is a key indicator of global economic health, its volatility remains a challenge. Overall, there's a bullish sentiment, albeit with lingering challenges.
XBRUSD - D1 Timeframe
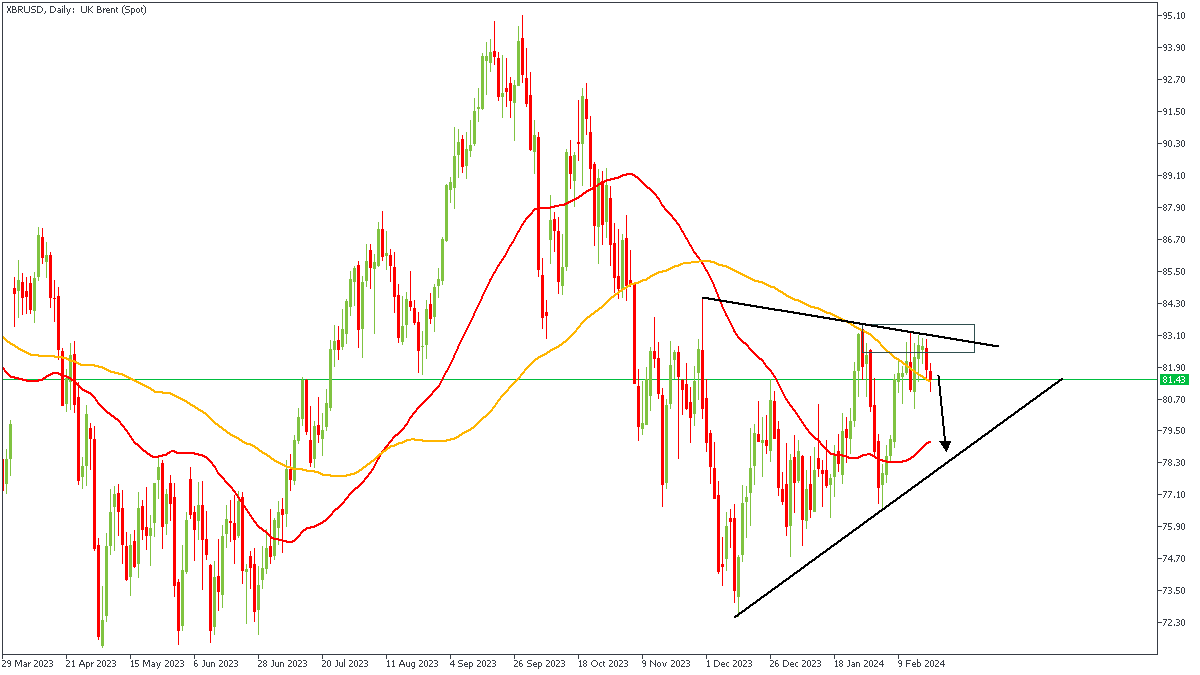
Brent (XBRUSD) on the daily timeframe has just been rejected off the rally-base-drop supply zone, which is in alignment with the trendline resistance, and the bearish array of the moving averages, as well as the 100-day moving average resistance. In light of these confluences, I will be expecting a continuation of the bearish movement with a target at the confluence of the 50-day moving average and the trendline support.
Analyst’s Expectations:
- Direction: Bearish
- Target: $79.13
- Invalidation: $83.60
XTIUSD - D1 Timeframe
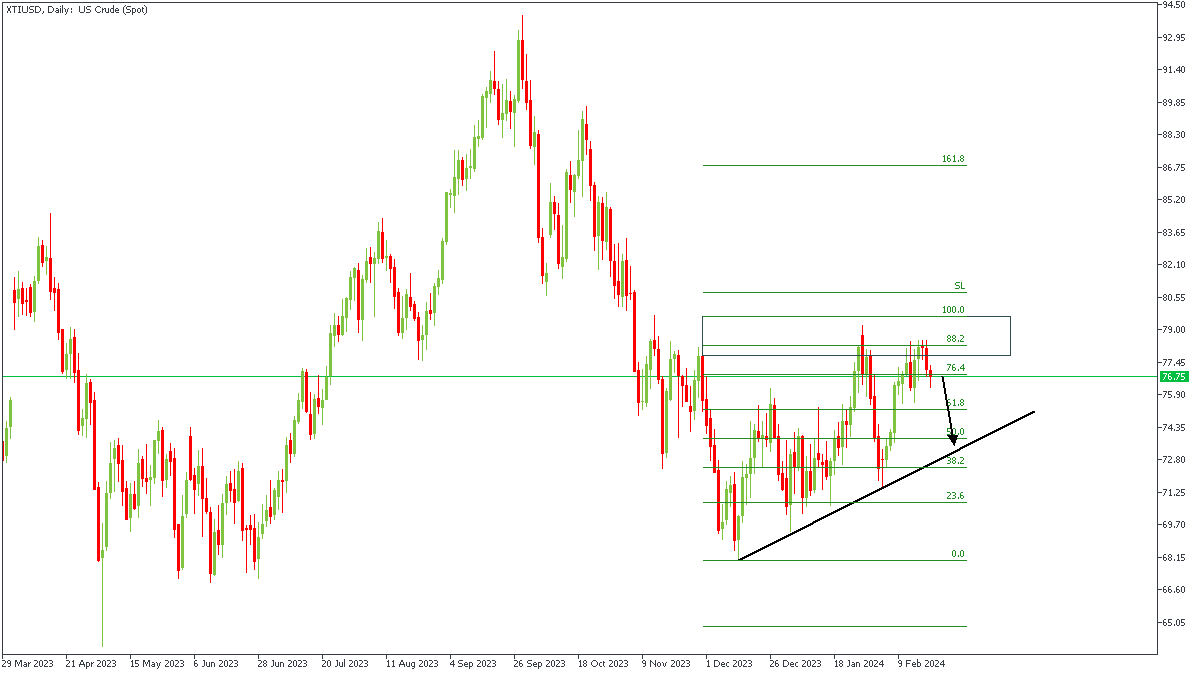
XTIUSD (USOIL) has recently reacted to the bearish pressure from the rally-base-drop supply zone around the 88% Fibonacci retracement level. In light of this, I perceive that price could slide further down till it reaches the trendline support, before we get to see a possible continuation of the bullish pressure.
Analyst’s Expectations:
- Direction: Bearish
- Target: $73.83
- Invalidation: $79.65
CONCLUSION
The trading of CFDs comes at a risk. Thus, to succeed, you have to manage risks properly. To avoid costly mistakes while you look to trade these opportunities, be sure to do your due diligence and manage your risk appropriately.
XAUUSD: Will Gold Continue to Rally?
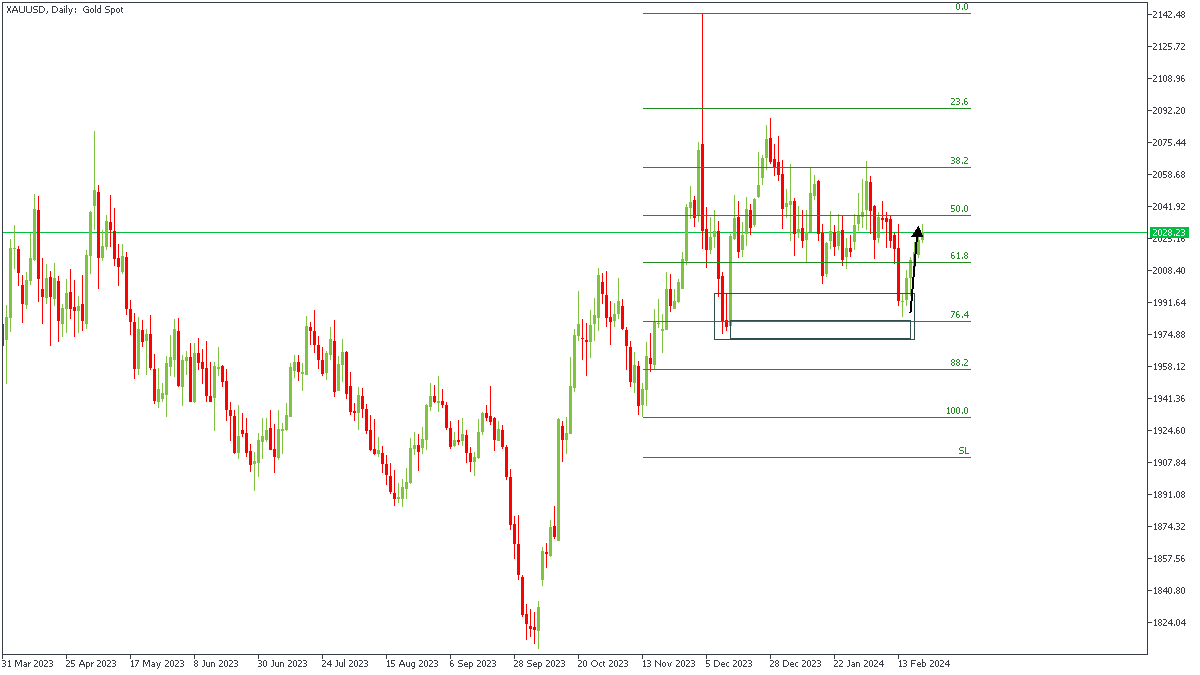
Last week I gave a trade idea on XAUUSD with a target around the $2,020 price line. At the time of writing, XAUUSD already exceeded the target and I’m sure that would leave a lot of people wondering what to expect next. Below, I have presented my view of how I expect the price action to turn out in the meantime.
XAUUSD - D1 Timeframe
On the daily timeframe, we see that price has reached the target area, whilst approaching the 50% mark of the Fibonacci retracement tool. The lingering question at this moment seems to be whether or not the bullish pressure will continue. In my opinion, I expect to see a short decline in bullish pressures, which should give the price action enough room to regain its momentum.
XAUUSD - H4 Timeframe
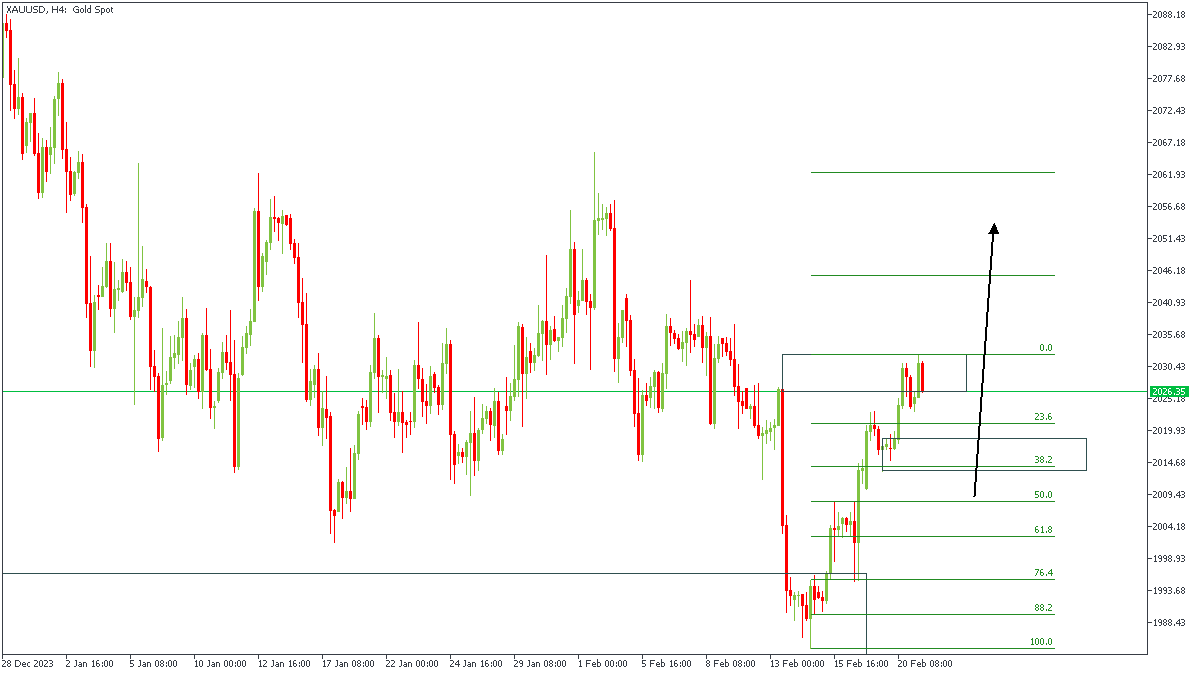
On the 4-hour timeframe of XAUUSD, price has reached a minor rally-base-drop supply zone, and is expected to bounce off in reaction to the bearish pressure from that zone. However, I perceive this to be simply a retracement move, which is why I have drawn the Fibonacci retracement tool in a bid to show the expected area for the bullish continuation.
Analyst’s Expectations:
- Direction: Bullish
- Target: $2046.27
- Invalidation: $1983.61
CONCLUSION
The trading of CFDs comes at a risk. Thus, to succeed, you have to manage risks properly. To avoid costly mistakes while you look to trade these opportunities, be sure to do your due diligence and manage your risk appropriately.
NZDUSD Prepares to Switch to a Bull Market
- NZDUSD prints bullish trend pattern
- Constraining 50-day SMA under examination again
- FOMC meeting minutes due for release at 19:00 GMT
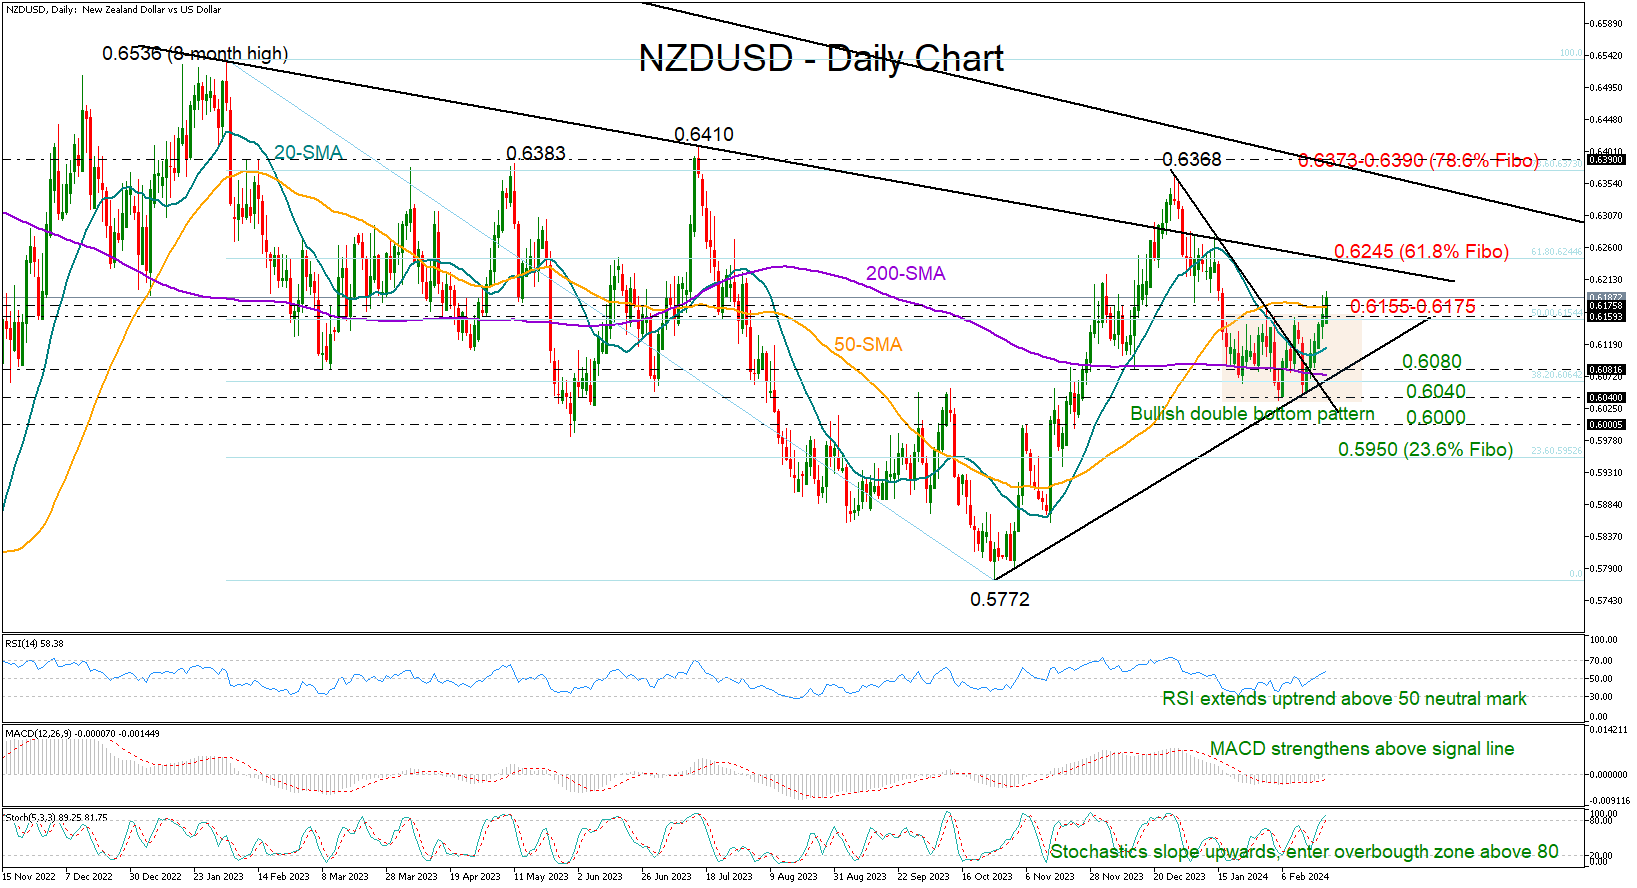
NZDUSD is looking to complete a bullish double bottom pattern above the 0.6155 neckline and the 50% Fibonacci retracement of the February-October 2023 downtrend.
Technically, the bulls could dominate in the coming sessions as the RSI has extended its upward pattern above its 50 neutral mark and the MACD continues to strengthen above its red signal line. Meanwhile, the stochastic oscillator has entered the overbought zone above 80, warning that potential price increases might be transitory.
The 50-day simple moving average (SMA), which has been capping upside movements over the past couple of weeks, is currently under the spotlight at 0.6175. A close above it could push the price straight up to the 61.8% Fibonacci mark of 0.6245, while higher, the market could experience a fast rally towards December’s peak of 0.6368 and the 0.6390 barrier.
Should the sellers take over, squeezing the price back below the 50% Fibonacci of 0.6155, support could come somewhere between the 200-day simple moving average (SMA) and the 0.6040 zone. Note that the 38.2% Fibonacci of 0.6064 and the ascending trendline from October’s lows are also within the region. Therefore, a bearish correction at this point might confirm an extension to 0.6000 and then down to the 23.6% Fibonacci of 0.5950.
Summing up, NZDUSD is setting the stage for another bullish round, with traders awaiting another positive close above the 50-day SMA and the 0.6155 territory to confirm a positive trend pattern.