

Sample Category Title
USDCAD Wave Analysis
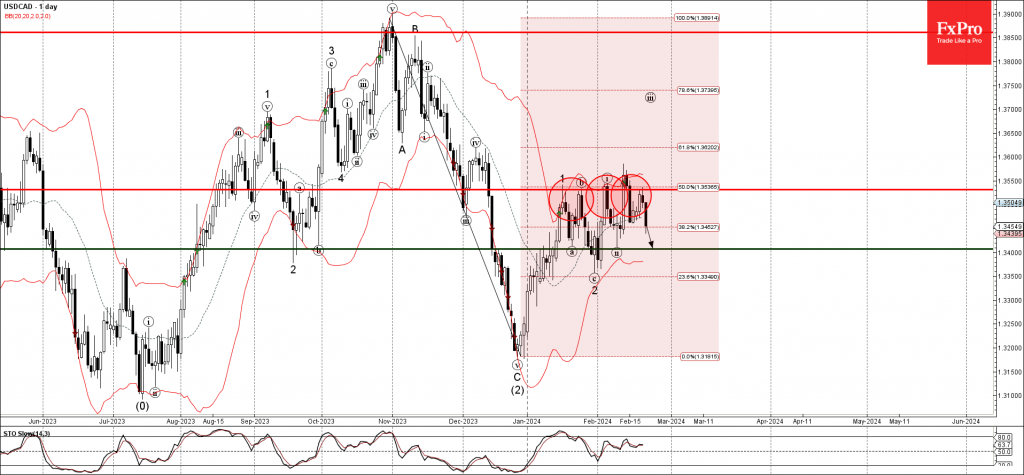
- USDCAD reversed from resistance level 1.3530
- Likely to fall to support level 1.3400
USDCAD currency pair recently reversed down from the pivotal resistance level 1.3530 (which has been repeatedly reversing the pair from the middle of January).
The downward reversal from the resistance level 1.3530 will most likely form the daily Evening Star today – strong sell signal for this currency pair.
USDCAD currency pair can be expected to fall further to the next support level 1.3400, which stopped the previous minor correction ii.
EUR/USD Analysis: Euro Showing Signs of Strength
Today news was published about the values of PMI indices for European economies. Data from France was encouraging:
→ French Flash Manufacturing PMI: actual = 46.8, expected = 43.5, a month ago = 43.1;
→ French Flash Services PMI: actual = 48.0, expected = 45.7, a month ago = 45.4.
Data from Germany were less optimistic, so the euro's rise was interrupted, but in the end the euro still rose in price on this news relative to other currencies.
For example, the price of EUR/JPY broke through the resistance level of 163 yen per euro — the euro rose to this level for the first time since November last year.
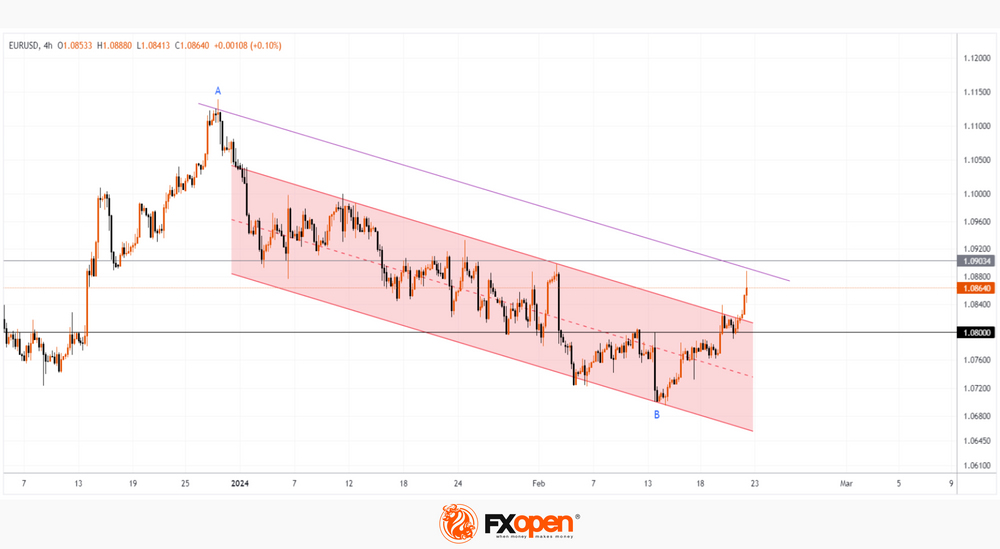
The EUR/USD chart shows an attempt to break out of the bearish channel (shown in red). Of interest are:
→ level 1.08 – it acted as resistance in mid-February, but is already showing signs of support;
→ level 1.09 – the price of EUR/USD also reacted to it in the past, and in addition – in this area there is a 50% Fibo level from the decline in A→B;
→ the resistance line (drawn from point A in purple) can also affect the price.
How strong the bulls really are will be determined by the price action near the block of the listed resistances, as well as by the reaction to news about the US PMI; data will be published today, at 17:45 GMT+3.
Trade over 50 forex markets 24 hours a day with FXOpen. Take advantage of low commissions, deep liquidity, and spreads from 0.0 pips. Open your FXOpen account now or learn more about trading forex with FXOpen.
This article represents the opinion of the Companies operating under the FXOpen brand only. It is not to be construed as an offer, solicitation, or recommendation with respect to products and services provided by the Companies operating under the FXOpen brand, nor is it to be considered financial advice.
NASDAQ (NQ_F) Elliott Wave: Buying The Dips At The Blue Box Area
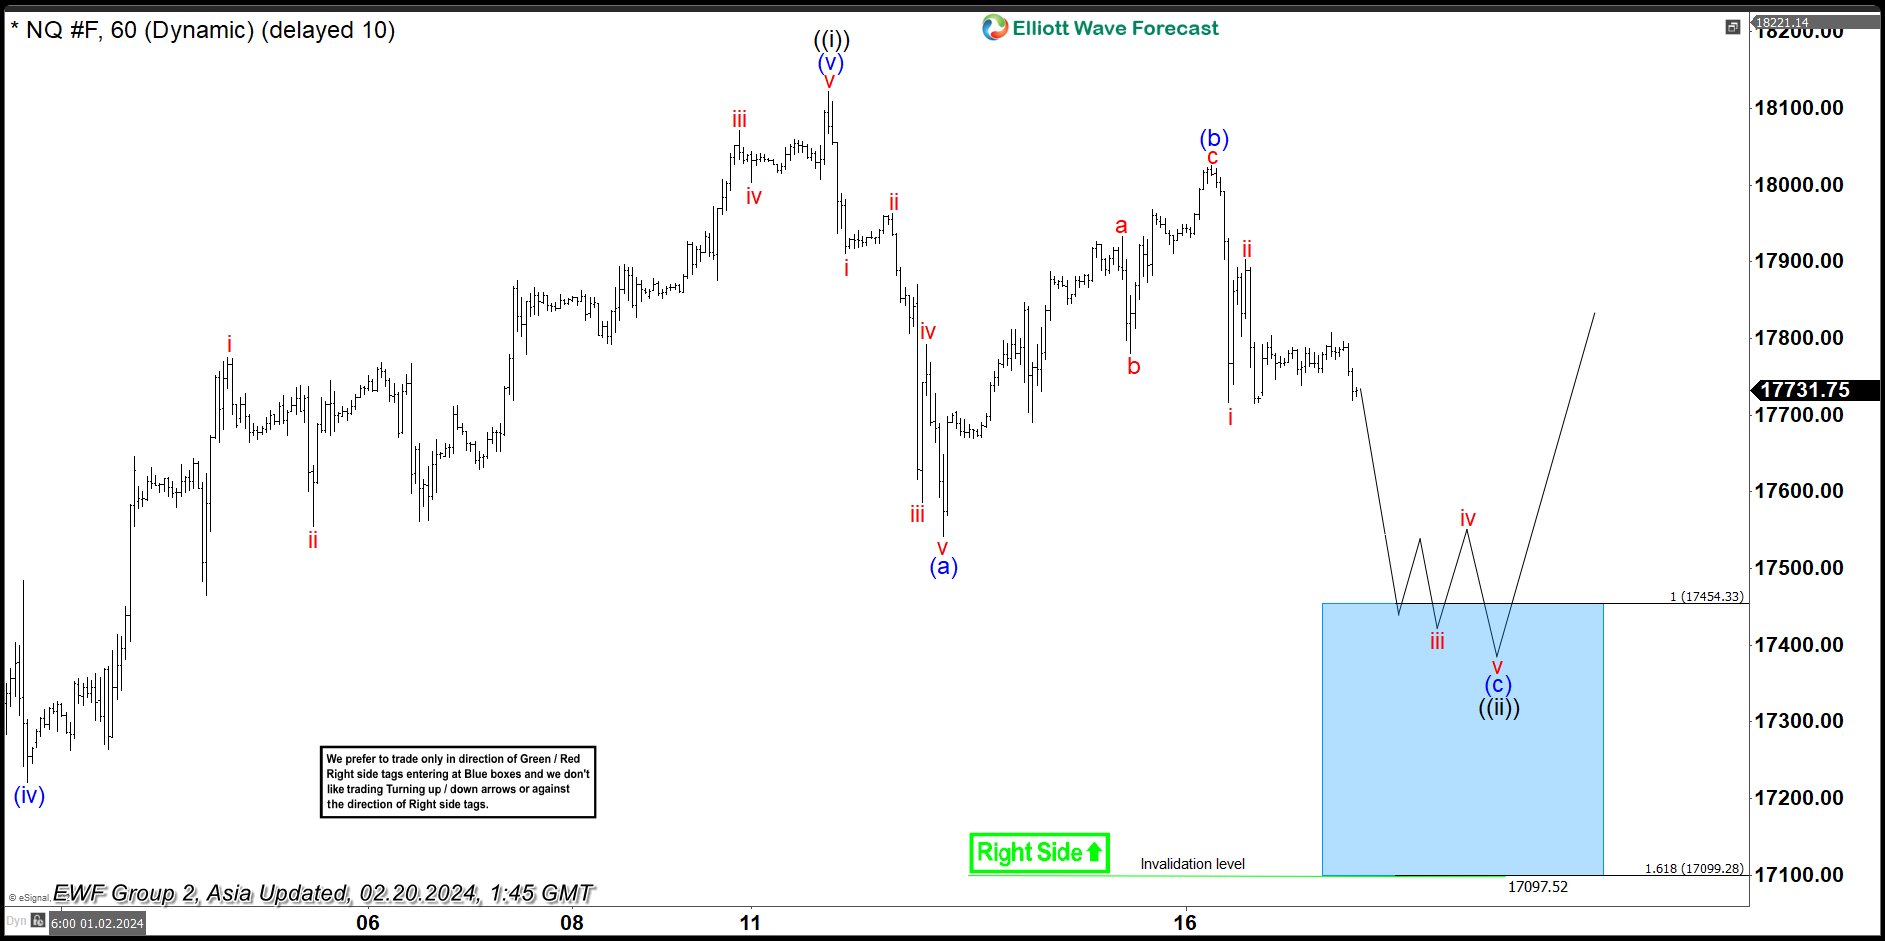
Hello fellow traders. In this technical article we’re going to take a look at the Elliott Wave charts charts of NASDAQ Futures published in members area of the website. As our members know NASDAQ has recently made pull back that has unfolded as Elliott Wave Zig Zag pattern. It made clear 3 waves down from the February 12th peak and completed correction right at the Equal Legs zone ( Blue Box Area) . In further text we’re going to explain the Elliott Wave pattern and trading setup.
NASDAQ Elliott Wave 1 Hour Chart 02.20.2024
NASDAQ has made 5 waves down from the peak, suggesting we have potentially ended only first leg of the correction that is unfolding as a Elliott Wave Zig Zag pattern. Correction has (a)(b)(c) labeling. The price structure is incomplete at the moment, calling for a more downside in near term toward : 17454.3-17099.2. We don’t recommend selling NASDAQ and prefer the long side from the marked Blue Box ( buying zone). Once NQ_F reaches our buying area, it should ideally make either rally toward new highs or in 3 waves bounce alternatively. Once bounce reaches 50 Fibs against the (b) blue high, we will make long position risk free ( put SL at BE) and take partial profits.
Official trading strategy on How to trade 3, 7, or 11 swing and equal leg is explained in details in Educational Video, available for members viewing inside the membership area.
Quick reminder on how to trade our charts :
Red bearish stamp+ blue box = Selling Setup
Green bullish stamp+ blue box = Buying Setup
Charts with Black stamps are not tradable. 🚫
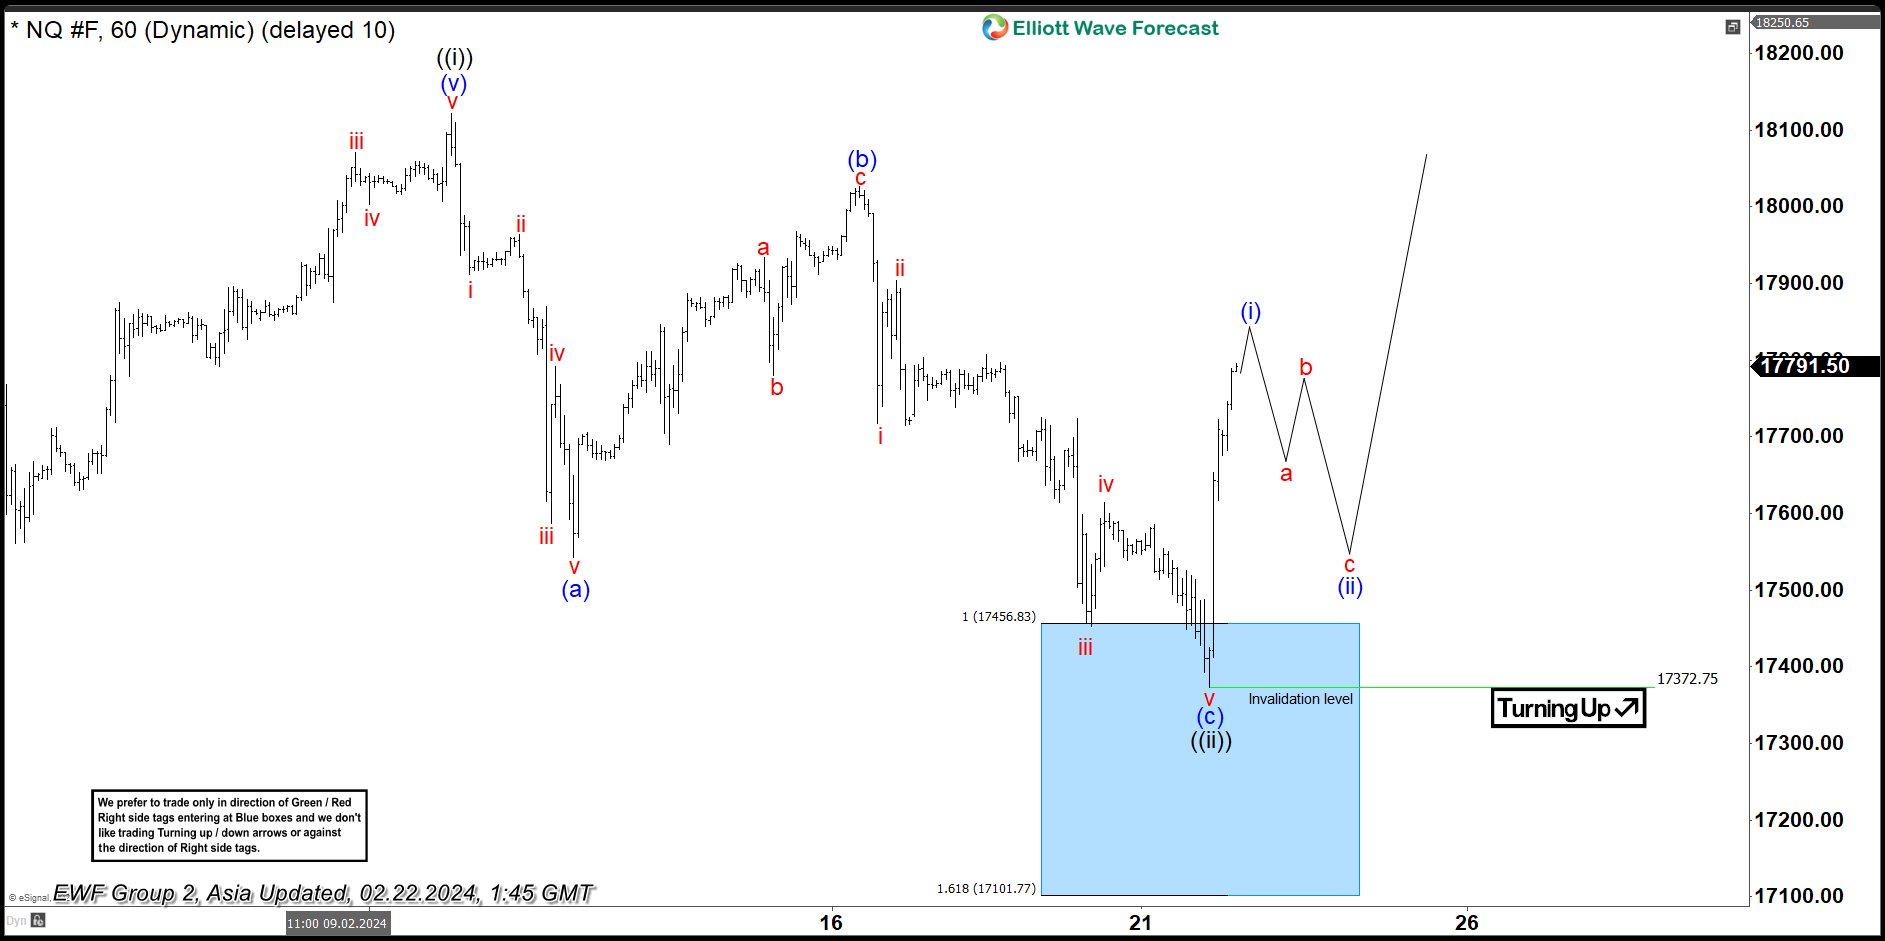
NASDAQ Elliott Wave 1 Hour Chart 02.22.2024
NASDAQ made extension toward our buying zone at : 17454.3-17099.2 as we expected. NQ futures found buyers at the blue box and we are getting very good reaction from there. Bounce already reached 50 fibs against the (b) blue connector which confirms cycle from the peak is done. Consequently, any long positions from the equal legs area should be risk free by now. As far as the price stays above 17372.7 low, we can see further strength in NASDAQ targeting 18306 area ideally.
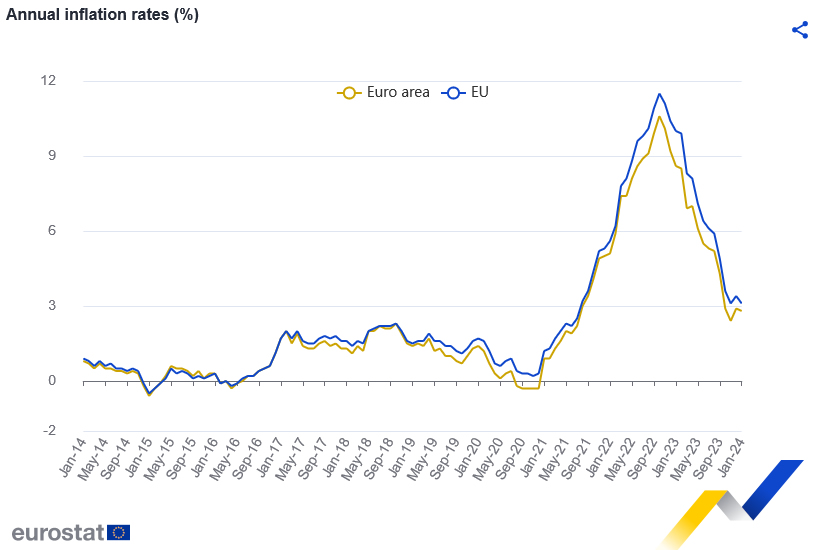
Eurozone CPI finalized at 2.8% in Jan, core at 3.3%
Eurozone CPI was finalized at 2.8% yoy in January, down from December's 2.9% yoy. Core CPI was finalized at 3.3% yoy, down from prior month's 3.4% yoy. The highest contribution to came from services (+1.73 percentage points, pp), followed by food, alcohol & tobacco (+1.13 pp), non-energy industrial goods (+0.53 pp) and energy (-0.62 pp).
EU CPI was finalized at 3.1% yoy. The lowest annual rates were registered in Denmark, Italy (both 0.9%), Latvia, Lithuania and Finland (all 1.1%). The highest annual rates were recorded in Romania (7.3%), Estonia (5.0%) and Croatia (4.8%). Compared with December, annual inflation fell in fifteen Member States, remained stable in one and rose in eleven.
EURUSD Jumps to Test Critical Resistance
- EURUSD has its best week of the year
- Downside risks remain around 1.0880
- EZ flash business PMIs show a mixed picture
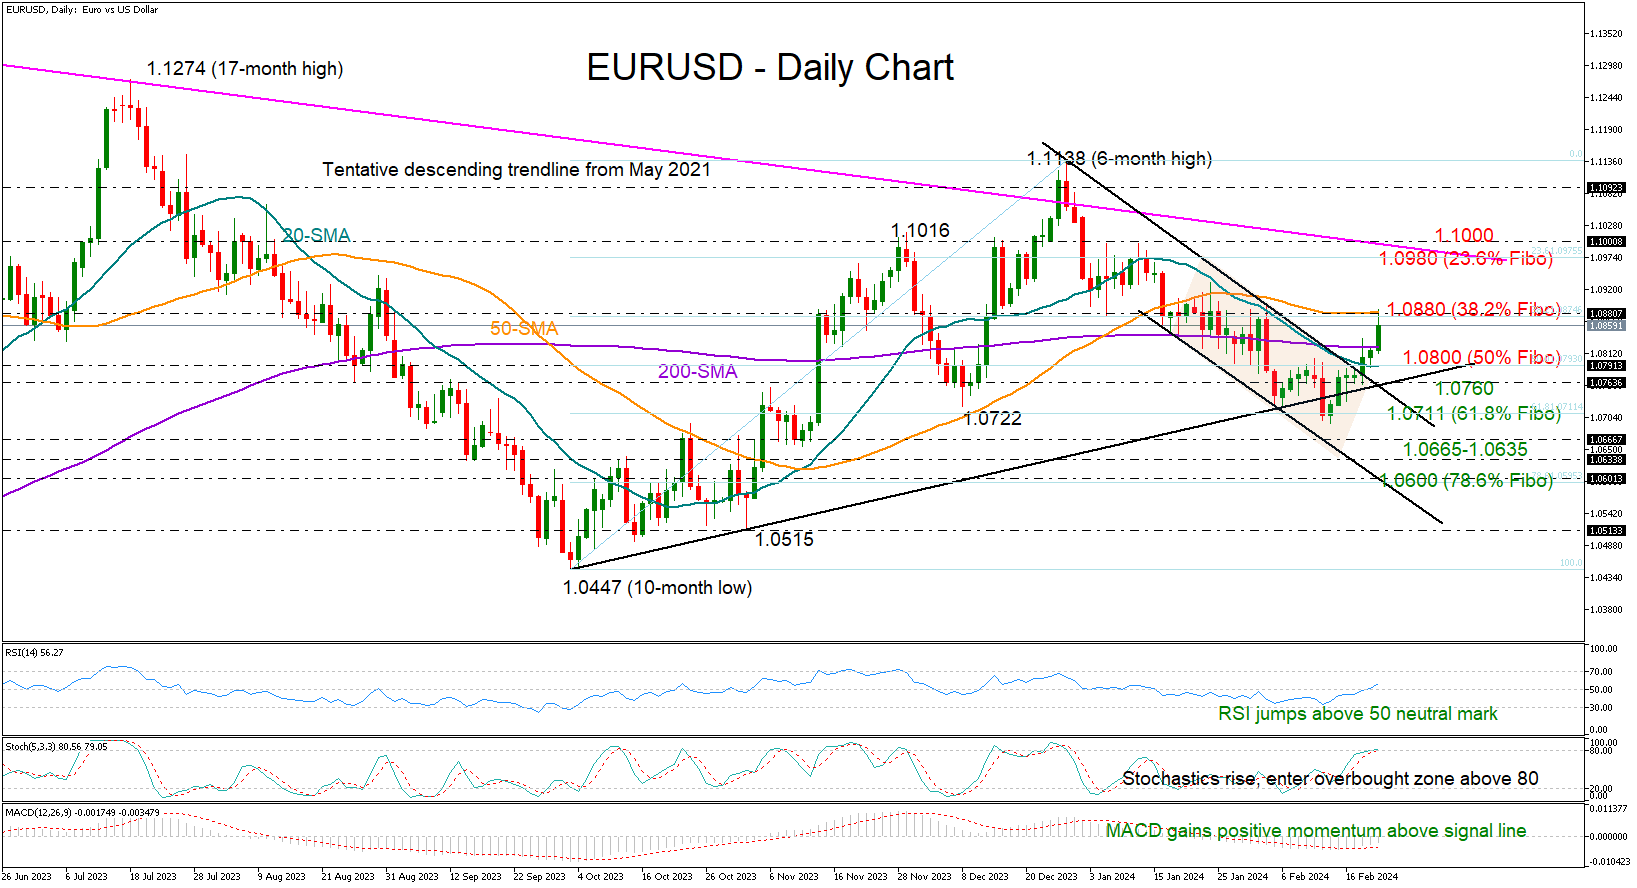
EURUSD is in the seventh day of gains, marking its longest bull run in a while to reach the critical 1.0880 bar. Disappointingly, Eurozone's flash business PMI figures for February could not lift the pair above that threshold earlier today as the manufacturing sector continued to shrink, but the technical indicators are still in the bullish area.
The RSI has clearly jumped back above its 50 neutral mark, and the MACD keeps progressing above its red signal line, painting a rosy picture for the short-term. The positive slope in the stochastic oscillator is endorsing that scenario too, though with the indicator entering the overbought zone, room for improvement could be limited.
If the pair successfully claims the 1.0880 threshold, it is expected to rise rapidly towards the 1.0980 level and the 23.6% Fibonacci retracement of the October-December 2023 uptrend. The 1.1000 psychological mark, which coincides with the resistance trendline from May 2021, will be closely watched as well before the spotlight turns again to the 1.1100-1.1138 peak area from December.
On the downside, the 50% Fibonacci of 1.0790 and the 20-day SMA could calm selling pressures ahead of the ascending trendline from October at 1.0760. Failure to rebound there could see a correction towards the 61.8% Fibonacci of 1.0711, while a steeper decline may pause somewhere between 1.0665 and 1.0635. Next, the bears might attempt to sink the price below the broken bearish channel at 1.0600.
In brief, EURUSD is enjoying its best weekly session so far this year, though an extension above the 1.0880 barricade is still required to break up the 2024 negative trend and therefore brighten the short-term outlook.
UK PMI composite rises to 53.3, growth accelerates as inflation concerns loom
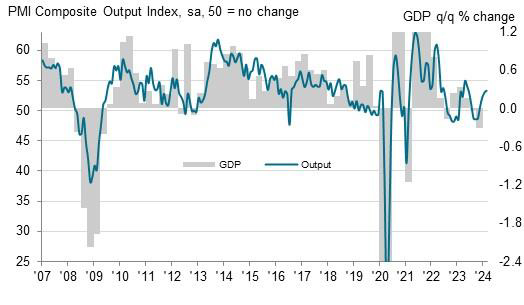
UK's PMI Manufacturing edged up from 47.0 to 47.1, aligning with expectations, while PMI Services was steady at 54.3, just shy of the anticipated 54.4. PMI Composite index rose from 52.9 to 53.3, underscoring a period of accelerated economic growth and marking the highest reading in nine months.
Chris Williamson, Chief Business Economist at S&P Global Market Intelligence, emphasized the significance, noting that recent uptick is part of a consistent pattern of improvement over the "four straight months". Williamson's analysis suggests that the economy is expanding at a quarterly rate of 0.2-0.3% in Q1 2024, signaling that UK's recessionary phase may have concluded.
Williamson highlighed supply chain disruptions, particularly those related to Red Sea shipping, have led to the most significant delays observed in over 18 months. These disruptions have escalated shipping costs, contributing to a notable increase in selling prices for goods—the largest monthly rise seen in nine months.
Moreover, service sector inflation has edged higher due to increased wage costs and the indirect effects of rising goods prices. The survey data suggest consumer price inflation may hover around 4% in the coming months, doubling BoE's target rate.
Given these dynamics—accelerating growth coupled with rising prices—February's PMI data suggests that BoE are "increasingly likely to err on the side of caution" towards reducing interest rates.
WTI Oil Futures in Fierce Battle with 200-SMA
- WTI futures hover around the 200-day SMA
- Failure to edge higher might lead to a double top
- Oscillators suggest intensifying positive momentum
WTI oil futures (April delivery) have been staging a comeback following their break above the 50-day simple moving average (SMA) in early February. However, the recovery seems to be on hold for now as the 200-day SMA has been curbing the price’s upside.
Given that both the RSI and MACD are tilted to the upside, the bulls might attack 79.61, which is the 50.0% retracement of the 64.20-95.02 upleg. Further advances could then stall around the 38.2% Fibo of 83.25. Surpassing that zone, the price could ascend to face the 23.6% Fibo of 87.75.
On the flipside, if sellers re-emerge and push the price back below the 200-day SMA, initial support could be found at 61.8% Fibo of 75.97. Lower, the November bottom of 72.40 could act as the next line of defence. A violation of that zone could set the stage for the 78.6% Fibo of 70.80.
In brief, WTI oil futures' recovery has stalled as the price has been trading sideways around the 200-day SMA in the past few sessions. Therefore, a clear jump above the latter is needed for the short-term rebound to resume.
Eurozone PMI composite rises to 48.9, a step towards recovery amid German drag
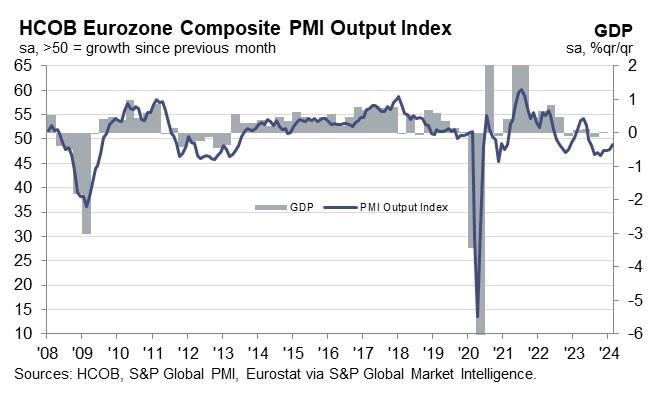
Eurozone PMI Manufacturing dipped further from 46.6 to 46.1 in February, undershooting expectations of a 47.1 reading and signaling continued contraction. Conversely, PMI Services climbed from 48.4 to neutral mark of 50.0, surpassing the forecast of 48.7 and reaching a 7-month high. This uplift in services contributed to PMI Composite's rise from 47.9 to 48.9, marking an 8-month peak yet still indicating slight overall economic contraction.
Norman Liebke, Economist at Hamburg Commercial Bank, cited a "glimmer of hope" as Eurozone edges closer to recovery, particularly within the services sector. Despite the manufacturing downturn, Liebke reaffirms an annual growth forecast of 0.8% for 2024.
ECB is likely to find the latest PMI figures concerning, especially with output prices increasing for the fourth consecutive month, largely driven by labor-intensive services sector grappling with rising wages. ECB is anticipated to make its first interest rate cut in June according to Liebke's forecast.
The disparity in economic performance between Germany and France is striking. Germany, Europe's largest economy, appears to be a significant "drag" on the broader Eurozone growth, with its manufacturing sector facing pronounced challenges. In contrast, France is experiencing a more robust recovery across both services and manufacturing.
Germany's PMI readings for February further underscore its economic difficulties, with PMI Manufacturing plummeting to a 4-month low of 42.3, PMI Services rising from 48.2 and Composite PMI also hitting a 4-month low at 46.1.
On the other hand, France's economic indicators offer more positive news, with PMI Manufacturing surging to an 11-month high of 46.8, Services PMI rising to an 8-month high at 48.0, and PMI Composite reaching a 9-month high at 47.7.
No Surprises in FOMC Minutes
In focus today
The key events today will be the February flash PMIs from the euro area, US, and UK. Lately, we have seen the manufacturing PMIs improve while the service PMIs have stabilised around the 48 level in the euro area. Leading indicators from Asia suggest that the global manufacturing cycle is about to turn, which we expect to lift manufacturing PMIs higher together with the increasing order-inventory balance. We will also pay close attention to the service price index that has risen lately and still suggest a significant service price pressure due to recent wage increases.
In the euro area, we also get the final January HICP figures. It will be interesting to investigate to what extent one-offs affected the January print where especially the monthly increase in service inflation was to the high side.
This morning the Swedish National Debt Office presents an updated Central Government Borrowing Report (9.30). Since the last report in October, the government budget outcome has been SEK13bn worse than expected, but we do not anticipate any adjustments to the full year 2024 budget balance due to less grim economic developments than expected. For 2025 we believe the negative budget balance will be adjusted to -30bn amid uncertainties in defense spending and unfunded reforms. The recapitalization of the Riksbank will likely still not be included in the forecast due to uncertainties around timing and amount. Expectations are for roughly SEK4bn in recapitalization.
In Norway, the Q1 Expectations survey from Norges Bank, due for release today, will be important in a situation when core inflation is well above the 2 %-target and the NOK remains weak, but medium-term inflation drivers have turned significantly. In the previous round, there were lower inflation expectations across the board. Lower inflation and a stronger NOK have probably dampened inflation expectations, especially on the 12-month and 2-year horizons. Also, keep an eye on the wage expectations, especially from the labour unions.
The Central Bank of Turkey is set to make their rate decision today. We expect them to hold the rate at 45.0%, in line with consensus.
Chinese home prices for January are due overnight. The price declines have increased in recent months highlighting that there is still no end in sight for China's housing crisis. Home prices are one of the key indicators to watch for signs of any turning point in the crisis.
Economic and market news
What happened overnight
Overnight, the Japanese Nikkei index (finally) breached its previous record level set in 1989 during the height of the asset price bubble. Japanese companies have benefitted from a weak yen which has boosted exports. In other equity news, Nvidia, the leading maker of high-end AI-computing chips, beat market expectations (which were already stratospheric) in their quarterly report, posting a 265% increase in quarterly earnings. This led to a surge in AI- and semiconductor related stock prices. Nvidia has become the third most valuable listed US company, beating Alphabet in recent weeks.
Also in Japan, February PMIs weakened a bit with Manufacturing extending losses from 48.0 to 47.2 and service PMI declining from 53.1 to 52.5.
What happened yesterday
Japan: The yen took a(nother) tumble against major currencies, with the EUR/JPY at a 3-month high of 162.70 as of yesterday's session. This came after US 10-year yields traded above 4.3%. Markets also assessed a government report that lowered growth prospects, especially on consumer spending. Domestic demand has been weak in Japan, with data last week showing the country slipped into a technical recession in Q4. Weak demand could prove a challenge for the BoJ's hopes of exiting the negative-rate environment. Their stated focus is sustained, demand-driven wage growth, for which we will have more information after the major labour union wage negotiations conclude in March.
US: The FOMC minutes of the January meeting were in line with other recent commentary, with the bulk of the committee noting the "risks of moving too quickly to ease the stance of policy", emphasizing the risk of more persistent inflation. The initial market reaction was muted, as recent upside surprises in macro data have already prompted markets to reduce the pricing of rate cuts.
China: China took another step to stabilize the domestic equity market as it introduced new rules for short selling, Bloomberg reports. Specifically, the rules prevent affected firms from selling more shares than they buy during the first and last 30 minutes of the trading day. It is not clear how wide across the financial industry it is hitting, but it seems mainly aimed at big hedge funds.
Geopolitics: Finally, on geopolitics, the EU member states agreed on a new package of sanctions on Russia, which for the first time also included sanctions on Chinese and Indian companies deemed to support the Russian war effort. For now, this includes three Chinese companies and one Indian company.
Equities: Global equities ended marginally higher yesterday as US stocks rallied the last half hour of trading. There was unusually high focus on just one company, Nvidia, reporting after the bell. Some investors lowered their allocation to tech stocks ahead of the long-awaited earnings. That changed after the earnings where Nvidia once again delivered eye-popping result and guidance. In US yesterday Dow +0.1%, S&P 500 +0.1%, Nasdaq -0.3% and Russell 2000 -0.5%. This is a very special morning in Asia. Nikkei 225 continues the strong run and has this morning reached a new all-time high for the first time since 1989! Futures in Europe and US are higher this morning with tech futures leading the advances.
FI: Global yields drifted higher in yesterday's session, extending the rising tendency seen over the past week. The market reaction to FOMC minutes released in the evening was subdued, as the somewhat cautious stance on rate cuts was well-known. The German curve ended up by 7-8bp in line with the rest of the Eurozone, with the rise not attributable to a single factor. However, the substantial bond supplies these days obviously put upward pressure on yields. The bid-to-cover ratio at yesterday's USD16bn 20Y UST auction fell to 2.4, the lowest since September, while the EUR3.7bn 10Y German auction was better received in a historic context with a bid-to-cover at 2.1. The pricing of rate cuts in 2024 fell by 8bp for the ECB and Fed, now trading at 102bp and 82bp, respectively.
FX: On another quiet day in the FX market CHF recovered a bit, while SEK, GBP and JPY lost a bit of ground. FOMC minutes failed to move the market including EUR/USD, which held steady just above the 1.08 level.
Nvidia Surpassed Sales Expectations Once Again
Bingo! Nvidia surpassed the sales expectations once again and announced total sales of $22bn for the Q4 of last year – that’s a 22% growth compared to the quarter before and an eye popping 265% growth compared to the same period last year. Their data center unit revenue alone hit $18bn – that’s more than what they made during the entirety of the previous quarter. That number is up from $3.6bn generated for the data center unit during the same period last year. ‘Accelerated computing and generative AI have hit their tipping point’, said the company CEO, ‘demand is surging worldwide across companies, industries and nations’. Cherry on top: for the current quarter, Nvidia said that they will deliver $24bn sales. And given the track record of the past year, we must admit that there is a stronger case for the company to deliver on its promise than otherwise.
Nvidia jumped 10% in the afterhours trading as predicted by options positioning and will hit a fresh ATH at the open. This time, the idea that speculation is partly responsible for Nvidia’s shine will be on the back of investors’ mind, but investors must admit that a part of the rise is well funded and well deserved. So, there you go, ladies and gentlemen, a potential misstep from Nvidia that would hammer the AI rally has simply not come. What now? The rally will probably continue. Until when? Until a misstep.
Of course, Nvidia will see challenges on its way up. First the revenue growth will likely stabilize, and the euphoria regarding growth and growth perceptions will level out. Competition will come in, regulation will come in and China will be a drag regarding the stateside sales. China stood for 20% of the revenues last year, and their part of Nvidia’s sales will fall below 10%. But on the other hand, Nvidia is unlikely to be constrained by drying demand anytime soon. They will more likely be constrained by their own capacity to respond to the fast-surging demand, and that will make the future revenues finite. This being said, the company managed to decrease its lead times for GPU orders from 8-11 months to just 3-4 months, indicating room for further growth peak.
And it’s worth noting that, yes the AI rally is compared to the dot.com bubble – which ended in tears for many internet companies, but during the dot.com bubble that preceded a massive internet crash, valuations were getting ahead of earnings. What’s different with AI is, earnings are getting ahead of valuations. Some company valuations are extremely high, but overall, there is a huge amount of investment concretely flowing in. And that’s something beyond speculation.
As such, Nasdaq futures are up by 1.50% at the time of writing. It will be a good day.
Now in a rare occurrence, Nvidia stole the light from the Federal Reserve (Fed) minutes released yesterday. The news were not enchanting from the doves’ point of view. Minutes showed that most Fed members are concerned more about moving quickly to cut rates than concerned about keeping the rates high for long. Interestingly, activity on Fed funds futures gives more than 70% chance for a rate cut to happen in June, anyway, but any further evidence that inflation is picking up momentum could easily hammer that expectation, and make the Fed’s job harder for what they call the ‘last mile’.
On a side note, Biden announced that 150’000 student loan borrowers will have their debt forgiven, for a total amount of $1.2 trillion. And that’s just one area where government spends big to keep the US economy strong as it is, at least until November elections. Plus, oil prices are upbeat. Crude oil is trying to drill above the $78pb level, a major Fibonacci resistance that distinguishes between the actual negative trend and a medium-term bullish reversal, while US gasoline bulls are coughing back to life after more than 6-month silence. The rising gasoline prices should also show up in the next few inflation readings. Therefore, the Fed policy easing may not go according to the plan.
Consequently, I am NOT surprised that the Fed members won’t rush toward the exit, but I am surprised that the USD bulls are hard to bring on board. The US dollar index slipped below the 100-DMA, and below its ytd bullish channel base, the EURUSD cleared its 200-DMA and is now trading above the ytd descending channel. Cable looks upbeat above its 200-DMA, whereas the Japanese yen – which was supposed to be the rising star of the year, is pretty much the only major currency that doesn’t see demand. The USDJPY is above 150 despite a broad-based weakness in the US dollar.
Today, the Eurozone PMI numbers will give an idea on the fragile health of the euro area economies, while inflation is expected to have fallen 0.4% on a monthly basis, and core inflation is seen 0.9% lower on a monthly basis too for January. Softer-than-expected inflation and gloomy PMI numbers could stall the euro bull’s endeavor to beat the dollar bulls. Fundamentals back a softer euro against the greenback than the contrary.