Sample Category Title
USD/JPY Mid-Day Outlook
Daily Pivots: (S1) 150.33; (P) 150.61; (R1) 150.86; More...
Intraday bias in USD/JPY stays neutral as consolidation from 150.87 is extending. Downside of consolidation should be contained by 148.79 resistance turned support to bring another rally. Above 150.87 will resume the rise from 140.25 to 151.89/93 key resistance zone. Decisive break there will confirm larger up trend resumption of 155.50 projection level next. However, firm break of 148.79 will turn bias to the downside for 145.88 support.
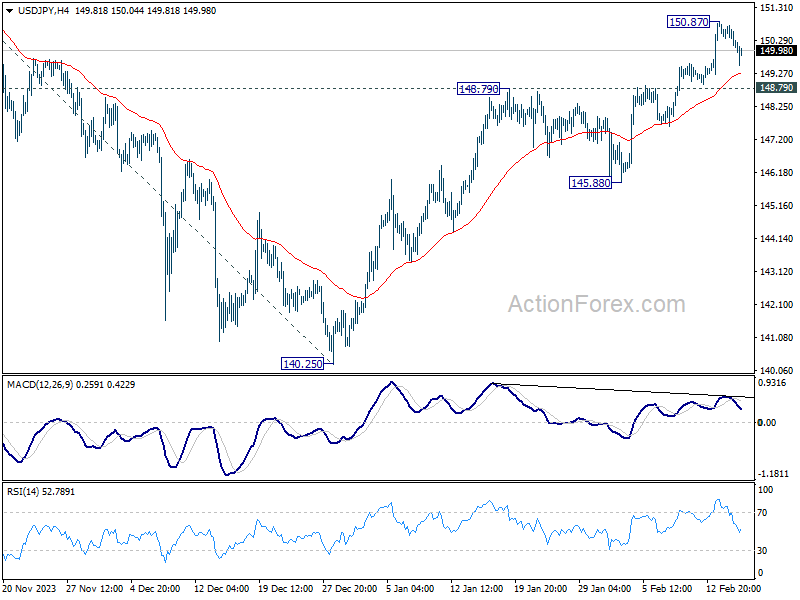
In the bigger picture, fall from 151.89 is seen as a correction to the rally from 127.20, which might have completed at 140.25 already. Firm break of 151.89/93 resistance zone will confirm up trend resumption, and next target will be 61.8% projection of 127.20 to 151.89 from 140.25 at 155.50. This will now remain the favored case as long as 140.25 support holds.
USD/CHF Mid-Day Outlook
Daily Pivots: (S1) 0.8842; (P) 0.8864; (R1) 0.8880; More....
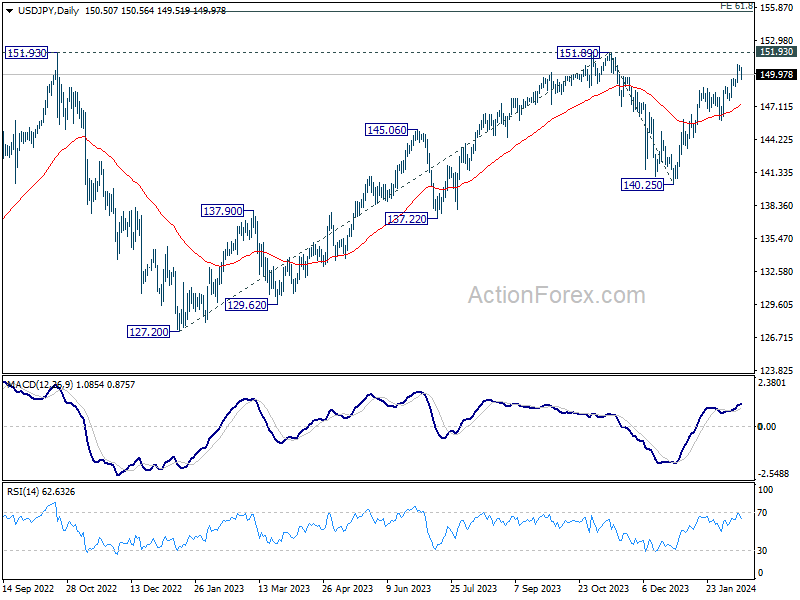
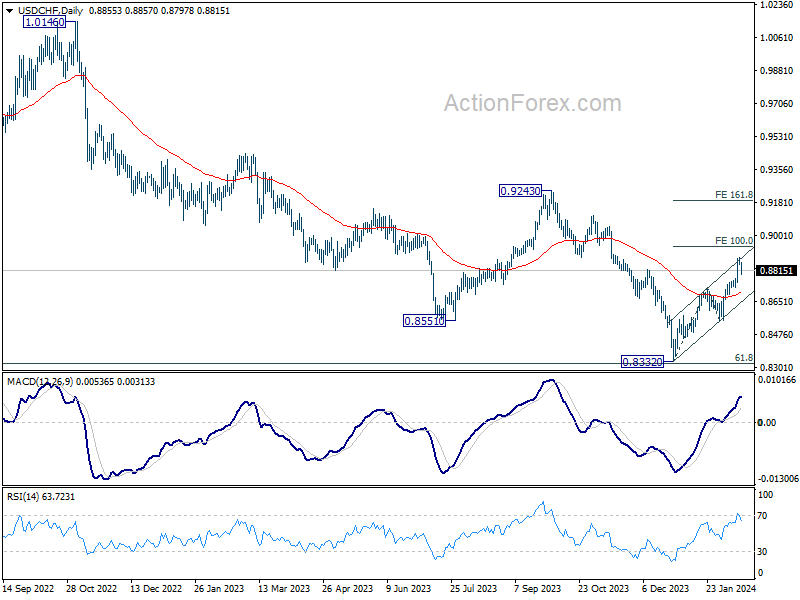
USD/CHF's retreat from 0.8884 extends lower today and intraday bias remains neutral. Some more consolidative trading would be seen but downside should be contained by 0.8727 resistance turned support to bring another rally. On the upside, above 0.8884 will resume the rise from 0.8332 to 100% projection of 0.8332 to 0.8727 from 0.8550 at 0.8954. Firm break there will pave the way to 161.8% projection at 0.9189. However, sustained break of 0.8727 will dampen this bullish view, and turn bias back to the downside for 0.8550 support instead.
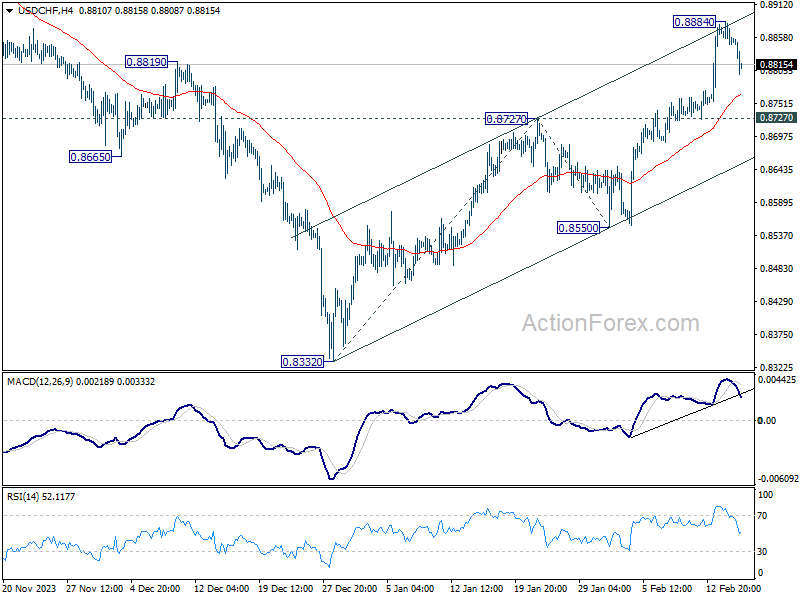
In the bigger picture, a medium term bottom should be formed at 0.8332, on bullish convergence condition in W MACD, just ahead of 0.8317 long term fibonacci support, on bullish convergence condition in W MACD. It's still early to decide if the larger down trend from 1.0146 (2022 high) is reversing. But further rise should be seen to 0.9243 resistance even as a correction.
Dollar Setback on Poor Retail Sales, Sterling Faces Recession Woes
Dollar's pullback intensifies in early US session, prompted by unexpectedly poor retail sales data for January. This underwhelming performance is reigniting debates about the enduring strength of consumer spending, a critical factor in fueling inflation. Although a single data point does not dictate the broader economic narrative, it nonetheless re-introduces speculation about Fed's potential rate cut in May, despite the improbability of a move in March.
Across the pond, Sterling suffered even greater losses, becoming today's most underperforming currency. The Pound has unwound most of its gains from earlier in the week, following the release of GDP figures that confirmed the UK's descent into recession. This, combined with CPI figures that came in below expectations, is likely to dial down the intensity of BoE's hawkish voices. Market participants are recalibrating their expectations, turning back to anticipating three rate cuts within the year.
In contrast to Dollar and Pound, Swiss Franc emerged as the day's standout performer, clawing back some of its losses from earlier in the week. New Zealand Dollar and Japanese Yen also ranked among the stronger currencies of the day, while Canadian Dollar lagged just behind Sterling and Dollar. Euro and Australian Dollar displayed mixed performances.
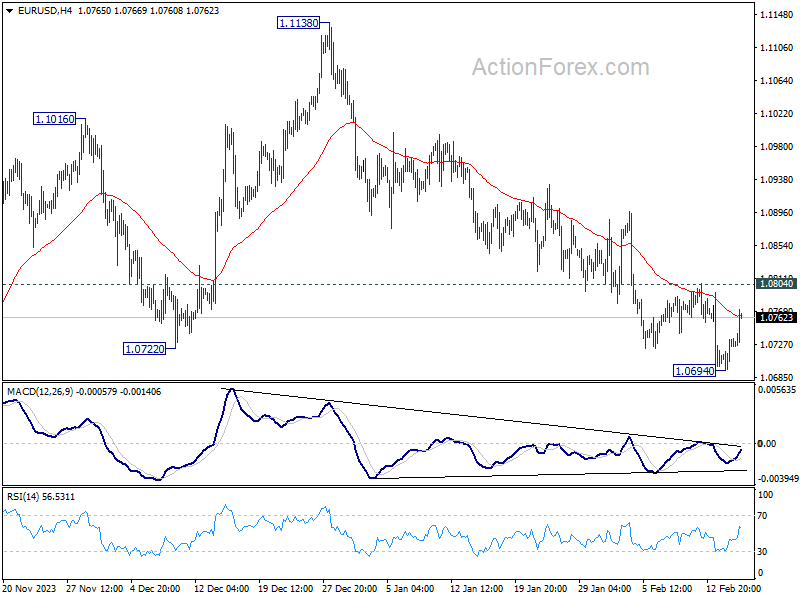
Technically speaking, Dollar's retreat is notable, yet it crucially remains above pivotal near-term support levels against other major currencies. Key levels to watch includes 1.0804 resistance in EUR/USD, 0.8727 support in USD/CHF, and 148.79 support in USD/JPY. As long as these levels hold, Dollar's near term rally is still in favor to resume at a later stage.
In Europe, at the time of writing, FTSE is up 0.16%. DAX is up 0.54%. CAC is up 0.93%. UK 10-year yield is down -0.0405 at 4.003. Germany 10-year yield is down -0.030 at 2.314. Earlier in Asia, Nikkei rose 1.21%. Hong Kong HSI rose 0.41%. Singapore Strait Times rose 1.20%. Japan 10-year JGB yield fell -0.030 to 0.730.
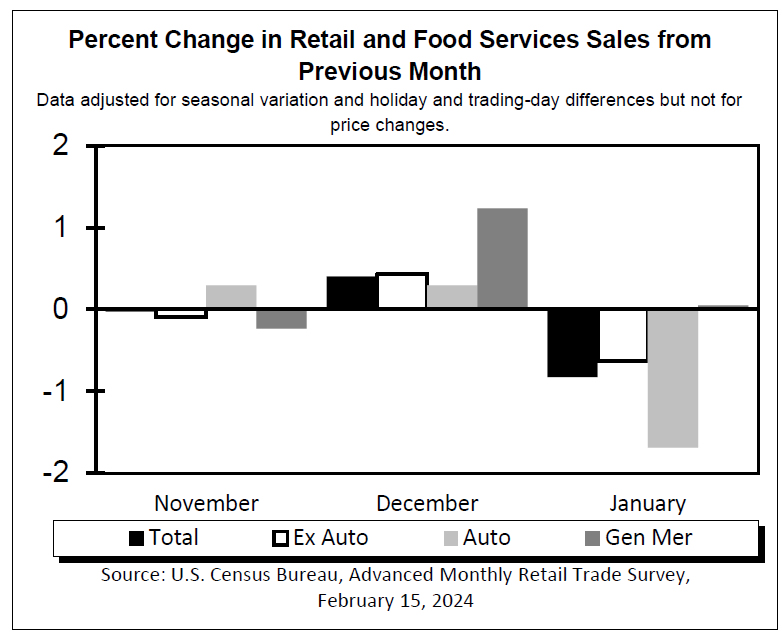
US retail sales falls -0.8% mom in Jan, ex-auto sales down -0.6% mom
US retail sales fell -0.8% mom to USD 700.3B in January, well below expectation of -0.2% mom. Ex-auto sale fell -0.6% mom to USD 567.9B, much worse than expectation of 0.1% mom rise. Ex-gasoline sales fell -0.8% mom to USD 647.9B. Ex-auto, gasoline sales fell -0.5% mom to USD 515.5B. In the three months to January, sales were up 3.1% from the same period a year ago.
Also released, initial jobless claims fell from 220k to 212k in the week ending February 9, better than expectation of 217k. Empire state manufacturing index improved from -43.7 to -2.4 in February, above expectation of -12.5. Philly Fed manufacturing index rose form -10.6 to 5.2 in February, above expectation of -8.9.
European Commission forecasts slower Eurozone growth, but quicker inflation slowdown
According to European Commission's Winter 2024 Economic Forecast, Eurozone's GDP growth for 2024 was revised notably downwards to 0.8% from Autumn's estimate of 1.2%, reflecting a more subdued outlook than previously anticipated. For 2025, GDP growth forecast as slightly downgraded to 1.5% from 1.6%.
Inflation is expected to decelerate more rapidly in 2024, with HICP forecasted at 2.7%, down from prior 3.2%. Meanwhile, inflation forecast for 2025 remains unchanged at 2.2%.
Vice-President Valdis Dombrovskis highlighted that despite the challenges faced in 2023, "rebound should speed up gradually this year and into 2025". Inflation will continue its "broad-based decline" and bolstered consumer demand through real wage growth and a robust labour market.
Commissioner for Economy Paolo Gentiloni acknowledged the "more modest" economic rebound this year. But growth is set to "firm" and inflation to decline to close to ECB's 2% target in 2025.
ECB's Lagarde highlights wage growth as increasingly important inflation
In a European Parliament committee hearing, ECB President Christine Lagarde highlighted that the "ongoing disinflation process" is expected to continue "gradually further down over 2024," attributing this trend to the diminishing effects of past upward shocks and the impact of tighter financing conditions on inflation.
Lagarde noted a "gradual decline" in core inflation, which excludes energy and food prices, while also pointing out the "signs of persistence" in services inflation.
Significantly, Lagarde identified wage growth as a crucial factor, stating it is becoming an "increasingly important driver of inflation dynamics." ECB's wage tracker signals sustained wage pressures, although there's "some levelling off" observed in the latest quarter of 2023. The direction of wage pressures in 2024 largely depends on "ongoing or upcoming negotiation rounds" affecting a broad segment of the workforce.
Furthermore, Lagarde observed that the influence of unit profits on domestic price pressures is on the decline, suggesting that wage increments are being partly accommodated through "profit margins."
UK slides into technical recession with -0.3% qoq GDP contraction in Q4
UK GDP contracted -0.3% qoq in Q4, worse than expectation of -0.1% qoq. This downturn was a collective result of declines across all primary sectors: services saw a -0.2% dip qoq, production tumbled by -1.0% qoq, and construction experienced a significant -1.3% qoq fall. Following -0.1% qoq contraction in Q3, these figures confirm UK's entry into a technical recession.
December's GDP data offered a slight respite with a marginal -0.1% mom decrease, better than expectation of -0.2% mom. That followed 0.2% mom growth in November, and -0.5% mom contraction in October. Services fell -0.2% mom. Production grew 0.6% mom. Construction fell -0.5% mom.
Reflecting on the entire year of 2023, UK's GDP saw a meager 0.1% growth, a stark contrast to 4.3% expansion in 2022. This marks the weakest annual performance since the 2009 financial crisis, with the exception of the pandemic-stricken year of 2020.
Japan enters technical recession amid falling consumption and investment
Japan's economy has entered a technical recession as GDP unexpectedly contracted by -0.1% qoq in Q4, much worse than expectation of 0.3% qoq growth. That also marked a continuation from -0.8% contraction seen in Q3. On annualized basis, the downturn was -0.4%, a stark contrast to the anticipated 1.4% growth and following -3.3% contraction in the previous quarter.
The contraction is attributed primarily to decline in private consumption, which accounts for over half of the Japanese economy, falling by -0.2% qoq. Capital expenditure, another significant driver of private-sector growth, also decreased by -0.1% qoq. However, external demand, as indicated by the net exports, provided a slight buffer, contributing 0.2 percentage points to GDP, with exports growing by 2.6% qoq.
Economy Minister Yoshitaka Shindo emphasized the importance of solid wage growth to support consumer spending, which he noted is currently "lacking momentum" amidst rising prices. He also pointed out that BoJ considers a broad range of data, including consumption patterns and risks to the economy, when formulating monetary policy.
RBA's Bullock highlights inflation persistence and demand-supply imbalance
In today's Senate Estimates appearance, RBA Governor Michele Bullock underscored the "persistent" nature of inflationary pressures within the Australian economy.
She pointed out the crucial distinction between demand growth rates and overall demand levels, emphasizing "growth rates are slowing, but aggregate demand is still above aggregate supply, and that's what's generating inflationary pressures."
Bullock remained optimistic about RBA's ability to manage inflation effectively without jeopardizing employment growth. "We think we're in a good position to get inflation down in a reasonable amount of time while still keeping employment growing," she noted.
Australia's employment grows 0.5k in Jan, unemployment rate rises to 4.1%
Australia's job market showed further signs of cooling in January, as the latest employment data reveals a modest increase of just 0.5k jobs, significantly below expectation of 20.7k growth. Looking at the details, full-time employment saw an uptick of 11.1k, counterbalanced by reduction in part-time job by -10.6k.
Unemployment rate unexpectedly rose from 3.9% to 4.1%, above expectation of 4.0%. That also marked the first occasion in two years since January 2022 that the rate has breached the 4% threshold. Participation rate held steady at 66.8%, but a notable decrease in monthly hours worked by -2.5% mom paints a picture of a slackening labor market.
USD/CHF Mid-Day Outlook
Daily Pivots: (S1) 0.8842; (P) 0.8864; (R1) 0.8880; More....
USD/CHF's retreat from 0.8884 extends lower today and intraday bias remains neutral. Some more consolidative trading would be seen but downside should be contained by 0.8727 resistance turned support to bring another rally. On the upside, above 0.8884 will resume the rise from 0.8332 to 100% projection of 0.8332 to 0.8727 from 0.8550 at 0.8954. Firm break there will pave the way to 161.8% projection at 0.9189. However, sustained break of 0.8727 will dampen this bullish view, and turn bias back to the downside for 0.8550 support instead.
In the bigger picture, a medium term bottom should be formed at 0.8332, on bullish convergence condition in W MACD, just ahead of 0.8317 long term fibonacci support, on bullish convergence condition in W MACD. It's still early to decide if the larger down trend from 1.0146 (2022 high) is reversing. But further rise should be seen to 0.9243 resistance even as a correction.
Economic Indicators Update
| GMT | Ccy | Events | Actual | Forecast | Previous | Revised |
|---|---|---|---|---|---|---|
| 23:50 | JPY | GDP Q4 Q/Q P | -0.10% | 0.30% | -0.70% | -0.80% |
| 23:50 | JPY | GDP Deflator Y/Y Q4 P | 3.80% | 4.00% | 5.30% | |
| 00:00 | AUD | Consumer Inflation Expectations Feb | 4.50% | 4.50% | ||
| 00:30 | AUD | Employment Change Jan | 0.5K | 20.7K | -65.1K | -62.7K |
| 00:30 | AUD | Unemployment Rate Jan | 4.10% | 4.00% | 3.90% | |
| 04:30 | JPY | Industrial Production M/M Dec F | 1.40% | 1.80% | 1.80% | |
| 07:00 | GBP | GDP M/M Dec | -0.10% | -0.20% | 0.30% | 0.20% |
| 07:00 | GBP | GDP Q/Q Q4 P | -0.30% | -0.10% | -0.10% | |
| 07:00 | GBP | Industrial Production M/M Dec | 0.60% | -0.10% | 0.30% | |
| 07:00 | GBP | Industrial Production Y/Y Dec | 0.60% | -0.40% | -0.10% | 0.10% |
| 07:00 | GBP | Manufacturing Production M/M Dec | 0.80% | 0.00% | 0.40% | 0.80% |
| 07:00 | GBP | Manufacturing Production Y/Y Dec | 2.30% | 0.60% | 1.30% | 1.90% |
| 07:00 | GBP | Goods Trade Balance (GBP) Dec | -14.0B | -14.1B | -14.2B | -15.1B |
| 07:30 | CHF | PPI M/M Jan | -0.50% | -0.20% | -0.60% | |
| 07:30 | CHF | PPI Y/Y Jan | -2.30% | -1.10% | ||
| 08:00 | CHF | SECO Consumer Climate Q1 | -41 | -34 | -40 | |
| 10:00 | EUR | Eurozone Trade Balance (EUR) Dec | 13.0B | 15.7B | 14.8B | 15.1B |
| 12:22 | GBP | NIESR GDP Estimate Jan | -0.10% | 0.00% | -0.30% | |
| 13:15 | CAD | Housing Starts Jan | 224K | 225K | 249K | |
| 13:30 | CAD | Manufacturing Sales M/M Dec | -0.70% | -0.50% | 1.20% | 1.50% |
| 13:30 | USD | Initial Jobless Claims (Feb 9) | 212K | 217K | 218K | 220K |
| 13:30 | USD | Retail Sales M/M Jan | -0.80% | -0.20% | 0.60% | |
| 13:30 | USD | Retail Sales ex Autos M/M Jan | -0.60% | 0.10% | 0.40% | |
| 13:30 | USD | Import Price Index M/M Jan | 0.80% | -0.10% | 0.00% | |
| 13:30 | USD | Empire State Manufacturing Index Feb | -2.4 | -12.5 | -43.7 | |
| 13:30 | USD | Philadelphia Fed Manufacturing Survey Feb | 5.2 | -8.9 | -10.6 | |
| 14:15 | USD | Industrial Production M/M Jan | 0.30% | 0.10% | ||
| 14:15 | USD | Capacity Utilization Jan | 78.80% | 78.60% | ||
| 15:00 | USD | Business Inventories Dec | 0.30% | -0.10% | ||
| 15:00 | USD | NAHB Housing Market Index Feb | 46 | 44 | ||
| 15:30 | USD | Natural Gas Storage | -67B | -75B |
US retail sales falls -0.8% mom in Jan, ex-auto sales down -0.6% mom
US retail sales fell -0.8% mom to USD 700.3B in January, well below expectation of -0.2% mom. Ex-auto sale fell -0.6% mom to USD 567.9B, much worse than expectation of 0.1% mom rise. Ex-gasoline sales fell -0.8% mom to USD 647.9B. Ex-auto, gasoline sales fell -0.5% mom to USD 515.5B.
In the three months to January, sales were up 3.1% from the same period a year ago.
BTCUSD Explodes to More Than 2-Year High
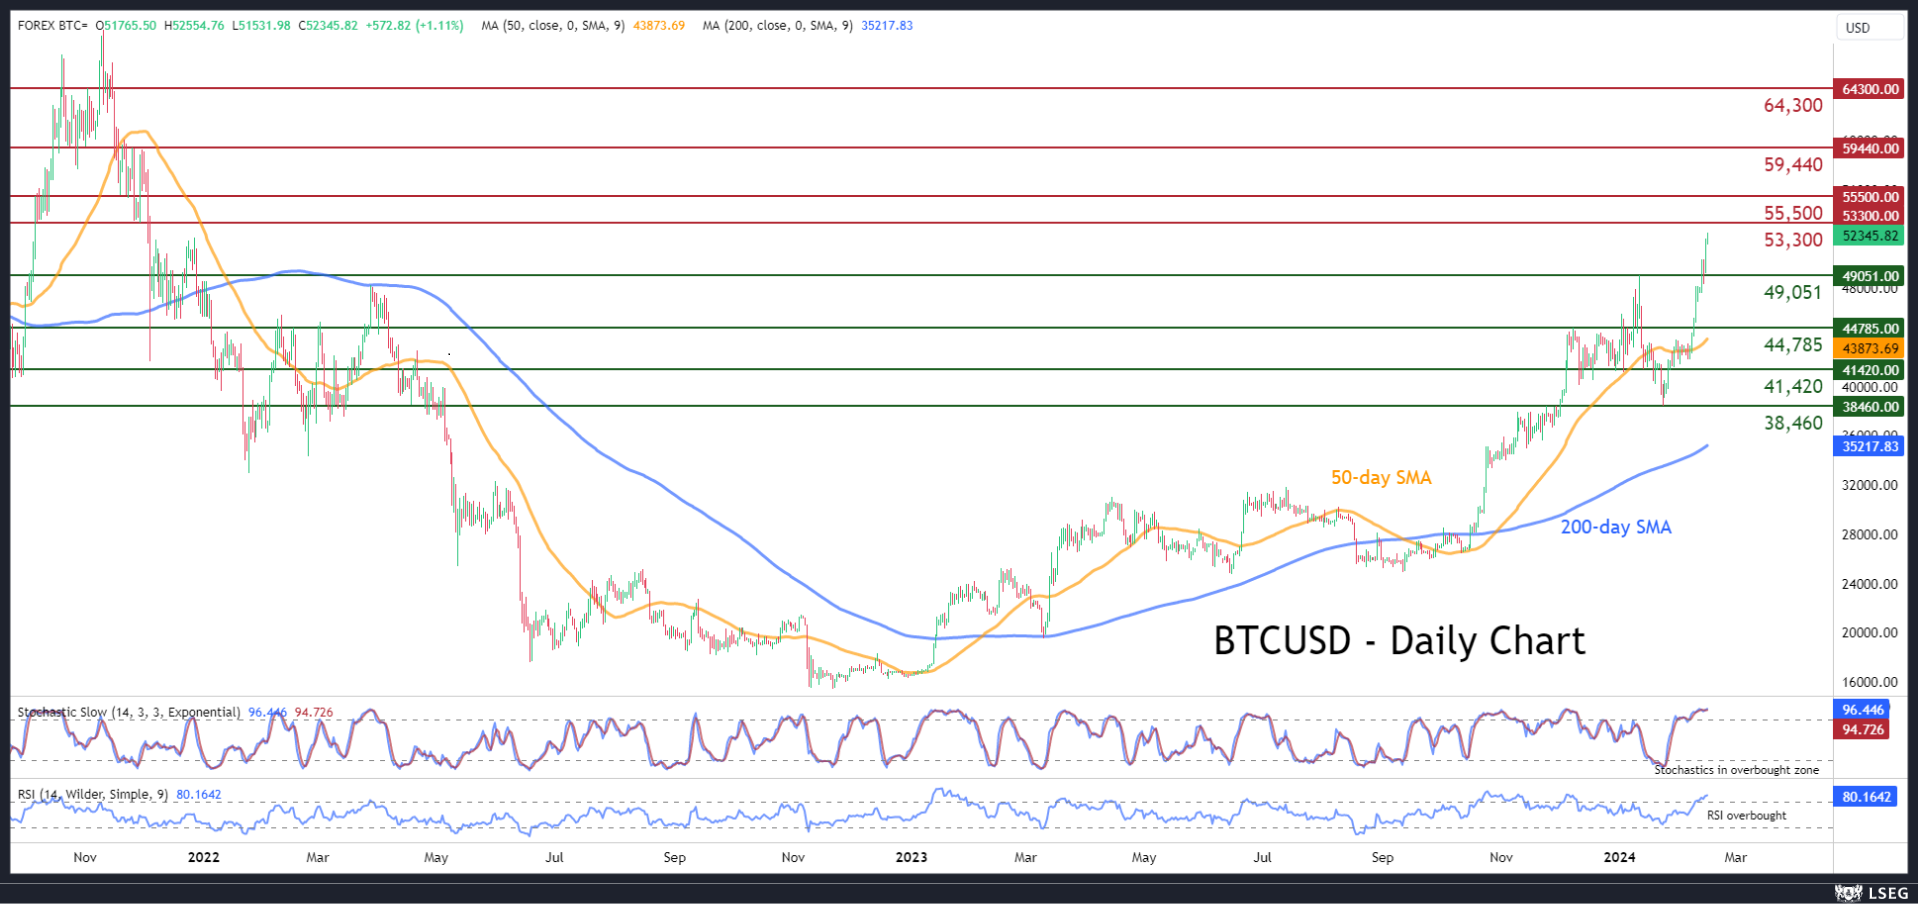
- BTCUSD goes parabolic after claiming 50-day SMA
- Jumps above 50,000 to a fresh more than 2-year peak
- Momentum indicators look extremely overbought
BTCUSD (Bitcoin) has been experiencing a steep advance following its break above the 50-day simple moving average (SMA) on February 7. Within a week, the price violated its two-year peak of 49,051 and surged above the 50,000 psychological mark, but traders should be cautious as the advance is significantly overstretched.
If the rally resumes, Bitcoin could test the November 2021 support zones of 53,300 and 55,500. Conquering the latter, the bulls might attack 59,440, which served as both support and resistance in the November-December 2021 period. Even higher, the December 2021 resistance of 64,300 might curb further upside attempts.
On the flipside, should the advance falter, the previous peaks of 49,051 and 44,785 could provide initial support. A violation of the latter could open the door for the inside swing low of 41,420. Failing to halt there, the price may slide towards the 2024 bottom of 38,460.
In brief, BTCUSD’s advance has accelerated after the profound break above the 50-day simple moving average (SMA), with the price posting a more than two-year high. However, the short-term oscillators are starting to warn of an overstretched advance, thus an impending pullback might be on the cards.
Empire State Manufacturing Index – EURUSD Technical Analysis Overview
The markets await the Empire State Manufacturing Index this morning; the index is based on surveying a monthly sample of the State’s manufacturing executives and is handled by the Federal Reserve Bank of New York. The index is considered a leading indicator; a reading above zero reflects expansion, and below zero reflects contraction. Last Month, as seen on the chart below, the index reading was the lowest since April 2020 and as low as its reading back in 2008. However, the index fluctuation may involve some seasonality, and it has been below zero for some time, which will add more weight to today’s release.
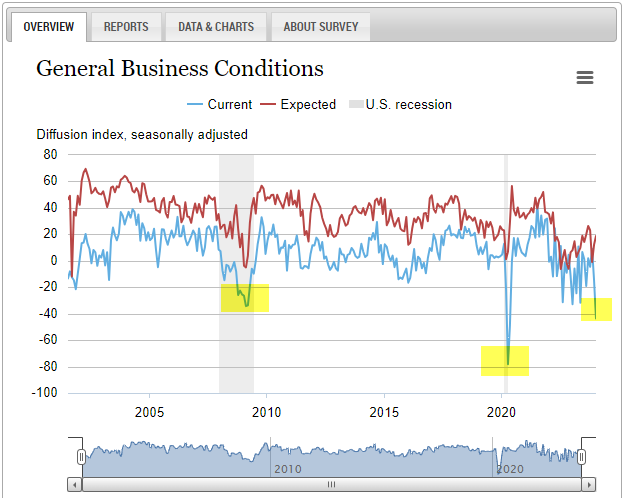
The expected number is –13.7, an improvement over –43.7 for December 2023. According to the New York Fed, firms responding to the January 2024 Empire State Manufacturing Survey reported that business activity dropped sharply in New York State. New orders and shipments also posted sharp declines. New York State is among the top 10 states in manufacturing jobs and the number of manufacturing companies.
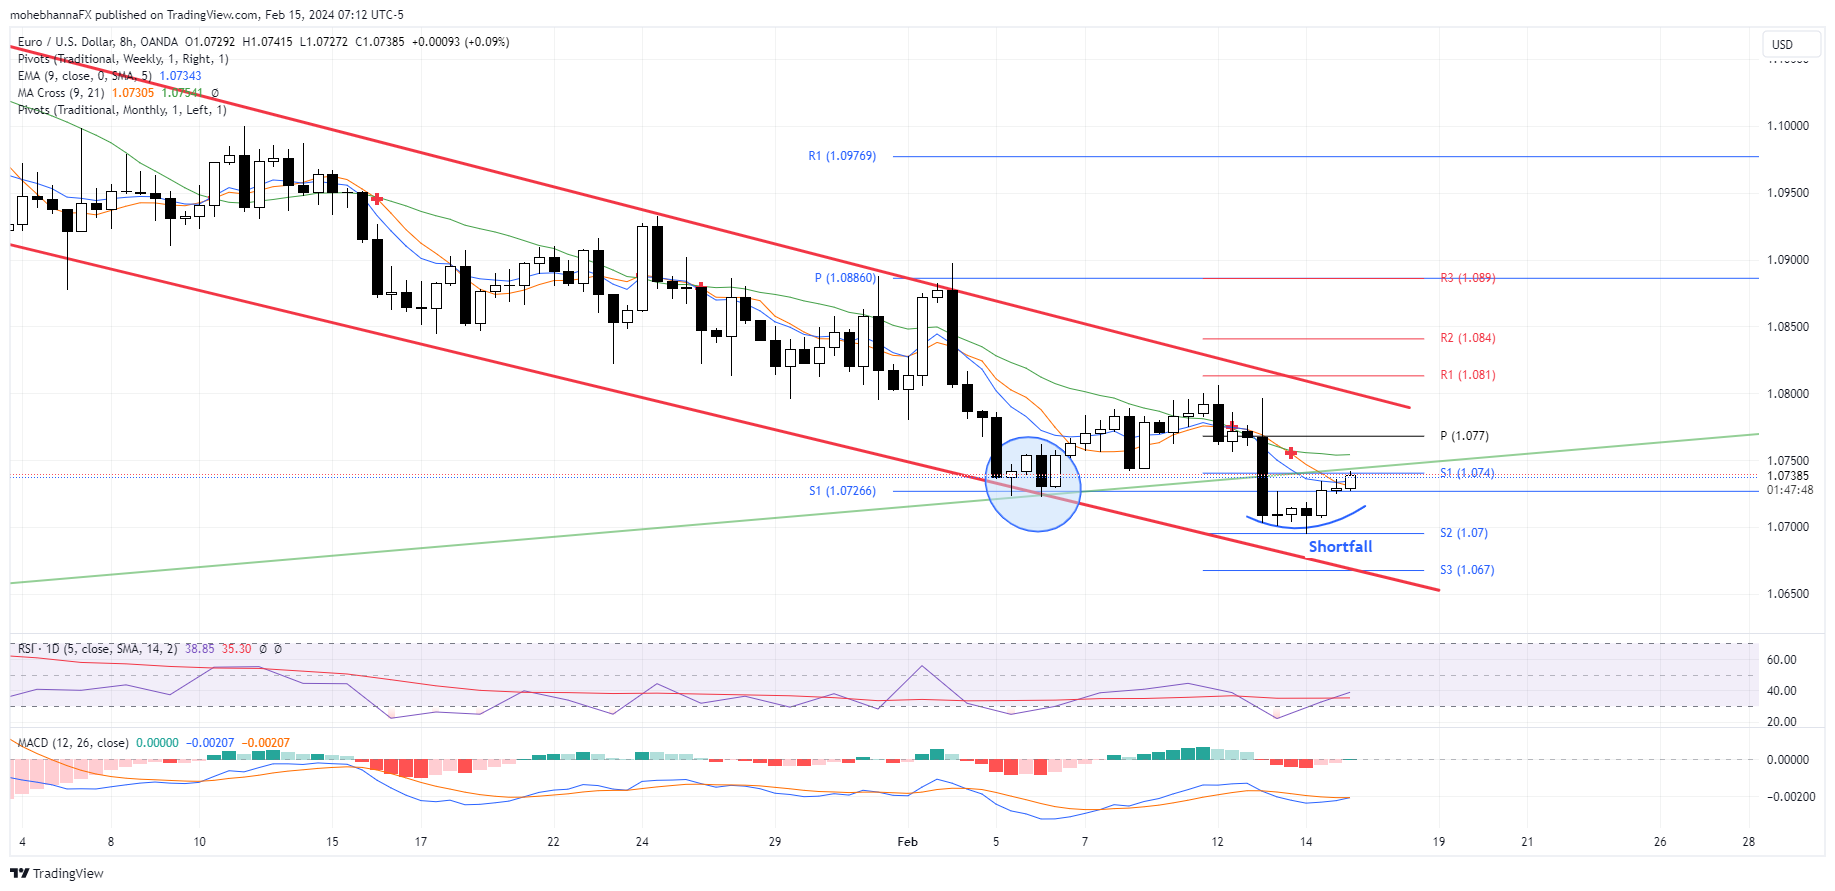
EURUSD – 8 – Hour Chart
- The 8-hour chart reflects that price action is trading within a descending channel, where it continued to find support at the channel’s lower border.
- Price action reversed from a confluence of support (Blue circle) represented by the channel’s lower border (Red line), a trendline extension that goes back to October 2023 (Green line), a historical shortfall level, and the historical monthly Standard pivot point calculation, the support level lies within the range of 1.0720 – 1.0750. It is also worth noting that a zoomed-out view for the same chart shows that the declining channel can be a flag formation for the uptrend (Green lines); we will keep an eye on how it develops.
- Price action broke above its EMA9 and SMA9; however, it is yet to reach its SMA21 on the 8-Hour chart. As for the daily timeframe, price action trades below the SMA9, SMA21, and EMA9.
- The MACD line intersects with its signal line; however, there is no breakout yet, the indicator is currently in line with price action, and no divergences are seen
- The RSI (Daily Close 5) broke above its moving average, which is also in line with price action.
- Price action faces resistance, represented by the S1 Standard calculation and the trendline extension (Green line); a break above this line is essential to justify any upside price action. On the other hand, a potential bullish Shortfall is also identified on the chart; a break below this level may allow price action to retest the channel lower border extension.
EURUSD – Weekly Chart
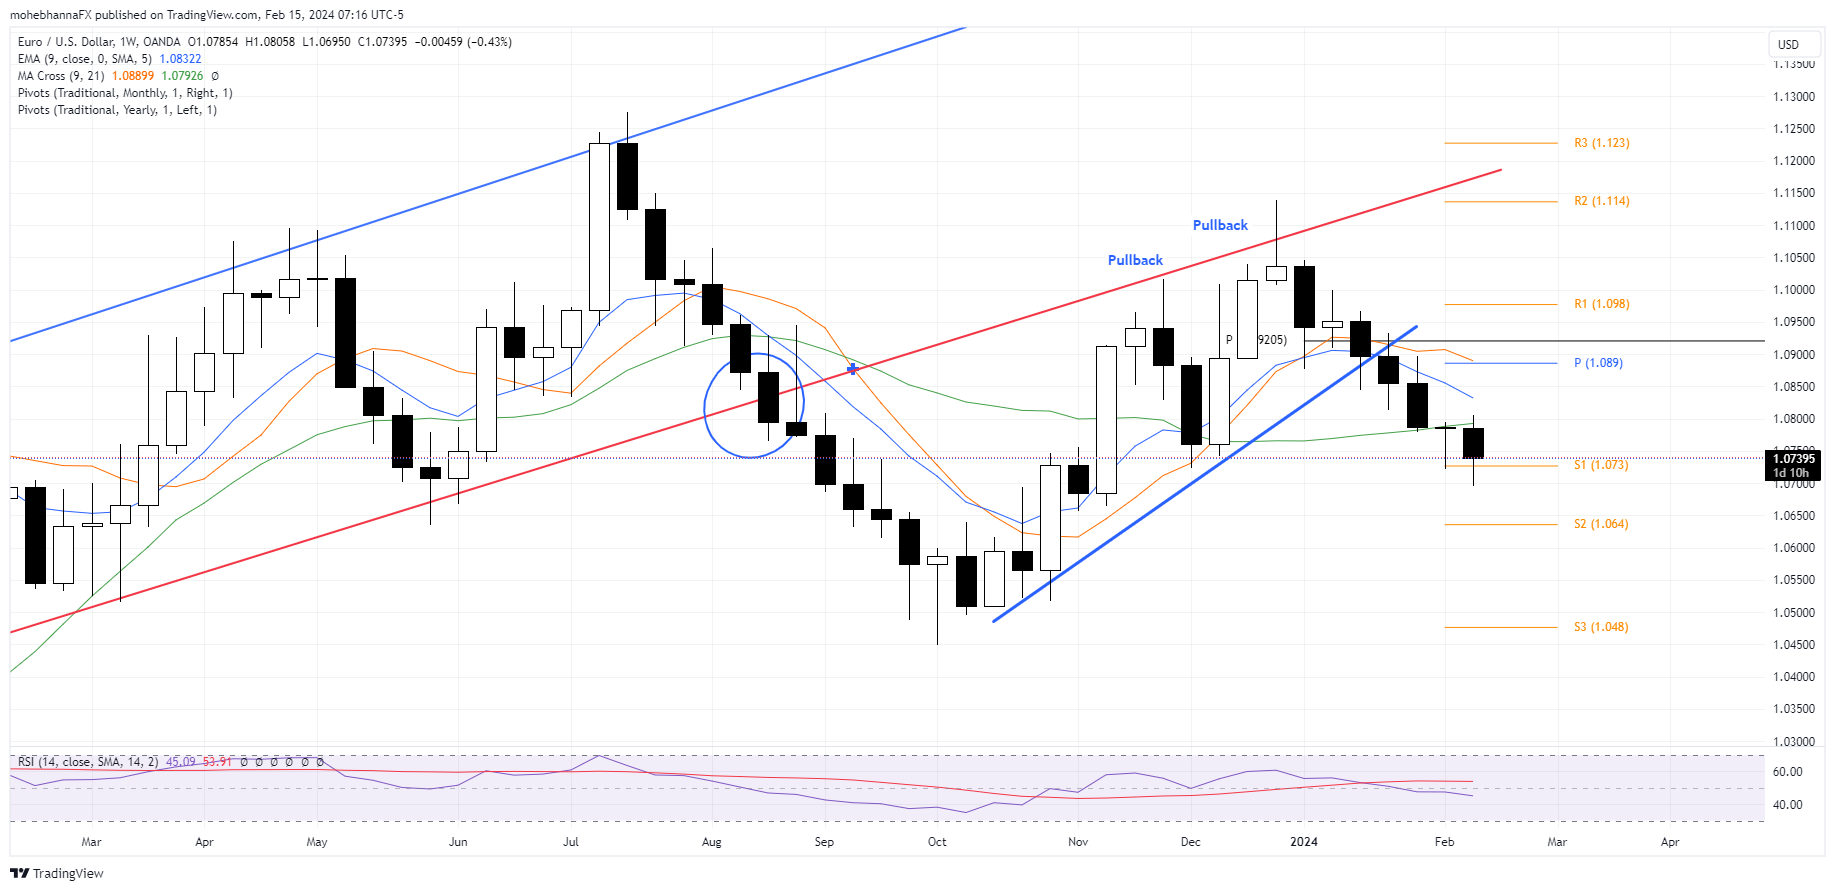
- The double-top formation previously identified on the weekly chart is complete. Price action broke below the baseline in late January 2024 and has already reached the typical pattern expected target near 1.0730.
- Price action trades below the annual and monthly standard pivot points and EMA9, MA9, and MA21.
- Price action is currently attempting to find support above the 1.0730 area; however, there is no technical indication of whether the level will hold. The support and resistance levels are identified on the above chart.
All Eyes on the Strongest Cryptos
Market picture
The crypto market continues to rise, adding 2.3% to the level of 24 hours ago. Bitcoin’s capitalisation has surpassed 1 trillion, and its share of all coins is estimated at 52.5% by CoinMarketCap. The increase in share is due to USDT and the relative stagnation of the share of other cryptocurrencies outside the top five.
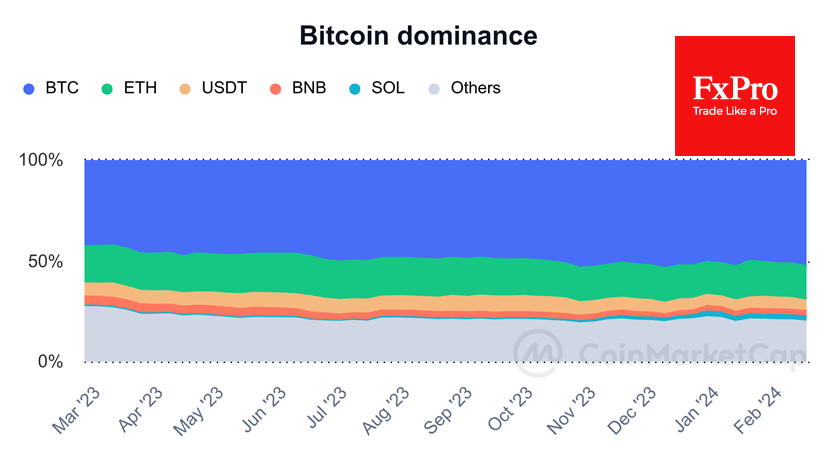
Bitcoin’s price has surpassed $52.2K, the highest level since the end of 2021. Buyers in the first cryptocurrency are so strong that we don’t even see a prolonged consolidation. This dynamic reinforces our view that the next meaningful shakeout may not come before the approach of 60K, where there were several inflexion points in 2021.
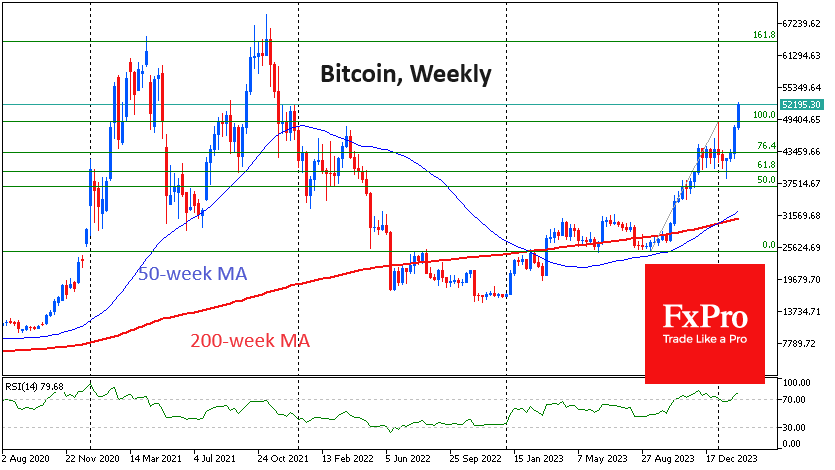
Ethereum is updating highs, but this is the highest level since July 2022. Solana has been at highs since late December last year, Cardano has only recovered to levels from 13 January, and XRP has been at its highest since 22 January. Clearly, the bigger the coin now, the more attention it gets.
News Background
According to BitMEX data, daily inflows into bitcoin ETFs approached record levels on their first day of trading after the launch. BlackRock’s fund is showing strong momentum, and experts are optimistic about Wall Street’s acceptance of Bitcoin ETFs.
Anthony Scaramucci, a founder of SkyBridge Capital, urged to have no doubts and buy BTC at current levels. According to him, we are in for a great bull rally.
According to CoinGecko, the Bitcoin blockchain took the top spot for NFT trading volume in December, accounting for 42.1% of all trading activity.
Forbes included three crypto firms in its list of the top 50 fintech companies: Chainalysis, Fireblocks and Gauntlet.
In the last three months of 2023, the UK’s Financial Conduct Authority (FCA) issued 450 warnings to cryptocurrency firms for illegally advertising their products.
Ethereum Price Exceeds $2,800
The last time the ETH/USD price was at this level was in May 2022, which was the start of a massive drop of more than 65% in 1.5 months.
However, now the ETH/USD market is dominated by bullish sentiment, for the following reasons:
→ deployment of the Dencun update on the Ethereum network this month, which will open up new opportunities for users and developers;
→ expectations that this year, following the approval of Bitcoin ETFs, applications for the launch of ETFs on Ethereum will be approved;
→ waiting for a traditional bull market after halving in the Bitcoin network.
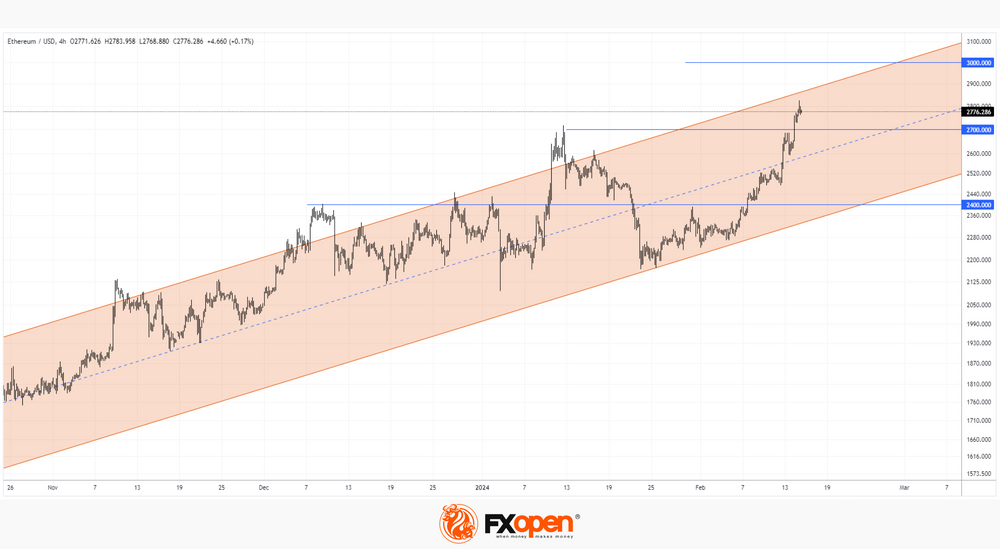
So far, the ETH/USD chart shows that the price of Ethereum is moving within an ascending channel that begins in 2023. Moreover, the price is in its upper half — an indication of the strength of demand. If the trend continues, the price of Ethereum could reach $3,000 within a month.
At the same time, the price of Ethereum is approaching the upper border of the channel, which may provide resistance. It is possible that the indicators will indicate that the market is overbought, creating the preconditions for the formation of a correction.
Probable support levels can help the bulls in a scenario where a correction develops:
→ 2,400: this level influenced the price of ETH starting in December 2023;
→ 2,700: former 2024 high, which was broken on a wide bullish candle (a sign of strong demand);
→ median line and lower boundary of the current channel.
FXOpen offers the world's most popular cryptocurrency CFDs*, including Bitcoin and Ethereum. Floating spreads, 1:2 leverage — at your service. Open your trading account now or learn more about crypto CFD trading with FXOpen.
*At FXOpen UK and FXOpen AU, Cryptocurrency CFDs are only available for trading by those clients categorised as Professional clients under FCA Rules and Professional clients under ASIC Rules respectively. They are not available for trading by Retail clients.
This article represents the opinion of the Companies operating under the FXOpen brand only. It is not to be construed as an offer, solicitation, or recommendation with respect to products and services provided by the Companies operating under the FXOpen brand, nor is it to be considered financial advice.
European Commission forecasts slower Eurozone growth, but quicker inflation slowdown
According to European Commission's Winter 2024 Economic Forecast, Eurozone's GDP growth for 2024 was revised notably downwards to 0.8% from Autumn's estimate of 1.2%, reflecting a more subdued outlook than previously anticipated. For 2025, GDP growth forecast as slightly downgraded to 1.5% from 1.6%.
Inflation is expected to decelerate more rapidly in 2024, with HICP forecasted at 2.7%, down from prior 3.2%. Meanwhile, inflation forecast for 2025 remains unchanged at 2.2%.
Vice-President Valdis Dombrovskis highlighted that despite the challenges faced in 2023, "rebound should speed up gradually this year and into 2025". Inflation will continue its "broad-based decline" and bolstered consumer demand through real wage growth and a robust labour market.
Commissioner for Economy Paolo Gentiloni acknowledged the "more modest" economic rebound this year. But growth is set to "firm" and inflation to decline to close to ECB's 2% target in 2025.
Will Canadian CPI Data Offer Loonie Any Support?
- Inflation in Canada has been stuck above 3.0% since the summer
- The Bank of Canada is keeping rate hike option on the table
- Yet, the loonie has been on the backfoot versus the dollar this year
- Will Tuesday’s CPI data (13:30 GMT) put BoC’s inflation fight back on track?
The long fight to get inflation to target
The Bank of Canada has made great strides in its bid to get inflation back to its 1-3% target band, but as is the case in the United States and other major economies, the progress has stalled lately. The downward trend in both the headline and underlying price metrics in Canada appear to be bottoming out in the 3-4% range.
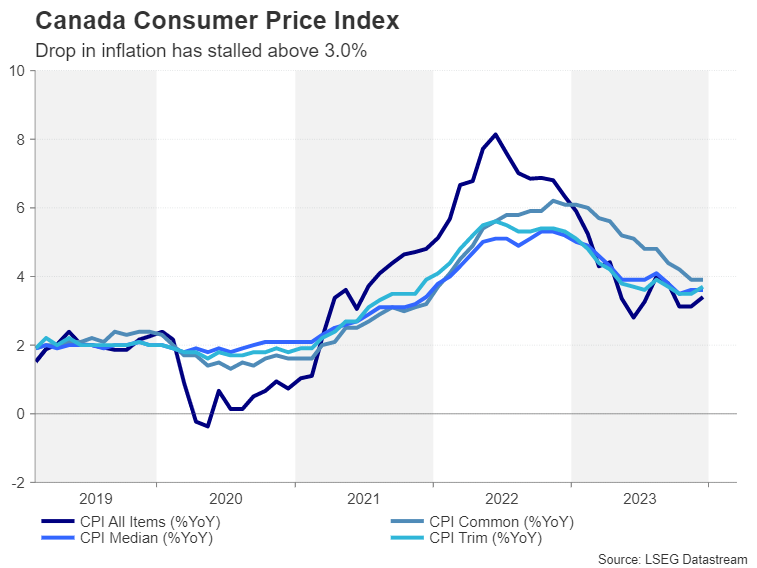
Nevertheless, the Bank of Canada sees inflationary pressures receding further over the coming months and decided to drop its tightening bias at its January meeting. Although policymakers did not completely rule out the possibility of more hikes either, the shift to a more neutral stance has opened the door to a rate cut later in the year.
Will inflation ease back in January?
The key question now for both the BoC and the markets is the timing. Investors have almost fully priced in a 25-basis-point reduction in July, which represents somewhat of a dialling back from earlier bets that the first cut would come in June. For the timing to be brought forward again, there would have to be a significant change in the inflation outlook. However, it’s unlikely that the January CPI report would alter the picture much.
The annual rate of CPI is expected to have moderated to 3.2% y/y in January after ticking up to 3.4% y/y in December. This probably would not be enough to prompt policymakers to make another dovish turn imminently. Still, if CPI resumes its descent and some or all the core measures also decline, this could encourage investors to up their bets of a rate cut sooner rather than later.
The problem with a strong labour market
In reality, however, the Bank of Canada is in much the same predicament as other central banks like the Federal Reserve and Bank of England where a strong labour market is preventing them from taking a less cautious stance.
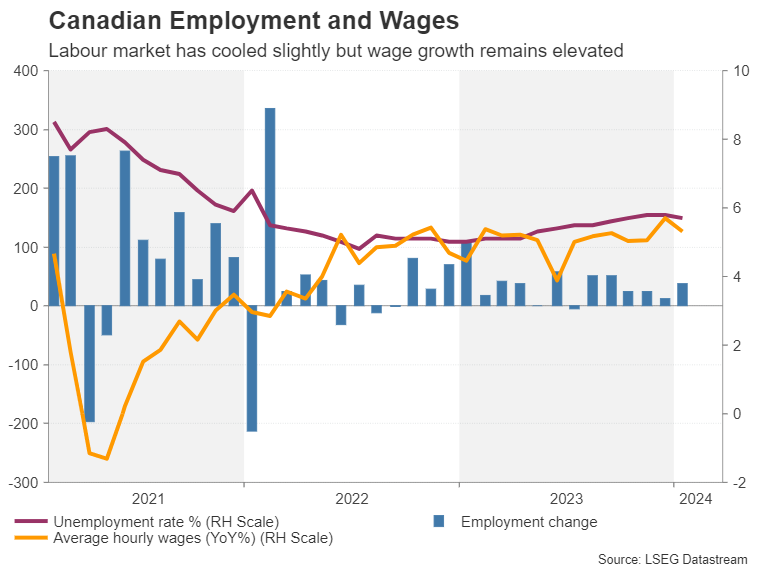
Although there’s been a notable cooldown in Canada’s hot jobs market – the unemployment rate has edged up from 4.8% in July 2022 to 5.7% currently – wage growth remains elevated. Average hourly wages were up 5.3% y/y in January, down from 5.7% in December but well above the pre-pandemic average.
Housing market turnaround might not be welcome
However, with economic growth coming to a standstill in the second half of 2023, the risks to the price outlook are tilted to the downside. The one worry is that the housing market emerges out of the doldrums, boosting shelter costs, amid some signs that a turnaround is underway.
Shelter costs are the biggest contributor to keeping inflation above target according to the BoC so policymakers are watching the property sector closely.
Can the loonie stage a rebound?
For the Canadian dollar, which has been battling a resurgence in its US counterpart, weaker-than-expected CPI readings on Tuesday could deliver a further blow.
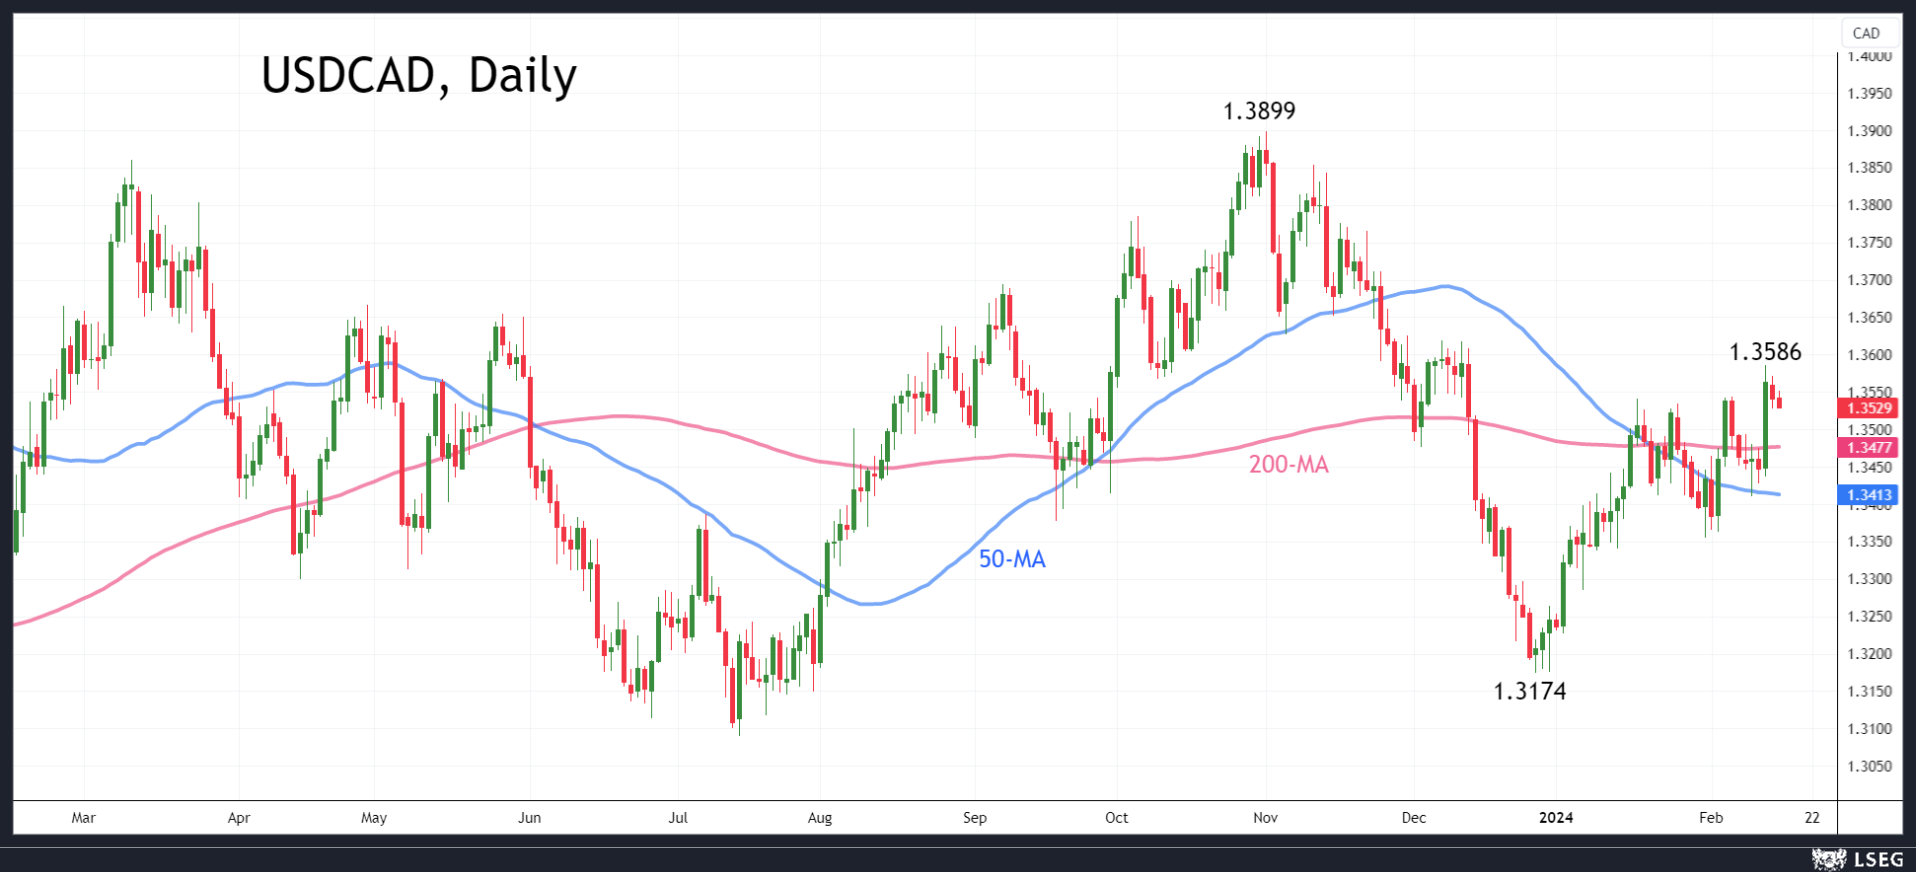
Dollar/loonie hit a two-month peak of 1.3586 earlier this week, as rate cut expectations for the Fed were further pushed back. Fresh gains for the greenback combined with a selloff in the loonie could push the pair to the November 2023 peak of 1.3899.
However, if Canadian inflation surprises to the upside, dollar/loonie could initially seek support at the 50-day moving average just above the 1.3400 level before heading for the December low of 1.3174.
Beyond all the speculation about rate cuts, the loonie has been unable to reap the benefits of the recent recovery in oil prices, suggesting that US dollar dynamics remain in the driving seat. It also implies that in the event the data points to a more aggressive rate cut path for the BoC, oil prices are likely to offer limited support to the loonie.