Sample Category Title
JP 225 Index in Sight of Historic Peak
- JP 225 index approaches its 1989 record high
- Bulls might be exhausted as overbought signals detected
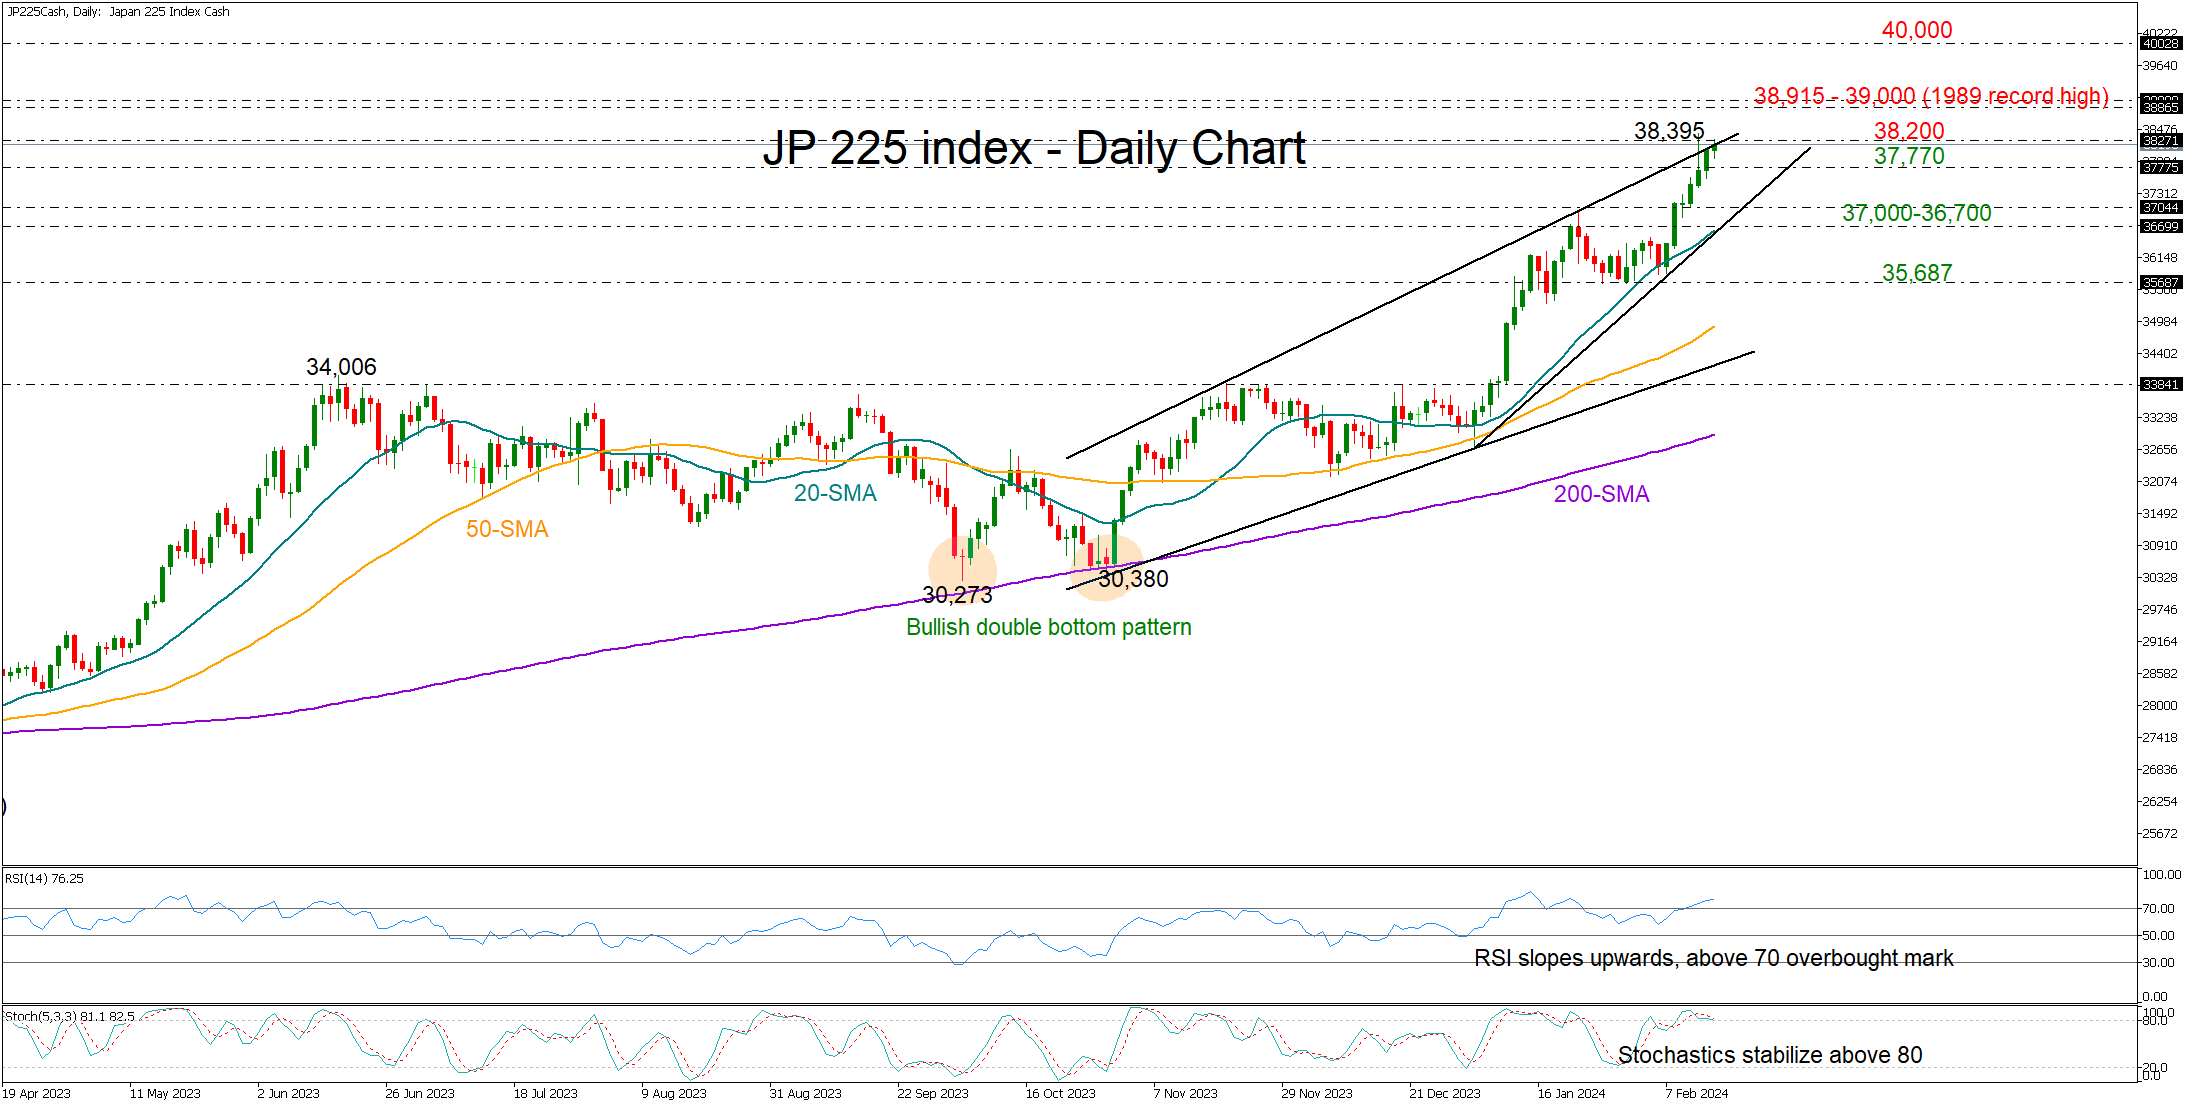
Japan’s 225 stock index (cash) marked another green day on Thursday despite GDP figures pointing to a recessionary economy, extending its weekly bull run closer to the 1989 record high of 38,915.
While the upward pattern has shown no cracks so far, the market might be at risk of a downside correction. Specifically, the price could not strengthen its positive momentum above the resistance trendline, which connects the highs from November 2023 and January 2024 at 38,200. The overbought signals coming from the RSI and the stochastic oscillator are adding to the negative risks.
In the event of a pullback, the index could initially retest the 37,770 region ahead of the 37,000 round level. An extension lower could challenge the 20-day simple moving average (SMA) near the tentative support trendline at 36,700. A break lower would dampen market sentiment, likely causing a sharper decline towards the 35,678 floor.
If the bulls stay in charge, the price may attempt to pierce through the critical 38,915-39,000 wall. A successful penetration higher would open a new chapter for the market, bringing the 40,000 number on the radar.
All in all, Japan’s 225 index is in a bullish mode, though whether the bulls have more fuel to extend the ongoing uptrend in the coming days remains to be seen as the price is currently hanging near an important resistance.
GBP/USD – UK in Recession But That’s Unlikely to Sway BoE Yet
- UK GDP -0.3% in Q4 and -0.1% in December
- BoE not concerned about recession
- GBPUSD momentum fading near February lows?
The UK fell into recession in the second half of last year after GDP figures for the fourth quarter showed a steeper contraction than expected.
While a recession was expected ahead of the release, the fourth quarter number was slightly worse despite December performing better than anticipated.
The UK has been flirting with recession for some time but despite the inevitable headlines, today's data doesn't change much. The economy isn't growing, nor has it for the bulk of the last couple of years. It's just on this occasion it's tipped slightly the other way and recorded two small negative quarters of growth.
Not that flat growth is anything to celebrate, of course, but many feared it would be much worse when rates started rising and increased to the level they have. The economy, like those in many other countries, has shown significant resilience and is expected to bounce back this year.
The Bank of England obviously won't be swayed by the technical recession, as Governor Bailey alluded to earlier this week, but weaker household spending may suggest demand isn't as strong as they anticipated. We'll get another update on that tomorrow from the January retail sales figures.
With inflation expected to fall to target in the second quarter, maybe even further after this week's readings, the debate around rate cuts could intensify earlier than they would have otherwise thought. Slower wage growth would obviously help that along greatly.
Losing momentum already?
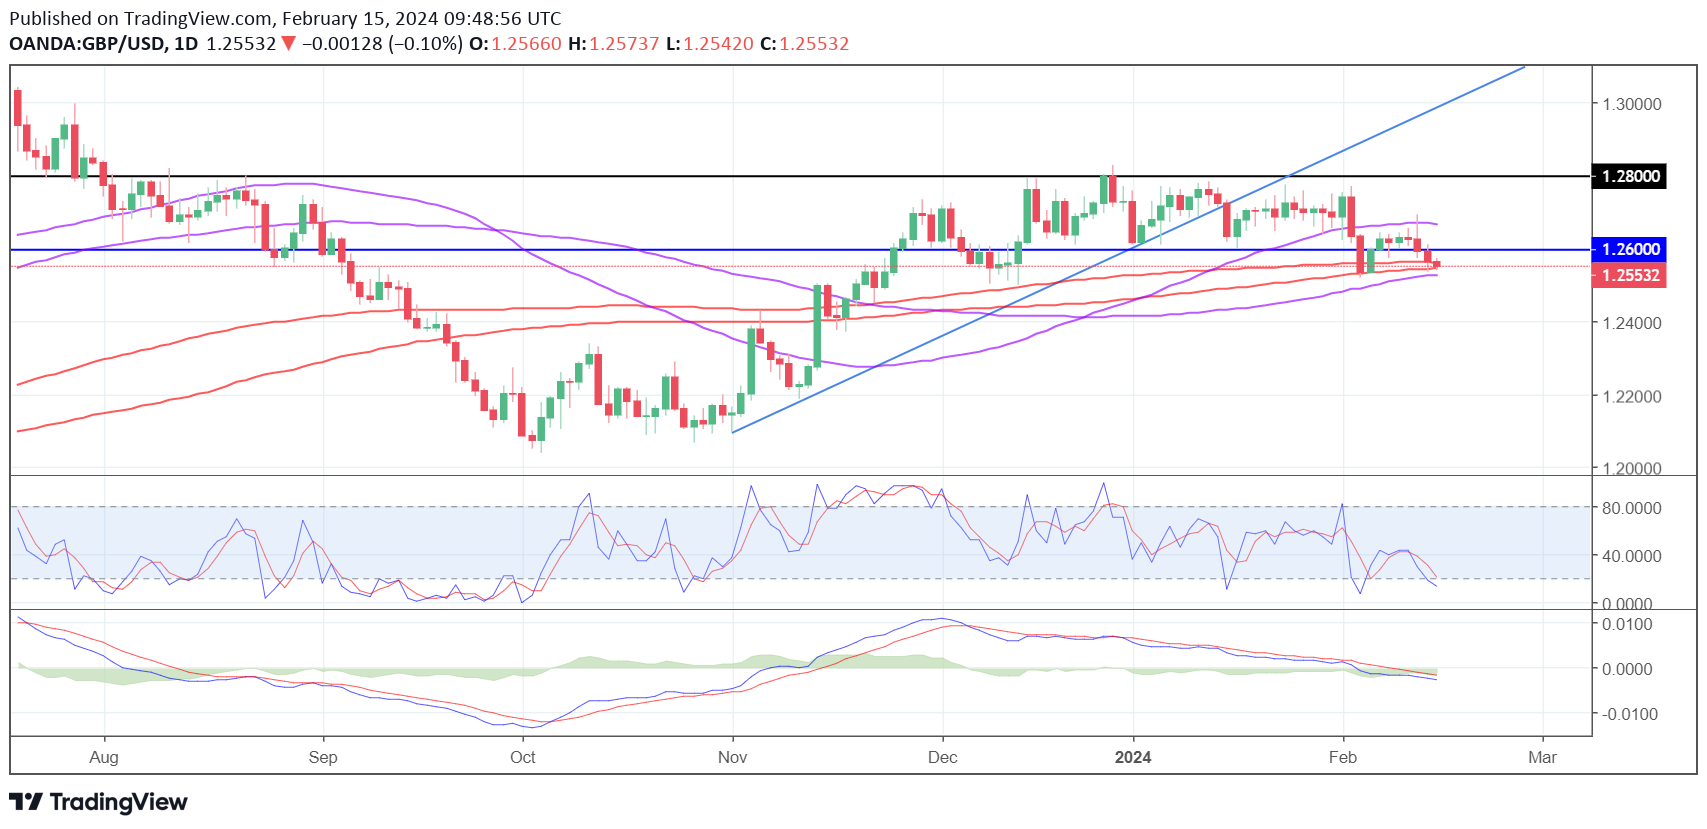
The pound has been drifting lower against the dollar this week on the back of the data but it's yet to surpass the low from earlier this month.
GBPUSD Daily
Source – OANDA
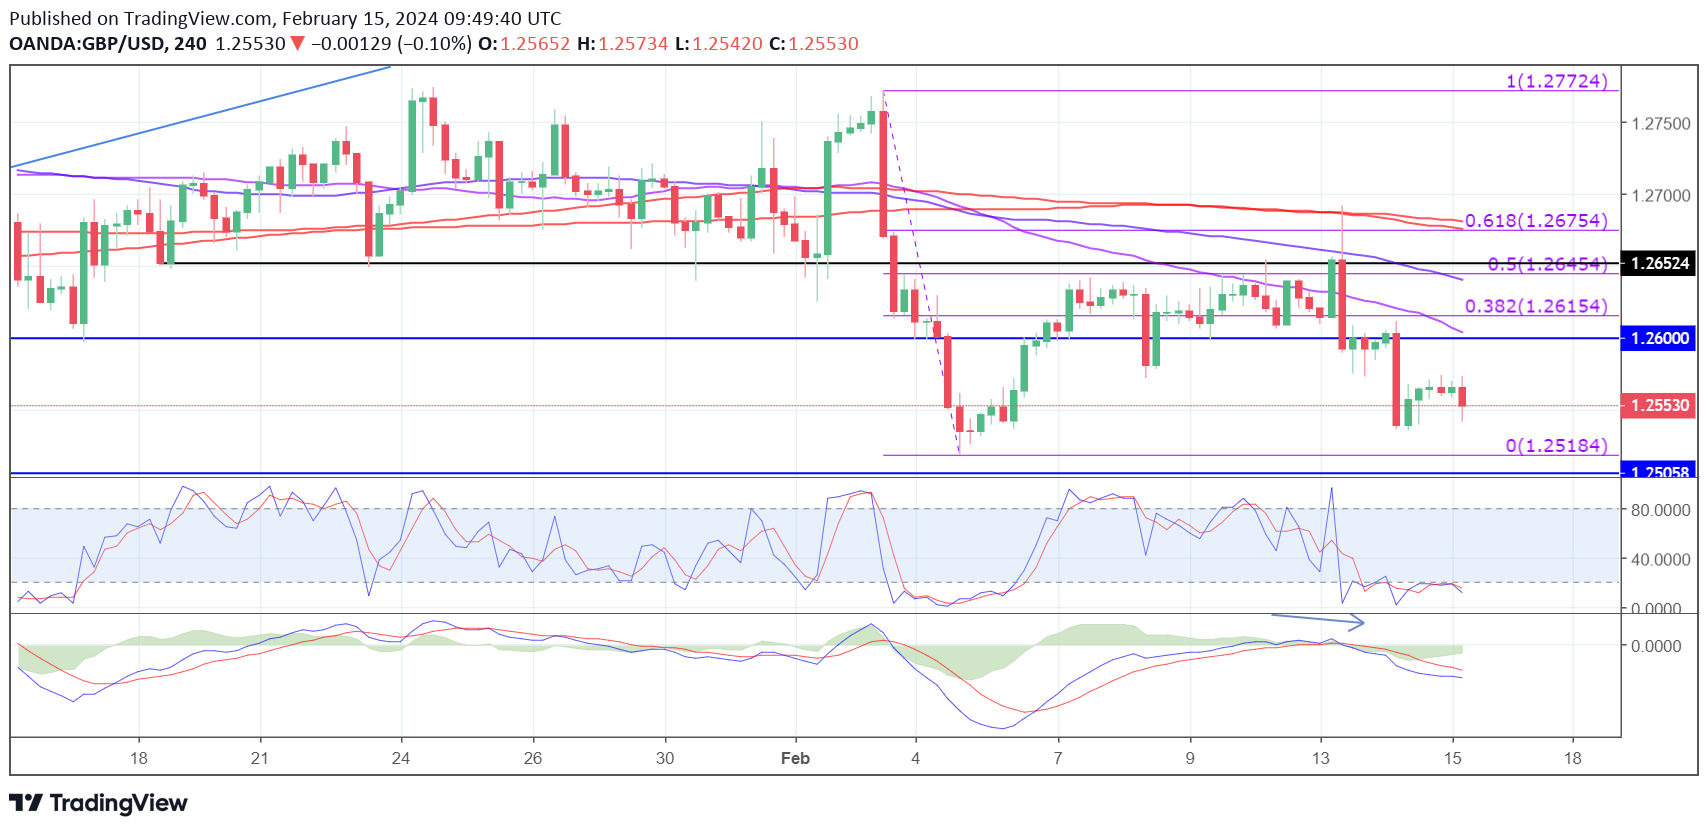
That's not to say it won't and as we can see on the 4-hour chart below, the correction led to a rebound off the 61.8% Fibonacci retracement level following the topping formation breakout earlier in the month, looks to have been another bearish signal.
GBPUSD 4-Hour
What will be interesting is the momentum indicators as we approach those lows though as they already appear to be softening which could be a red flag.
USD/JPY: Correction Likely to be Limited
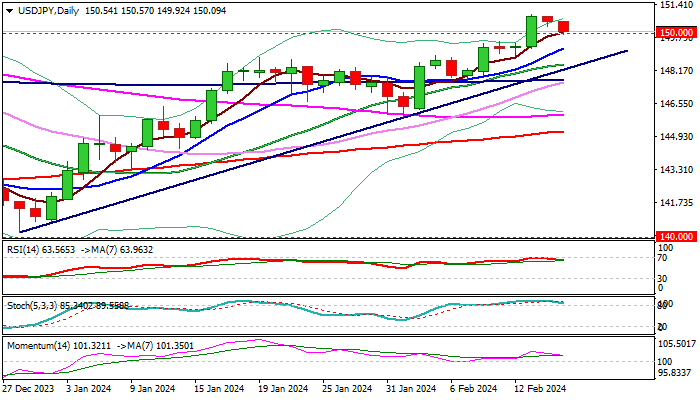
USDJPY extends pullback from the three-month high (150.88) into second straight day, as traders booked profits after Tuesday’s rally of nearly 1%.
Overbought daily studies contributed to fresh selling, which is expected to push the price lower and offer better levels for new entries into broader bullish market.
Correction is likely to be limited as larger bulls remain fully in play, with initial support at 150 being cracked and guarding rising 10DMA (149.24) and extended dips to find ground above the bull-trendline (148.43) to mark a healthy correction and keep bulls in play for push towards key barrier at 151.90 (2023 high, posted on Nov 13).
Weekly close above psychological 150 level, will be the first one since early November and expected to boost existing bullish outlook.
Res: 150.88; 151.00; 151.43; 151.90.
Sup: 150.00; 149.24; 148.80; 148.43.
GBPUSD Edges Down as UK Slips into Mild Recession
- GBPUSD holds above key support trendline despite disappointing UK GDP data
- Short-term trend deteriorates, but confirmation needed below 1.2500
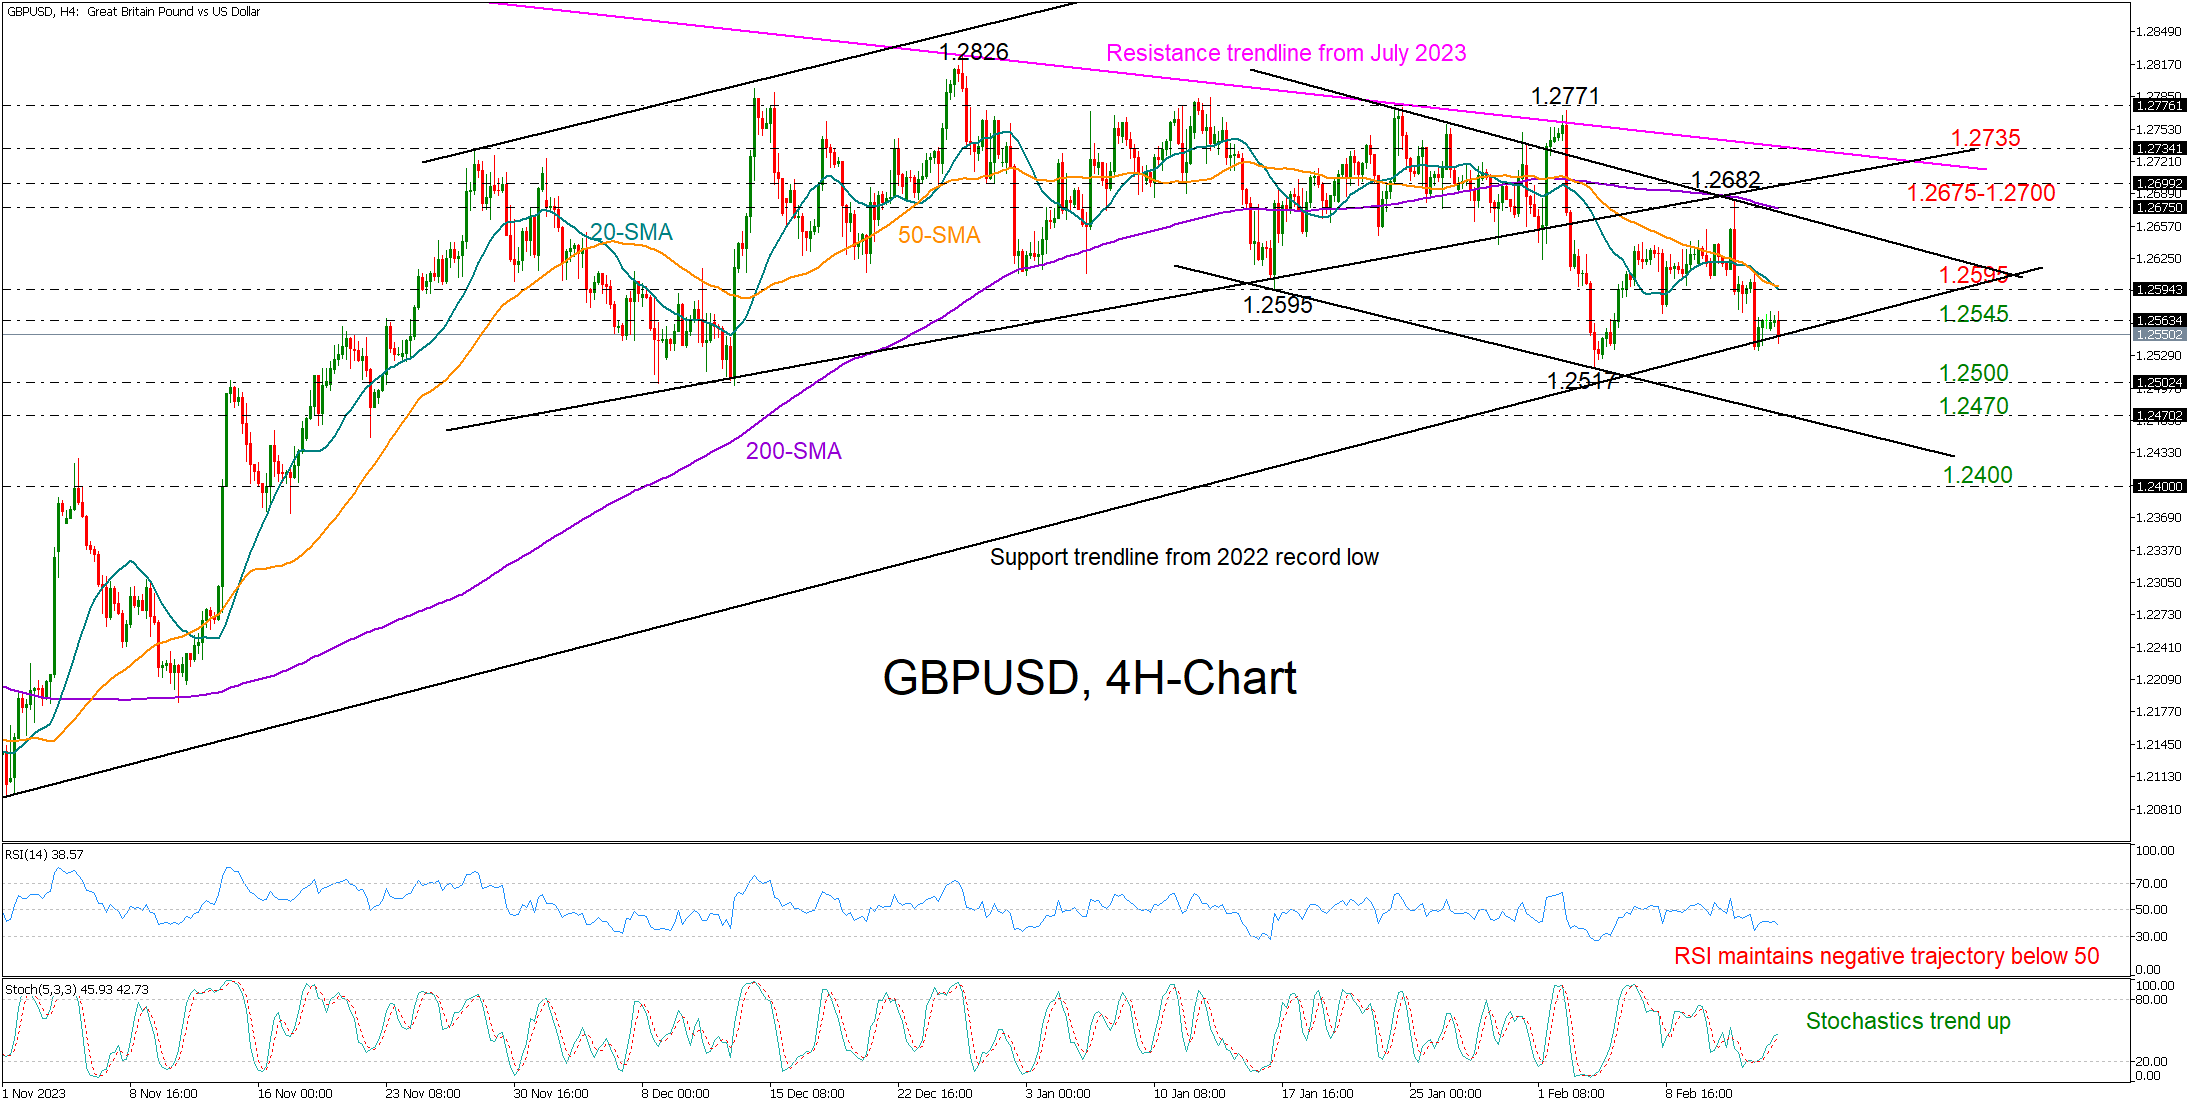
GBPUSD remained squeezed between the 1.2563 resistance and the key support trendline from the 2022 record low in the four-hour chart despite the UK economy falling into a mild technical recession in Q4 2023.
The market trend is leaning on the downside as the price has already printed a lower low at 1.2517 and a lower high at 1.2682. On the other hand, the technical indicators are sending mixed signals, with the RSI maintaining its negative trajectory below its 50 neutral mark and the stochastic oscillator sloping upwards.
If the price closes below 1.2550 in the coming hours, sellers could next target the 1.2500 round level. A break lower would confirm a negative trend reversal, pressing the price towards the lower boundary of the short-term bearish channel at 1.2470. If the decline continues from there, the door will open for the 1.2400 mark.
On the upside, a step above 1.2563 could immediately halt near the 20- and 50-period simple moving averages (SMAs) at 1.2595. Should the bulls jump that wall, the pair could accelerate towards the 200-period SMA at 1.2675, while an extension above the broken ascending trendline from mid-December could face a test around the critical 2023-2024 resistance trendline at 1.2735.
In summary, GBPUSD is maintaining a cloudy outlook in the short-term picture, with sellers awaiting a clear misstep below 1.2550 to press the price lower.
Is a Correction Around the Corner for US 30 Cash Index?
- US 30 index in the green again, after Tuesday’s decent correction
- It remains a tad below its all-time high but bulls might start to worry
- Momentum indicators mixed; all eyes on the stochastic oscillator
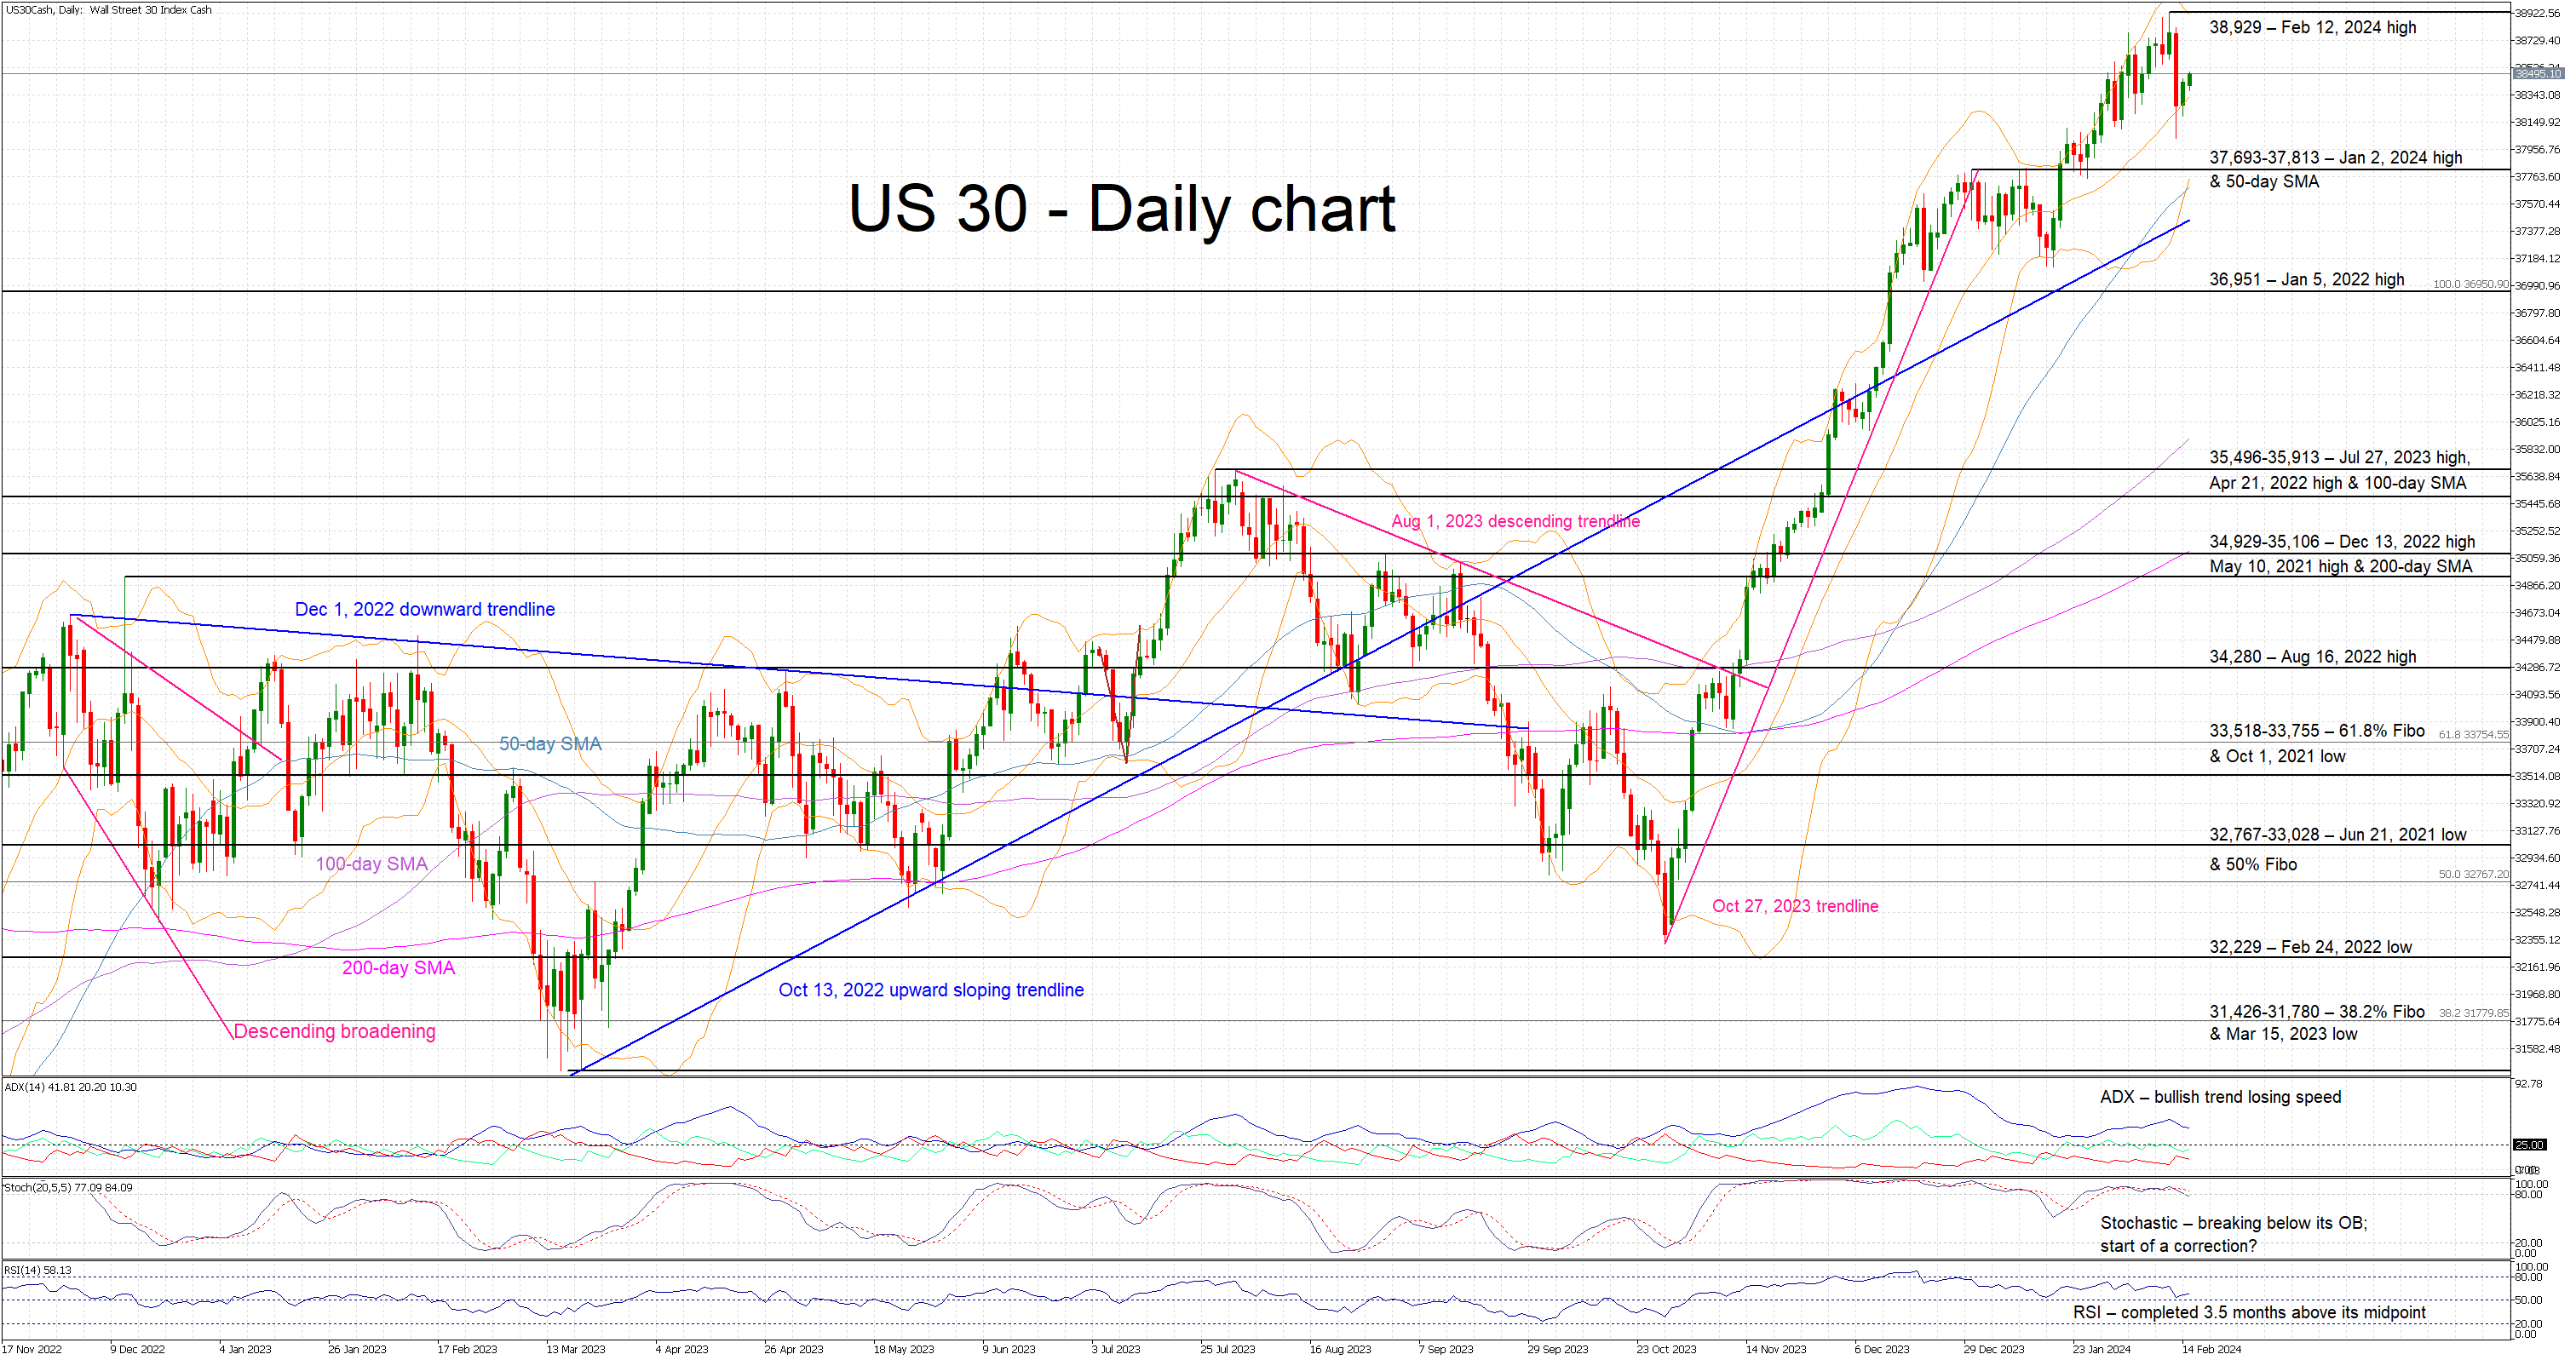
The US 30 cash index is in the green again today, reacting to Tuesday’s sizeable red candle that slightly unnerved the bulls. The index remains a tad below its February 13, 2024 high at 38,929 but it is evident that the market is questioning its direction following an almost straight-line rally. The US 30 index is currently 19% higher than the October 27, 2023 trough.
In the meantime, certain momentum indicators could be on the verge of sending bearish signals. More specifically, the Average Directional Movement Index (ADX) is edging lower with the DI+ subcomponent remaining stuck below the 25-midpoint. Similarly, the stochastic oscillator has broken below its overbought (OB) area, and it is trying to widen the gap from its moving average. Should this move pick up speed, it could be seen as a strong bearish signal. On the other hand, the RSI has completed three months above its 50-midpoint and is thus revealing the ongoing bullish pressure.
Should the bulls ignore the mixed signals, they could try to regain market control and lead the US 30 index towards the February 12, 2024 high at 38,929. If they manage to overcome this area, they could then stage a much stronger rally with the 40,000 level possibly being the next key target.
On the flip side, the bears are trying to recapture the market reins and gradually push the US 30 index towards the 37,693-37,813 range, which is populated by the January 2, 2024 high and the 50-day simple moving average (SMA). The bears could then aim for the next support area at 36,951 provided they manage to overcome the long-term October 13, 2022 upward sloping trendline.
To sum up, the US 30 cash index bulls are still enjoying their hard-earned gains but Tuesday’s strong red candle and some early bearish signs from the momentum indicators could gradually turn the table in favour of the bears.
AUD/USD Price Reaction to Labour Market News Provides Important Information for Analysis
Australia's unemployment rate rose to a two-year high of 4.1% in January, while employment was little changed although analysts had expected around 25,000 new jobs, data released this morning showed.
It is believed that weak labour market data should prompt central bank officials to ease monetary policy, which is currently aimed at fighting inflation. According to Trading Economics, the Reserve Bank of Australia is expected to cut interest rates by about 40 basis points this year.
The first reaction to the news was the weakening of the Australian dollar (counting on the easing of the Central Bank's policy), but by the opening of the European session, the price of AUD/USD had recovered a significant part of the decline, which provides important food for thought.
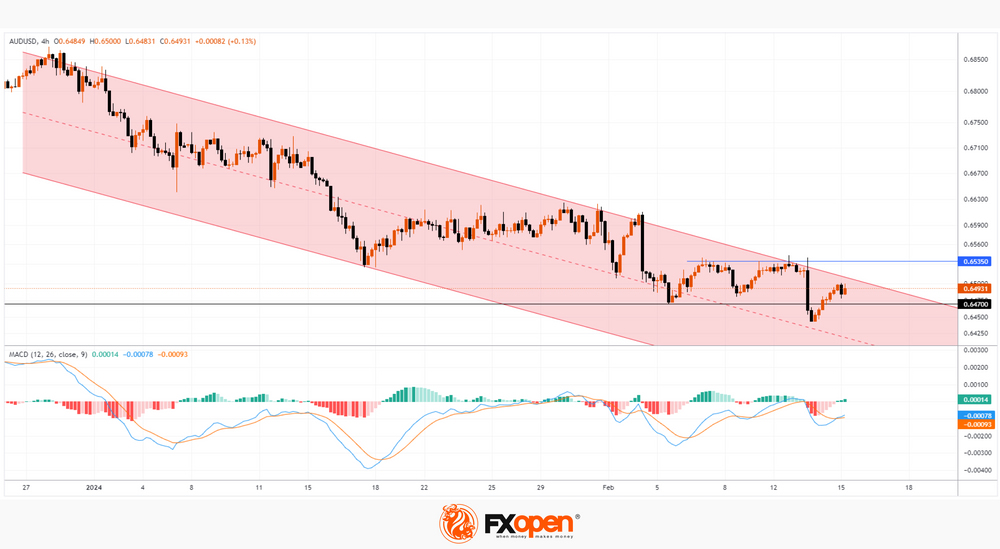
The AUD/USD chart shows that the price is within a downward trend (shown by the red channel), however, there are a number of signs that the bearish pressure has exhausted. The fact that the AUD/USD price is showing some recovery after the initial negative reaction to the unemployment news is one such sign.
It should also be noted that:
→ the median line of the descending channel now acts as support;
→ MACD moved into the green zone;
→ the price was unable to consolidate below the level of 0.647.
This means that if we regard the fundamental background as bearish, then the price shows stability through its action, which can be regarded as a manifestation of the forces of demand. Therefore, it is possible that the bulls will try to break through the upper limit of the current downward channel. If this happens, the price may face resistance at 0.65350.
Trade over 50 forex markets 24 hours a day with FXOpen. Take advantage of low commissions, deep liquidity, and spreads from 0.0 pips. Open your FXOpen account now or learn more about trading forex with FXOpen.
This article represents the opinion of the Companies operating under the FXOpen brand only. It is not to be construed as an offer, solicitation, or recommendation with respect to products and services provided by the Companies operating under the FXOpen brand, nor is it to be considered financial advice.
ECB’s Lagarde highlights wage growth as increasingly important inflation
In a European Parliament committee hearing, ECB President Christine Lagarde highlighted that the "ongoing disinflation process" is expected to continue "gradually further down over 2024," attributing this trend to the diminishing effects of past upward shocks and the impact of tighter financing conditions on inflation.
Lagarde noted a "gradual decline" in core inflation, which excludes energy and food prices, while also pointing out the "signs of persistence" in services inflation.
Significantly, Lagarde identified wage growth as a crucial factor, stating it is becoming an "increasingly important driver of inflation dynamics." ECB's wage tracker signals sustained wage pressures, although there's "some levelling off" observed in the latest quarter of 2023. The direction of wage pressures in 2024 largely depends on "ongoing or upcoming negotiation rounds" affecting a broad segment of the workforce.
Furthermore, Lagarde observed that the influence of unit profits on domestic price pressures is on the decline, suggesting that wage increments are being partly accommodated through "profit margins."
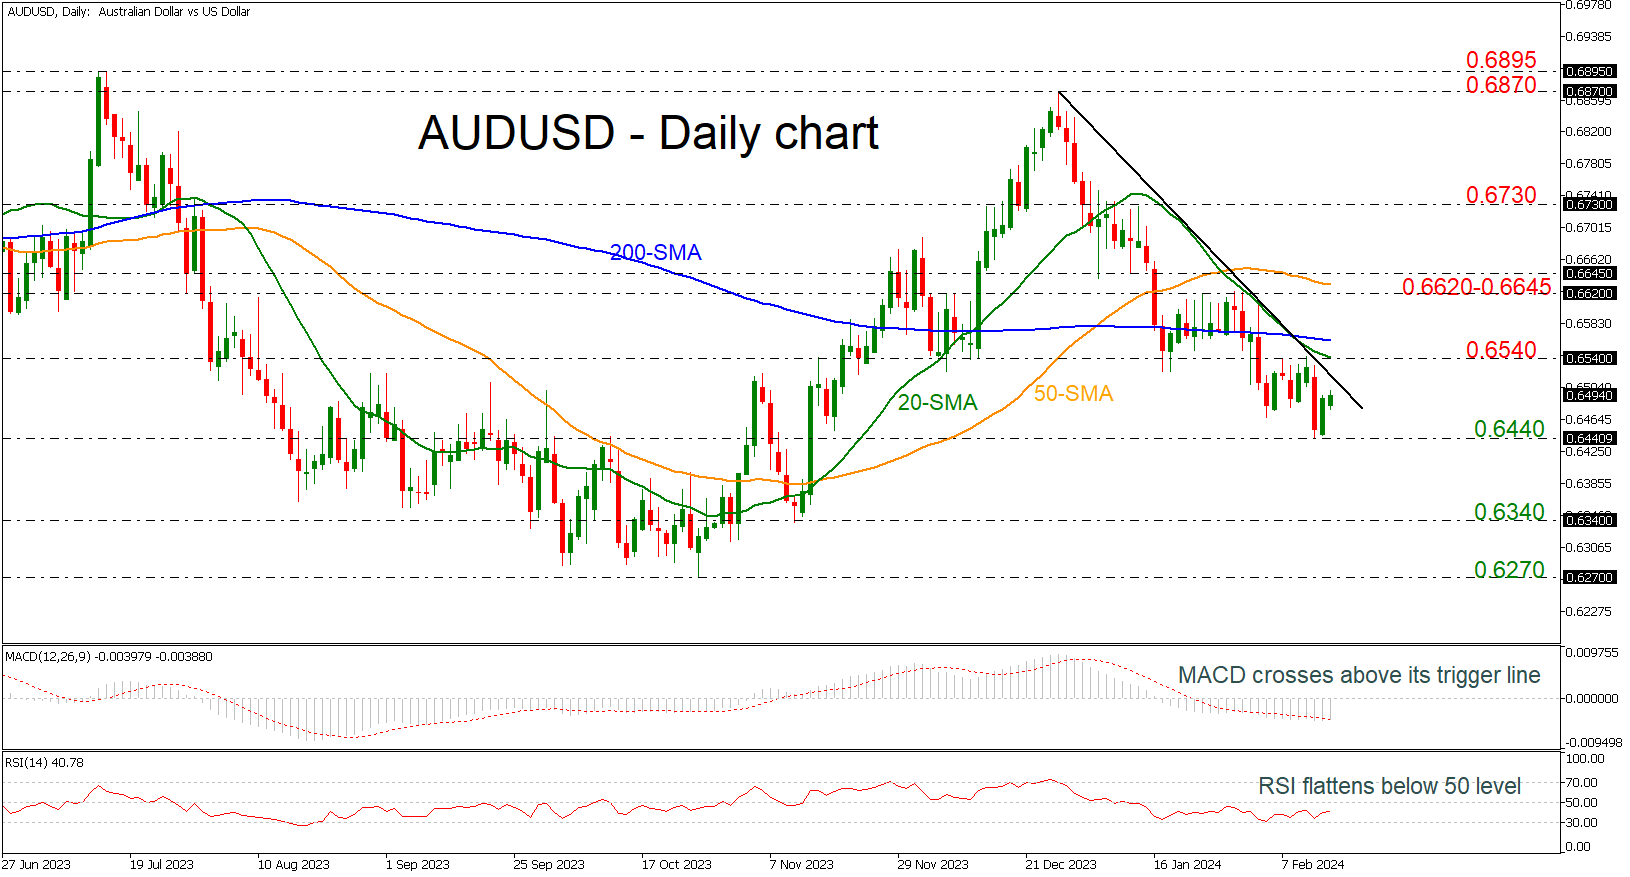
AUDUSD Rises from 0.6440 Bottom
- AUDUSD still holds below the downtrend line
- But MACD and RSI suggest bullish correction
AUDUSD has been overperforming over the last two sessions after the rebound off the 0.6440 support level. However, the market remains beneath the short-term descending trend line, which has been drawn after the price peaked at 0.6870.
Technically, the MACD oscillator is crossing to the upside of its trigger line in the negative territory, while the RSI, following the strong bounce off the 30 level, is currently moving horizontally below the neutral threshold of 50.
If the buying interest persists, immediate resistance could come from the 0.6540 resistance level, which overlaps with the 20-day simple moving average (SMA) and stands slightly above the falling trend line. More aggressive bullish movements could meet the 200-day SMA at 0.6563 ahead of the crucial area of 0.6620-0.6645, which encapsulates the 50-day SMA.
Alternatively, if there is a decline beneath the previous bottom of 0.6440, the pair may challenge the 0.6340 support, registered on November 10, before heading south at 0.6270.
To sum up, AUDUSD has been developing in a descending movement and only a significant climb above the 0.6620-0.6645 resistance zone may switch the outlook to a neutral one.
WTI Oil Futures Get Rejected at 200-day SMA
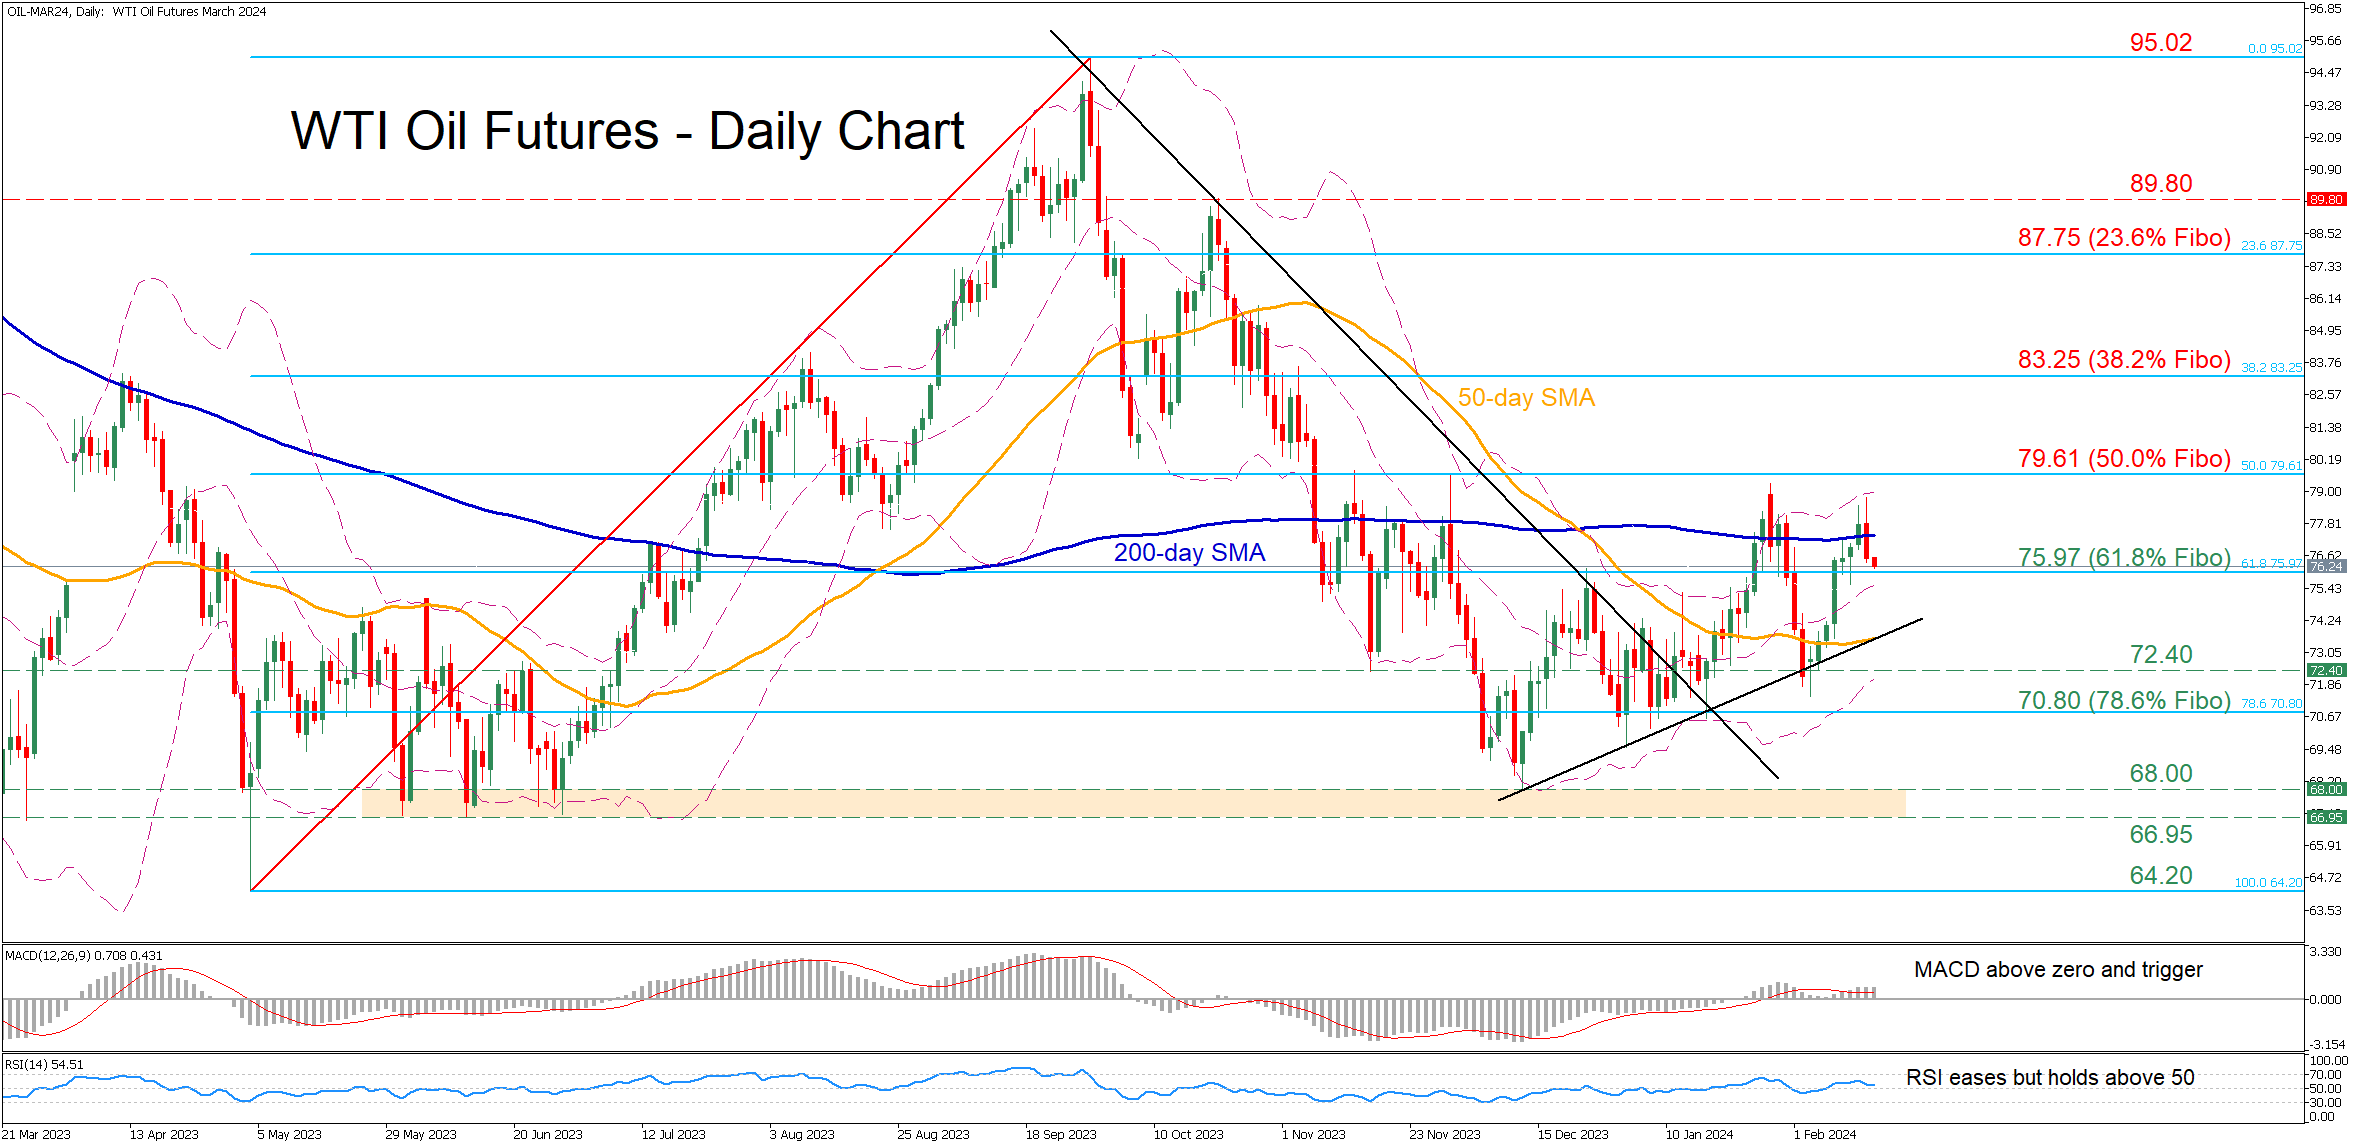
- WTI futures retreat after testing 200-day SMA
- Pattern formation resembles a double top
- Momentum indicators weaken but remain positive
WTI oil futures (March delivery) had been staging a comeback after their decline below the 50-day simple moving average (SMA) came to an end in early February. However, the bulls failed to conquer the 200-day SMA, which led to the price reversing back lower on Wednesday.
Should bearish pressures persist, oil futures could challenge 75.97, which is the 61.8% Fibonacci retracement of the 64.20-95.02 upleg. Lower, the November bottom of 72.40 could act as the next line of defence. A violation of that zone could set the stage for the 78.6% Fibo of 70.80 ahead of the 66.95-68.00 support range defined by June lows and the recent six-month bottom.
On the flipside, if buyers re-emerge and propel oil above the 200-day SMA, immediate resistance could be found at the 50.0% Fibo of 79.61. Further upside attempts could then stall around the 38.2% Fibo of 83.25. Surpassing that zone, the price could ascend to face the 23.6% Fibo of 87.75.
In brief, WTI oil futures lost some ground after getting rejected a tad below their January high, generating a bearish double-top pattern. For the bulls to regain confidence, the price needs to close above the 200-day SMA.
GBP/JPY Daily Outlook
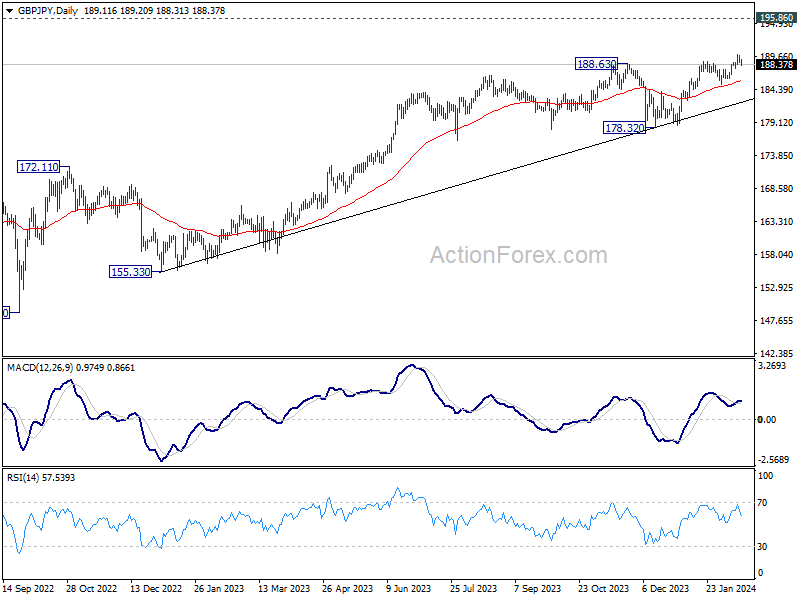
Daily Pivots: (S1) 188.70; (P) 189.31; (R1) 189.87; More...
Intraday bias in GBP/JPY remains neutral at this point, for consolidations below 190.05. Break 190.05 will resume larger up trend. However, break of 187.83 will turn bias to the downside for deeper correction back to 185.21 support instead.
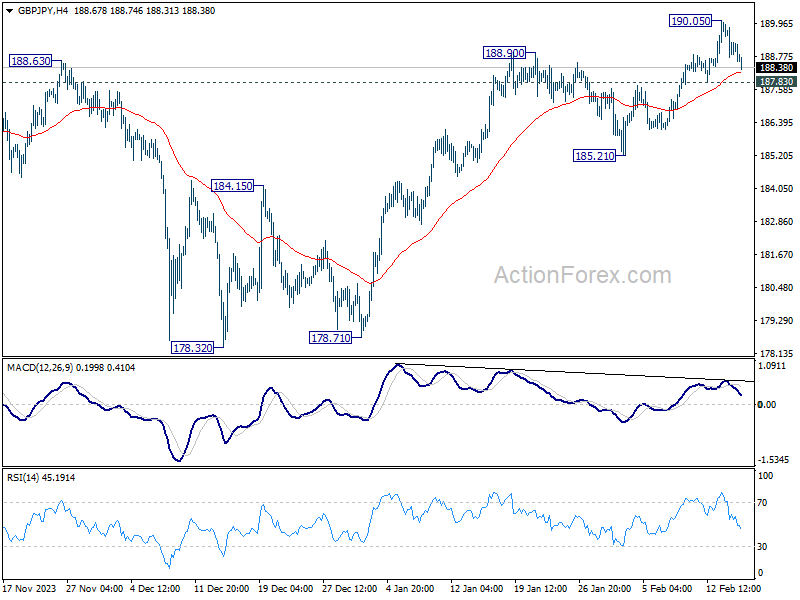
In the bigger picture, up trend from 123.94 (2020 low) in in progress. Medium term outlook will stay bullish as long as 178.32 support holds. Next target is 195.86 long term resistance (2015 high).