

Sample Category Title
Canadian Dollar Rises on Strong Job Data, Yen and Franc Weakness Persists
Canadian Dollar bounces broadly in early US session, bolstered by unexpectedly robust Canadian employment data. This development comes amidst cautious remarks earlier in the week from BoC Governor Tiff Macklem, who tempered expectations by noting that achieving the 2% inflation target would be a gradual process, fraught with persistent risks. The January meeting minutes echoed this sentiment, highlighting concerns over the potential for enduring inflationary pressures and the dangers associated with prematurely easing monetary policy. Today's employment figures would likely provide BoC's more hawkish members with additional justification for maintaining a cautious stance on monetary adjustments.
The broader currency market is also reacting to a mild uptick in risk sentiment, which appears to be favoring commodity currencies at large. New Zealand Dollar is currently leading the pack, buoyed by ANZ's forecast that RBNZ will deliver rate hikes in both February and April. Australian Dollar is having a moderate increase as well, albeit at a slower pace compared to its counterparts.
The general trend towards strength in commodity currencies contrasts with the ongoing weakness observed in the Swiss Franc and Japanese Yen. Meanwhile, Dollar, Euro, and Sterling are continuing their range-bound trading patterns, reflecting a period of extended consolidation.
In Europe, at the time of writing, FTSE is up 0.15%. DAX is up 0.13%. CAC is up 0.02%. UK 10-year yield is down -0.0038 at 0.4048. Germany 10-year yield is down -0.0011 at 0.2356. Earlier in Asia, Nikkei rose 0.09%. Hong Kong HSI fell -0.83%. Singapore Strait Times fell -0.15%. Japan 10-year JGB yield rose 0.0253 to 0.724.
Canada's employment rises 37k in Jan, unemployment down to 4.7%
Canada's employment grew strongly by 37k in January, well above expectation of 35k.
Unemployment rate fell -0.1% to 5.7%, the first decline since December 2022, and below expectation of a rise to 5.9%. Participation rate fell -0.2% to 65.3%.
Employment rate fell -0.1% to 61.6%, as population growth (+0.4%) outpaced employment growth (+0.2%).
Average hourly wages rose 5.3% yoy, slowed from prior month's 5.4% yoy.
ECB's Kazaks: Summer the moment for rate cut, not Spring
ECB Governing Council member Martins Kazaks provided a tempered outlook on the prospects of interest rate reductions within Eurozone, cautioning against premature expectations for cuts as early as spring. In an interview with Latvijas Radio, Kazaks outlined his stance on the timing and conditions necessary for beginning to ease ECB's monetary policy stance.
"At the moment, there are expectations that the rates could be cut in the spring, in March or April — I wouldn't be optimistic," Kazaks stated. He advocates for a patient and data-driven approach, emphasizing the importance of ensuring that inflation trends are firmly under control before considering rate reductions.
"I would be cautious and I would wait until the inflation story is over. Then we can safely breathe and those rates can be lowered step by step," he elaborated.
Looking ahead, Kazaks indicated "Summer could be that moment". However, he cautioned that would depend on incoming data. "If nothing negative happens, that pushes up inflation and geopolitical risks, if nothing like that happens then this will be the year that rates start to be lowered," he added.
ECB's Villeroy confident in Eurozone's path to overcoming inflation sickness
ECB Governing Council member Francois Villeroy de Galhau, in an interview with LCI television, anticipates reducing interest rates within the year, marking a significant move away from the aggressive inflation-fighting measures.
"We will probably cut rates this year because we are making progress against inflation," Villeroy stated.
"We are exiting the emergency of fighting inflation and are on the right path to overcome the sickness," he elaborated.
Further bolstering this positive outlook, Villeroy projected gradual acceleration in economic growth in France in the coming months, fueled by decline in inflation rates that is expected to fall below pace of wage increases.
Bank of France's forecast, as mentioned by Villeroy, anticipates avoiding a recession, with an expected expansion rate of about 0.9% for the year.
BoE's Haskel defends focus on inflation persistence without regret
BoE MPC member Jonathan Haskel emphasized the importance of caution when interpreting UK's recent decline in headline inflation to 4% in December. While acknowledging this positive trend, he stressed the necessity of focusing on more enduring aspects of inflation.
"I'm not going to apologize for banging on about persistence because I think we're right to," he asserted. Particularly concerning to Haskel are the underlying measures of price growth, especially within the services sector. Despite the headline inflation drop, these measures have recently plateaued at an annual rate of approximately 6.5%, a level Haskel considers still too high.
"The signs that we've seen thus far are encouraging. I don't think we've seen quite enough signs yet," Haskel remarked. "But if we accumulate more evidence on persistence, then by the very logic I've just set out, I'd be happy to change my vote."
Haskel, who supported another rate hike in the last MPC meeting, described his decision as "finely balanced," highlighting his desire for more time to assess the inflationary trend's durability.
RBA's Bullock: Another hike neither ruled out nor ruled in
In an appearance before a parliamentary economics committee in Canberra today, RBA Governor Michele Bullock acknowledged the presence of "some encouraging signs" in Australia's economic landscape, yet cautioned that the nation's battle against inflation is "not over".
RBA's stance remains deliberately balanced, with Bullock stating, "At this stage, the Board hasn't ruled out a further increase in interest rates but neither has it ruled it in." Interest rate path will "depend upon the data and the evolving assessment of risks".
Bullock further elaborated on the dynamics of demand and supply within the Australian economy, indicating that demand levels continue to outstrip the economy's supply capacity. This imbalance, coupled with persistently tight labor market conditions, suggests that while the observed slowdown in demand is contributing to a moderation of inflationary pressures, the desired equilibrium has yet to be reached.
Goods price inflation has shown a softer trend than anticipated, mirroring patterns observed in international markets, Bullock noted. However, services price inflation remains elevated, driven by significant increases in both labor and non-labor input costs.
"Indeed, while inflation was lower than we were expecting in November, this is largely attributable to softer-than-expected goods inflation – services inflation was pretty much where we had forecast it to be."
ANZ forecasts RBNZ rate hikes, triggering Kiwi surge and AUD/NZD range breakout
New Zealand Dollar rises broadly today, buoyed by ANZ's forecast that RBNZ is set to increase the official cash rate in its upcoming meetings on February 22 and again in April, elevating interest rate to 6%.
ANZ's chief economist, Sharon Zollner, highlighted RBNZ's November warning that stronger-than-expected inflation pressures would necessitate further increases in the OCR.
"Data since then has been a series of small but pretty consistent surprises in that direction," Zollner noted. The economist further elaborated that the cumulative effect of these data surprises, though individually not game-changers, collectively strengthens the argument for the RBNZ to proceed with rate increases.
"Indeed, their OCR forecast peak of 5.69% implied that the burden of proof was now on finding reasons not to hike, strictly speaking," Zollner added.
In the currency markets, AUD/NZD's steep decline and strong break of 1.0658 support affirms the bearish case that consolidation from 1.0469 has completed at 1.0942 already. Outlook will stay bearish as long as 1.0691 support turned resistance holds. Next target is retest of 1.0469 (2022 low).
Decisive break of 1.0469 will resume whole down trend from 1.1489 (2022 high), and pave the way to 61.8% projection of 1.1489 to 1.0469 from 1.0942 at 1.0312 in the medium term.
USD/CAD Mid-Day Outlook
Daily Pivots: (S1) 1.3440; (P) 1.3467; (R1) 1.3485; More...
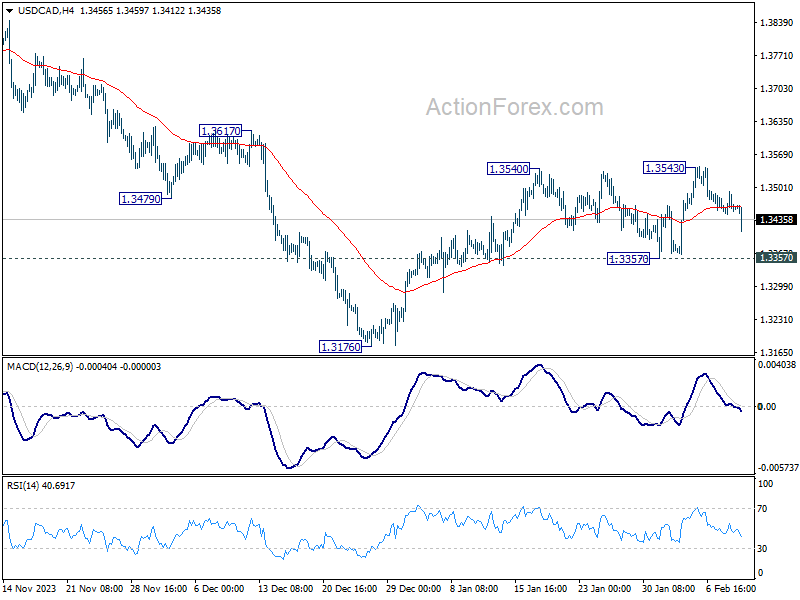
USD/CAD dips notably in early US session but stays well above 1.3357 support. Intraday bias remains neutral first and further rally is in favor. On the upside, decisive break of 1.3540/3 will resume the rise from 1.3176. That will also revive that case that whole fall from 1.3897 has completed, and target this resistance. Nevertheless, firm break of 1.3357 support will argue that rebound from 1.3176 has completed, and target this low for resuming whole fall from 1.3897.
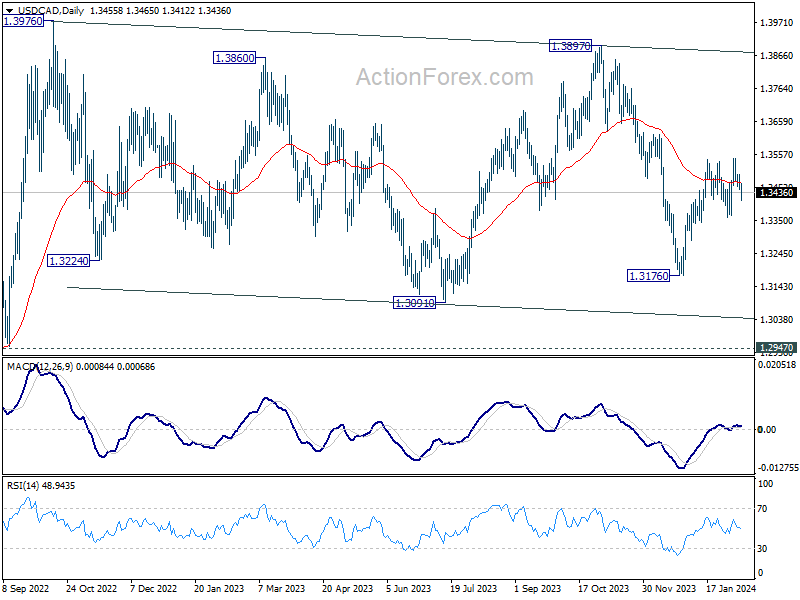
In the bigger picture, price actions from 1.3976 (2022 high) are viewed as a corrective pattern only. In case of another fall, strong support should emerge above 1.2947 resistance turned support to bring rebound. Overall, larger up trend from 1.2005 (2021 low) is still expected to resume through 1.3976 at a later stage.
Economic Indicators Update
| GMT | Ccy | Events | Actual | Forecast | Previous | Revised |
|---|---|---|---|---|---|---|
| 23:50 | JPY | Money Supply M2+CD Y/Y Jan | 2.40% | 2.20% | 2.30% | |
| 07:00 | EUR | Germany CPI M/M Jan F | 0.20% | 0.20% | 0.20% | |
| 07:00 | EUR | Germany CPI Y/Y Jan F | 2.90% | 2.90% | 2.90% | |
| 09:00 | EUR | Italy Industrial Output M/M Dec | 1.10% | 0.50% | -1.50% | -1.30% |
| 13:30 | CAD | Net Change in Employment Jan | 37.3K | 15.0K | 0.1K | |
| 13:30 | CAD | Unemployment Rate Jan | 5.70% | 5.90% | 5.80% |
Canada’s employment rises 37k in Jan, unemployment down to 4.7%
Canada's employment grew strongly by 37k in January, well above expectation of 35k.
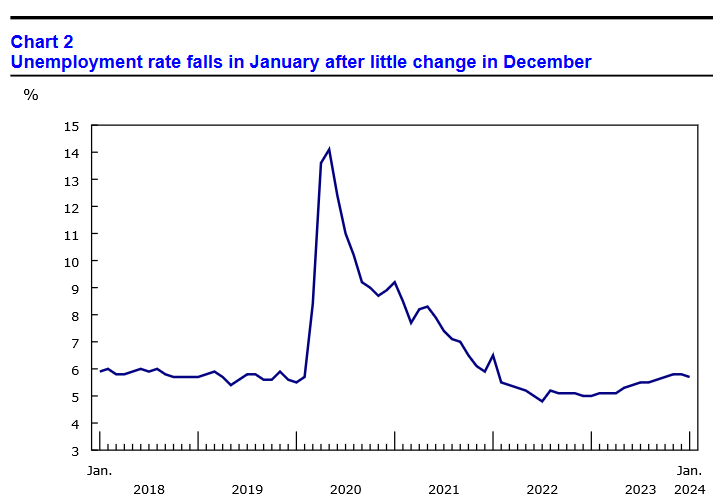
Unemployment rate fell -0.1% to 5.7%, the first decline since December 2022, and below expectation of a rise to 5.9%. Participation rate fell -0.2% to 65.3%.
Employment rate fell -0.1% to 61.6%, as population growth (+0.4%) outpaced employment growth (+0.2%).
Average hourly wages rose 5.3% yoy, slowed from prior month's 5.4% yoy.
Copper’s Fall An Early Signal of Global Slowdown
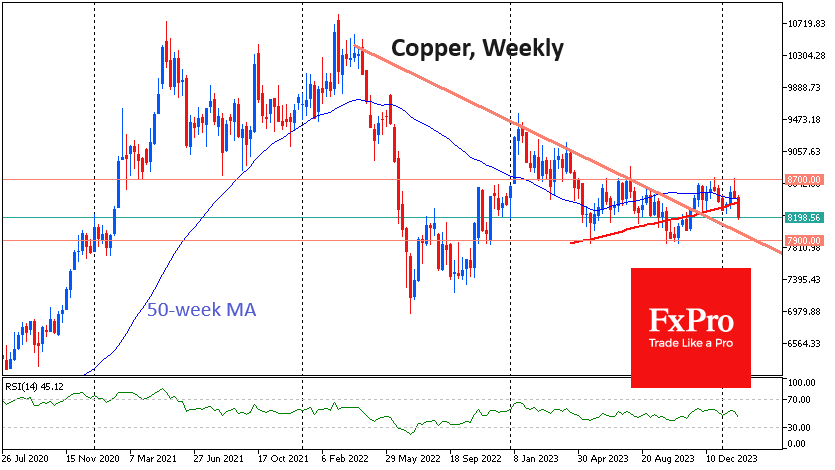
Copper exchange prices on Thursday fell to their lowest since November, approaching $8200 a tonne and breaking out of the broad consolidation range of the past two months.
A move out of the $8250-8700 range technically leaves copper vulnerable to a quick fall into the $7900 region, where the lows of November 2022 and May and October 2023 are centred. The Relative Strength Index (RSI) is temporarily on the bears’ side as it has recorded three consecutive declining local peaks at relatively similar highs over the past two months.
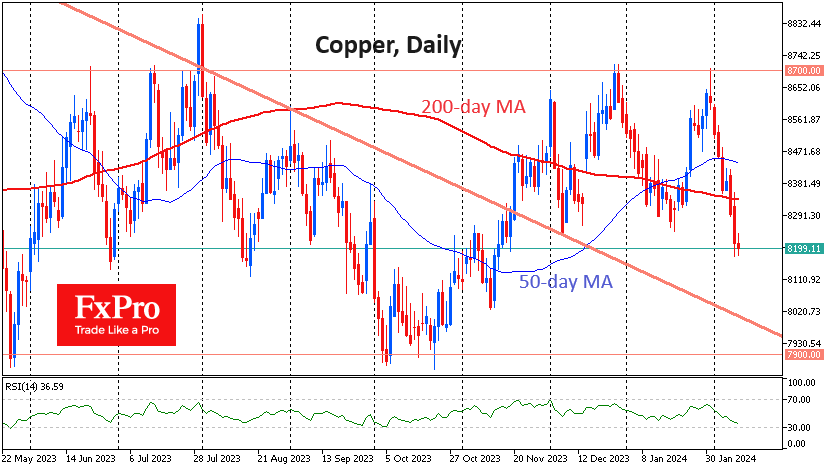
Earlier in the week, the price dipped under its 200-day moving average, and the sell-off has only gained momentum since then.
Copper has sold off almost every trading session since the end of last month, losing around 6% in that time. The selloffs at the start of December and January were almost as persistent but had less amplitude.
Copper broke above a vital downtrend resistance level in November and is now set to test its strength as support. By the end of February, it will be just around $7900, which will further strengthen interest in testing this line.
Copper dynamics are essential not only for traders who hold it but also as a manifestation of global production dynamics. This is a signal of slowing global production despite the optimism of stock markets, where global, US, and European indices are storming new highs.
Further declines in the price of copper could attract more bears to global markets. Markets are receiving a similar bearish signal from the global economy in the form of falling natural gas prices. The price of US futures has fallen into the 2020 bottom area.
GBPUSD Retreats After Bullish Spike
- GBPUSD rests near the 20-period SMA
- RSI and MACD suggest bearish wave
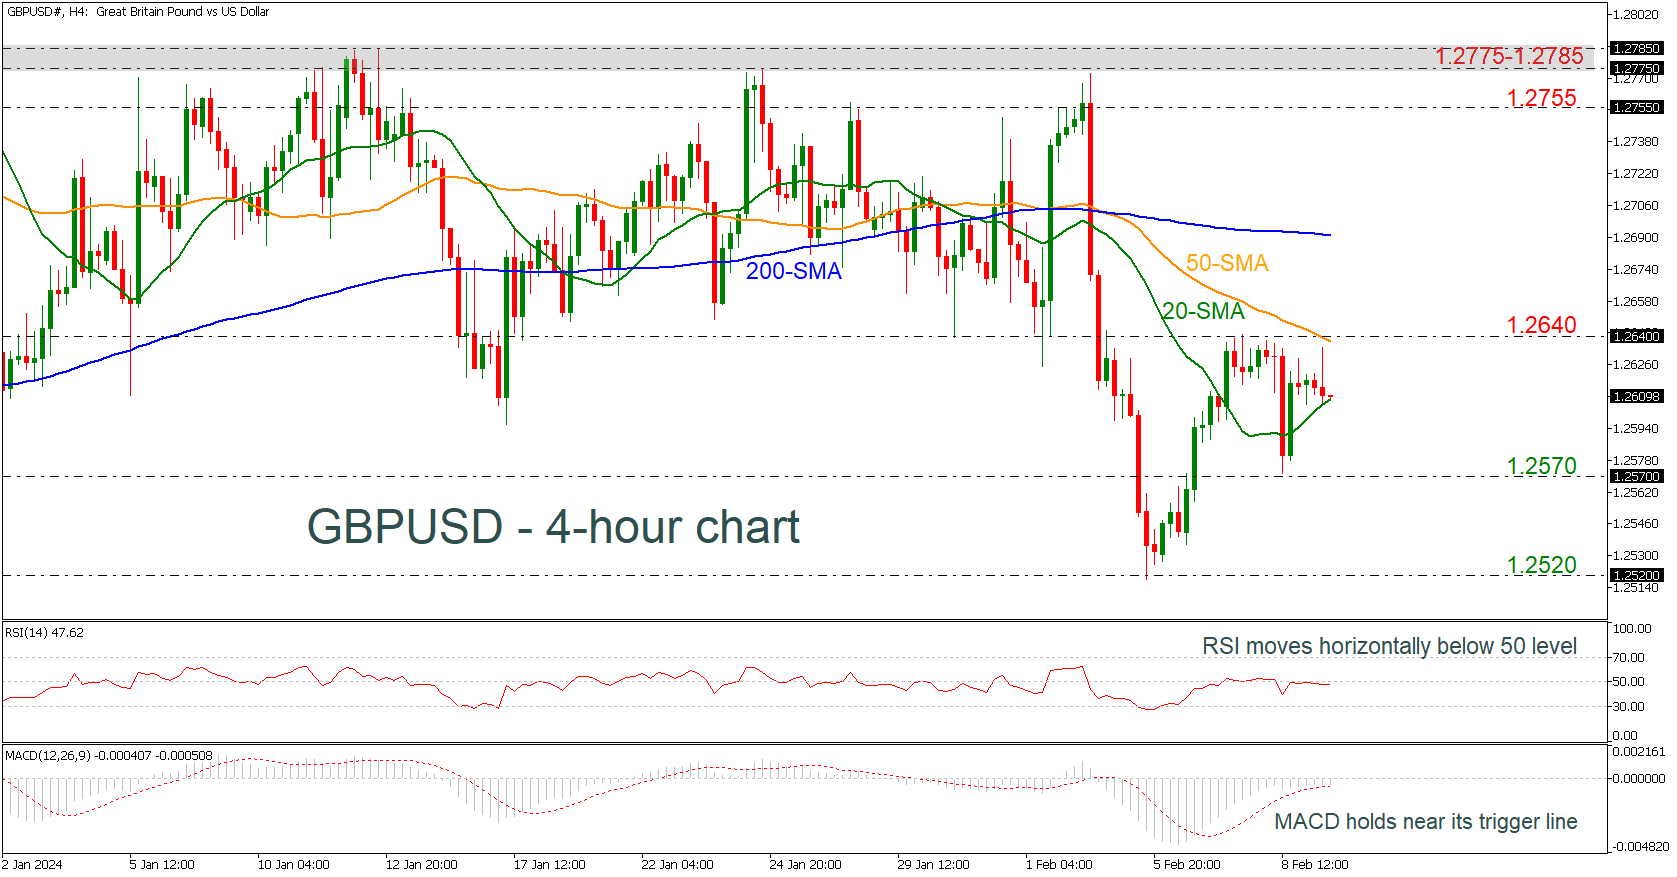
GBPUSD is falling after a bullish spike earlier today, testing the 20-period simple moving average (SMA) in the 4-hour chart.
According to technical oscillators, the RSI is still standing below its 50 neutral mark, losing some pace, and the MACD oscillator has yet to confirm a bearish crossover within its trigger line in the negative territory, both keeping the bias on the downside for now.
In the negative scenario, the 20-period SMA at 1.2605 has been guarding selling forces. Hence, a step beneath that line at 1.2570 might produce fresh negative volatility, likely squeezing the price towards the 1.2520 support level, taken from the lows on February 5.
In the event the pair re-activates its uptrend above the 1.2640 resistance, which coincides with the 50-period SMA, the next target will be the 200-period SMA at 1.2690. Even higher, the bulls might head for the 1.2755, which was a key resistance area during January.
GBPJPY Works Towards Uptrend Resumption
- GBPJPY surrounded by bullish vibes
- Could re-activate long-term uptrend
- Next resistance expected at 189.50
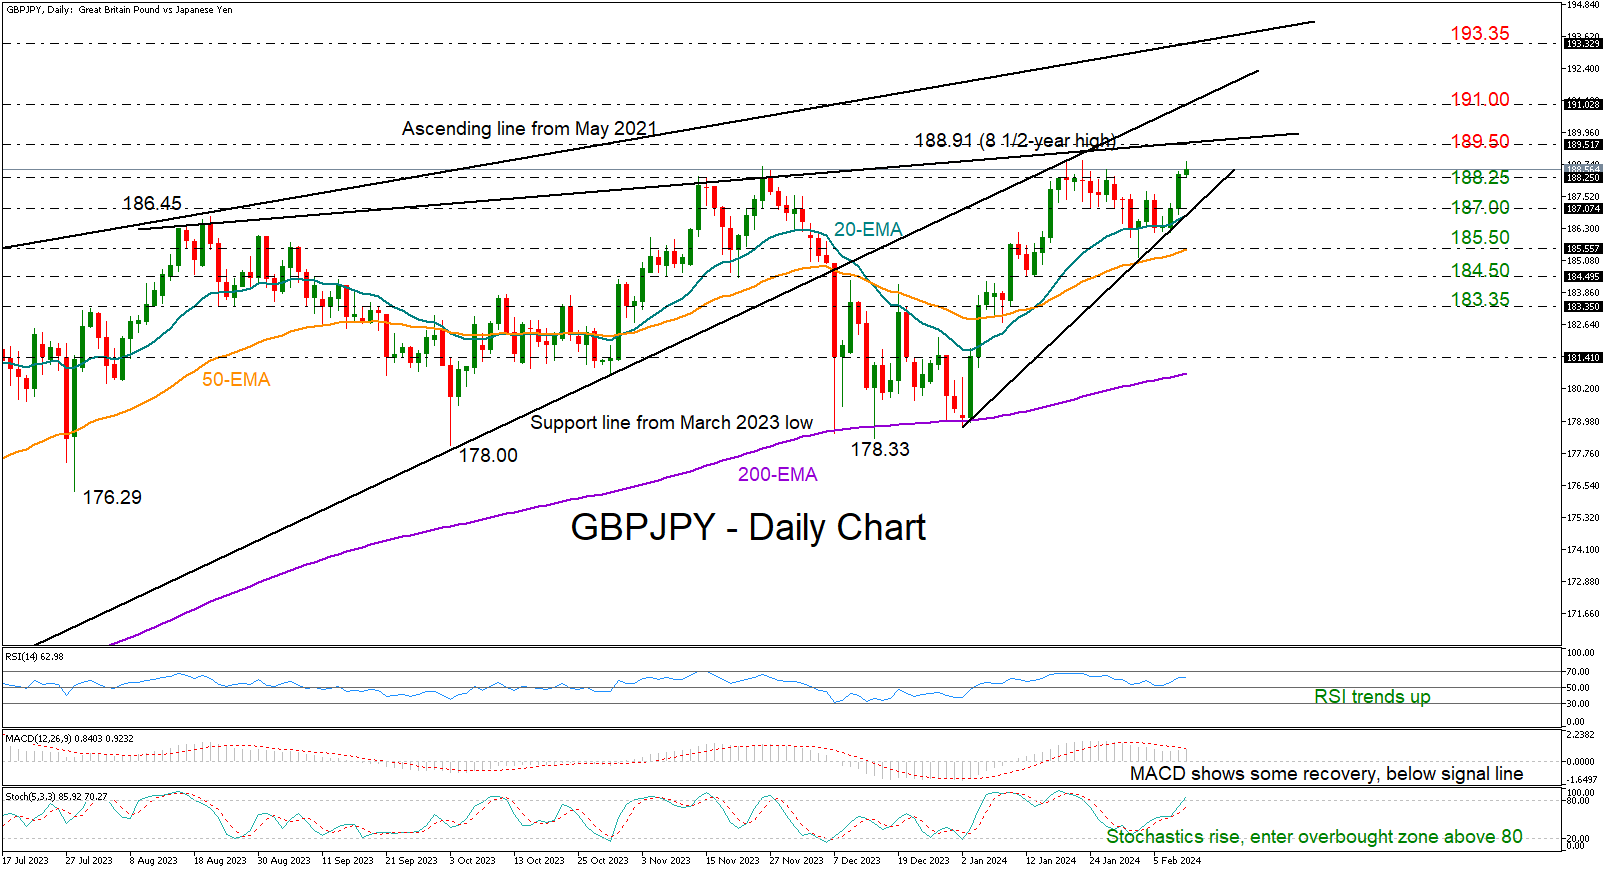
GBPJPY finally closed above the 188.25 region on Thursday, which had been keeping upside movements in control since mid-November, providing a ray of hope that the latest bullish race could pick up momentum.
The focus is now on the 189.50 area, where the resistance line from August is placed, as the positive slope in the technical indicators is currently favouring the buyers. A clear move above that bar could retest the ascending line from March at 191.00, while higher, the pair could challenge the critical resistance line from May 2021 around 193.35.
An immediate reversal to the downside could meet the 20-day exponential moving average (EMA) around 187.00. Slightly lower, the 50-day EMA at 185.55 could prevent the bears from reaching the 184.50 zone. If the latter point allows more declines, the next stop could be near the 183.35 restrictive territory.
Summing up, the latest upturn in GBPJPY is expected to gain extra legs in the coming sessions, likely putting the market back into an uptrend in the long-term picture. In this case, it would be interesting to see if the pair can print a new higher high above the 189.50 zone.
USDCAD Retreats Towards Crucial Trendline
- USDCAD gets repeatedly repelled by 1.3543
- Latest rejection triggers decline below 200-day SMA
- Momentum indicators ease but remain positive
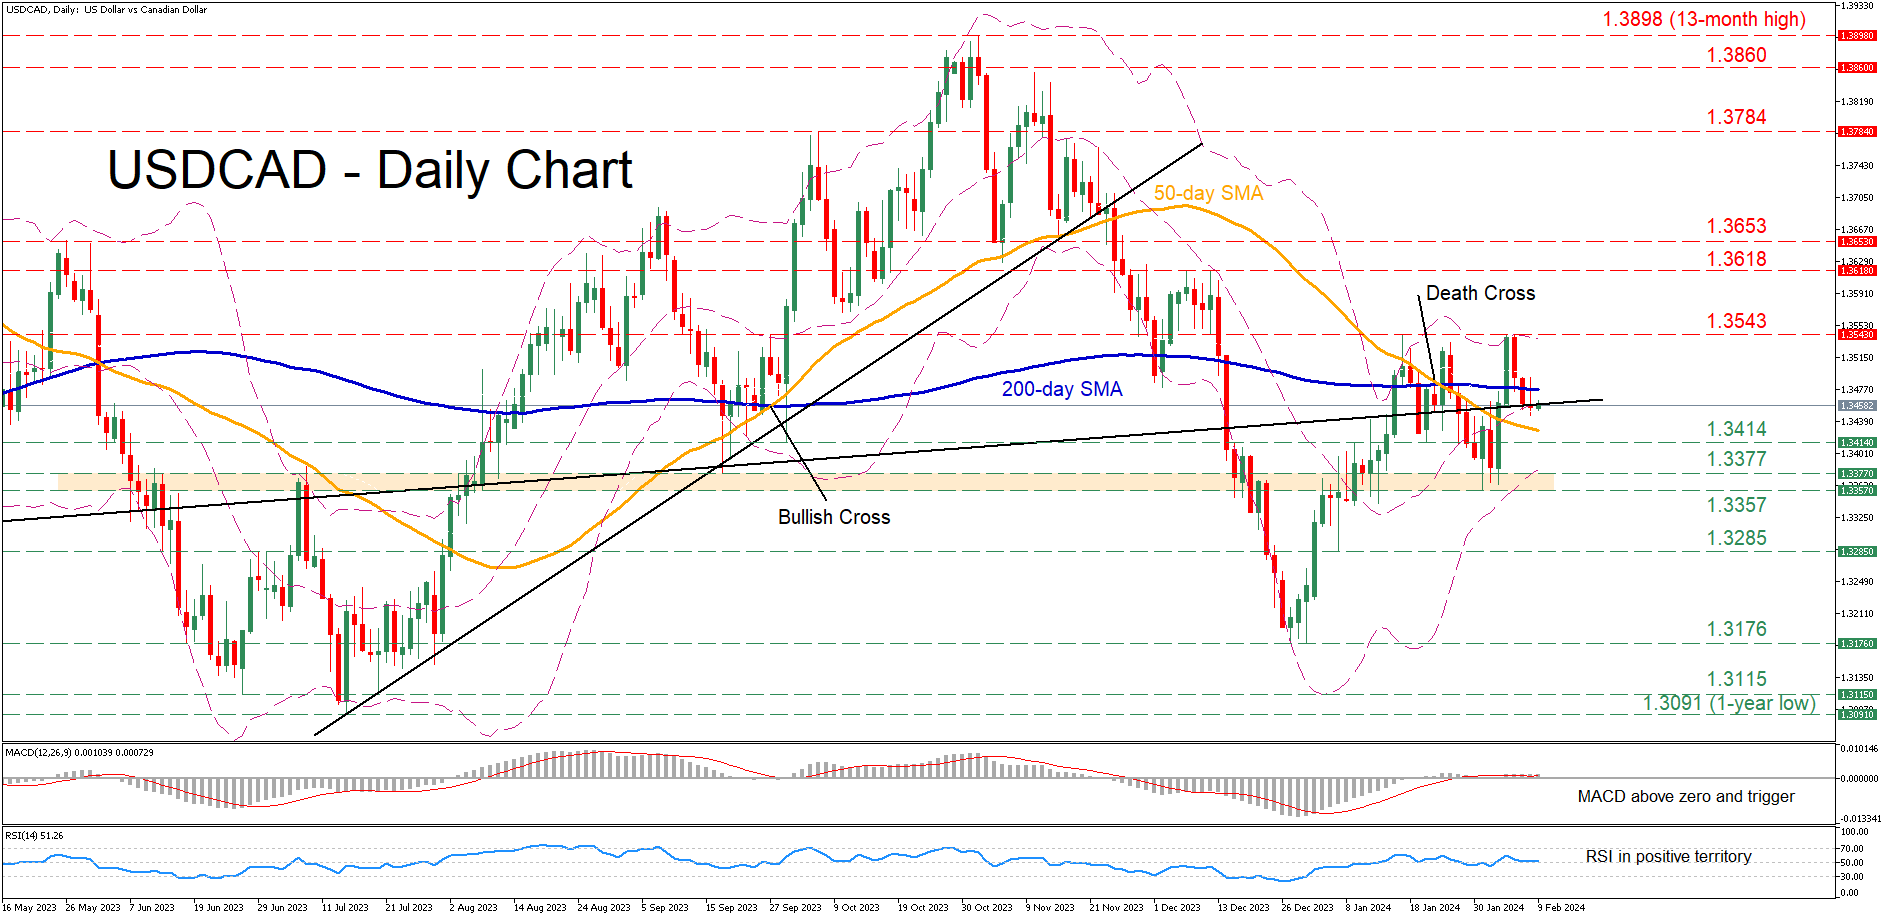
USDCAD had been staging a solid recovery from its December low of 1.3176, but its advance was rejected twice at the 2024 peak of 1.3543. The persistent inability to claim that hurdle resulted in a retreat below the 200-day simple moving average (SMA) this week, with the pair currently testing a crucial ascending trendline.
Should the pair bounce off the trendline and reverse higher, initial resistance could be found at the recent rejection region of 1.3543. Conquering that hurdle, the bulls could attack 1.3618, which held strong multiple times in December. Further advances may then cease at the April-May resistance of 1.3653.
On the flipside, if the decline resumes, the January support of 1.3414 could act as the first line of defense. Violating that zone, the pair may descend to challenge the 1.3377-1.3357 range defined by the September low and the most recent bottom. Even lower, the 1.3285 support region could provide downside protection.
In brief, USDCAD has been on the retreat again after forming a double top pattern. Hence, a decisive break below both the crucial trendline and 50-day SMA could accelerate the decline.
Bitcoin Rises Ahead of Schedule
Market picture
The crypto market capitalisation has hit new highs since 12th January, passing the $1.75 trillion mark. The market has confidently moved into a state of greed, which we also last saw a month ago. Last month’s corrective pullback and early February’s consolidation have helped gather strength for a real breakout.
Bitcoin has gained almost 10% in the last four days to trade at $46.2K. All eyes are now on whether BTCUSD can break above the previous highs from which it pulled back shortly after the initial reaction to the launch of spot ETFs.
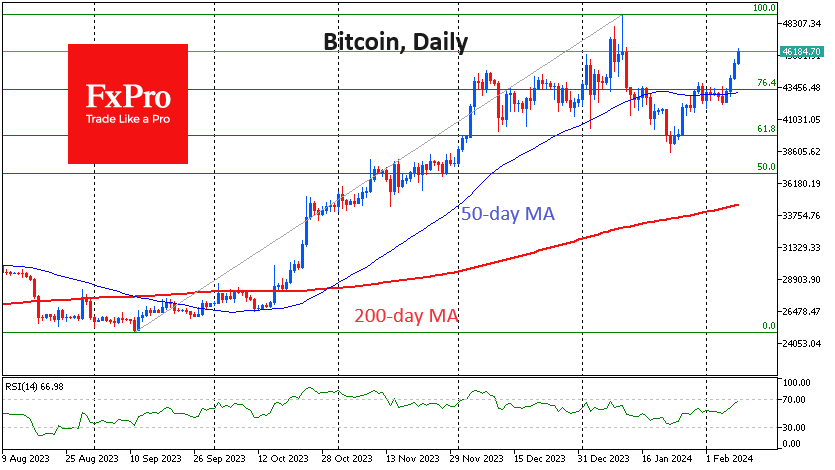
Technically, a growth above the $49K level would set the stage for a test of the all-time highs soon. This will be an exciting development, as it has previously occurred after a halving rather than in anticipation of one.
The influx of capital into the equity markets helped to push Bitcoin up to $46K. According to IntoTheBlock, the correlation between Bitcoin and the S&P 500 index was negative at the end of January but is now rising again.
News background
CryptoQuant has seen signs that the pressure from miners on BTC is easing. Daily sales by miners dropped from 800 BTC in November-December to less than 300 BTC in 2024. Miners are holding reserves despite declining transaction fee revenues.
Ethereum’s share of supply in stakes has reached 25% with a total value of $72 billion, with demand for stakes increasing significantly after the Shapella update opened withdrawal options for validators. However, Ethereum lags behind other ecosystems in terms of the percentage of blocked coins.
MicroStrategy will position itself as ‘a development company for bitcoin and bitcoin-based products’, according to founder Michael Saylor. Since its inception, MicroStrategy has focused on developing and supporting analytics software.
Crypto platform Bakkt has warned the SEC that it could shut down in the next 12 months due to a lack of funds if it cannot raise money through debt financing or equity dilution.
The network’s inability to handle the growing volume of transactions is the reason for Solana’s periodic outages. This is the conclusion of a team of experts led by journalist Colin Wu.
ECB’s Villeroy confident in Eurozone’s path to overcoming inflation sickness
ECB Governing Council member Francois Villeroy de Galhau, in an interview with LCI television, anticipates reducing interest rates within the year, marking a significant move away from the aggressive inflation-fighting measures.
"We will probably cut rates this year because we are making progress against inflation," Villeroy stated.
"We are exiting the emergency of fighting inflation and are on the right path to overcome the sickness," he elaborated.
Further bolstering this positive outlook, Villeroy projected gradual acceleration in economic growth in France in the coming months, fueled by decline in inflation rates that is expected to fall below pace of wage increases.
Bank of France's forecast, as mentioned by Villeroy, anticipates avoiding a recession, with an expected expansion rate of about 0.9% for the year.
AUDJPY’s Gentle Climb Continues
- AUDJPY trades higher, clears the 100-day SMA
- A contracting triangle has been forming as AUDJPY volatility drops
- Momentum indicators remain uninterested in current upmove
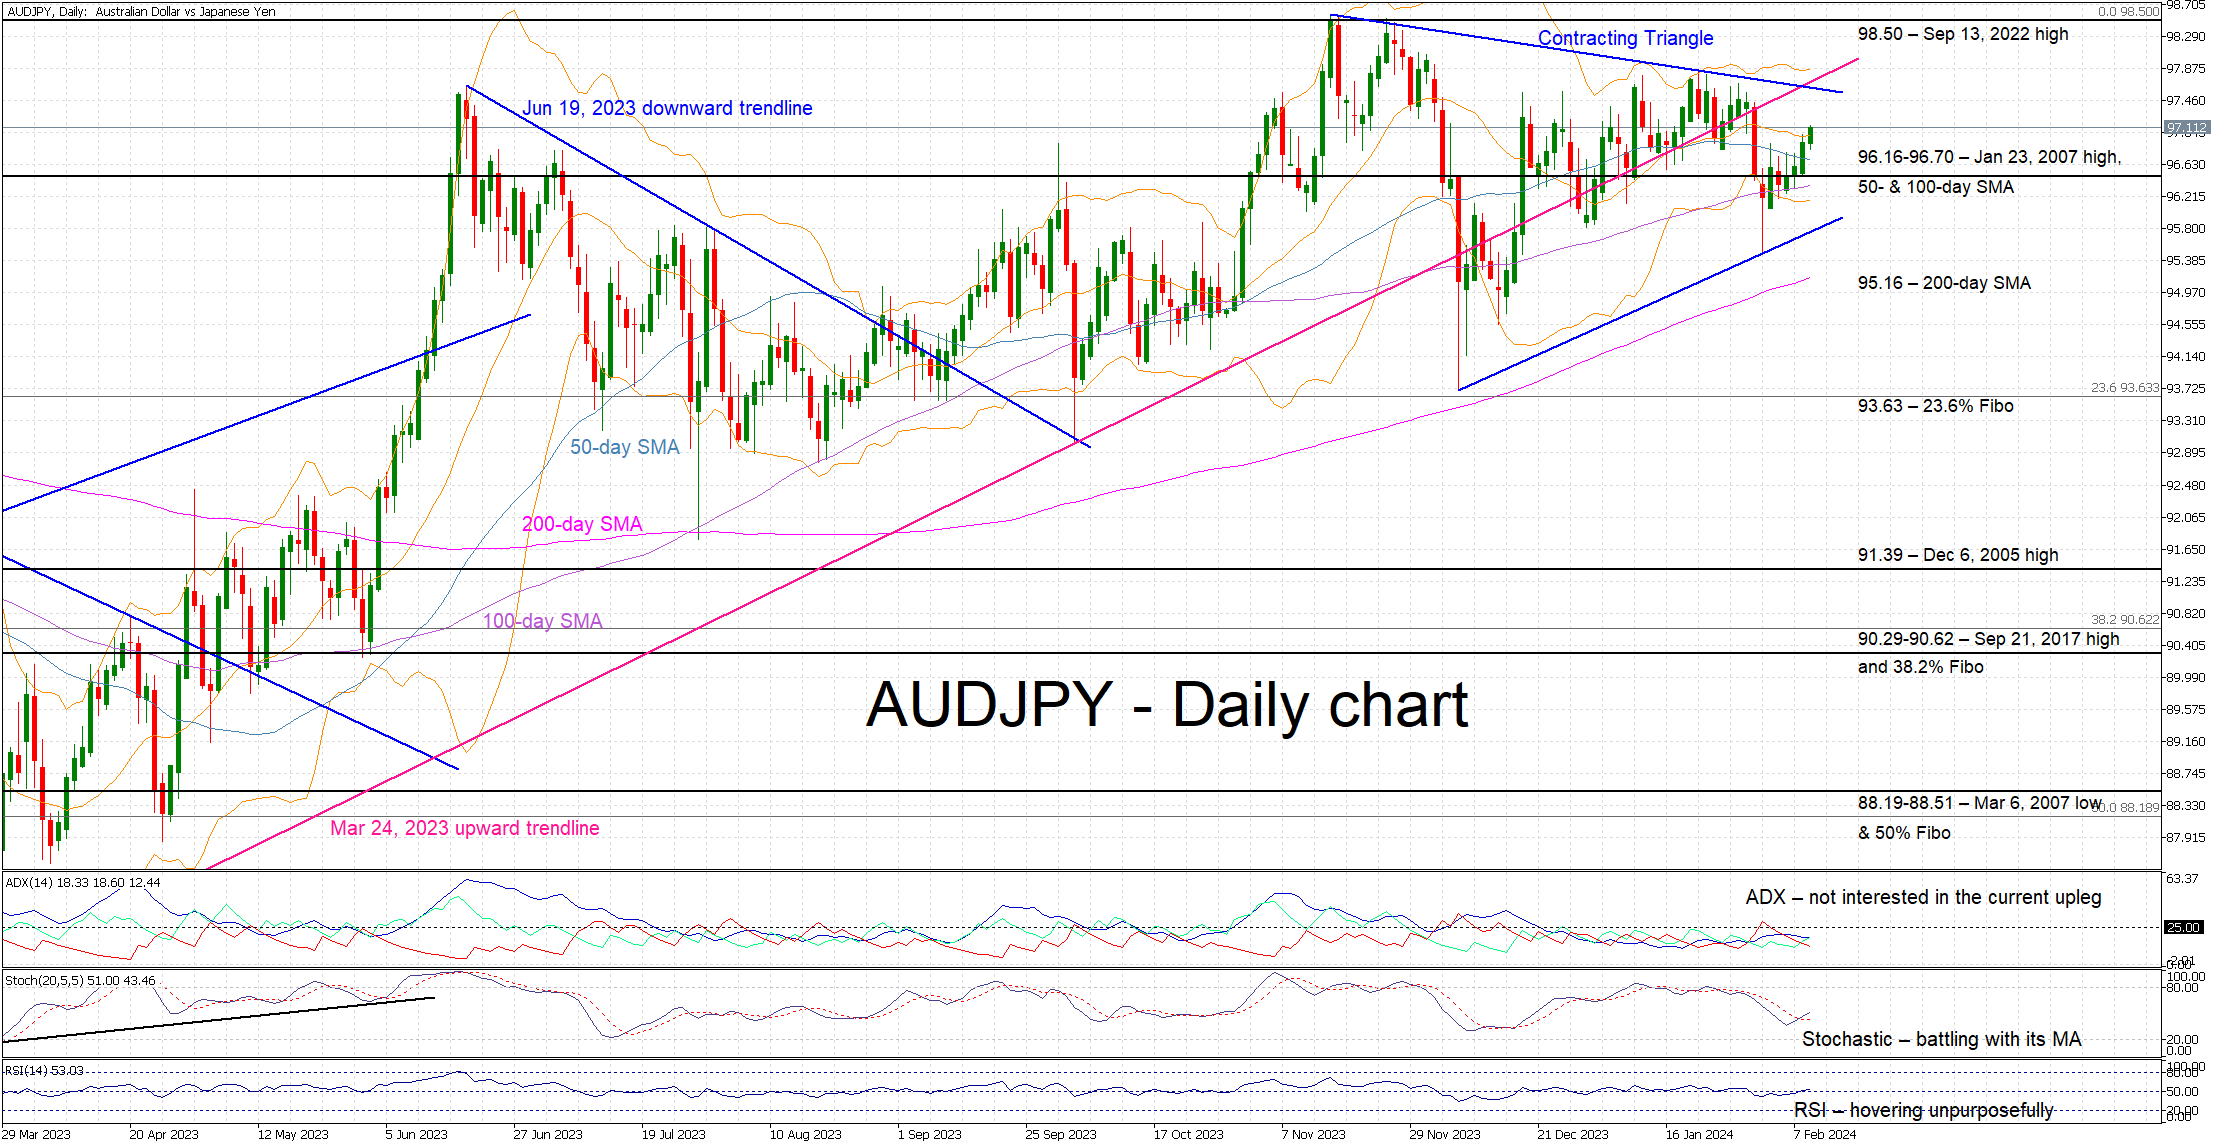
AUDJPY is enjoying its fourth consecutive green candle as JPY remains under pressure across the board. AUDJPY has managed to climb above the busy 96.16-96.70 area but has not tested the March 24, 2023 upward sloping trendline. Interestingly, a contracting triangle has been forming as a result of a series of lower highs and higher lows, and declining volatility.
In the meantime, the momentum indicators remain mostly on the sidelines. The Average Directional Movement Index (ADX) appears uninterested in the recent upleg as it continues to point to a trendless market. Similarly, the RSI is hovering around its 50-midpoint without showing an inclination for a stronger move. On the other side, the stochastic oscillator has managed to jump above its moving average. Should this move higher continue, it could be seen as a bullish signal.
Should the bulls remain confident, they could try to lead AUDJPY higher and break above the upper boundary of the contracting triangle. If successful and provided they manage to overcome the resistance set by the March 24, 2023 trendline, they could then have a go at the September 13, 2022 high at 98.50, and eventually be given the opportunity to lead AUDJPY above the 100 level for the first time since 2014.
On the other hand, AUDJPY bears are possibly keen to put a stop to the current upleg. They could initially try to push AUDJPY below the 96.16-96.70 area that is populated by January 23, 2007 high, and the 50- and 100-day simple moving averages (SMAs). A successful break below this region could open the door to a more sizeable downleg with the next likely support area coming at the lower boundary of the contracting triangle and the 200-day SMA at 95.16.
To sum up, AUDJPY bulls remain in control of the market, but they appear to lack the momentum for a stronger move higher.
AUD/USD Struggles While NZD/USD Grinds Higher
AUD/USD is declining below the 0.6540 support zone. NZD/USD is rising and could extend its increase above the 0.6130 resistance zone.
Important Takeaways for AUD USD and NZD USD Analysis Today
- The Aussie Dollar started a fresh decline below the 0.6540 level against the US Dollar.
- There is a connecting bearish trend line forming with resistance near 0.6510 on the hourly chart of AUD/USD at FXOpen.
- NZD/USD is gaining bullish momentum above the 0.6080 support.
- There was a break above a major bearish trend line with resistance at 0.6105 on the hourly chart of NZD/USD at FXOpen.
AUD/USD Technical Analysis
On the hourly chart of AUD/USD at FXOpen, the pair struggled to stay above the 0.6600 pivot zone. The Aussie Dollar started a fresh decline below the 0.6550 and 0.6540 levels against the US Dollar.
The pair even settled below the 0.6510 level and the 50-hour simple moving average. Finally, it tested the 0.6480 support zone. The recent low was formed near 0.6480 and the pair is now consolidating losses near the 23.6% Fib retracement level of the downward move from the 0.6540 swing high to the 0.6480 low.
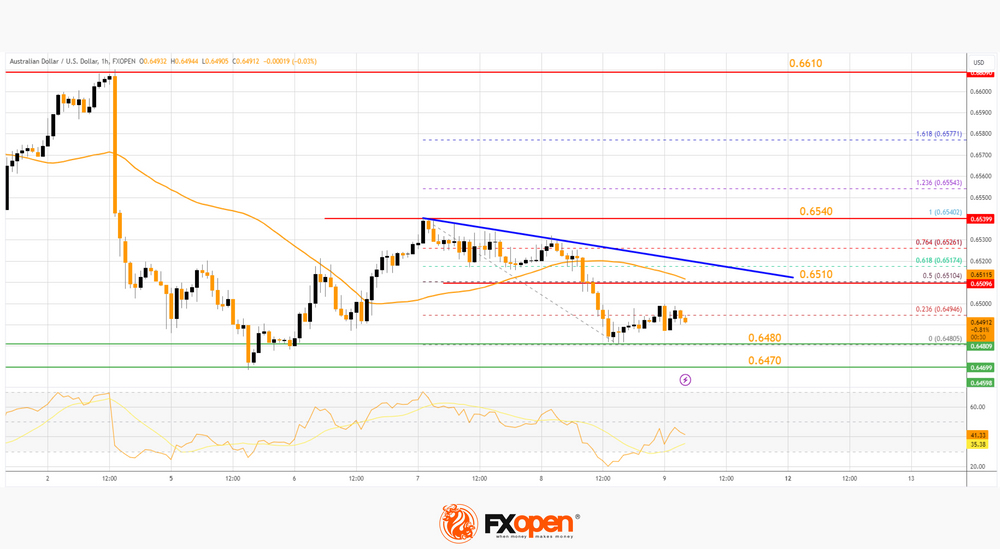
On the upside, the AUD/USD chart indicates that the pair is now facing resistance near a connecting bearish trend line at 0.6510. The trend line is near the 50% Fib retracement level of the downward move from the 0.6540 swing high to the 0.6480 low.
The first major resistance might be 0.6540. An upside break above the 0.6540 resistance might send the pair further higher. The next major resistance is near the 0.6610 level. Any more gains could clear the path for a move toward the 0.6660 resistance zone.
On the downside, initial support is near the 0.6480 zone. The next support could be the 0.6470 zone. If there is a downside break below the 0.6470 support, the pair could extend its decline toward 0.6420. Any more losses might signal a move toward 0.6380.
NZD/USD Technical Analysis
On the hourly chart of NZD/USD on FXOpen, the pair started a steady increase from the 0.6040 level. The New Zealand Dollar broke the 0.6080 resistance to start the recent increase against the US Dollar.
The pair settled above 0.6080 and the 50-hour simple moving average. There was a break above a major bearish trend line with resistance at 0.6105. The bulls pumped the pair above the 50% Fib retracement level of the downward move from the 0.6160 swing high to the 0.6038 low.
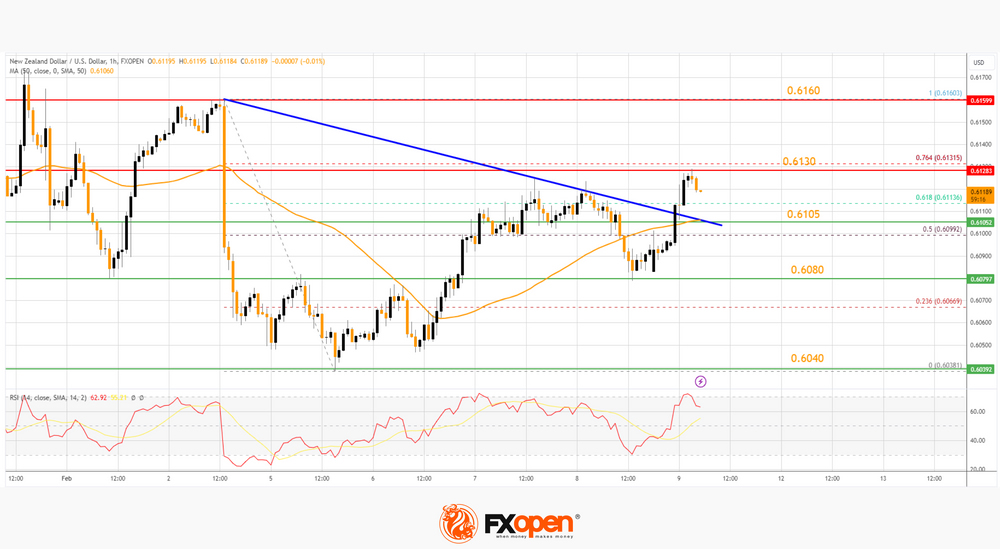
The NZD/USD chart suggests that the RSI is still above 60 and signaling more upsides. On the upside, the pair might struggle near the 76.4% Fib retracement level of the downward move from the 0.6160 swing high to the 0.6038 low at 0.6130.
The next major resistance is near the 0.6160 level. A clear move above the 0.6160 level might even push the pair toward the 0.6200 level. Any more gains might clear the path for a move toward the 0.6250 resistance zone in the coming days.
On the downside, there is major support forming near the same trend line at 0.6105. The next major support is near 0.6080, below which the pair might test 0.6040.
If there is a downside break below the 0.6040 support, the pair might slide toward the 0.6000 support. Any more losses could lead NZD/USD in a bearish zone to 0.5925.
Trade over 50 forex markets 24 hours a day with FXOpen. Take advantage of low commissions, deep liquidity, and spreads from 0.0 pips. Open your FXOpen account now or learn more about trading forex with FXOpen.
This article represents the opinion of the Companies operating under the FXOpen brand only. It is not to be construed as an offer, solicitation, or recommendation with respect to products and services provided by the Companies operating under the FXOpen brand, nor is it to be considered financial advice.