Sample Category Title
Germany’s Gfk consumer sentiment plummets to -29.7, hopes of recovery dashed
Consumer sentiment in Germany has taken a substantial downturn, reaching its lowest level since March 2023. The Gfk Consumer Sentiment Indicator for February sharply declined from -25.4 to -29.7, faring worse than the anticipated -24.3. This significant drop signals a reversal of the temporary improvement observed last month, which now appears to have been a fleeting pre-Christmas optimism.
Economic expectations in January plummeted to their lowest since December 2022, dropping from -0.4 to -6.6. Income expectations suffered a marked decline from -6.9 to -20.0, the weakest since March 2023. Concurrently, willingness to buy among consumers decreased from -8.8 to -14.8. Willingness to save has shown an increase, rising from 7.3 to 14.0, the highest level since August 2008. This suggests a shift in consumer behavior towards saving rather than spending.
Rolf Bürkl, consumer expert at NIM, remarked that the brief improvement in consumer sentiment witnessed last month was merely a transient spike. The decline in income expectations and willingness to buy, coupled with a growing propensity to save, have contributed to a significant setback in the Consumer Climate at the start of the year.
A Dream Comes True
The EURUSD traded south yesterday, as the European Central Bank (ECB) Chief Christine Lagarde reckoned that growth and inflation are slowing, while insisting that the rate cut decision will be data dependent. The pair cleared the 200-DMA support, fell to 1.0820, it’s a little higher this morning, but we are now below the 200-DMA and the ECB rate cut bets on falling inflation and slowing European economies remain the major driver of the euro weakness, with many investors now thinking that June could be a good time to start cutting the rates. Three more rates could follow this year.
Across the Atlantic, the US released its latest GDP update and the data was as good as it could possibly get. The US economy grew 3.3% in Q4 versus 2% expected by analysts. It grew 2.5% for all of last year –quite FAR from a recession. The consumer spending growth slowed to 2.8%, but remained strong on healthy jobs market and wages growth, business investment and housing were supportive and… the cherry on top: the GDP price index, a gauge of inflation fell to 1.5%. Plus, data from rent.com showed that the median rent rate declined in December, and that’s good news when considering that rents have been one of the major drivers of inflation lately, and they look like they are cooling down. In summary, yesterday’s US GDP data was the definition of goldilocks in numbers: good growth, slowing inflation. A dream comes true.
As reaction, the US 2-year yield fell below 4.30% and the 10-year yield fell below 4.10%. The strong numbers didn’t necessarily hammer the Federal Reserve (Fed) cut expectations given that inflation slowed! Investors are not sure that March would bring the first rate cut from the Fed – as the probability of a March cut is around 50%, but a May cut is almost fully priced in. Today, all eyes are on the Fed’s favorite gauge of inflation: core PCE – expected to have retreated to 3% in December. A number in line with expectations, or ideally softer than expected could further boost risk appetite.
What could go wrong?
Energy prices could go wrong.
Oil bulls finally got the positive breakout that they were looking for in oil prices. The barrel of American crude cleared the $75pb resistance and extended gains past $77pb on muddy geopolitical picture in the Middle East and on the back of a 9-mio barrel slump in US weekly oil inventories. The American crude tested the 200-DMA, near $77.50pb, to the upside but has so far been unable to take it out.
Moving forward: Positive momentum is building, the ample supply story has been broadly priced in and if Mid East tensions take over the market narrative, there is no reason to keep the oil bulls contained. The next natural target is the 200-DMA. If broken, oil bulls will challenge the $78.60, the major 38.2% Fibonacci retracement on September to December selloff and a breakout above this level will point at a medium term bullish reversal, and could pave the way for a further rise to the $80pb.
Market echoes
The US dollar index ticked higher yesterday, as the euro fell across board during ECB Lagarde’s presser. But any further weakness in today’s PCE numbers could limit the upside move in the dollar index and throw a floor under the EURUSD’s weakness around the 200-DMA.
It would sure be absurd if the Fed started cutting the rates with such a strong underlying US economy before the ECB, which, in opposition, deals with a serious economic slowdown across the euro area. But the Fed doesn’t (need to) decide based on other central banks’ actions. As such, a possible earlier Fed cut could slow down the euro depreciation but should not stop it.
In equities, the good data gave a positive spin to the S&P500 and Nasdaq 100, but Tesla’s 10% slump limited gains. Intel tumbled 10% in the afterhours trading following a disappointing forecast as it has hard time fighting back the all-strong Nvidia and AMD which are catapulted to the moon on the AI craze. The good news is, Nvidia and AMD lovers will barely react to Intel news.
Another Strong Batch of US Data, ECB Giving Little Away
US economic data continues to point to an economy that's doing very well despite the various headwinds including very high interest rates.
GDP data for the fourth quarter easily exceeded expectations, rising 3.3% on an annualized basis, adding to the increasing view that the US could be heading for a fairytale scenario, not just a soft landing.
We've spoken a lot about resilence in the US economy over the last couple of years but that the economy can continue to show such strength and low unemployment with interest rates so high and inflation falling back toward target is unbelievable.
ECB keeps its cards close to its chest
The European Central Bank left interest rates on hold on Thursday and claimed inflation is progressing towards its target, while giving no clear guidance on when interest rates will start falling.
We came into the new year with markets pricing in a March rate cut and that is now looking increasingly difficult. Even with a late pivot - which was always likely the strategy of the central bank - policymakers would have to signal that a rate cut is a live possibility over the next six weeks in appearances made between meetings. That's not impossible but it's arguably not particularly transparent. The data is unlikely to surprise to that degree.
President Christine Lagarde and some colleagues have previously indicated a rate cut in summer may be appropriate but investors are not convinced we'll have to wait that long. Lagarde stuck with that today while suggesting demand was weaker, as is the economy, and inflation is falling.
Perhaps this is her way of leaving the door slightly ajar for March or maybe the usual lack of clear guidance has left everyone desperately looking for something that isn't there. I get the feeling Lagarde and her colleagues wanted to give absolutely nothing away today, instead opting for an array of vague, uninformative statements that buy them six more weeks before they may have to say or do something.
EURUSD remains rangebound
The euro has drifted lower after the ECB press conference and US data but it hasn’t broken out of the range it’s traded in over the last week or so.
The correction we’ve seen since the turn of the year appears to be running on fumes but there’s still a question of whether this is just that, and will turn higher and look to break the highs, or just a continuation of the longer-term sideways trend. There are some important support levels between 1.07 and 1.0850 which could tell us which is the case.
Bitcoin (BTCUSD) Looking for Support Soon
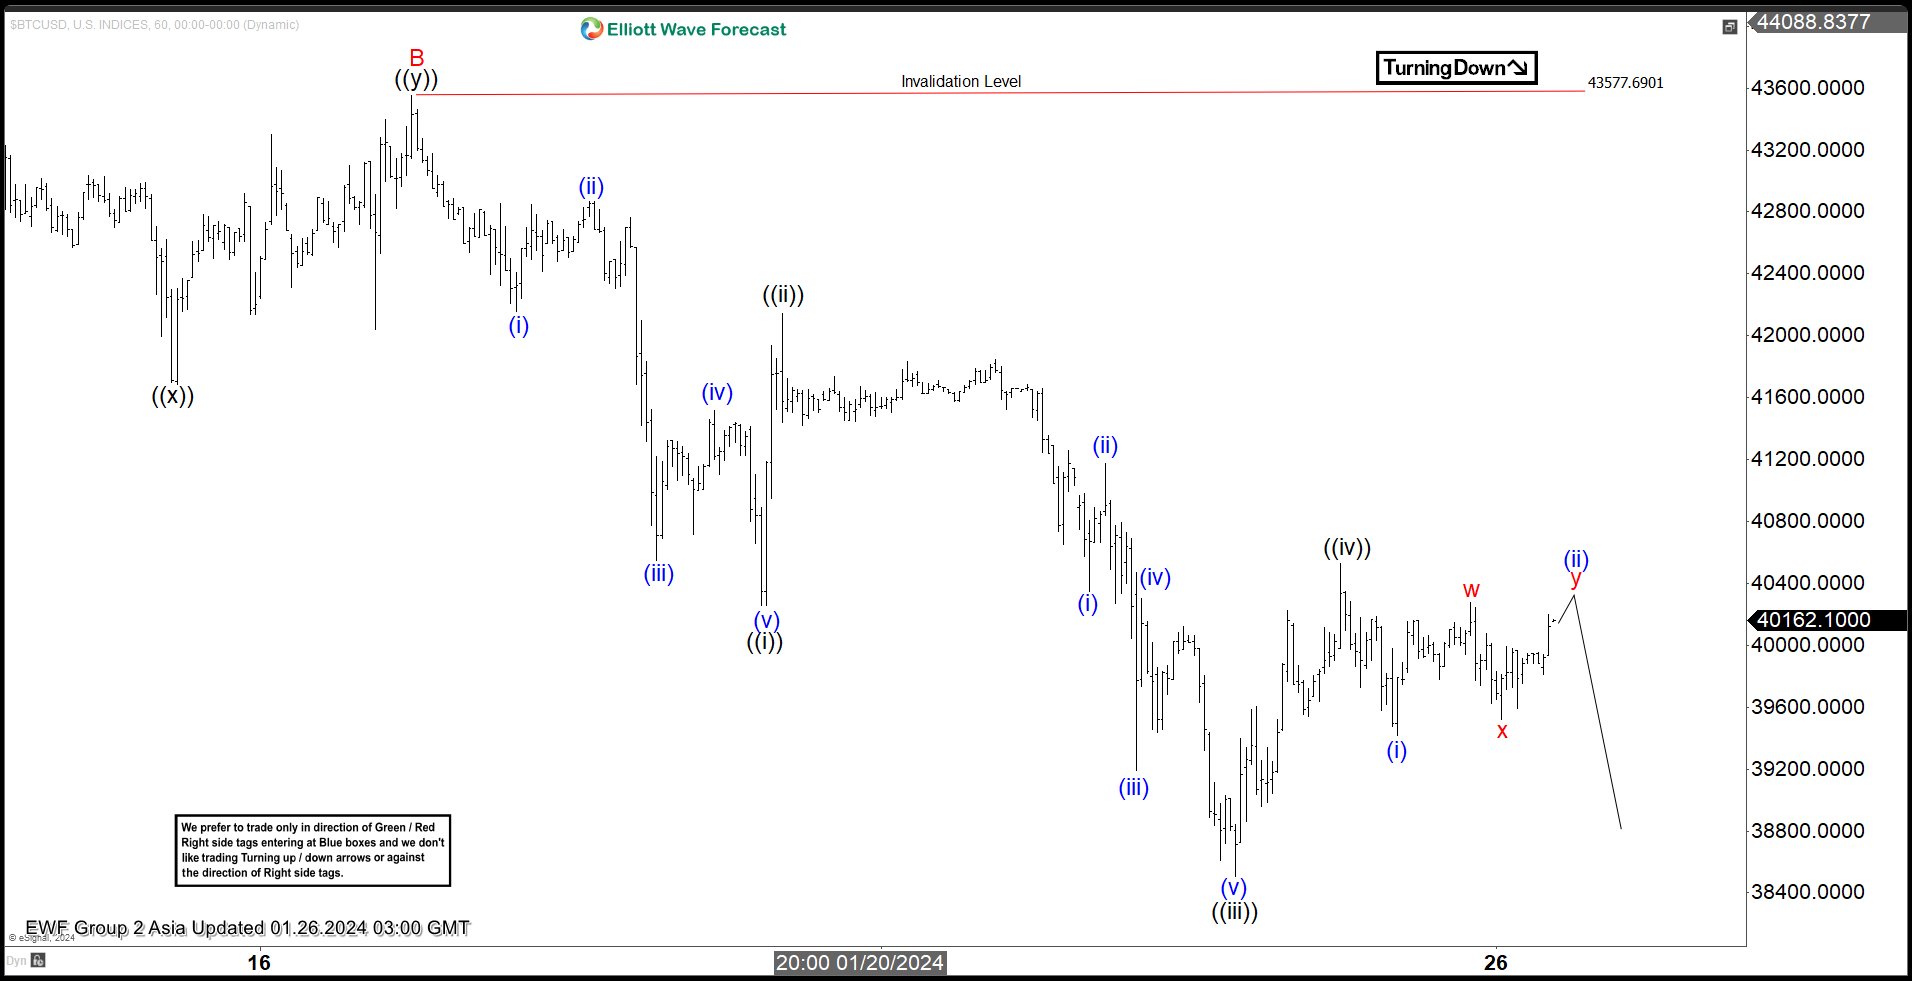
Short Term Elliott Wave view in Bitcoin (BTCUSD) suggests it is currently doing a pullback starting from 1.11.2024. The decline is taking the form of a zigzag Elliott Wave structure. Down from 1.11.2024 high, wave A ended at 41339 and wave B rally ended at 43577.69 as the 1 hour chart below shows. Wave C lower is currently in progress as a 5 waves. Down from wave B, wave (i) ended at 42158.6 and rally in wave (ii) ended at 42868.4. Wave (iii) lower ended at 40549.3 and wave (iv) rally ended at 41518.5. The instrument then resumed wave (v) lower which ended at 40256.6 and completed wave ((i)) in larger degree.
Rally in wave ((ii)) ended at 42143.3 and the crypto currency has resumed lower in wave ((iii)). Down from wave ((ii)), wave (i) ended at 40349.9 and rally in wave (ii) ended at 41173.8. Wave (iii) lower ended at 39190.1 and rally in wave (iv) ended at 40305.4. Bitcoin extended lower again in wave (v) towards 38503.2 which completed wave ((iii)). Rally in wave ((iv)) ended at 40526.3. The crypto currency is now in wave ((v)) lower and as far as pivot at 43577.69, 1 more leg lower still can’t be ruled out at this stage to end wave ((v)) of C. The right side / main trend for Bitcoin still remains bullish and thus we do not like short selling the instrument.
Bitcoin (BTCUSD) 60 Minutes Elliott Wave Chart
BTCUSD Elliott Wave Video
https://www.youtube.com/watch?v=qzhh5iV0y0U
EUR/USD Daily Outlook
Daily Pivots: (S1) 1.0811; (P) 1.0857; (R1) 1.0891; More...
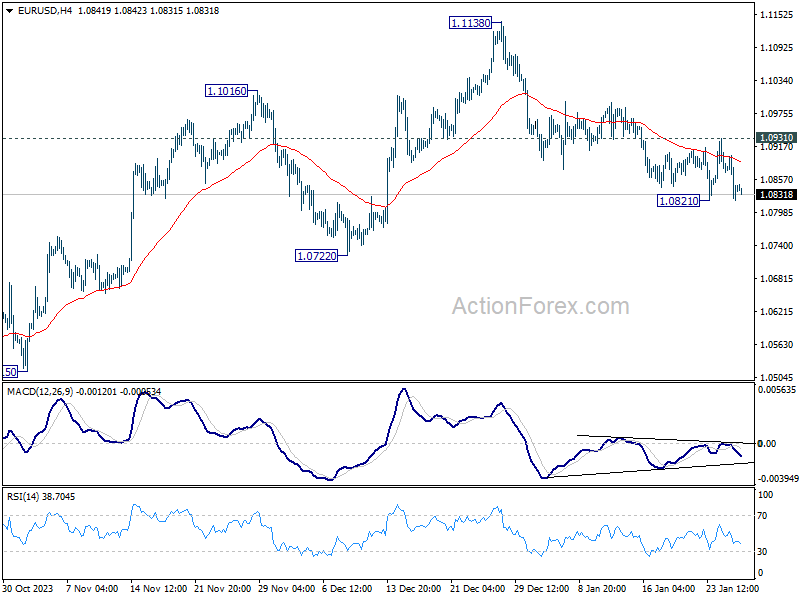
Intraday bias in EUR/USD remains neutral at this point, as range trading continues above 1.0821 temporary low. On the downside, break of 1.0821 will resume the fall from 1.1138 to 1.0722 support. On the upside, above 1.0931 will resume the rebound from 1.0821 towards 1.1138 resistance.
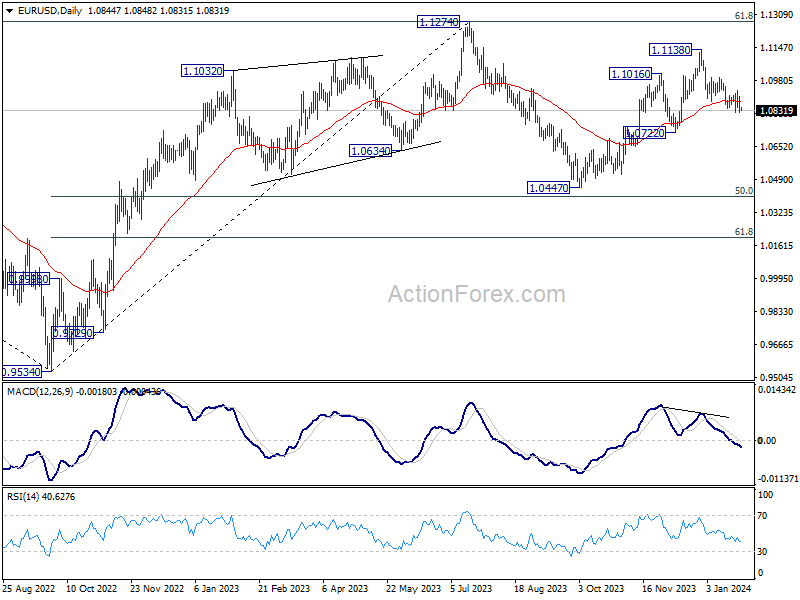
In the bigger picture, price actions from 1.1274 are viewed as a corrective pattern to rise from 0.9534 (2022 low). Rise from 1.0447 is seen as the second leg. While further rally could cannot be ruled out, upside should be limited by 1.1274 to bring the third leg of the pattern. Meanwhile, sustained break of 1.0722 support will argue that the third leg has already started for 1.0447 and below.
GBP/USD Daily Outlook
Daily Pivots: (S1) 1.2679; (P) 1.2711; (R1) 1.2740; More...
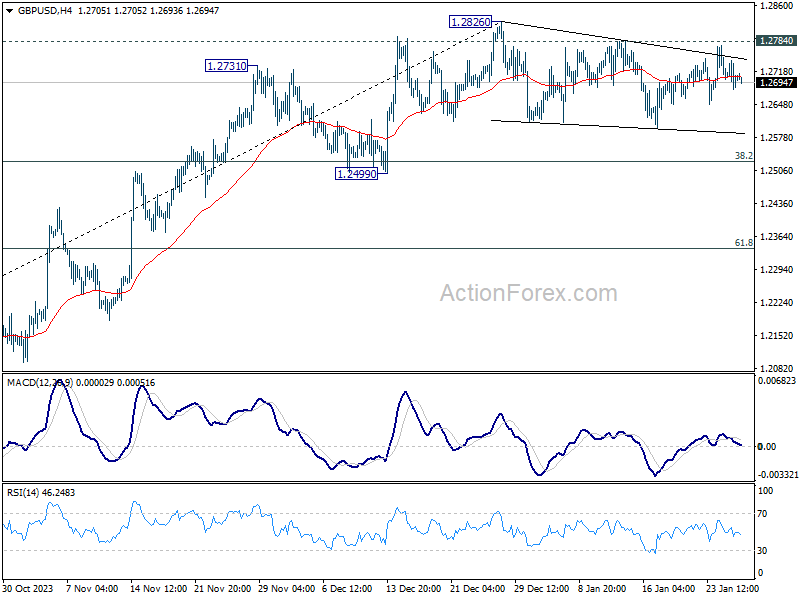
Range trading continues in GBP/USD and intraday bias remains neutral. Deeper pull back cannot be ruled out. But downside should be contained above 1.2499 support to bring rebound. On the upside, firm break of 1.2784 resistance will suggest that consolidation pattern has completed. Further rise should be seen through 1.2826 to resume the rise from 1.2036. Next target will be 1.3141 high.
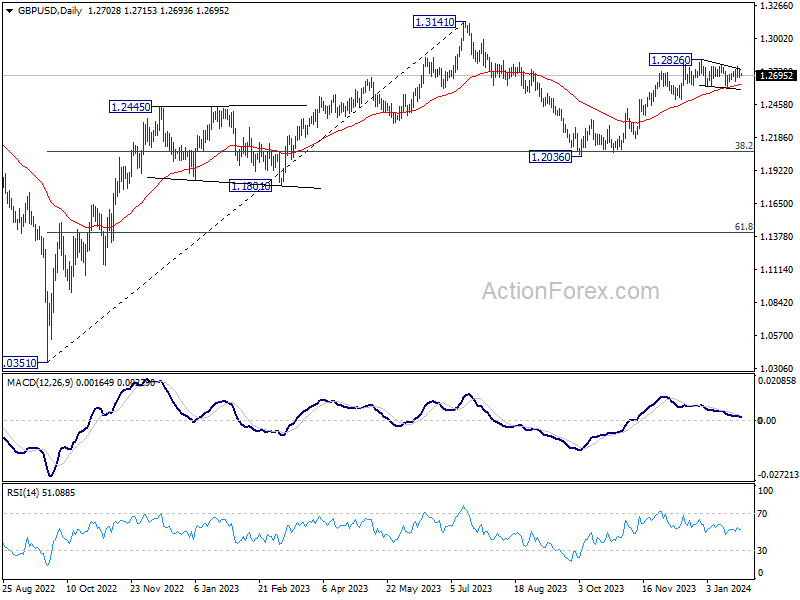
In the bigger picture, price actions from 1.3141 medium term top are seen as a corrective pattern to up trend from 1.0351 (2022 low). Rise from 1.2036 is seen as the second leg that's in progress. Upside should be limited by 1.3141 to bring the third leg of the pattern. Meanwhile, break of 1.2499 support will argue that the third leg has already started for 38.2% retracement of 1.0351 (2022 low) to 1.3141 at 1.2075 again.
USD/CHF Daily Outlook
Daily Pivots: (S1) 0.8636; (P) 0.8661; (R1) 0.8695; More....
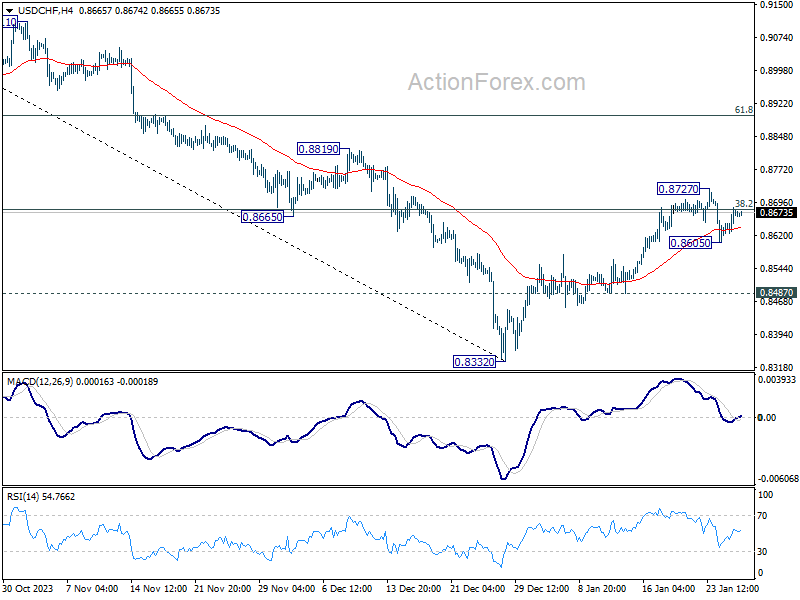
Intraday bias in USD/CHF is turned neutral with current recovery. On the downside, below 0.8605 will resume the pull back from 0.8727 to 0.8487 support. Break there will argue that rebound from 0.8332 has completed, and bring retest of this low. On the upside, firm break of 0.8727 will resume the rebound to 61.8% retracement of 0.9243 to 0.8332 at 0.8995 instead.
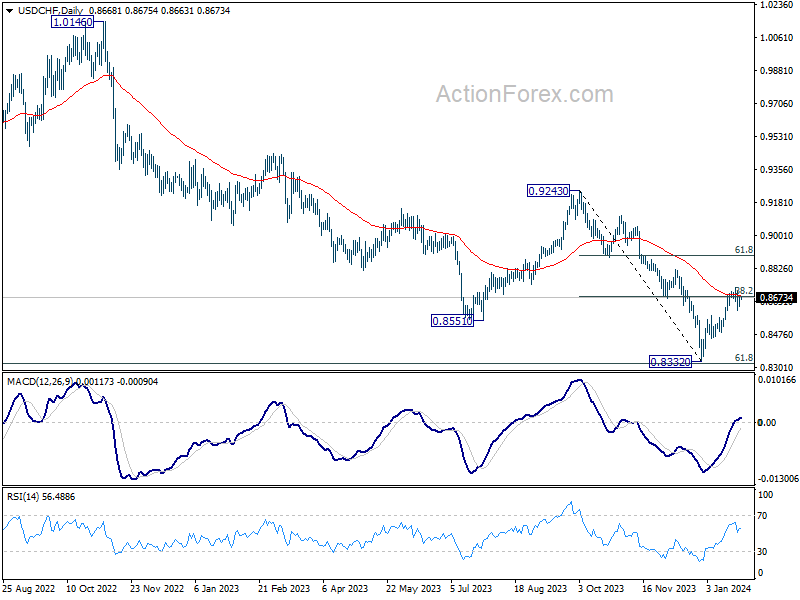
In the bigger picture, while rebound from 0.8332 could be strong, there is no clear sign of medium term bottoming yet. This rebound is tentatively seen as a corrective move for now. Also, outlook will stay bearish as long as 0.9243 resistance holds. Larger down trend from 1.0146 (2022 high) should resume through 0.8332 low at a later stage.
USD/JPY Daily Outlook
Daily Pivots: (S1) 147.20; (P) 147.55; (R1) 148.02; More...
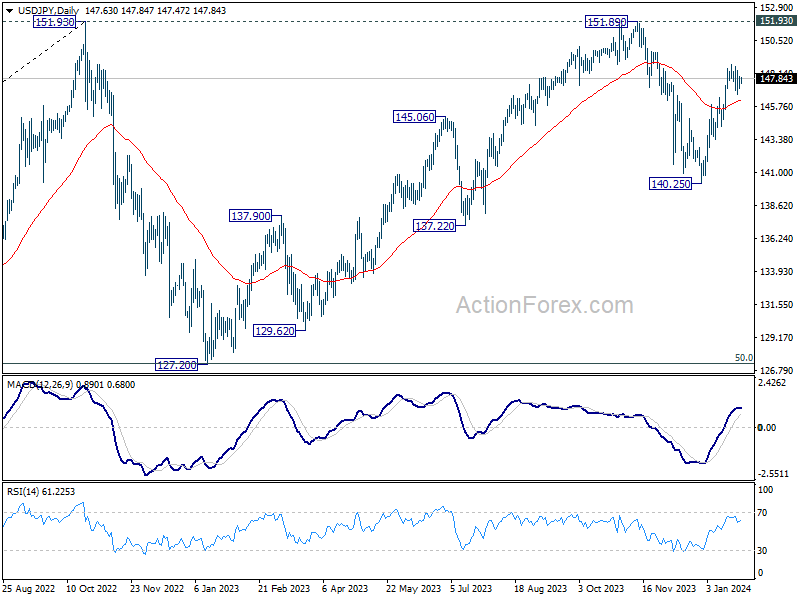
Intraday bias in USD/JPY remains neutral as consolidation from 148.79 is extending. With 145.97 resistance turned support intact, further rally is in favor. As noted before, corrective fall from 151.89 should have completed at 140.25 already. Break of 148.79 will resume the rise from there for retesting 151.89/93 key resistance zone.
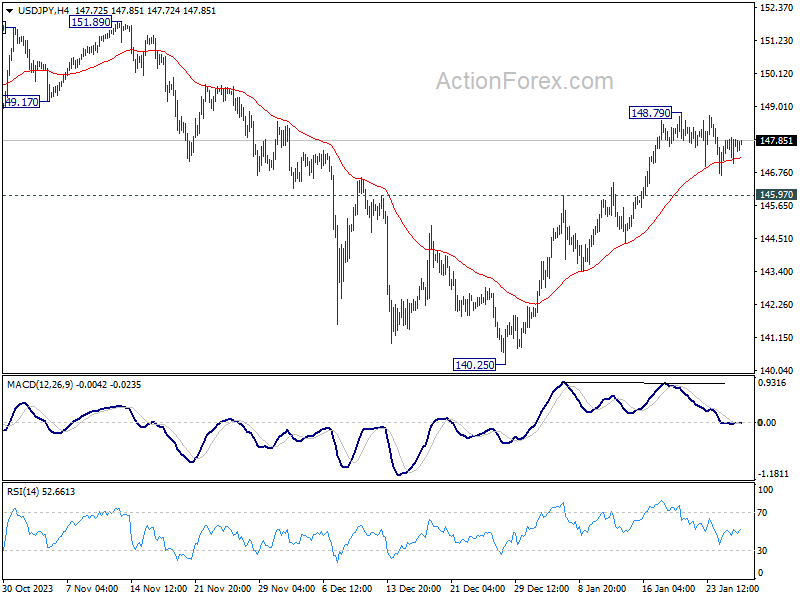
In the bigger picture, stronger than expected rebound from 140.25 dampened the original bearish review. Strong support from 55 W EMA (now at 141.89) is also a medium term bullish sign. Fall from 151.89 could be a correction to rise from 127.20 only. Decisive break of 151.89/93 will confirm resumption of long term up trend. This will now be the favored case as long as 140.25 support holds.
AUD/USD Daily Report
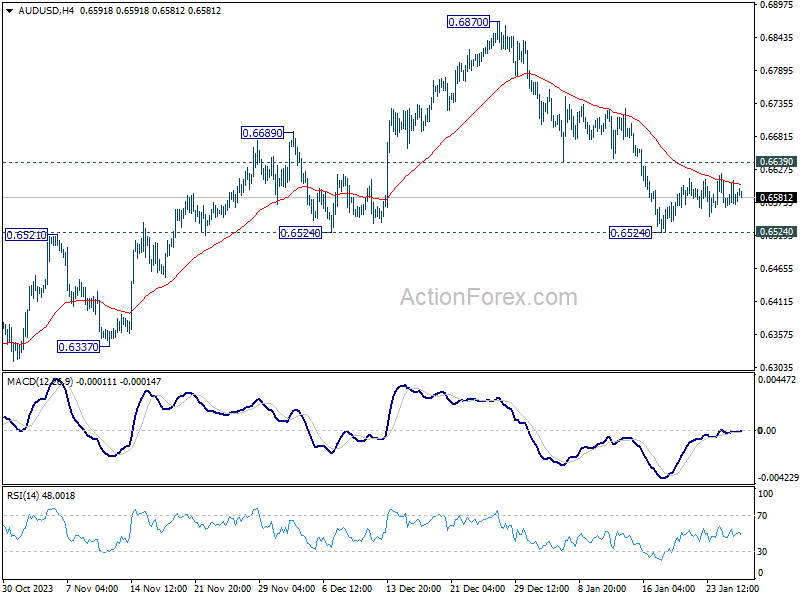
Daily Pivots: (S1) 0.6564; (P) 0.6587; (R1) 0.6608; More...
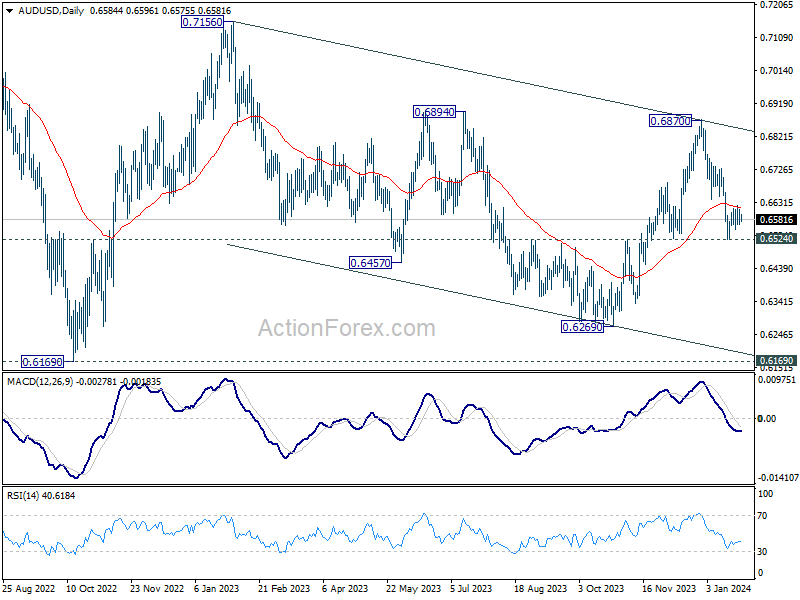
AUD/USD's consolidation from 0.6524 is extending and intraday bias remains neutral at this point. With 0.6639 support turned resistance intact, further decline is expected. Firm break of 0.6524 support will argue that whole rebound from 0.6269 has completed, and bring deeper fall to this support.
In the bigger picture, price actions from 0.6169 (2022 low) are seen as a medium term corrective pattern to the down trend from 0.8006 (2021 high). Sideway trading could continue in range of 0.6169/7156 for some more time. But as long as 0.7156 holds, an eventual downside breakout would be mildly in favor.
USD/CAD Daily Outlook
Daily Pivots: (S1) 1.3450; (P) 1.3493; (R1) 1.3517; More...
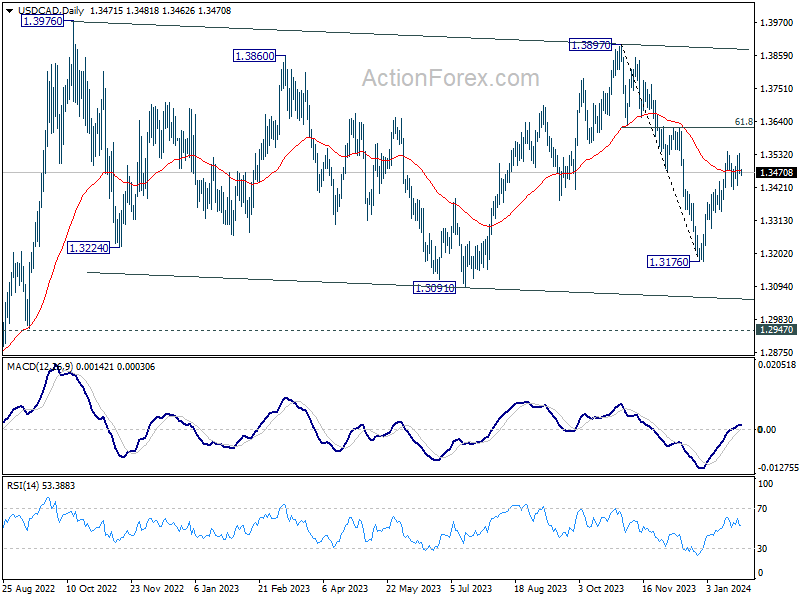
Intraday bias in USD/CAD remains neutral for the moment. Further rally is expected as long as 1.3414 minor support holds. Fall from 1.3897 should have completed at 1.3716. Break of 1.3540 will target 1.3617 cluster resistance (61.8% retracement of 1.3897 to 1.3176 at 1.3622). Decisive break there will pave the way to 1.3897/3976 key resistance zone. However, break of 1.3414 will dampen this view and turn bias back to the downside
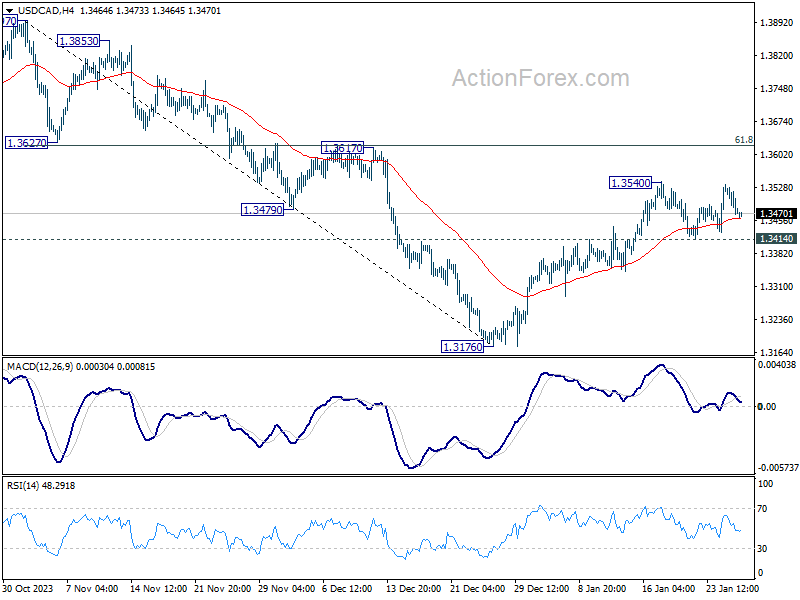
In the bigger picture, price actions from 1.3976 (2022 high) are viewed as a corrective pattern only. In case of another fall, strong support should emerge above 1.2947 resistance turned support to bring rebound. Overall, larger up trend from 1.2005 (2021 low) is still expected to resume through 1.3976 at a later stage.