

Sample Category Title
BoJ’s minutes emphasize importance of discussions on exiting negative rates
The minutes from BoJ's meeting on December 18-19 highlighted a focus on strategic discussions regarding the future of its monetary policy. The members agreed on the importance to "deepen discussions" about the "timing of the exit" from the current monetary policy framework and determining the "appropriate pace of raising policy interest rates thereafter." This discussion is closely tied to the evolving dynamics of "wage and price developments."
A key sentiment echoed by many members was the prerequisite for a sustainable and stable achievement of the price stability target before considering the termination of the negative interest rate policy and the yield curve control framework. The establishment of a "virtuous cycle between wages and prices" was reiterated as a necessary condition for these policy shifts.
Additionally, some members expressed the viewpoint that BoJ is "not in a situation where it would fall behind the curve" if it did not rush to raise policy interest rates. This perspective suggests a cautious approach to monetary tightening, implying that the central bank doesn't feel pressured to act hastily in adjusting its interest rate policy.
Japan’s Tokyo CPI slows sharply to 1.6%, raises questions on BoJ’s negative rates exit
Japan's Tokyo CPI core (ex-food) slowed significantly from 2.1% yoy to 1.6% yoy in January, below expectation of 1.9% yoy. That's also the lowest rate since March 2022. Additionally, core-core CPI (ex-food and energy) declined from 3.5% yoy to 3.1% yoy, marking a fifth consecutive month of decline. Headline CPI mirrored this trend, falling from 2.4% yoy to 1.6% yoy.
The latest Tokyo CPI data has sparked a debate among economists regarding its influence on BoJ strategy to phase out negative interest rates. While some analysts believe this data won't significantly impact BoJ's plan, anticipating the first rate hike since 2007 in April, others are more cautious. They suggest that the surprising drop in Tokyo inflation might lead BoJ to reconsider or delay the decision.
In parallel, December's corporate services price index remained steady at 2.4% yoy, aligning with the near nine-year high recorded in November.
WTI Wave Analysis
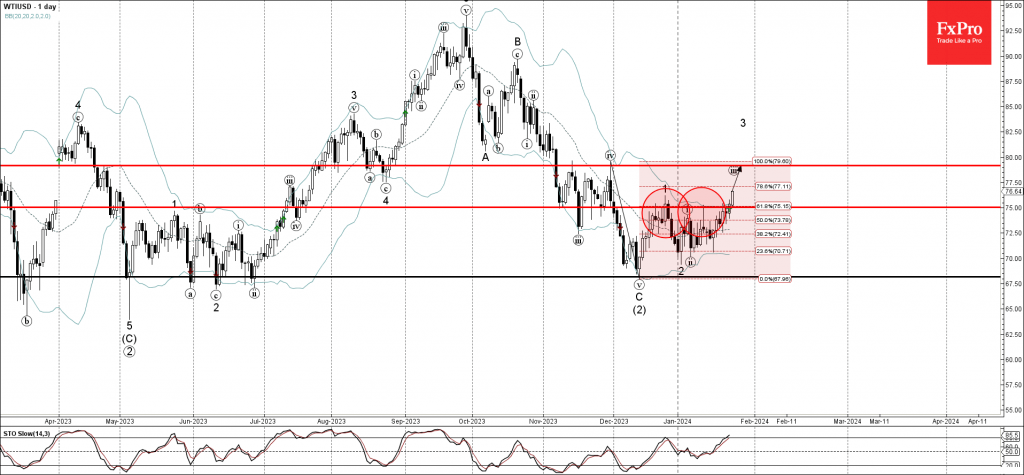
- WTI broke key resistance level 75.00
- Likely to rise to resistance level 79.15
WTI crude oil recently broke the key resistance level 75.00 (which has been reversing the price from the end of December).
The breakout of the resistance level 75.00 coincided with the breakout of the 61.8% Fibonacci correction of the previous sharp downward impulse v from November.
Given the strength of the active impulse waves 3 and (3), EURCAD can be expected to rise further to the next resistance level 79.15 (top of the previous correction iv).
EURCAD Wave Analysis
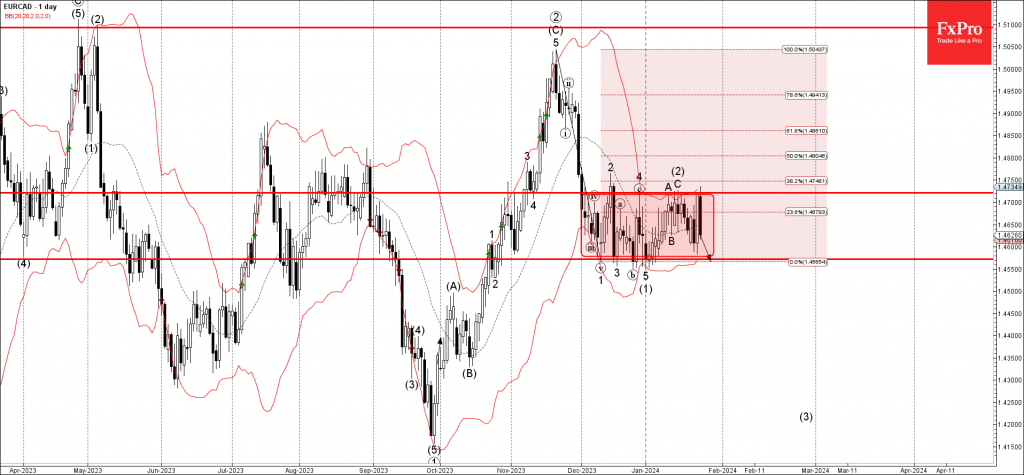
- EURCAD reversed from resistance level 1.4720
- Likely to fall to support level 1.4570
EURCAD currency pair recently reversed down once again from the key resistance level 1.4720 (upper boundary of the sideways price range inside which the pair has been trading from December).
The resistance level 1.4720 was strengthened by the upper daily Bollinger Band and by the 38.2% Fibonacci correction of the previous sharp downward impulse from November.
Given the strength of the resistance level 1.4720, EURCAD can be expected to fall further to the next support level 1.4570 (lower boundary of this price range).
Nasdaq 100 (US100): Toward 17750
Bullish Scenario: Buy between 17515 and 17600 with TP1: 17681; TP2: 17720 intraday, and TP3: 17750 / 18000 in extension. It is recommended to set a stop loss (S.L.) below 17487 or at least 1% of the account capital**.
Bearish Scenario in case of breaking the buying zone: Sell below 17500 with TP1: 17469; TP2: 17421, and TP3: 17358 in extension. It is recommended to place a stop loss at 1.3477 or at least 1% of the account capital**. A trailing stop can be used.
Fundamental Environment:
The US 100 has risen approximately 9% since its January 5th low, following the increases of over 12% in November and over 8% in December, mainly driven by speculation about the Fed's early start to monetary easing (rate cuts).
Despite several FOMC members continuing to discourage speculation, the fourth-quarter earnings season of 2023 and the earnings of technology companies temporarily shifted previous speculations.
With the Fed meeting next week, market expectations are expected to become more realistic, acknowledging that the first-rate cuts will likely have to wait until at least the end of the first half of the year, triggering the necessary correction before incorporating the cuts into the price for June.
Analysis from the daily chart:
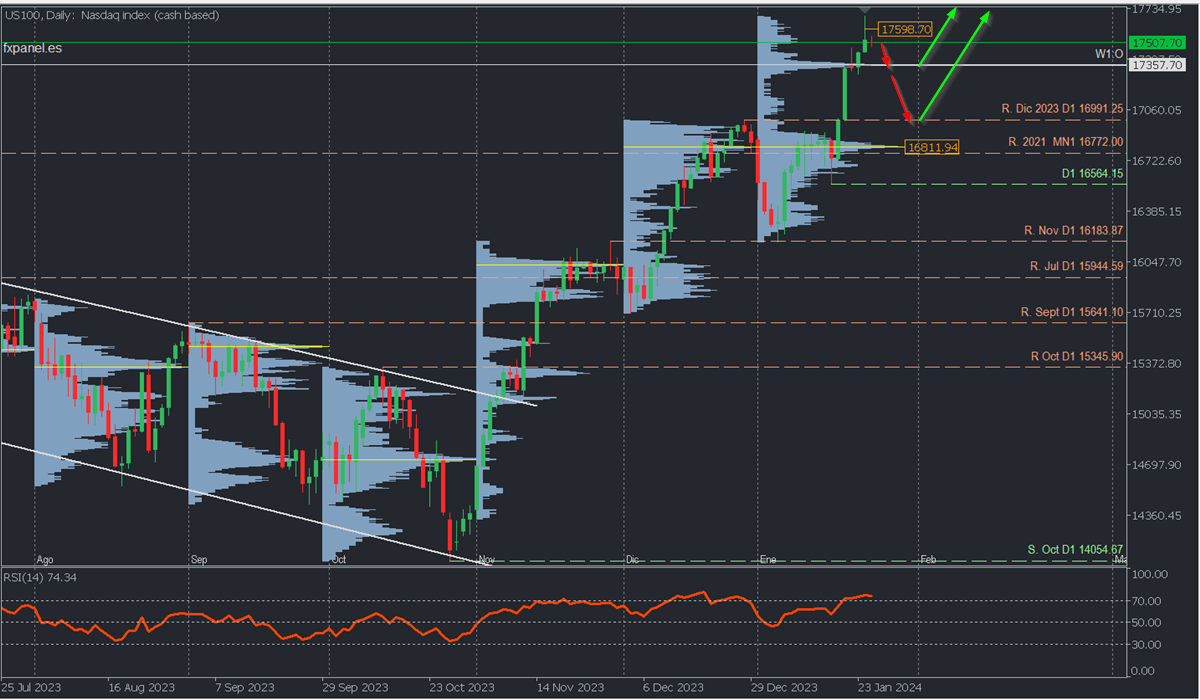
So far, the index reached a high of 17681.82 yesterday with no references to volume-based buying target levels. We can exclusively consider on the daily chart the potential retracement zones due to liquidity, such as the weekly opening at 17357.70 with a high volume node becoming the main target for bears in the short term. Its breakout will extend the correction towards the December broken resistance, now acting as support at 16991.25, and more extensively a retest of the January buying zone around the uncovered POC at 16811.94 and surrounding areas. A renewed rally is expected to reach and surpass 18000 before the end of the month.
Analysis from H1 chart:
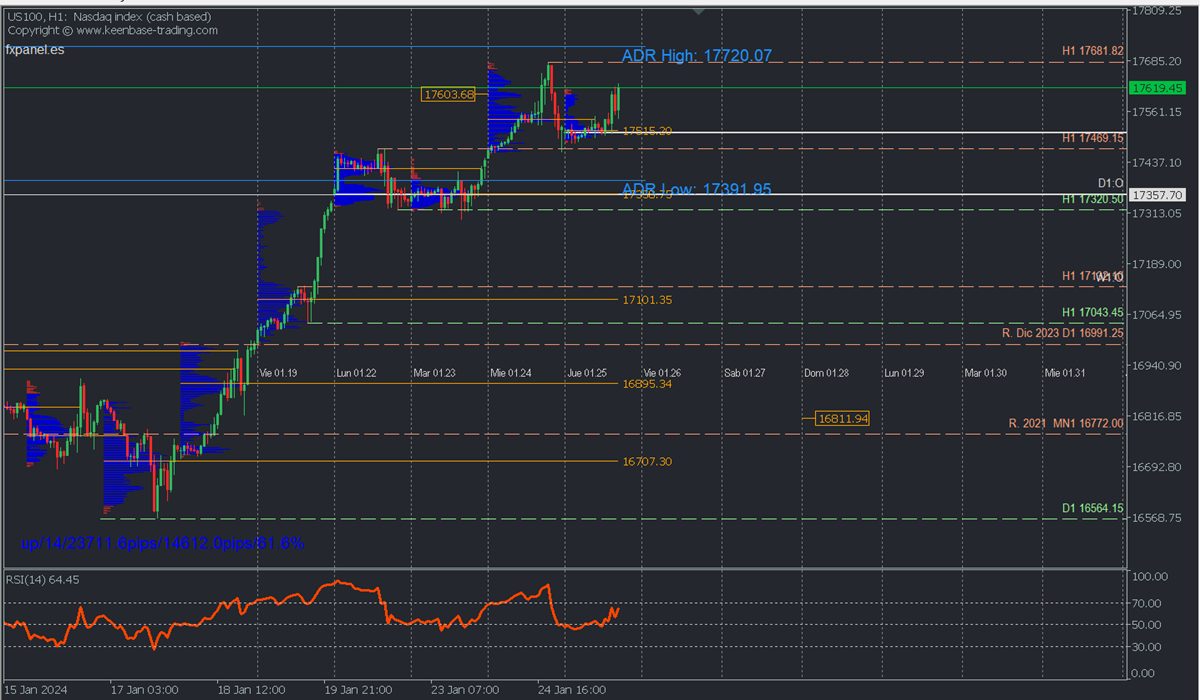
The price could continue to rise today and break the resistance level at 17681.82. However, it may be limited by the daily bullish average range at 17720.07 before continuing to increase further towards 18,000 in the upcoming days. This will happen at least before the Fed meeting.
This scenario will remain valid as long as the retracement stays above the buying zone that coincides with the day's opening at 17515, even after a retracement to it. On the other hand, if the price fails to create a new high above the resistance at 17681.82 and falls towards the buying zone, causing its decisive breakout, it will pave the way for a possible breakdown of the support at 17460, in which case we will have a more extended correction towards the next buying zone at the weekly opening at 17358.
The bullish trend will maintain its intact structure as long as the retracements do not break the last relevant support, currently at 16564.15.
*Uncovered POC: POC = Point of Control: It is the level or zone where the bullish trend will remain intact as long as retracements do not break the relevant support at 16564.15. highest volume concentration occurred. If there was a bearish movement previously from it, it is considered a selling zone and forms a resistance area. Conversely, if there was a bullish impulse previously, it is considered a buying zone, usually located at lows, forming support zones.
**Consider this risk management suggestion.
**It is crucial that risk management be based on capital and traded volume. Therefore, a maximum risk of 1% of the capital is recommended. Using risk management indicators like the Easy Order is suggested.
ECB Review: Didn’t Rock the Boat, But Sailing Towards a Rate Cut
ECB Review: Didn't Rock the Boat, But Sailing Towards a Rate Cut
- As widely expected, the ECB left its three policy rates unchanged at today's meeting, leaving its key policy rate (deposit rate) at 4%. Today's meeting was expected to be a stocktaking meeting with no new policy signals and the ECB delivered just that. The ECB confirmed that the incoming information was broadly in line with the staff projections laid out at the December meeting. We view today's assessment from the ECB as necessary but not sufficient for a rate cut.
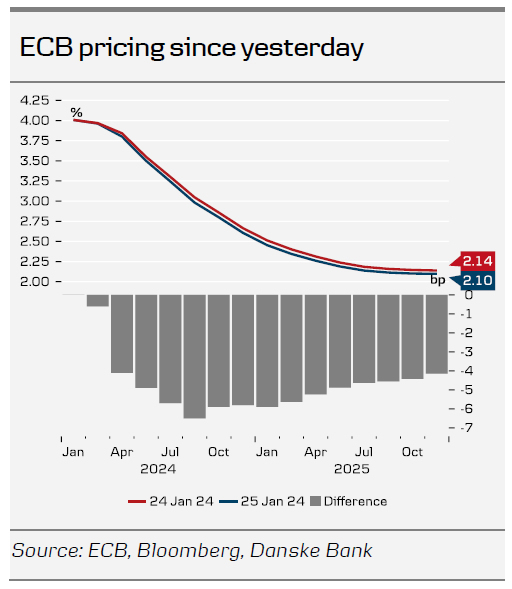
- While Lagarde said it was premature to discuss rate cuts, markets sent yields lower from the front end. Markets are pricing 20bp by the April meeting, which must be considered a live meeting. We stick to our call of a first rate cut coming in June, but highlight our long held risk bias of an April meeting cut. The question now is when/ how many there will come.
The road to rate cuts
The ECB gave no new policy signals today and Lagarde said that she stood by her comments made last week. Last week she said that the next rate change would likely be a cut and when asked whether this would be in the summer, she acknowledged that. Today's meeting will be remembered as another step in the process of the ECB delivering a rate cut.
Incoming data as expected but wage pressure is easing
Lagarde acknowledged that the incoming data since the December meeting have been broadly as expected. Hence, the ECB has not changed its assessment of the economic situation and the inflation outlook since the last meeting. Aside from the energy-related upward base effect on headline inflation, the declining trend in underlying inflation continued as past interest rates were transmitted forcefully into financial conditions. Yet, Lagarde noted that wage pressure has started to ease and that firms are absorbing wage increases by reducing profit margins instead of increasing prices. This was a slight change of communication in the soft direction compared to the December meeting. Regarding the wage growth, Lagarde highlighted that Indeed's wage growth tracker had stabilised at higher levels (and is primarily backward looking), and she also added that 40% of workers' wages will be renegotiated in the near term.
On the growth side the ECB expects that the economy stagnated in Q4 23, and Lagarde said that incoming data continue to signal weakness. However, she also noted that forward looking indicators point to a pickup in growth later this year but that the risks to the growth outlook are tilted to the downside.
April meeting may be a live meeting
Based on today's meeting, we stick to our call for the ECB to deliver its first 25bp rate cut at the June meeting, but we also repeat our long-held bias for risk of an earlier rate cut. We believe that if the ECB staff projections are revised lower, the ECB may deliver a cut already at the April meeting. The incoming data until then is plentiful with in particular inflation prints and wage growth being important, as well as the profit margin/ wage growth discussion (see above). If the January inflation next week surprises on the downside, markets will likely add to its already 20bp rate cut (cumulative). Today, Lagarde had the opportunity to push back on the market pricing and she choose not to, which led to a front-end driven rally. Markets are pricing 140bp of rate cuts until the end of this year. Lagarde said that the operational framework review will most likely be concluded by the end of spring.
EUR/USD moved lower to around the 1.0850 mark after the relatively dovish ECB meeting, which has made the April meeting live, combined with US macro data continuing to surprise to the upside, including strong Q4 flash GDP figures. We have recently discussed the possibility of a USD rally in Q1 due to stronger-than-expected US figures relative to the rest of the world. So far, this has played out well with strong US PMIs and Q4 GDP figures. We will have more clarity next week with releases such as ISM and nonfarm payrolls, in addition to the Fed meeting. Additionally, while we recognise that our Fed (first cut in March) and ECB (first cut in June) forecasts, all else equal, are positive for EUR/USD in H1, we believe that the broader pricing in the G10 could be more decisive for the cross, as we perceive current market expectations for rate cuts to be excessive. We still maintain our bias towards selling EUR/USD on rallies in the near term, and we forecast EUR/USD at 1.07/1.05 on a 6/12M horizon. We also remain short EUR/USD via a 6M put spread as part of our FX Top Trades 2024.
US: Economic Resilience Remains on Full Display in Q4 GDP Data
Real GDP expanded by 3.3% quarter-over-quarter (q/q, annualized) in the fourth quarter of 2023 – well ahead of the consensus forecast calling for a more modest gain of 2%. For the year, real GDP grew by an impressive 2.5%.
Consumer spending remained hot, rising 2.8% – a very modest deceleration from the 3.1% gain recorded in the third quarter. Gains were spread across both goods (+3.8%) and services (+2.4%).
Non-residential business investment rose 1.9%, with structures (+3.2%), equipment (+1.0%) and intellectual property products (+2.1%) all chipping in with modest gains. Residential investment also ticked higher by just over a percentage point.
Government spending increased 3.3%, as outlays rose at both the federal (+2.5%) and state & local (+3.7%) level.
After an outsized contribution in Q3, inventory investment slowed but still added a tenth of a percentage point to Q4 GDP.
Net exports also chipped in 0.4 percentage points to headline growth, as a healthy gain in exports (+6.3%) was eclipsed by a smaller gain in imports (+1.9%).
Key Implications
Wow! Economic growth ends 2023 with a bang, smashing expectations and stringing together two of the strongest back-to-back quarters in two-years. The details of the report were very supportive of the ongoing resilience, with domestic demand accounting for most of last quarter's gain.
With the economy holding up remarkably well and the labor market still tight by historical standards, policymakers can afford to proceed carefully over the coming months. Economic growth is still running well above its long-run potential, implying the near-term risks to the inflation outlook are skewed to the upside. From the Fed's standpoint, this means any imminent rate cuts are off the table, and policymakers are likely to remain on hold until at least this summer.
US 30 Index Retreats from Record Peak
- US 30 index finds support at 161.8% Fibonacci
- Technical indicators suggest bearish retracement
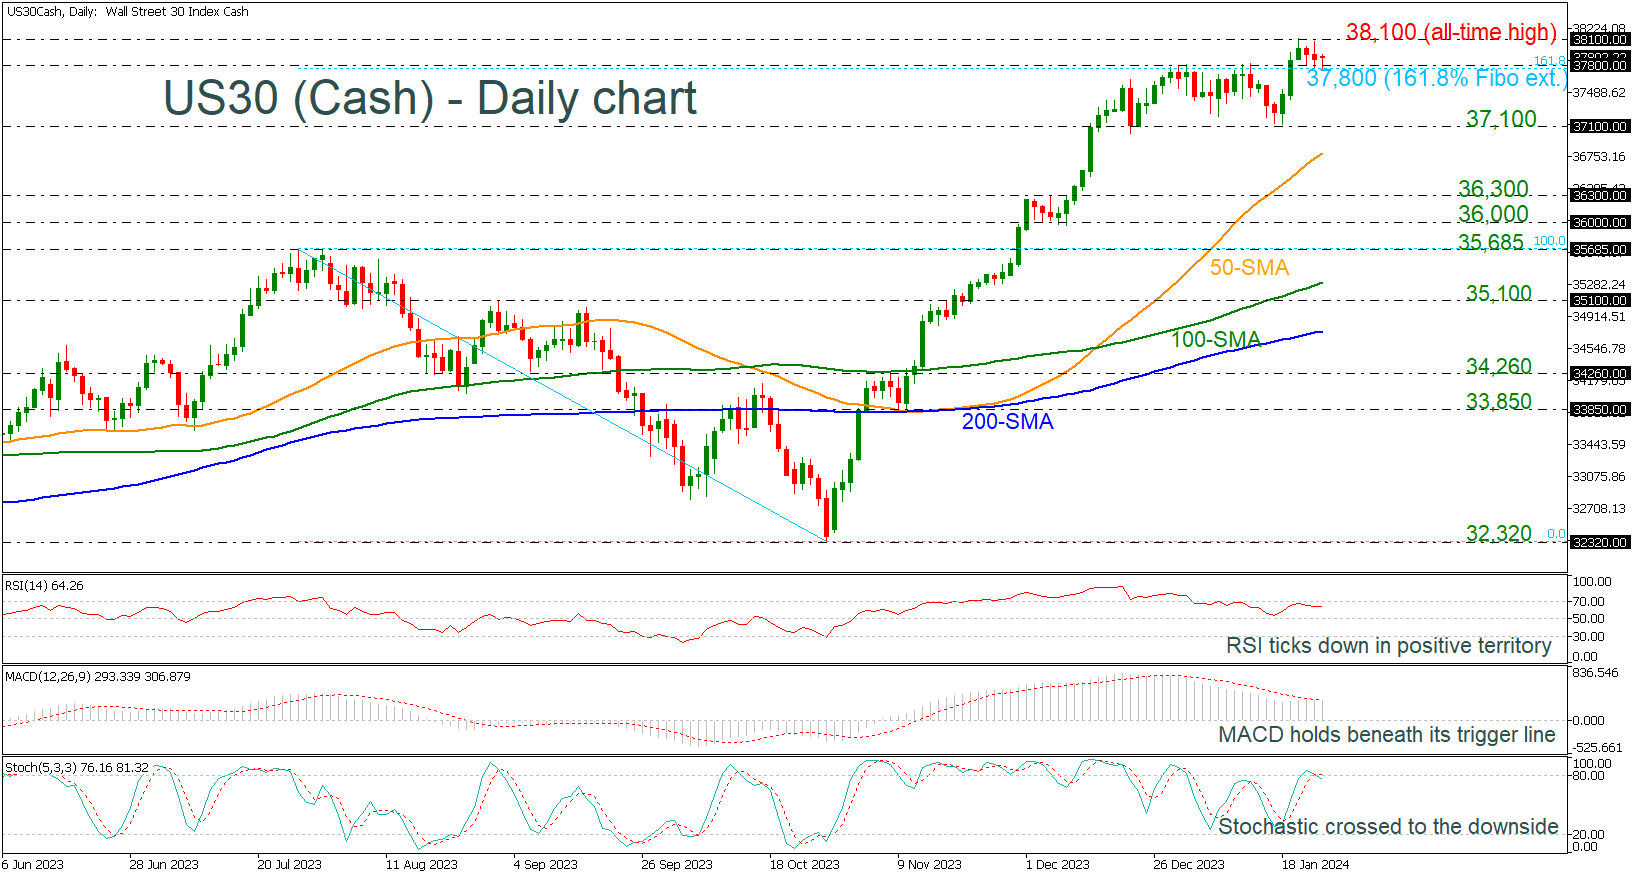
The US 30 index is easing from the all-time high of 38,108 and is meeting again the 161.8% Fibonacci extension level of the down leg from 35,685 to 32,320 at 37,800, which had acted as strong resistance over the last month.
Technically, the oscillators are indicating a negative correction. The RSI is retreating from the 70 level, while the MACD fell beneath its trigger line in the positive region. Moreover, the stochastic oscillator posted a bearish crossover within its %K and %D lines in the overbought area.
The market structure is negative in the very short-term picture as the price is currently moving lower. If the bears take the upper hand and the index, meets the 37,100 support. Selling forces could intensify towards the 50-day simple moving average (SMA) at 36,800. Then, additional losses from there could retest the 36,000 round number.
In the event the price stays resilient above the 161.8% Fibonacci extension of 37,800, the bulls might push for a close above the record high of 38,100. Therefore, a successful move higher could immediately shift the attention to the next round number of 39,000.
In a nutshell, the US 30 index may remain supported in the coming sessions, though room for improvement could be limited before the next bearish round takes place.
Sunset Market Commentary
Markets
The key events to watch today were the ECB policy decision and important US data. The main conclusion of the latter is that they, once again, underscore the resilience of the world’s largest economy. Quarterly growth in the last three months of 2023 came in at 3.3%, easily beating a 2% estimate. Beneath the headline figure, more strength appears with personal consumption contributing 1.91% to growth. Government consumption came in second (0.56%) and net exports third (adding 0.43%). Goldilocks supporters get exactly what they came for with the price indices showing a bigger deceleration than hoped-for. The GDP deflator decelerated from 3.3% to 1.5% in Q4 (2.2% expected). Core PCE came in at the anticipated 2% (unchanged vs the previous quarter). Durable goods data printed to the soft side of expectations in terms of the headline figure but printed a tad stronger in the core (and more important) readings. Weekly jobless claims rose a bit more than foreseen, to back above 200k. All of the latter data played second fiddle obviously. US yields quickly erased a kneejerk uptick (on the headline GDP outcome) after the market digested the inflation gauges. US rates lose between 4.4 and 5.5 bps across the curve. A May cut is cemented deeper.
The ECB policy decision was no surprise with steady rates and no tweaks to the statement or official guidance whatsoever. Its (December) medium-term inflation outlook has been broadly confirmed by incoming data. The central bank can stay put for the time being with “rates at levels that, maintained for a sufficiently long duration, will make a substantial contribution to this [reaching the 2%] goal.” The recent uptick in CPI was dismissed as energy-related while the underlying trend in core inflation has continued. Lagarde noted how almost all underlying gauges fell further in December in a remark that was picked up as dovish by markets. The ECB chair during the press conference reiterated that the discussion about rate cuts was considered premature. She said she stands by her comments made in the Bloomberg interview, referring to the summer as a broad timing for a first cut. However, she distanced herself from “the conclusions made by others” following that comment. Bloomberg, for one, afterwards reported that a consensus was building for a June cut. Considering Lagarde’s pushback today was not at all as convincing as it was last week, markets took that as another dovish hint. Total easing priced in for 2024 is now 140 bps compared to 129 bps prior to the press conference with chances for an April move rising to >80%. That’s despite Lagarde saying that she’s still waiting on important data which could take months before reaching Frankfurt, the outcome of wage negotiations to mention a critical one. The ECB does see encouraging signs of company profits absorbing the wage push higher. All in all, investors mainly draw some soft conclusions from the meeting. Supported by US spillovers, German yields decline between 2.5 and 8.1 bps. The front end outperforming. European stocks bottom out and even trade in the green (+0.3% for the EuroStoxx50). The euro loses ground against most peers. EUR/USD eases towards 1.086 and is probably lucky the US dollar is losing interest rate support as well.
News & Views
The Norwegian central bank kept its policy rate unchanged at 4.5% today, a level at which it will likely be kept for some time ahead. Both inflation and economic activity have been broadly in line with the projections in the December 2023 Monetary Policy Report. The krone is stronger than expected. If cost inflation remains elevated, or the krone depreciates again, inflation may remain high for longer than previously projected. In that case, the Monetary Policy Committee (MPC) is prepared to raise the policy rate again. If there is a more pronounced slowdown in the Norwegian economy or inflation declines more rapidly, the policy rate may be lowered earlier than envisaged in December. Norwegian markets didn’t respond to the decision. EUR/NOK changes hands around 11.37 with money markets attaching a 70% probability to a rate cut as soon as June.
The Turkish central bank (CBRT) raised its policy rate from 42.50% to 45%. Taking into account the lagged impact of monetary tightening, the MPC assesses that the monetary tightness required to establish the disinflation course is achieved and that this level will be maintained as long as needed. That is until there is a significant decline in the underlying trend of monthly inflation (2.93% M/M and 64.77% Y/Y in December for headline CPI) and until inflation expectations converge to the projected forecast range. The Turkish lira holds steady near record low levels just above EUR/TRY 33.