

Sample Category Title
USD: Likely Outcomes of the PCE
The recent economic data presents a nuanced narrative, showcasing the resilience of the US economy amid uncertainties. As we navigate through the mixed signals of GDP growth, price index fluctuations, and surprising jobless claims, it becomes evident that a comprehensive understanding of these indicators is essential for making informed predictions about the nation's economic trajectory. The upcoming release of the PCE Price Index will serve as a crucial piece in the puzzle, providing a more complete picture of the economic landscape and shaping expectations for the months ahead.
GBPUSD - D1 Timeframe
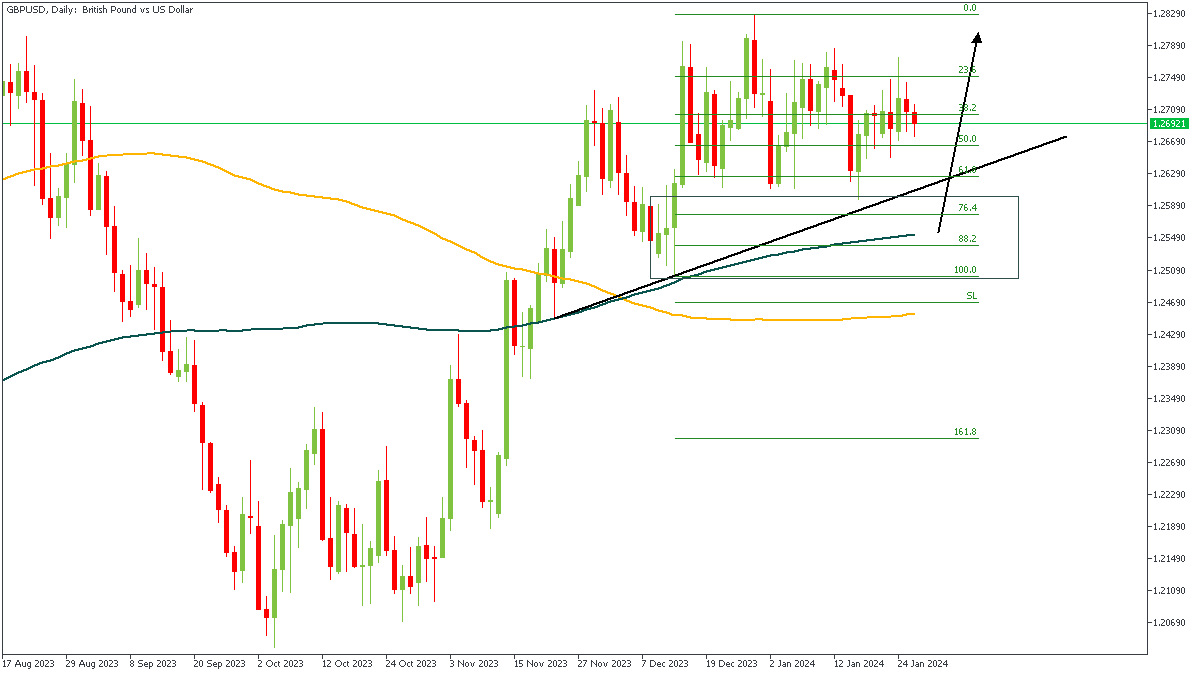
The Daily timeframe of GBPUSD looks quite choppy, but the price action indicates that the last major break-of-structure was a bullish break, hence, I have positioned my entry at the drop-base-rally order block. This order block syncs well with the bullish array of the moving averages, the 100-day moving average support, 76% of the Fibonacci, as well as the trendline support. All these suggest the likelihood of a bullish outcome soon.
Analyst’s Expectations:
- Direction: Bullish
- Target: 1.26988
- Invalidation: 1.24922
EURUSD - D1 Timeframe
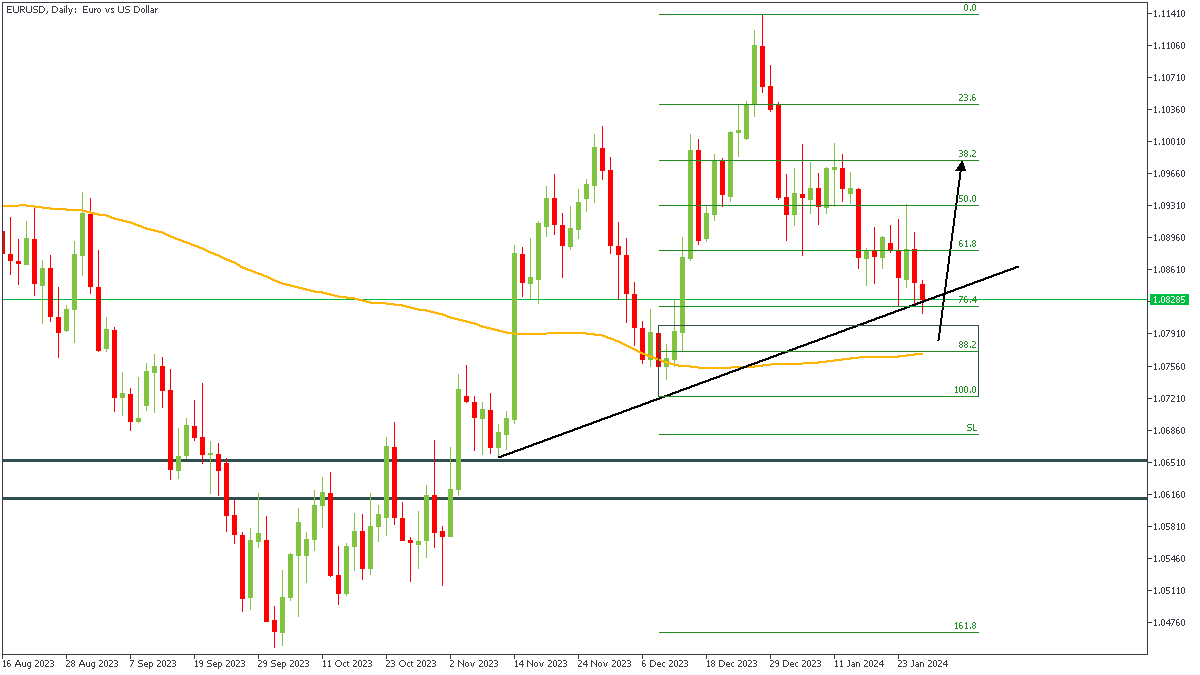
EURUSD is currently resting on the support trendline, and the 76% of the Fibonacci retracement level. The presence of the 200-day moving average as a support, and the 88% of the Fibonacci retracement right on top of the drop-base-rally demand zone concludes my argument in favour of a bullish outcome.
Analyst’s Expectations:
- Direction: Bullish
- Target: 1.09300
- Invalidation:1.07191
AUDUSD - D1 Timeframe
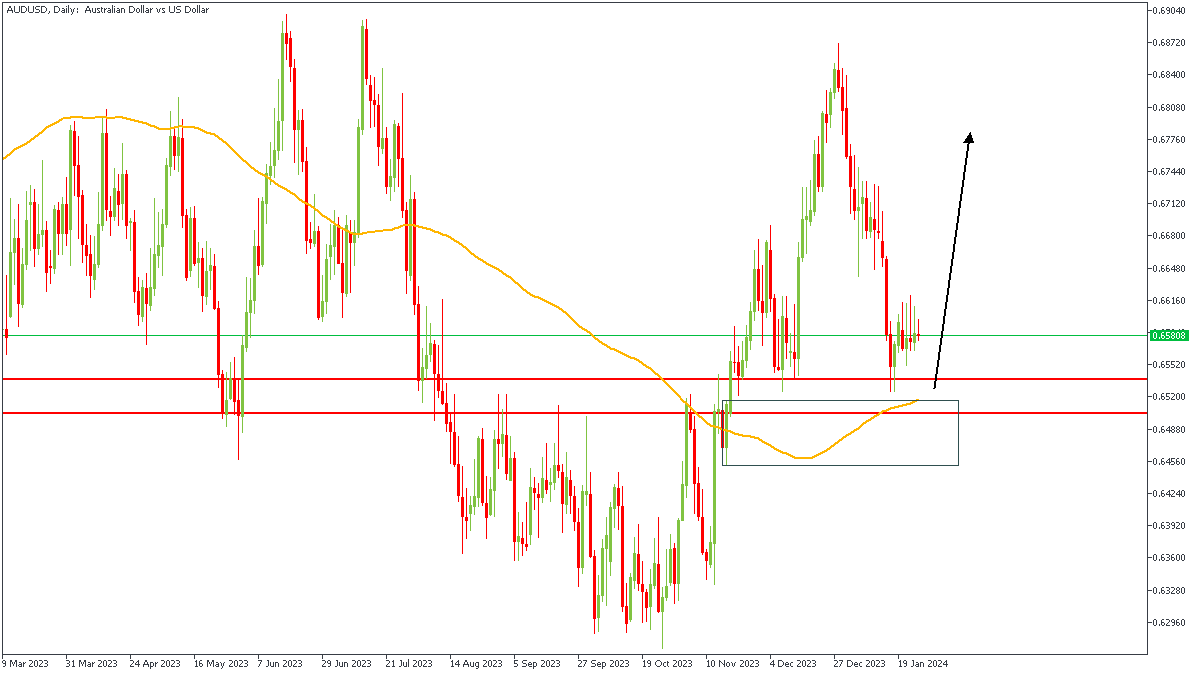
AUDUSD had quite a swift drop for a couple of days and can be seen consolidating at the moment; this price action is often indicative of the weaning off of the bearish impulse, creating room for new buying pressure. Furthermore, the rally-base-rally demand zone, pivot zone, and the 200-day moving average all seem to agree in favour of a bullish reaction from the marked zone.
Analyst’s Expectations:
- Direction: Bullish
- Target: 0.66395
- Invalidation: 0.64453
CONCLUSION
The trading of CFDs comes at a risk. Thus, to succeed, you have to manage risks properly. To avoid costly mistakes while you look to trade these opportunities, be sure to do your due diligence and manage your risk appropriately.
AUDUSD Hovers Around 200-day SMA after Decline Halts
- AUDUSD pauses short-term retreat at December low
- Double bottom pattern triggers a rebound, but 200-SMA holds strong
- Momentum indicators remain heavily tilted to the downside
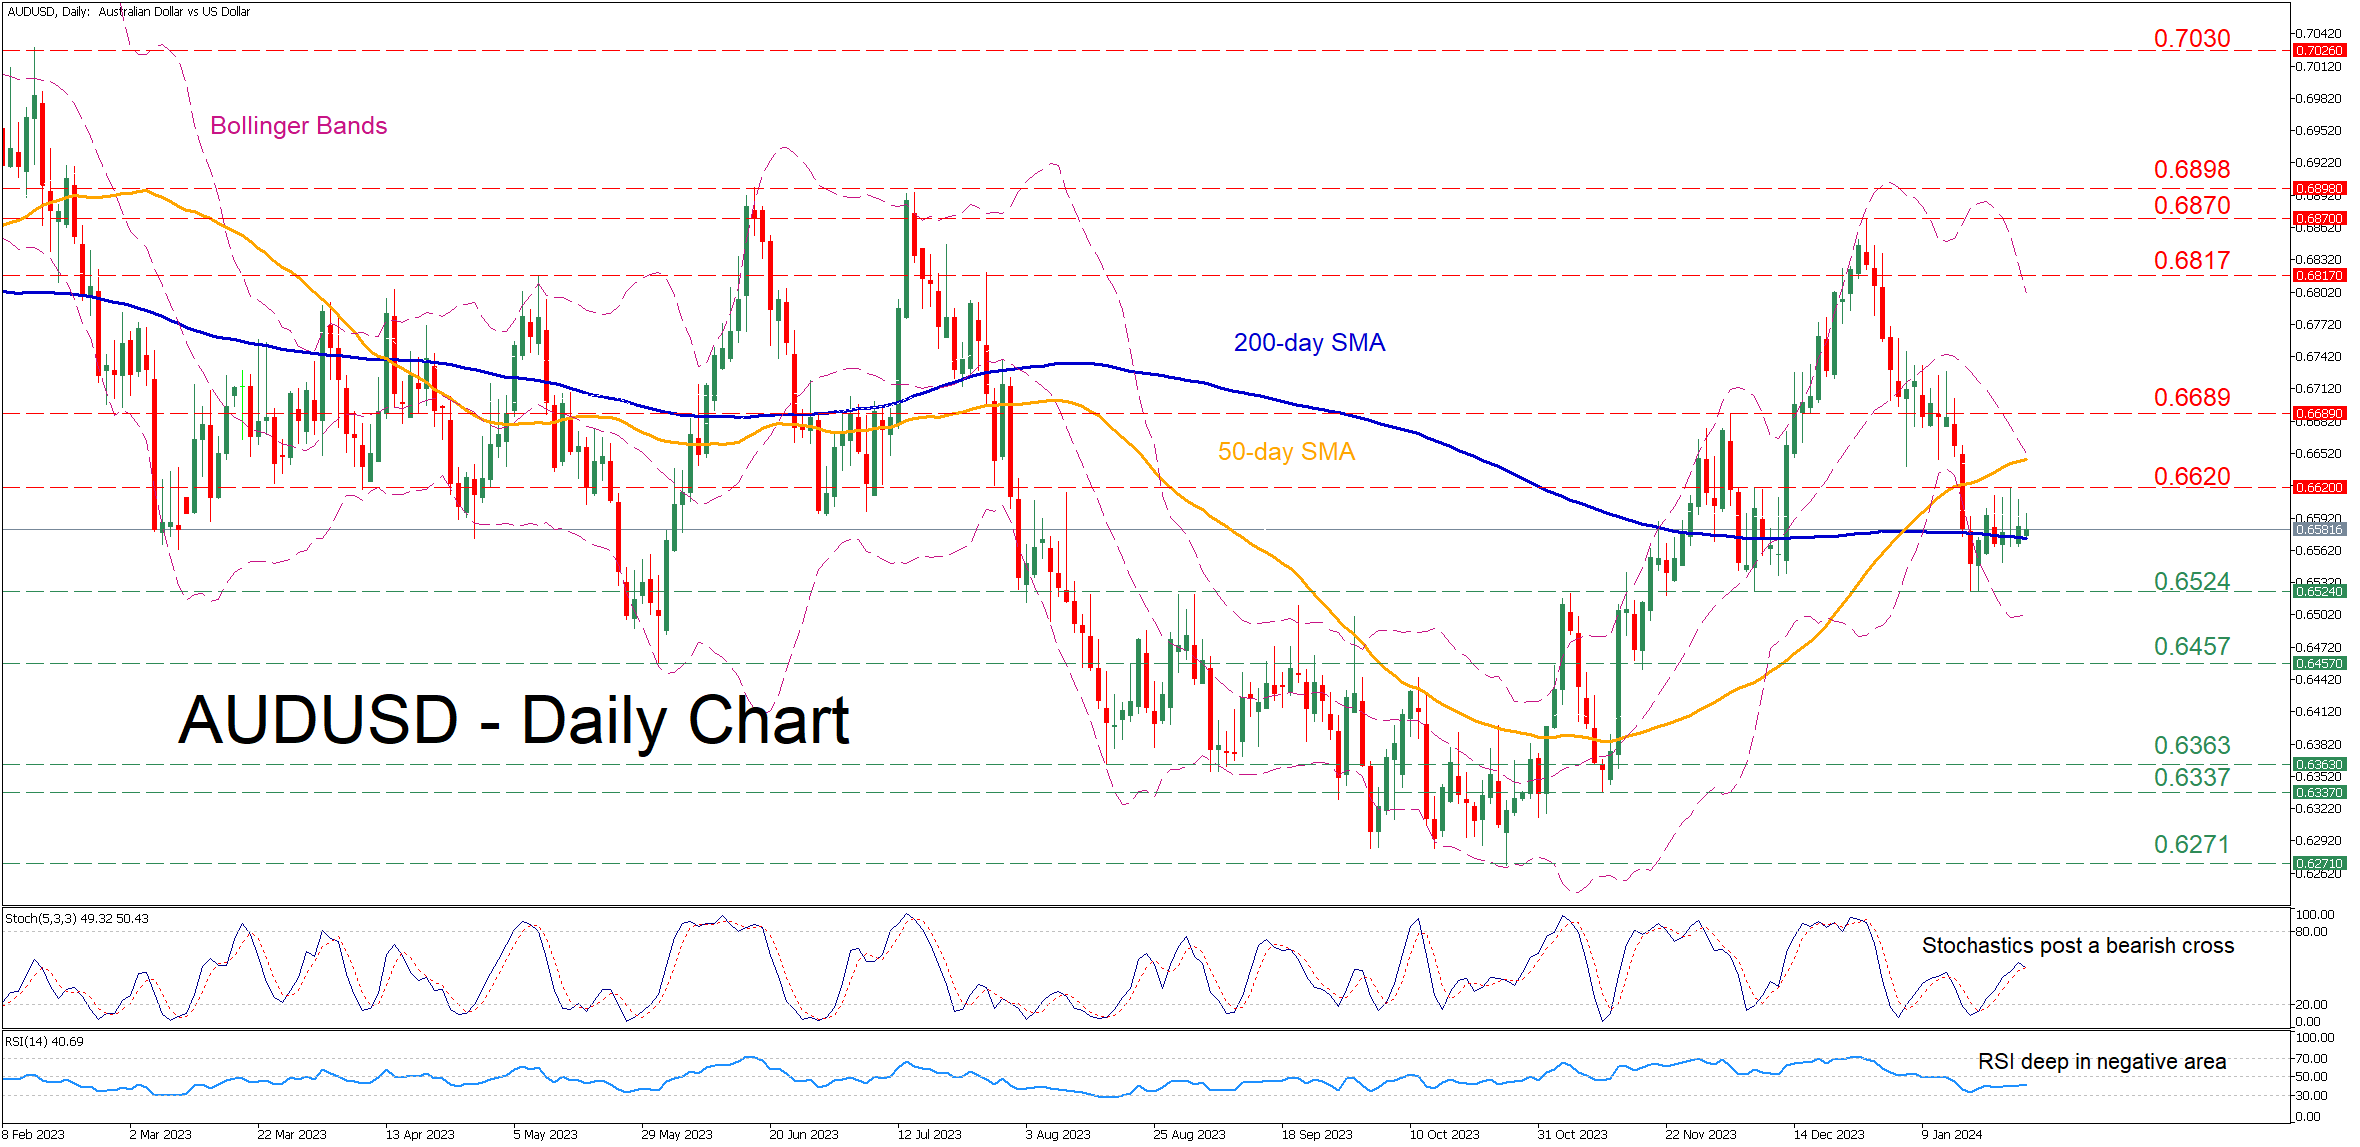
AUDUSD experienced a vast selloff following its December peak of 0.6870, breaking below both its 50- and 200-day simple moving averages (SMAs). Although the pair managed to halt its retreat at the double bottom of 0.6524, its rebound has been repeatedly held down by the 200-day SMA.
Given that both the RSI and stochastics are providing bearish signals, the price could revisit its January bottom of 0.6524. Diving below that zone, the pair might challenge the May low of 0.6457, which also provided support in November. A violation of that region could open the door for the August bottom of 0.6363.
On the flipside, if the pair conquers the 200-day SMA, the recent resistance of 0.6620 could prove to be a strong barricade for the bulls to claim. Further advances could then cease at the December resistance of 0.6689 ahead of the May peak of 0.6817. Should that hurdle also fail, the spotlight could turn to the December high of 0.6870.
Overall, AUDUSD has attempted to recoup some losses in the near term, but the 200-day SMA has been acting as a strong ceiling. A failure to claim the latter could pave the way for the continuation of the short-term selloff.
Ethereum Could End Consolidation With a Dip Towards $2000
Market picture
Volatility in the cryptocurrency market remains subdued, keeping the capitalisation near $1.56 trillion for the third day. Meanwhile, Bitcoin remains around $40K, and Ethereum looks pegged to $2200.
The drop in equity indices over the past 24 hours hasn’t been too much of a concern for cryptocurrency investors so far, as it looks more like a series of individual corporate stories rather than a global shift in sentiment.
Bitcoin is benefiting from this consolidation as its share of all cryptocurrencies has once again surpassed 50%.
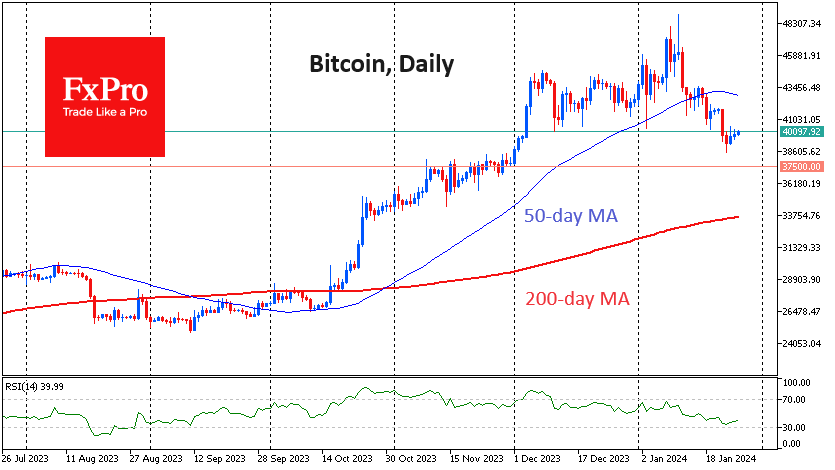
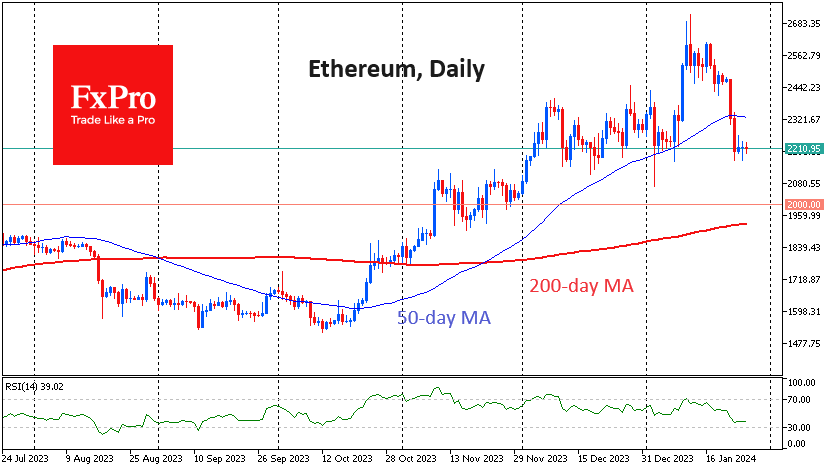
Meanwhile, Ethereum, the second most-capitalised coin, has returned to the lower end of the consolidation it spent most of December in, losing since the start of the day and threatening to fall a notch lower to the $2100 area, which was the upper end of the consolidation in November. A decline here would be as logical a move as a BTCUSD pullback to $37500, which remains the main scenario. At the same time, however, be prepared for a brief dip towards $2000 due to cryptocurrency volatility.
News background
The SEC postponed the decision on BlackRock’s application to launch a spot Ethereum ETF until 10 March. Optimistic experts expect the Ethereum ETF to be approved in May with a 50-70% probability, while sceptics point to regulatory resistance.
The emergence of spot bitcoin ETFs in the US has opened the door for the cryptocurrency to reach a wider audience. Now, for the first time, cryptocurrency could become mainstream, said the head of institutional at exchange Coinbase. New cryptocurrencies will attract a lot of capital, but it won’t happen overnight. It will take “months and even years”.
The G20’s Financial Stability Board in 2024 plans to focus on global regulations for the digital asset industry and the regulation of artificial intelligence.
Reuters confirmed the existence of a thriving underground crypto market in China. Investor interest in digital assets is growing against the backdrop of a troubled economy and a lack of value preservation tools. With Hong Kong’s approval of digital assets in 2023, Hong Kong has become one of the opportunities for Chinese investors to access cryptocurrencies.
AUD/USD and NZD/USD Target Additional Gains
AUD/USD is moving higher and might surge if it clears 0.6610. NZD/USD is also rising and could extend its increase above the 0.6110 resistance zone.
Important Takeaways for AUD USD and NZD USD Analysis Today
- The Aussie Dollar is attempting a fresh increase from the 0.6570 zone against the US Dollar.
- There is a key contracting triangle forming with resistance near 0.6595 on the hourly chart of AUD/USD at FXOpen.
- NZD/USD is showing positive signs above the 0.6100 support.
- There is a major bearish trend line forming with resistance near 0.6110 on the hourly chart of NZD/USD at FXOpen.
AUD/USD Technical Analysis
On the hourly chart of AUD/USD at FXOpen, the pair corrected lower but remained well-bid above the 0.6570 support. The Aussie Dollar is forming a base above 0.6570 and now attempting a fresh increase against the US Dollar, as discussed in the previous analysis.
The bulls pushed the pair above the 50% Fib retracement level of the downward move from the 0.6609 swing high to the 0.6570 low. There was a close above the 0.6590 resistance and the 50-hour simple moving average.
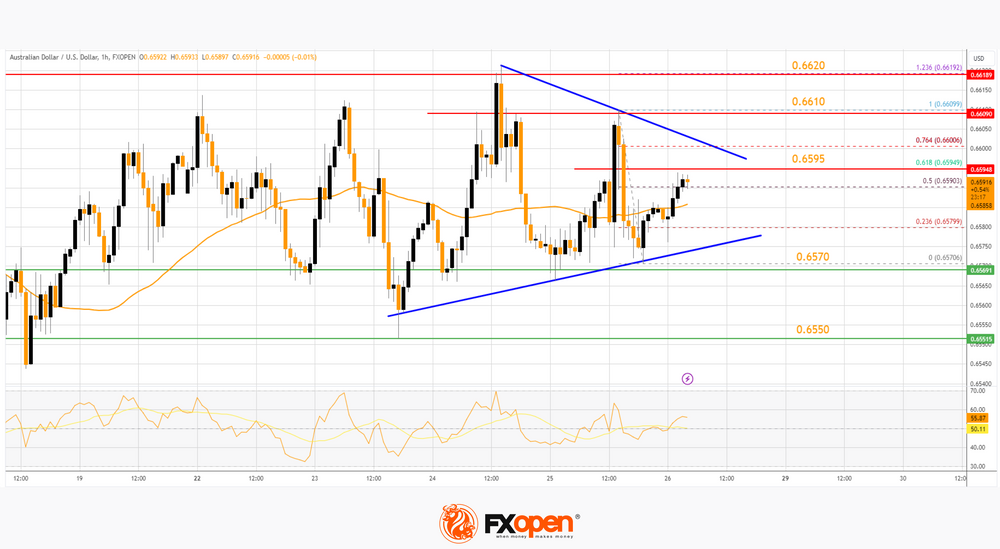
On the upside, the AUD/USD chart indicates that the pair is now facing resistance near a key contracting triangle at 0.6595. It is close to the 61.8% Fib retracement level of the downward move from the 0.6609 swing high to the 0.6570 low.
The first major resistance might be 0.6610. An upside break above the 0.6610 resistance might send the pair further higher. The next major resistance is near the 0.6650 level. Any more gains could clear the path for a move toward the 0.6720 resistance zone.
If not, the pair might correct lower below the 50-hour simple moving average at 0.6585. The next support could be 0.6570. If there is a downside break below the 0.6570 support, the pair could extend its decline toward the 0.6550 zone. Any more losses might signal a move toward 0.6515.
NZD/USD Technical Analysis
On the hourly chart of NZD/USD on FXOpen, the pair corrected lower from the 0.6150 zone. The New Zealand Dollar is now holding the 0.6100 support and eyeing a fresh increase against the US Dollar.
A low has formed near 0.6102 and the pair is consolidating in a range. On the upside, the pair is facing resistance near the 50-hour simple moving average at 0.6610. There is also a major bearish trend line forming with resistance at 0.6110.
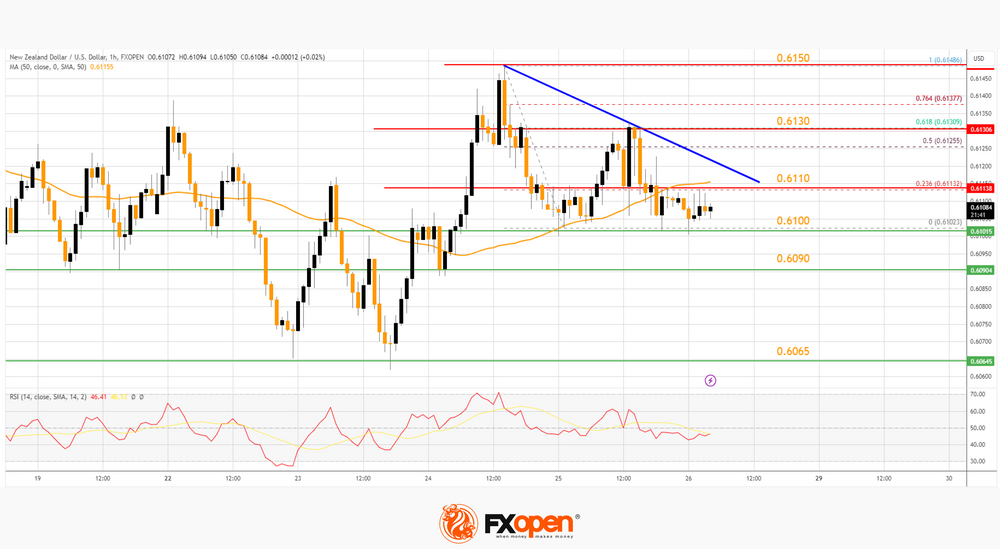
The trend line is close to the 23.6% Fib retracement level of the downward move from the 0.6148 swing high to the 0.6102 low. The NZD/USD chartsuggests that the RSI could move above 50.
The next major resistance is near the 50% Fib retracement level of the downward move from the 0.6148 swing high to the 0.6102 low at 0.6130. A clear move above the 0.6130 level might even push the pair toward the 0.6150 level. Any more gains might clear the path for a move toward the 0.6200 resistance zone in the coming days.
On the downside, there is a support forming near 0.6110. The next major support is 0.6090. If there is a downside break below the 0.6090 support, the pair might slide toward the 0.6040 support. Any more losses could lead NZD/USD in a bearish zone to 0.6000.
This article represents the opinion of the Companies operating under the FXOpen brand only. It is not to be construed as an offer, solicitation, or recommendation with respect to products and services provided by the Companies operating under the FXOpen brand, nor is it to be considered financial advice.
USD/JPY Steady after Tokyo Core CPI Falls Below 2%
The Japanese yen is drifting on Friday. In the European session, USD/JPY is trading at 147.80, up 0.10%.
Tokyo Core CPI falls to 1.6%
Tokyo Core CPI reached a significant milestone today, falling to 1.6% y/y in January, after a December reading of 2.1%. This was the first time the indicator dropped below the Bank of Japan’s 2% target since May 2022. The main driver of the decline was lower energy prices. Tokyo Core CPI excludes fresh food but includes fuel. The Tokyo core-core index, which excludes fresh food and fuel prices, rose 3.1% y/y in January, down from 3.5% in December.
The drop in inflation reinforces the BoJ’s view that cost pressures are gradually being replaced by rising service prices as the main driver of inflation. This is hugely significant, as it points to inflation being more sustainable, which is a requirement for the BoJ before it tightens its ultra-loose policy. Japan also released corporate service inflation for December which held steady at 2.4%, a nine-year high. That reading underscores that service prices remain high a companies continue to pass on their costs.
BoJ Governor Ueda stated at this week’s policy meeting that progress is being made towards the target of 2% sustainable inflation, and that has the markets speculating that the BoJ could make a major policy shift in April or June. The BoJ wants to see higher wages as evidence that inflation is sustainable and the national wage negotiations in March are expected to provide higher wages for workers.
In the US, the first-estimate GDP for the fourth quarter smashed above expectations, but the US dollar didn’t show much interest. GDP growth rose 3.3% y/y, below the 4.9% gain in the third quarter but well above the consensus estimate of 2.0%. The US economy continues to produce stronger-than-expected data and that has the markets paring expectations for a rate cut in March. The probability of a March cut has fallen to 48%, down sharply from 70% one month ago, according to the CME’s FedWatch tool.
USD/JPY Technical
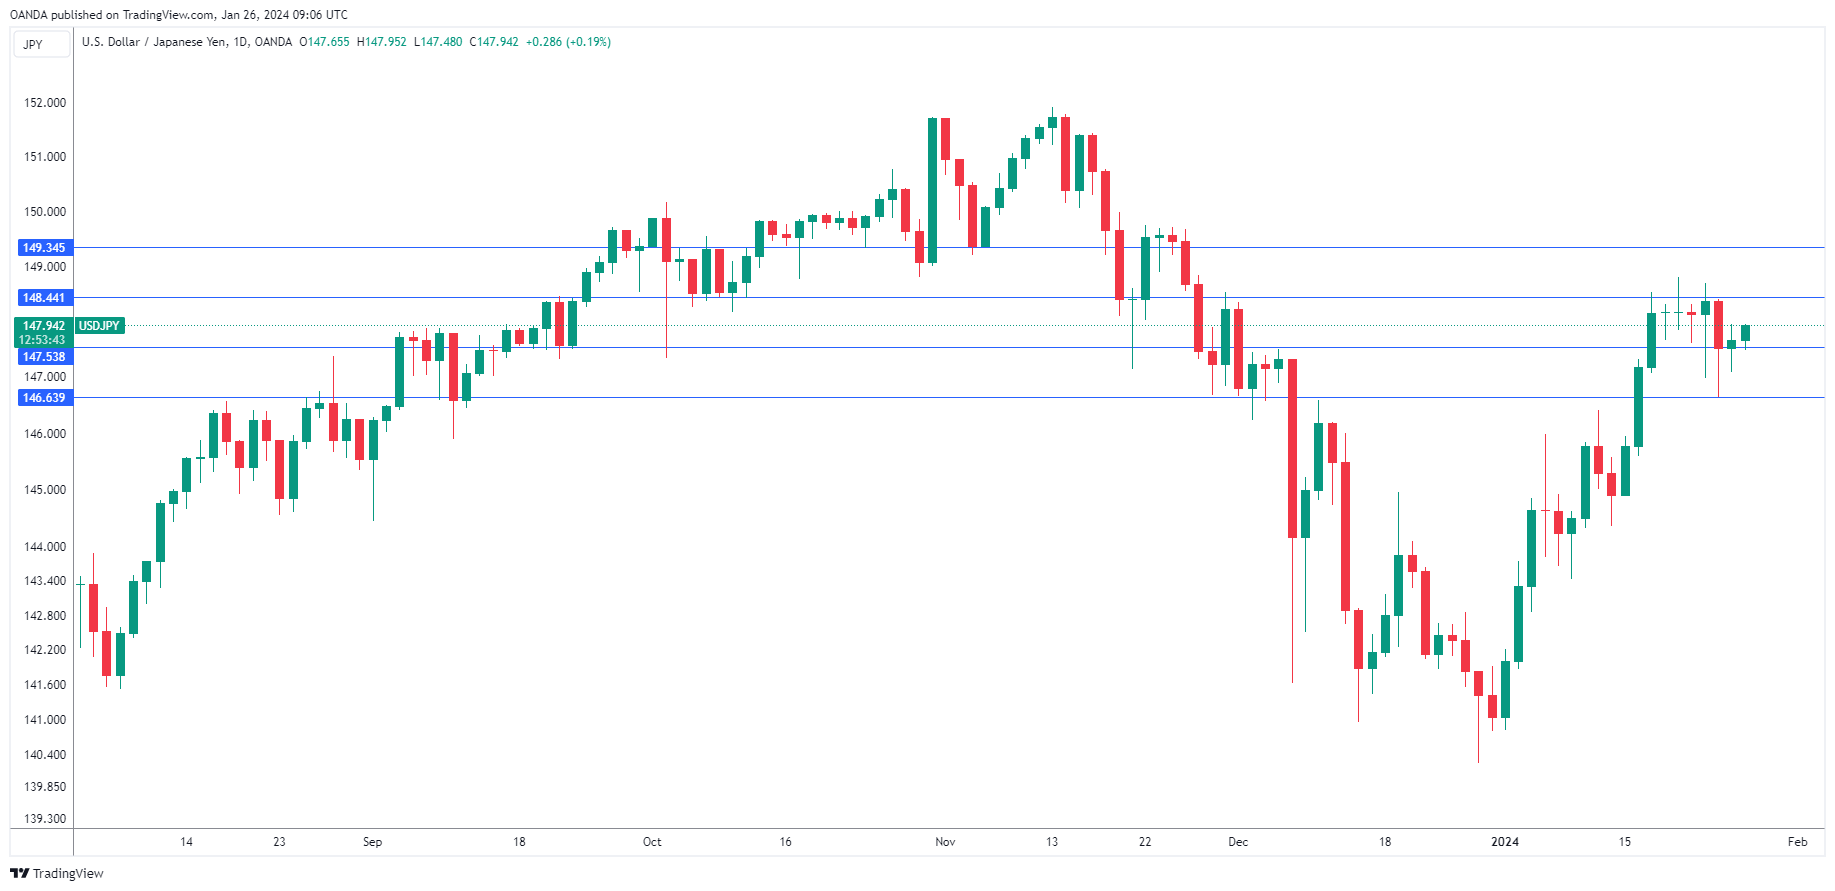
- USD/JPY tested support earlier at 147.54. Below, there is support at 146.63
- There is resistance at 148.44 and 149.35
USDCAD Looks Ready for Bearish Retracement
- USDCAD battles with 200-day SMA
- Holds above downtrend line
- But momentum indicators show weak signals
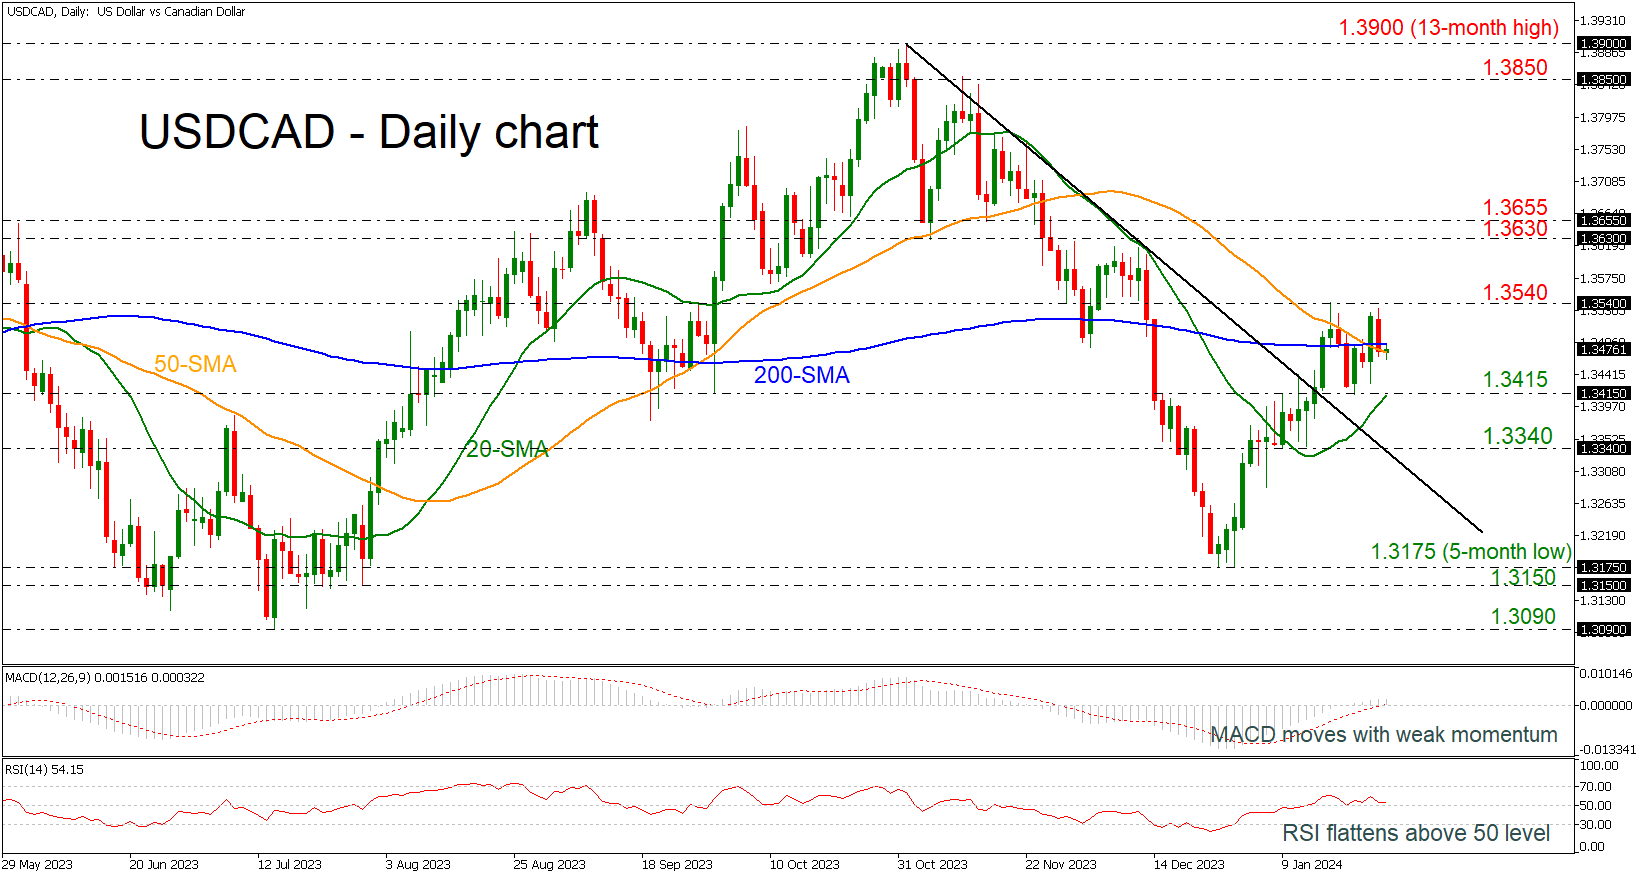
USDCAD is holding above the medium-term ascending trend line and is moving back and forth from the flat 200-day simple moving average (SMA) at 1.3483.
The technical indicators are still located in the bullish area, with the MACD stretching slightly above its red signal line but with weak momentum, and the RSI is pointing marginally up near the 50 level. Yet the latter could also be an indication that the rally is overdone, and hence negative corrections should not be a surprise in coming sessions.
Should the price retreat, the 20-day SMA at 1.3415, which the bears were unable to break this week, could provide immediate support. Moving lower, the focus would shift to the 1.3340 barricade, while lower still, a violation of the downtrend line again would increase speculation that the bullish phase has ended and a downtrend is in progress.
In the alternative scenario, traders would eagerly be looking for a break above the 200-day SMA and more importantly the 1.3540 resistance will increase buying orders towards the 1.3630 resistance. If that’s the case, the rally could last until the 1.3630-1.3655 zone.
The recent bullish move above the descending trend line turned the short-term picture to a more positive one. However, the recent sideways move within 1.3415-1.3540 is raising the likelihood for a potential downside retracement again.
WTI Oil Technical: Approaching a Key Medium-term Resistance, At Risk of Mean Reversion Decline
- WTI crude oil has started to evolve into a short-term uptrend phase reinforced by the recent liquidity infusion by China’s central bank, PBoC upcoming 50 bps cut on the RRR.
- The current 5-day rally of WTI crude oil has reached a key medium-term resistance zone of US$79.00/79.40 with a short-term overbought condition.
- At the risk of a minor mean reversion decline with intermediate supports at US$75.30 and US$74.80.
Benchmark oil prices have bottomed and traded higher since the start of this week as the West Texas Oil (a proxy of WTI crude oil futures) had rallied by +4.9% week-to-date at this time of the writing, its best weekly gain since the 9 October 2023.
On top of the rising geopolitical risk premium that is supporting firmer oil prices from the ongoing tensions in the Middle East region and Red Sea shipping route, the additional liquidity infusion from China’s central bank (PBoC) with an upcoming 50 bps cut on commercial banks’ reserve requirement ratio has also triggered an indirect “demand-pull” catalyst on oil prices.
CTA funds may have contributed to the current bullish momentum frenzy
All in all, these factors have created short-term reflexive positive feedback into the oil market reinforced by possible speculative CTA funds that run on momentum-driven models that piled into oil futures with a bullish bias.
The price actions of the benchmark Brent and WTI crude oil have pierced above their respective 50-day moving averages on Monday, 22 January and have capped their prices previously since late October 2023; positive momentum begets positive momentum.
At the risk of a minor mean reversion decline below US$78.40
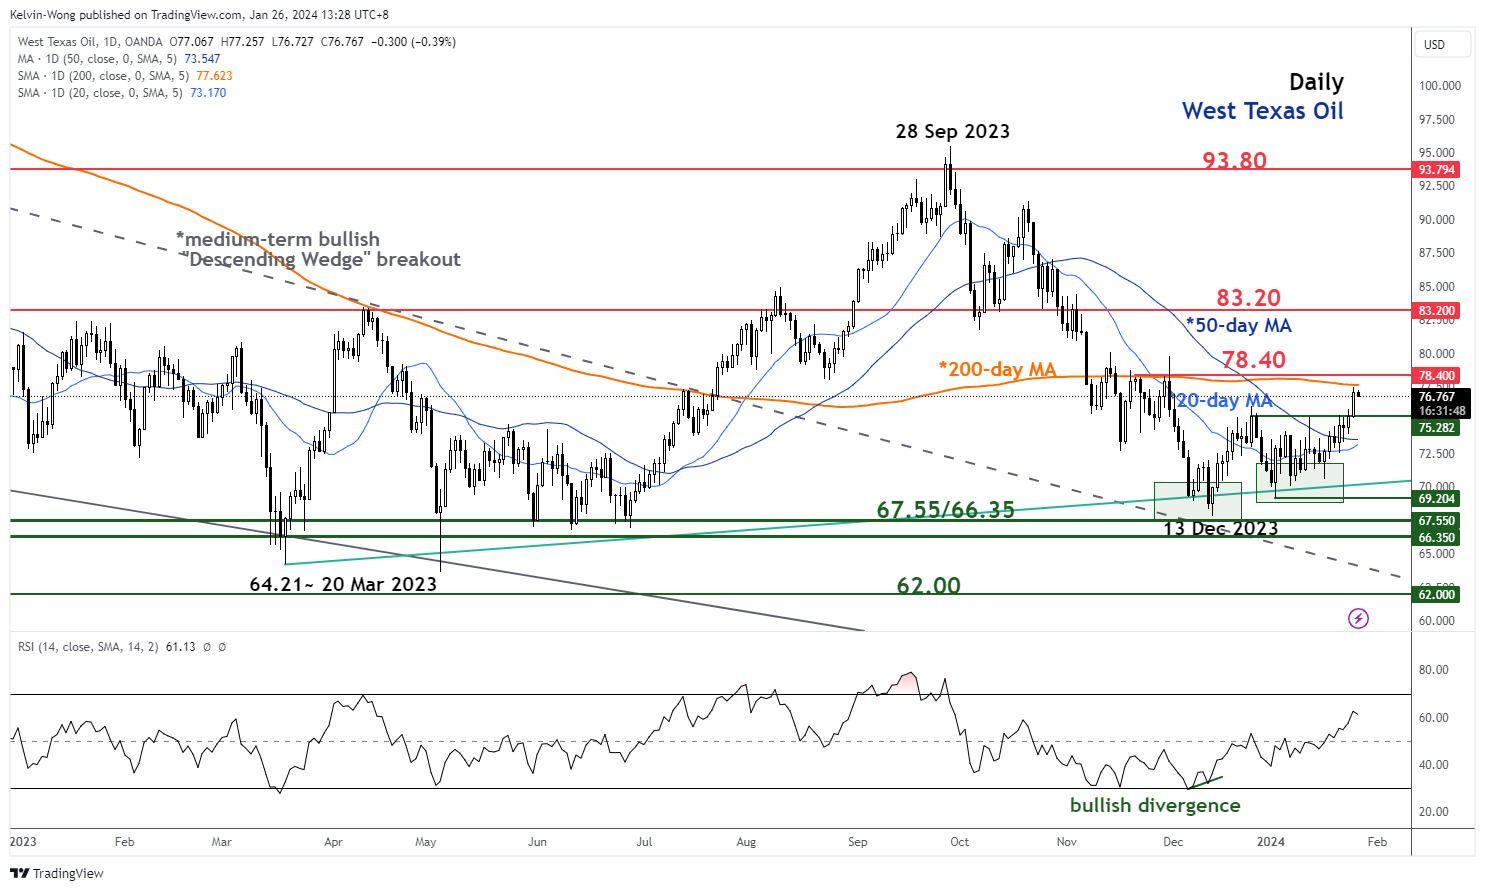
Fig 1: West Texas Oil medium-term trend as of 26 Jan 2024 (Source: TradingView, click to enlarge chart)
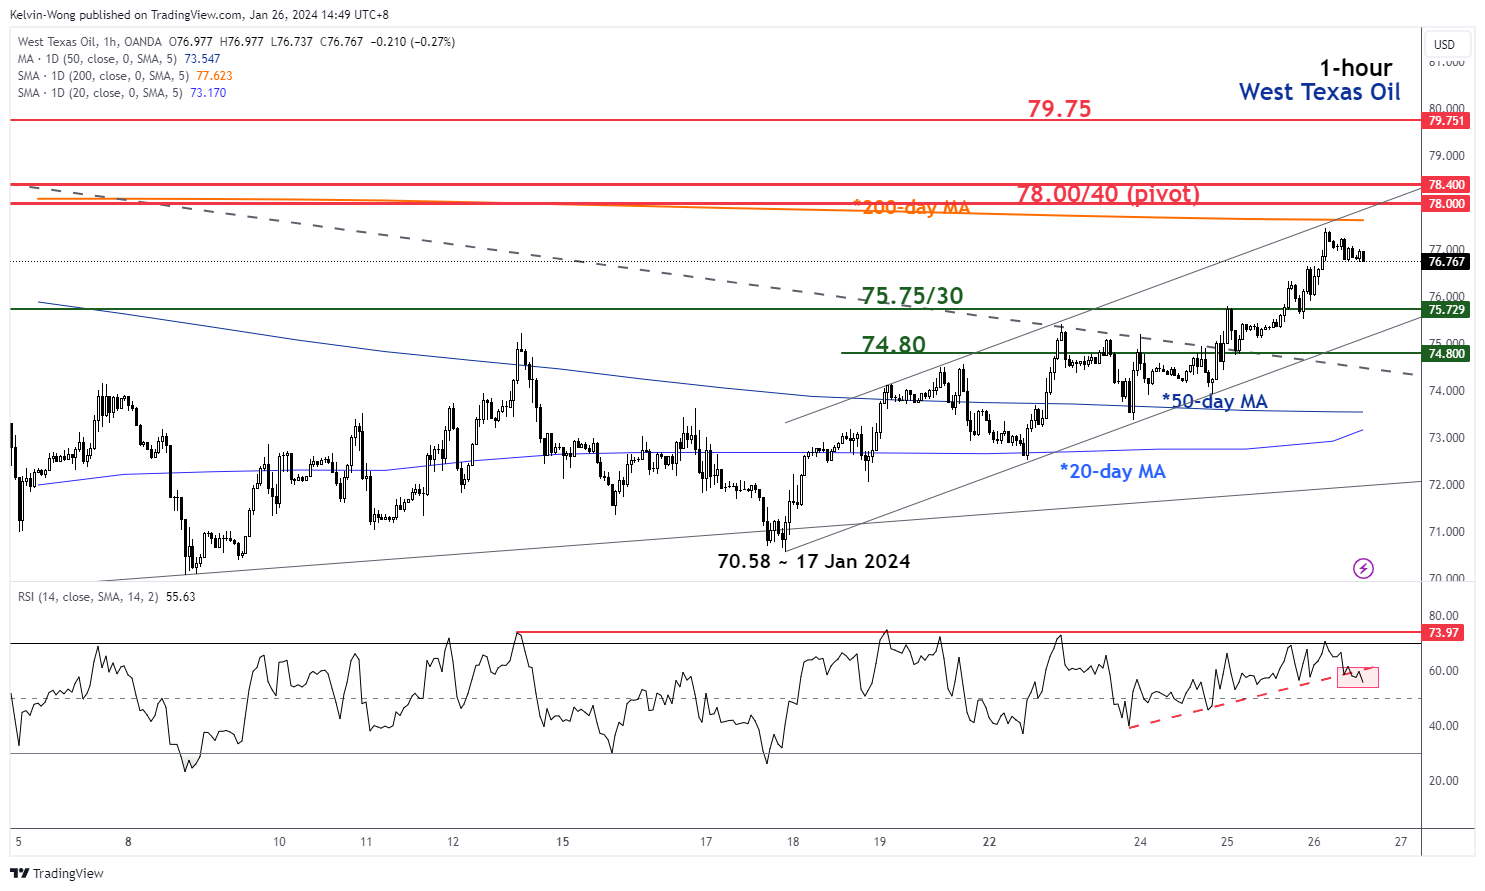
Fig 2: West Texas Oil minor short-term trend as of 26 Jan 2024 (Source: TradingView, click to enlarge chart)
In the lens of technical analysis, the recent push-up of West Texas Oil since the start of this week has led its hourly RSI momentum indicator to hover close to an extremely overbought level of around 74 in place since 12 January 2024.
This current overbought condition has also taken form as its price action is now coming close to a key medium-term resistance zone of US$78.00/78.40 (upper boundary of the minor ascending channel from 17 January 2024 low & close to the key 200-day moving average).
Therefore, the odds have increased for a potential minor mean reversion decline to retrace a portion of the ongoing short-term uptrend phase with the next intermediate supports coming in at US$75.75/75.30 and US$74.80.
On the flip side, clearance above the US$78.40 pivotal resistance invalidates the mean reversion decline scenario for a continuation of the bullish trend towards the next intermediate resistance at US$79.75 in the first step.
ECB’s Kazaks cautions against hasty rate cuts
ECB Governing Council member Martins Kazaks emphasized a cautious approach to reducing interest rates in an interview with BloombergTV. He acknowledged that while a downward adjustment in rates is anticipated, the ECB should not hasten this process, cautioning against premature actions that could potentially rekindle inflation.
Kazaks drew parallels to historical instances, particularly from the 1970s and 80s, to underline the risks associated with relaxing monetary policy too soon. "There's the risk that inflation starts to come back and then one would need to raise rates much more," he added.
Regarding, the timing and magnitude of easing cycles, he indicated that ECB could opt for either smaller steps initiated earlier or larger steps taken at a later stage. But Kazaks emphasized that would be "all data dependent".
Money Markets Added to ECB Easing Bets
Markets
ECB president Lagarde’s “I stand by the comments made in Davos” did little to impress markets. They even interpreted it the other way around as if the ECB chair went slightly off-script at the World Economic Forum (“summer seems to be right time to start cutting policy rates”). Comments about downside economic risks, a downward trend in underlying inflation and declining wage growth only added to the feeling that the central bank wants to keep all options open. That is obviously after the April policy meeting as they rather forcibly committed to wanting to see the outcome of Q1 wage negotiations first. Money markets added to policy easing bets, fully discounting an April rate cut (not our preferred scenario) and discounting a cumulative 50 bps rate cuts by June and almost 150 bps by the end of the year. That’s more or less equal to a 25 bps rate cut at each and every meeting starting in April. German Bunds outperformed US Treasuries. Daily changes on the German yield curve ranged between -9.3 bps (2-yr) and -2.4 bps (30-yr). US yields followed the move south with daily changes varying between -3.8 bps (30-yr) and -8.8 bps (3-yr) despite another strong quarterly GDP figure. Q4 growth beat consensus at an annualized 3.3% (vs 2% forecast) with another strong contribution of personal consumption (2.8%). We believe that US Treasuries followed Bunds higher because yesterday’s display by ECB Lagarde will likely see a repeat in Powell’s testimony next week given that the Fed Chair wasn’t even fighting market expectations back in December. US money markets attach a 50% probability to a March rate cut. In FX space, the single currency lost out after Lagarde’s unconvincing performance. EUR/USD closed at 1.0846 after testing the YTD low at 1.0822. Our bias remains for a weaker EUR/USD with 1.0724/12 the important reference (Dec 2023 low and 62% retracement on Q4 rally). EUR/GBP closed before the December low of 0.8549, with the downside of long-standing sideways range at EUR/GBP 0.8493 coming ever closer in the run-up to next week’s Bank of England policy meeting. Stock markets added another victory lap with key European and US benchmarks closing up to 0.5% higher. Today’s eco calendar is empty apart from December US PCE deflators. Those shouldn’t come as a surprise though as they can be derived from yesterday’s GDP data. The countdown to next week’s Fed gathering starts and we don’t expect an immediate reversal of the post-ECB market moves.
News & Views
In an interview with radio broadcaster Inforadio, Hungarian Finance Minister Mihaly Varga said that Hungary won’t be able to reduce the budget deficit to 3% this year. This will probably only be possible by 2025. Varga specified the government needs to balance the budget without hindering economic growth. In this respect, reducing the budget deficit from 6% to 3% in one year would make growth that just has started to recover very difficult. Trying to reach the target would require a HUF 2700bn (€7bn) adjustment. Varga clarified that this assessment is his personal opinion, not an official viewpoint of the government.
Tokyo price inflation, which is seen as a precursor for the national data, eased substantially this month. CPI ex fresh food dropped back below the BoJ’s 2% target, declining from 2.1% in December to 1.6% January (vs 1.9% forecast). This was the lowest reading since March 2022. The decline was mainly driven by energy prices. Still, the core measure ex-fresh food and energy also slow to 3.1% from 3.5%. However, the picture on Japanese price trends is not unequivocal. National services PPI grew by 2.4% Y/Y in December, holding at the highest level since 2015. In the meantime, the Minutes of the BoJ December policy meeting revealed that policymakers considered it important for the MPC to deepen discussions on the timing of the exit from current monetary policy and on the appropriate pace of raising policy interest rates thereafter. However, there are still quite different views within the MPC on the path for monetary policy going forward. Some members indicated that the BoJ can maintain substantial monetary easing even after ending the negative policy rate and yield curve control. After jumping higher earlier this week, the 10y Japanese bond yield today eases slightly (0.72%). The yen is unchanged at USD/JPY 147.8.
Markets Price Higher Probability of ECB Rate Cut in April
In focus today
US December Private Consumption Expenditures (PCE) data will be released today. Strong holiday spending and modest inflation suggest that real consumption volume continued to grow at a solid pace. On the inflation side, consensus sees Core PCE inflation at +0.2% m/m SA (from +0.1%).
We will get the December release of Norwegian retail sales. Retail sales picked up in November partly due to some 'Black week'-effects. Still, it seems as Christmas shopping held up in December as well, so we expect retail sales rose 0.2 % m/m.
We will also get retail sales from Denmark.
A triplet of December data is out from Sweden this morning including the labour force survey, foreign trade balance and household lending. The first two will give important input to the development of Q4 GDP, the latter should add colour about lending growth but we doubt there will be any signs of acceleration yet.
We wish you a happy Friday and a good weekend!
Economic and market news
What happened overnight
From Japan, we got Tokyo CPI Ex-Fresh Foods for January. The figure fell from 2.1% in December to 1.6% in January, which was lower than market expectations at 1.9%. It is the first time in 20 months that the number is below 2%. Earlier this week the Bank of Japan (BOJ) governor Ueda signalled that monetary policy would be tightened this year. However, if inflation continues easing it would give BOJ incentive to move more cautiously.
What happened yesterday
ECB kept policy rates unchanged at yesterday's policy meeting in line with both ours and the market expectations. President Lagarde said that it was still too early to discuss rate cuts. On the other hand, she also sounded soft on inflation and wage pressures. Markets reacted by adding to rate cut expectations for the April meeting (23bp priced vs 16bp prior to the meeting). We stick to our call of the first rate cut in June, albeit highlighting our long-held risk bias for an April meeting cut, for more details see ECB review - Didn't rock the boat, but sailing towards a rate cut, 25 January
Norges Bank kept policy rates unchanged as expected on Thursday's policy meeting, which was fully in line with expectations. Norges Bank signalled that policy rates will likely be kept at that level for some time ahead. As expected, Norges Bank kept the door open to further hikes as the economic outlook is broadly unchanged relative to the last meeting in December. We expect NB to keep policy rates unchanged in March and deliver five rate cuts this year starting with the monetary policy meeting in June.
US flash GDP growth came in at 3.3% Q/Q (annualized) in Q4, markedly above consensus expectations at 2.0%. This marks another clear upside surprise on the US macro data front. Recent data releases (GDP, Retail Sales, PMIs) all suggest that the US economy remains in a solid state. US yields edged lower over the afternoon, likely reflecting other factors such as the dovish ECB signals and the uptick in weekly jobless claims (For more details see Research US - Fed preview: Patience & gradualism, 26 January.
The Central Bank of Turkey hiked its policy rate by 250bp to 45% as expected. The committee now assesses that the monetary tightness required to establish the disinflation course is achieved and that this level will be maintained as long as needed. Hence, we do not expect further rate hikes but rates will most likely remain high for some time.
German Ifo was weaker than expected in January like the PMIs yesterday. Current assessment fell to 87.0 (cons: 88.5, prior: 88.5) and expectations fell to 83.5 (cons: 84.8, prior: 84.2). The price expectations rose across services, manufacturing and namely retail.
Equities: Global equities were higher yesterday, with several indices in both Europe and the US closing near session highs. There was a lot of macro, monetary policy, and earnings information to digest, but the combination of a strong US GDP report and the absence of push-back to market pricing from Lagarde ended up setting the tone for equities. The negative standout was consumer cyclicals, which was dragged down by Tesla after disappointing earnings the day before. As a softer tone on the central reemerged and yields came lower, it boosted the appetite for small caps after a couple of weeks with large caps outperforming. In the US yesterday, Dow +0.6%, S&P 500 +0.5%, Nasdaq +0.2%, and Russell 2000 +0.7%. Asian markets are mostly lower this morning, with South Korea going against the trend. European futures are higher, while US ones are lower.
FI: European rates rallied from the front end, with 10y Bunds ending the day 7bp lower on the back of the ECB press conference. 10y Bunds reached 2.36% intraday before reacting to the ECB decisions and ended the day at 2.29%. Markets added 8bp of rate cuts to the end-2024 pricing, now pointing to 140bp this year.
FX: A dovish reading of the ECB decision and press conference pulled the EUR lower across the board including EUR/USD below 1.0850, EUR/JPY toward 160 and sent EUR/NOK and EUR/SEK closer to 11.30. Our long NOK/SEK trade from FX Top Trades 2024 breached parity and is 4.1% in the money. Meanwhile, EUR/DKK fell to 7.4550.