

Sample Category Title
Traders Trim ECB Rate Hike Bets for This Year (from 3 to 2)
Markets
ECB President Lagarde yesterday gave an update on the central bank’s views on the current oil price shock. She did so on the sidelines of the IMF/Worldbank annual meetings. Lagarde suggested that the economy currently develops between the ECB’s baseline scenario and the adverse scenario. The same conclusion could be drawn from a presentation delivered by ECB chief economist Lane for the University of Michigan. It shows oil price (current future curve) spiking somewhere between base and adverse, but the shock taking longer (2027 & 2028) to reverse than in both baseline & adverse. The current observed future curve for gas prices is almost spot on the ECB’s March baseline forecast. At its March ECB watcher conference, Lagarde differentiated the central bank’s response between “looking through” a short term (energy) supply shock, making measured and timely adjustments to a medium-term one and making profound changes in the severe scenario. Most ECB comments from the March meeting until now suggested being closer to the adverse one, requiring the measured adjustments. Lagarde thus didn’t go that far yesterday. She repeated that ECB policy is currently well-positioned. It’s too early to say if the ECB can look through higher inflation. It would even be a serious mistake if she already did so. Recall that the base scenario also worked with a Euribor forward curve where 1-2 rate hikes were embedded for 2026. While the ECB wouldn’t hesitate to act on the basis of data, it doesn’t hold a tightening bias. The specific reference to data dependence (April CPI inflation on April 30; same day as ECB meeting) and the recent relief on the energy market (following last week’s TACO) implies that the central bank is currently more erring on the side of wait-and-see for April. A big if remains of course. Just as markets embrace the current cease-fire, the tables can still turn over the next fortnight.
The combination of lower oil prices (prospect of 2nd round of talks between US & Iran; Brent from $99/b to $95/b) and the Lagarde comments triggered bull steepening of European interest rate curves as traders trimmed ECB rate hike bets for this year (from 3 to 2). German yields declined by 3.6 bps (30-yr) to 10.6 bps (2-yr). Changes on the UK Gilt curve were more or less similar with both outperforming US Treasuries. US yields shed 2.8 bps to 4.9 bps with the belly of the curve outperforming the wings. Lower oil prices created a bullish risk sentiment. The EuroStoxx50 gained 1.35% with daily moves in the US ranging between +0.66% (Dow) and +1.96% (Nasdaq). US equity benchmarks all trade back above pre-war levels. The combination of oil and risk sentiment hit the dollar with EUR/USD (1.1796 from 1.1759) equally moving back to the highest level since February. In slightly over a week time, markets went from pricing disaster to pricing an end to the war. The risk balance around that pricing equally shifted, this time leaving room for disappointment instead of hope. US President Trump is predicting “an amazing two days ahead”.
News & Views
US Treasury Secretary Scott Bessent at a Wall Street Journal event yesterday said that tariffs “could be back in place at the previous level by beginning of July.” President Trump’s trade policy suffered a setback after the Supreme Court struck down many of the levies in February, more specifically those introduced under the International Emergency Economic Powers Act (IEEPA) – aka the reciprocal tariffs. The US administration responded with a temporary 10% import duty with a different legal basis, which is due to expire July 24. The goal is to have by then IEEPA levies replicated by others via Section 301 investigations. The latter include probes into country’s industrial overcapacity and forced-labour practices.
For Bank of England policymaker Greene upside inflation risks following the energy price spike were “paramount” to her thinking. She said the danger of an economic slowdown is important but after being above target for the best part of five years and with the impact of previous shocks (Russian invasion) not having worn off even before the Iran war, she’s focused on the inflationary piece of the puzzle. Greene warned for waiting to have all the definitive data that showed there are second-round effects because that would mean the BoE is already to late in responding. Consumer inflation expectations have risen sharply in response to the war but Greene noted that business surveys offered more nuanced signals. UK money markets price a cumulative 35 bps hikes by the central bank this year, compared to the 85 bps seen in the first weeks after the conflict erupted.
US-Iran Talks to Resume as Blockade Continues
In focus today
Focus remains in the Middle East as the US' blockade of Iranian ports continues, while details regarding the implementation are scarce.
Overnight, China will release both Q1 GDP as well as the monthly batch of data for retail sales, housing, industrial production and investments. Especially housing and consumer data are in focus as these have been the weak spots of the economy. GDP growth is expected at 4.8% y/y up from 4.5% y/y in 2025 Q4 driven by strong export growth.
Economic and market news
What happened yesterday
In the Middle East, the US continued enforcing its blockade on traffic to and from Iranian ports via the Strait of Hormuz. The US‑sanctioned, Chinese tanker that appeared to have transited the strait yesterday made a U‑turn, apparently unwilling to challenge the blockade. In the first 24 hours of its blockade, the US military said no ships passed and six vessels turned back when ordered. Media reports suggest Iran may refrain from testing the blockade to smooth the path towards renewed talks. Last night, President Trump said talks to end the war could resume within two days; Iranian officials said discussions could continue this week, although a senior Iranian official noted no date has been set yet. It would be a surprise if the talks lead to a permanent ceasefire, with the most likely scenario being an extension of the current ceasefire, if the US and Iranian officials meet again over the weekend or early next week.
In the Oil market, Brent crude fell to USD95/bbl yesterday and thus back towards the lows from last week following the ceasefire announcement. The price drop comes despite further tightening of world oil supplies as the US blockade of the Strait of Hormuz keeps Iran's oil off the market together with the lost supplies from the rest of the Gulf. Rather the market seems optimistic that the resumption of talks between the US and Iran will lead to an eventual reopening of the strait and normalisation of the supply situation.
In the Euro Zone, Lagarde did not give any firm forward guidance signals other than ECB is data-dependent and ready to act. She mentioned that the ECB needs data to act, which speaks somewhat against action already in April, unless the important data releases clearly show significant upward price pressures. Lagarde also said that the euro area economy is somewhere between the "baseline" and "adverse" scenario. In our view the baseline scenario would lead ECB to "look through" the energy shock while "adverse" should cause two hikes.
In the US, March PPI surprised to the downside with an increase of 0.5% m/m SA (Feb: 0.5%, cons: 1.1%). Goods prices jumped 1.6% m/m, driven by energy up 8.5% m/m, partly offset by food down 0.3% m/m. Given that it was the first full month covering the period with war in Iran it was a positive that the PPI did not increase even further. Despite the lower‑than‑expected PPI, it did not shift expectations for near‑term cuts from Fed, with markets pricing roughly a one‑in‑three chance of a rate cut this year.
The US NFIB small business optimism index for March came out weak, falling below its historical average of 98.0 to 95.8 in March, down from 98.8 in February. NFIB wrote that "the dramatic spike in oil prices has spooked consumers and owners alike". Hiring plans and the number of job openings that companies were unable to fill continued its downward trend from February, indicating potential signs of an easing labour market.
In Sweden, final inflation figures confirmed the flash estimate, showing declines in food, energy and services. While we expected firms to start lowering food prices ahead of the reduced VAT effective April, the effect was larger than initially anticipated. The larger decline in energy is attributed to a steeper fall in electricity prices of -19% m/m due to mild March weather (forecast: -14% m/m), while fuel prices surged, as expected.
Equities: The equity rally continued Tuesday, with most indices up about 1%. This takes MSCI World above the pre-war levels, although valuation is significantly lower due to large positive earnings revisions that have taken place since.
Growth stocks and cyclicals outperformed meaningfully yesterday. Global growth stocks beat value by more than 1pp, cyclicals beat defensives by roughly the same. This takes growth stocks 3pp ahead of value stocks over the last seven days. Normally, US would outperform European and Nordic markets in this setup - and it did, somewhat - but what is different this time around is that Europe is more exposed to Iran through energy prices. Hence, the peace trade is stronger in Europe and Nordics, which offset the cyclical growth stock preference. Normally, global large caps would also outperform small caps in this setup due to the US tech giants. However, small caps held up well in the rally yesterday, with Russell 2000 even ahead of S&P 500 and Nordic small caps meaningfully as well. US and European futures are little changed this morning.
FI and FX: The risk sentiment was supported yesterday by hopes of a new round of peace talks between the US and Iran. Oil prices dropped another 3-4%, which helped pull global yields a couple of basis points lower - UST10y at 4.25% and the Bund at 3.02% this morning. Treasuries were also supported by soft US PPI data. EUR/USD rose for a seventh day consecutive day, starting today's European session just below 1.18. EUR/NOK edged higher amid lower oil while EUR/SEK rose as well, despite improved risk appetite. The Swedish rates and FX have their eyes on Origo's inflation expectations report at 08:00 CET.
USD/CHF Daily Outlook
Daily Pivots: (S1) 0.7785; (P) 0.7814; (R1) 0.7838; More….
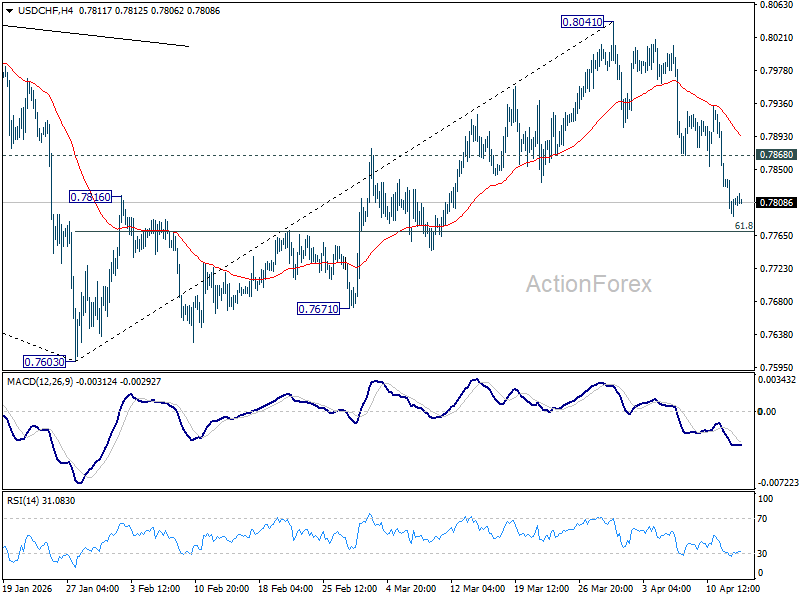
Intraday bias in USD/CHF remains on the downside at this point. Fall from 0.8041 is in progress for 61.8% retracement of 0.7603 to 0.8041 at 0.7770. Decisive break there will target a retest on 0.7603 low. On the upside, above 0.7868 minor resistance will turn intraday bias neutral first.
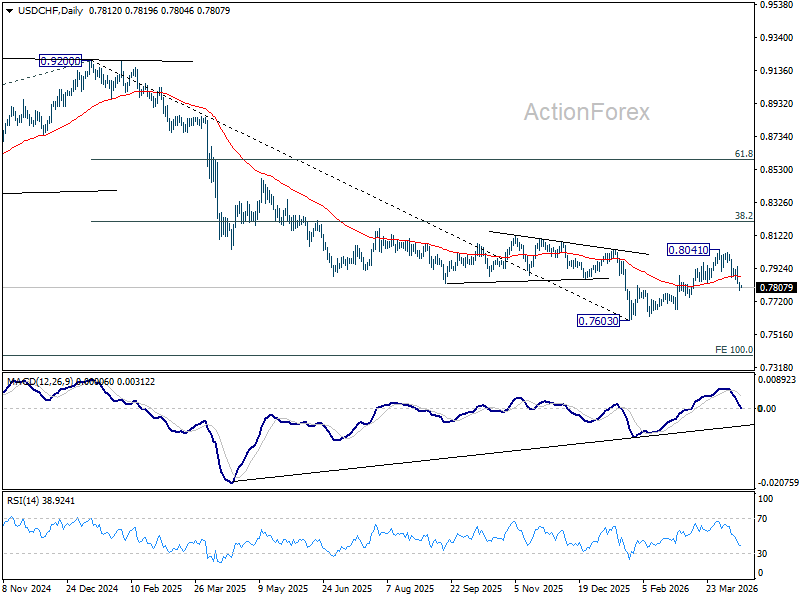
In the bigger picture, rebound from 0.7603 medium term bottom is seen as correcting the fall from 0.9200 only. Rejection by 55 W EMA (now at 0.8071) will affirm this bearish case, and setup down trend resumption to 100% projection of 1.0146 (2022 high) to 0.8332 from 0.9200 at 0.7382 at a later stage. Though, sustained break of 55 W EMA will suggest that it's probably correcting the larger scale down trend from 1.0146 (2022 high).
Dollar Stays Weak as Trump Pivots from ‘Maximum Pressure’ to ‘Reconstruction Mode’ in Iran
The war premium is fading—and with it, the Dollar’s support. The greenback stayed under pressure in Asian session as oil prices retreated on renewed optimism that US-Iran talks could resume within the next two days. More importantly, markets are picking up on a subtle but meaningful shift in US strategy, with President Donald Trump’s latest remarks suggesting negotiations could move directly toward a deal, even without extending the current ceasefire.
“It could end either way, but I think a deal is preferable because then they can rebuild,” he said, adding that “we took out the radicals.” The messaging points to a transition from a “maximum pressure” stance toward what can be interpreted as a "reconstruction-focused" approach, where the objective shifts from coercion to settlement.
However, the refusal to extend the ceasefire is a double-edged sword—it signals confidence that a deal is close, but also creates a hard deadline that could quickly reintroduce volatility if talks fail to deliver.
Meanwhile, the broader macro debate remains unsettled. The International Monetary Fund has highlighted the risk of slower growth and higher inflation stemming from the Middle East conflict, warning of significant downside risks to the global economy. In contrast, US Treasury Secretary Scott Bessent pushed back against the more pessimistic global outlook, dismissing the IMF’s warnings of slower growth and higher inflation as an “overreaction.”
Speaking to reporters, he argued that while energy prices may rise in the near term, the US economy is well positioned to absorb the shock. “I think that they probably overreacted, but we’ll see,” he said, signaling confidence that inflation pressures would not become entrenched.
Bessent drew a clear distinction between the US and other major economies. He suggested that countries in Europe and Asia are more likely to rely on consumer or industrial subsidies to cushion the impact of higher energy costs—policies he views as counterproductive. In his view, such interventions risk prolonging inflation by keeping prices artificially elevated while also increasing government borrowing, effectively embedding inflationary pressures for longer.
However, Bessent's confidence hinges heavily on the geopolitical outcome. If negotiations fail and the ceasefire expires without a deal, the war premium could return sharply to energy markets, potentially validating the IMF’s more cautious scenario of persistent inflation and weaker growth.
Another key development—largely flying under the radar—is the rollout of the CAPE system for tariff refunds next Monday. US authorities confirmed that the system is ready to begin issuing refunds totaling around USD 166B to American importers, following the Supreme Court’s decision to strike down the tariffs as unlawful.
This represents a sizable and unexpected liquidity injection. For businesses, the refunds improve cash flow and balance sheet flexibility at a time when input costs remain volatile. In macro terms, it functions as a stealth stimulus, supporting demand without requiring new fiscal legislation.
The timing is particularly important. As geopolitical risks and energy price swings cloud the outlook, the CAPE-driven cash injection could help cushion the domestic economy. It also reinforces the narrative that the US may be better positioned than its peers to absorb external shocks.
In the currency markets, Dollar remains the worst performer for the week so far, followed by Yen, and then Loonie. Kiwi is the best, followed by Aussie, and then Swiss Franc. Euro and Sterling are positioning in the middle.
In Asia, at the time of writing, Nikkei is up 0.33%. Hong Kong HSI is up 0.41%. China Shanghai SSE is up 0.26%. Singapore Strait Times is up 0.28%. Japan 10-year JGB yield is down -0.012 at 2.408. Overnight, DOW rose 0.66%. S&P 500 rose 1.18%. NASDAQ rose 1.96%. 10-year yield fell -0.041 to 4.256.
WTI Drops Below $90, $80 Next If US-Iran Talks Deliver ‘Bridge Deal’
WTI has slipped below $90 as markets bet a second round of US-Iran talks could deliver a ceasefire extension or even a “bridge deal,” paving the way toward $80. With the war premium unwinding, traders are front-running a path to de-escalation rather than waiting for confirmation. Read more.
USD/CHF Daily Outlook
Daily Pivots: (S1) 0.7785; (P) 0.7814; (R1) 0.7838; More….
Intraday bias in USD/CHF remains on the downside at this point. Fall from 0.8041 is in progress for 61.8% retracement of 0.7603 to 0.8041 at 0.7770. Decisive break there will target a retest on 0.7603 low. On the upside, above 0.7868 minor resistance will turn intraday bias neutral first.
In the bigger picture, rebound from 0.7603 medium term bottom is seen as correcting the fall from 0.9200 only. Rejection by 55 W EMA (now at 0.8071) will affirm this bearish case, and setup down trend resumption to 100% projection of 1.0146 (2022 high) to 0.8332 from 0.9200 at 0.7382 at a later stage. Though, sustained break of 55 W EMA will suggest that it's probably correcting the larger scale down trend from 1.0146 (2022 high).
Elliott Wave Signals Silver (XAGUSD) Recovery Path to $89
Silver (XAGUSD) rallied to $121.6 on January 29 before entering a sharp decline that reached $60.87. We identified that decline as wave (IV) in the Super Cycle degree, and the broader structure continues to support a constructive long‑term outlook. The metal has begun to recover from the wave (IV) low, and the next important test is a break above the wave (III) all‑time high at $121.6. A clean break would remove the risk of a double correction and confirm that a new cycle is underway.
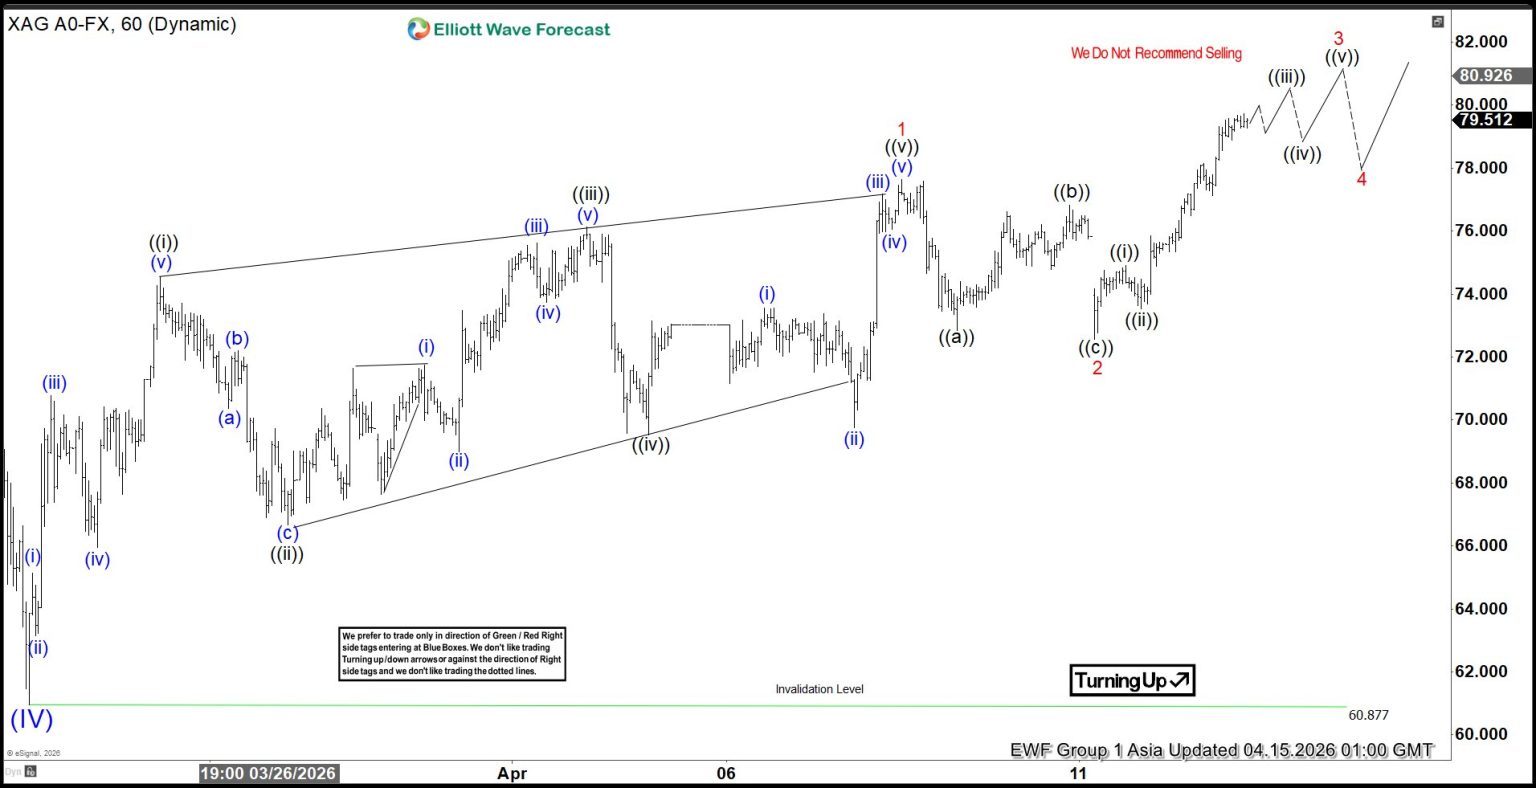
From the wave (IV) low, wave 1 formed a leading diagonal and finished at $77.63. Wave 2 then retraced to $72.57 before the metal turned higher again in wave 3. The current structure suggests that one more push is needed to complete wave 3. After that advance, a wave 4 pullback should develop to correct the cycle from the April 13, 2026 low. A final rise in wave 5 would then complete wave (1) at the higher degree.
Once wave (1) ends, a broader wave (2) decline should unfold to correct the entire advance from the March 23, 2026 wave (IV) low. That retracement will set the base for the next sustained bullish phase. In the near term, the $60.87 pivot remains the key support. As long as it holds, any pullback should attract buyers in a three‑ or seven‑swing sequence. The next upside objective aligns with the 100% Fibonacci extension of wave 1 at $89.
Silver (XAGUSD) 60-Minute Elliott Wave Chart
XAGUSD Elliott Wave Video:
https://www.youtube.com/watch?v=ybHcOiL5tdc
WTI Oil Drops Below $90, $80 Next If US-Iran Talks Deliver ‘Bridge Deal’
WTI crude briefly slipped below the $90 mark as a fresh wave of diplomatic optimism swept energy markets, after US President Donald Trump signaled that a second round of talks in Islamabad could take place “over the next two days,” according to the New York Post. The move reflects a rapid unwind of the war premium, with markets increasingly anticipating that the next meeting could deliver a ceasefire extension—or even a “bridge deal” that charts a path toward de-escalation.
The next 48 hours are critical. With the ceasefire expiring in just one week, this second round of talks is seen as decisive. Without progress, markets risk snapping back into escalation mode. But for now, the bias is toward a negotiated extension.
Crucially, traders are not betting on a full resolution yet, but on a “bridge deal.” The working assumption is that both sides will compromise on the uranium enrichment dispute, splitting the gap between Washington’s proposed 20-year freeze and Tehran’s 5-year counteroffer.
At the same time, the reality of the Hormuz situation is being reassessed. Despite strong rhetoric, the blockade has not resulted in a full disruption of global supply. Instead, it is being viewed as a calibrated tool—one that increases pressure without triggering immediate escalation.
Another factor supporting optimism is the role of Pakistan’s Field Marshal Asim Munir. Trump’s explicit praise of Munir has reinforced the perception that the next round of talks could be more structured and outcome-oriented. his has helped reinforce confidence that a technical compromise is achievable.
If a bridge deal materializes—potentially alongside a 45-day ceasefire extension—the implication is clear: oil moves lower. Such an outcome would significantly reduce the probability of supply disruption, allowing WTI to drift toward the $80 level. Importantly, $80 is not “peace pricing,” but rather reduced war premium pricing.
| Scenario | Description | WTI Outlook | Market Interpretation |
|---|---|---|---|
| Escalation | Talks fail, blockade tightens | $95–110+ | War premium rebuilds |
| Ceasefire Extension | Temporary delay, no deal | $88–95 | Partial premium remains |
| Bridge Deal | Compromise reached, talks continue | $80–85 | Majority of premium removed |
| Full Resolution | Structural de-escalation | $70–75 | Near full normalization |
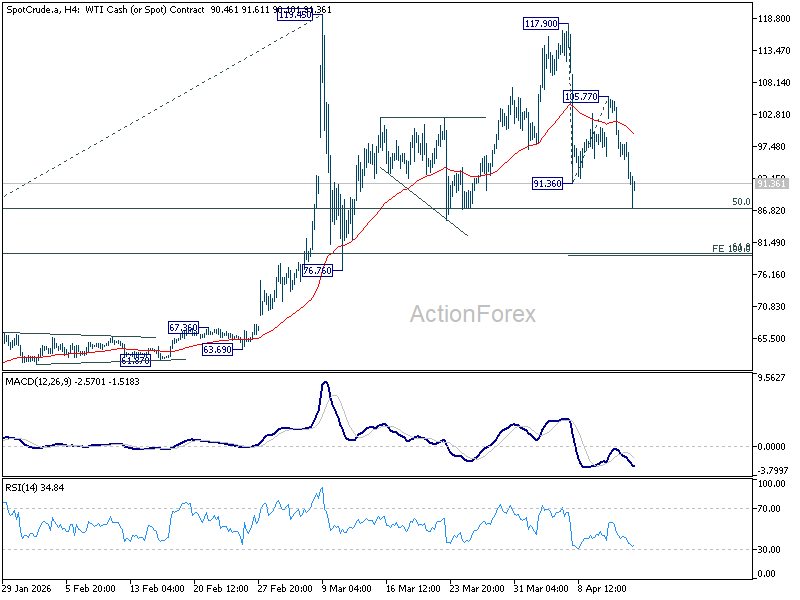
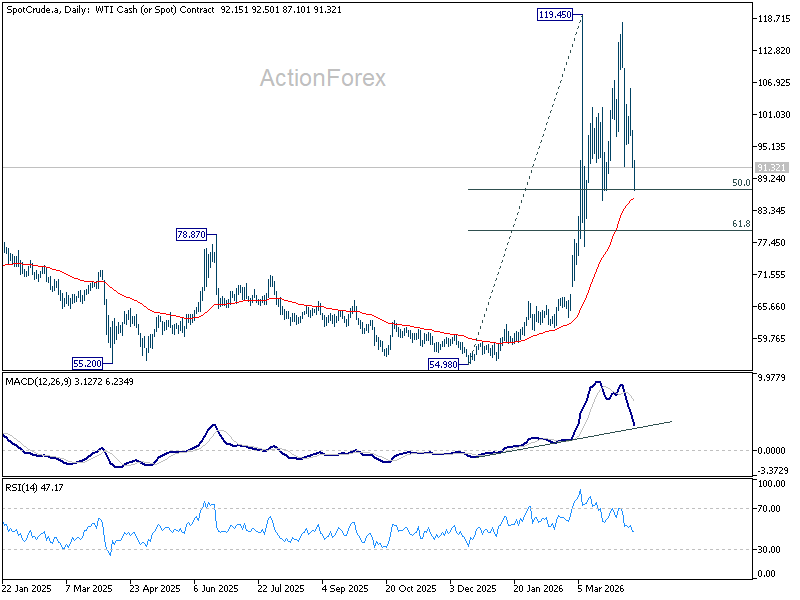
Technically, WTI crude's fall from 117.90 resumed by breaking through 91.36, but halted just before 50% retracement of 54.98 to 119.45 at 87.21. Further decline is in favor in the near term as long as 55 4H EMA (now at 99.52) holds. Firm break of 87.21 will pave the way to 80, which is slightly above 61.8% retracement at 79.60, 100% projection of 117.90 to 91.36 from 105.77 at 79.23
Bitcoin Rally Accelerates, Bulls Push for Higher Levels
Key Highlights
- Bitcoin started a steady increase above $70,000 and $73,500.
- A bullish trend line is forming with support at $72,650 on the 4-hour chart of BTC/USD.
- Ethereum also climbed over 10% and surpassed $2,350.
- Gold is grinding higher toward the $4,950 resistance.
Bitcoin Price Technical Analysis
Bitcoin price remained supported above $68,000 against the US Dollar. BTC formed a base and started a recovery wave above $70,000.
Looking at the 4-hour chart, the price settled above $71,200, the 100 simple moving average (red, 4-hour), and the 200 simple moving average (green, 4-hour). The bulls even pumped the price above $75,000.
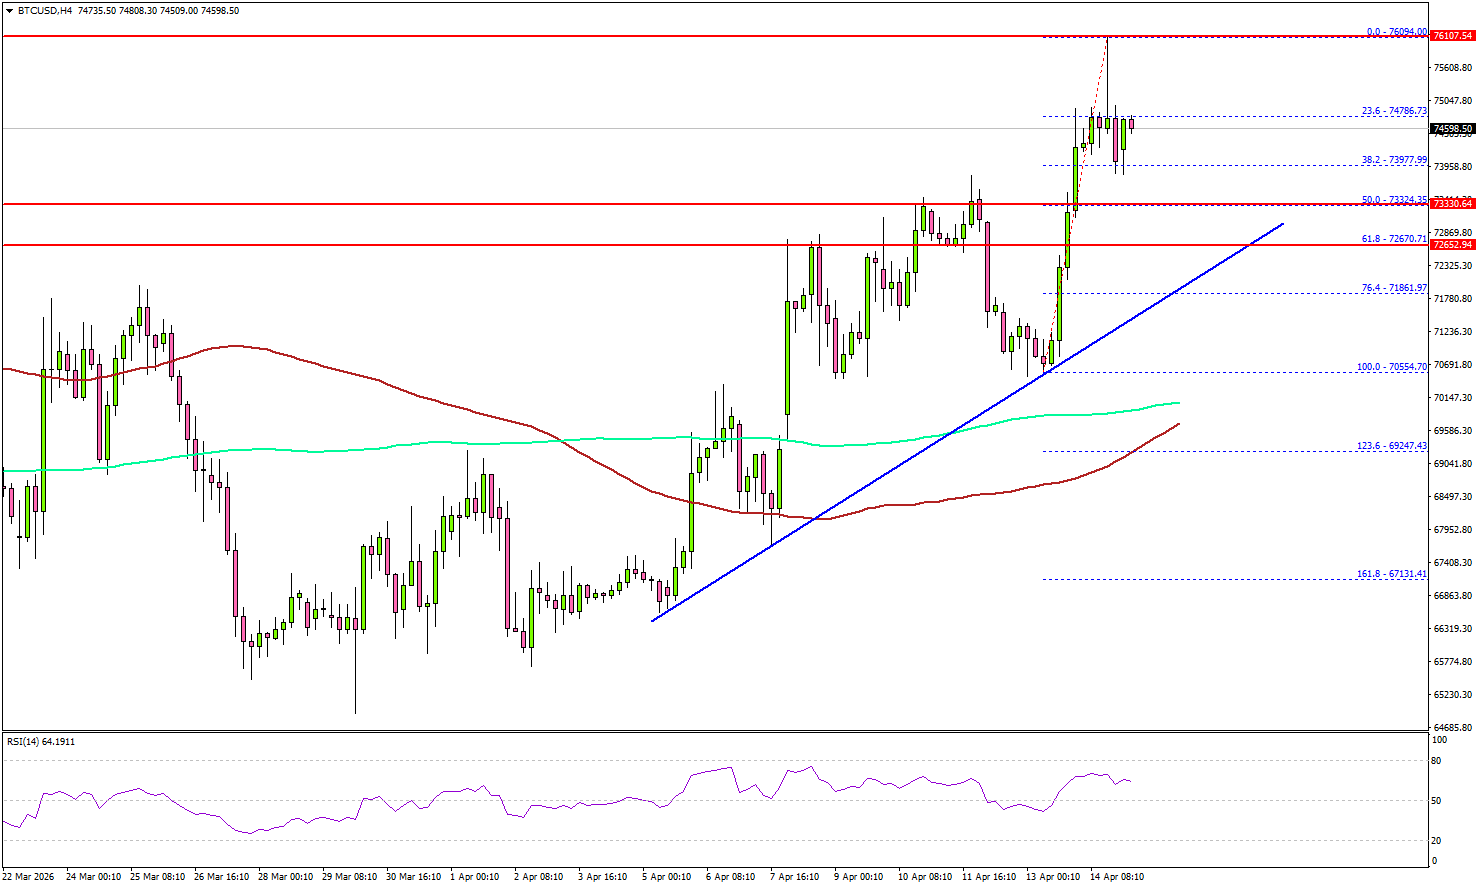
A high was formed at $76,094, and the price started a consolidation. Immediate support sits at $74,000 and the 38.2% Fib retracement level of the upward move from the $70,554 swing low to the $76,094 high.
The first key support could be $73,350. The main breakdown support could be near $72,500. There is also a bullish trend line forming with support at $72,650 and the 76.4% Fib retracement level of the upward move from the $70,554 swing low to the $76,094 high.
A downside break below $70,650 might start another decline. The next major support is $71,200, below which BTC could decline toward $70,000.
On the upside, the price now faces resistance near $76,000. The first key hurdle is $76,500. A close above $76,500 could send the price toward $78,000. Any more gains might call for a test of $80,000.
Looking at Ethereum, the price also gained bullish momentum above $2,300, and the bulls could now aim for a move toward $2,500.
Today’s Key Economic Releases
- US Import Price Index for March 2026 (MoM) – Forecast +2.0%, versus +1.3% previous.
- NY Empire State Manufacturing Index for April 2026 – Forecast -0.5, versus -0.2 previous.
FX Levels for EUR/USD, USD/CAD & GBP/USD – USD Dumps Amid Peace Repricing
The US Dollar may have just seen its brightest days at the cost of a world-shaking US-Iran-Israel conflict.
Having bullied through a gigantic rebound since February, the Greenback had been invincible. Petrodollar trades and higher-for-longer US rates tend to largely support the global reserve currency.
Add to it historic bearish positioning against it, and traders saw the perfect conditions to push the USD to 11-month highs.
This was enough to question whether dedollarization was just a fantasy, rather than a proper regime change in Financial Markets.
Nevertheless, things changed in the past couple of weeks. President Trump, frustrated by developments such as lower stock markets, higher commodity prices, and a more expensive dollar—economic trends he publicly dislikes—found himself in a pessimistic mood right ahead of the November midterm elections.
Hence, the Administration has been pushing aggressively for a truce, specifically because this aligns with the prolonged mid-April deadline for the conflict to end.
While a proper peace deal hasn't yet been reached, diplomatic attempts are, for now, heading the right way, leading to a consequent tumble in the US Dollar.
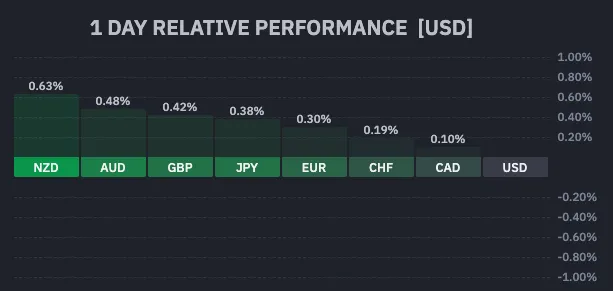
Daily FX performance against the US Dollar – Courtesy of Finviz (April 14, 2026)
You can see the direct result from today's FX performance.
The US Dollar lost around 2% of its value against a basket of major currencies and has begun to revert to its trajectory.
Reaching a key support level, however, Currency traders could be taking a break from their dollar sales. We will explore key levels right after taking a quick look at the Dollar Index chart.
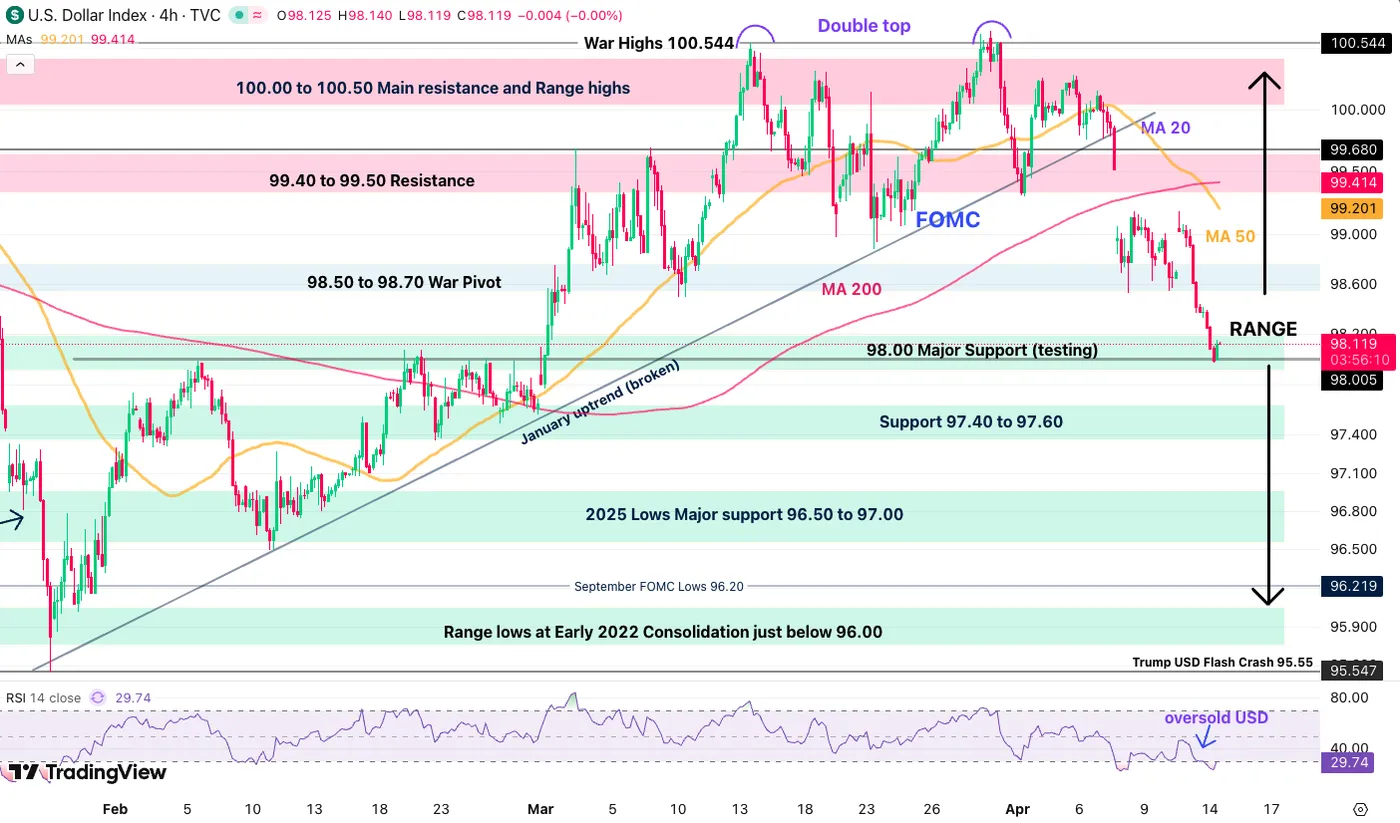
Dollar Index (DXY) 4H Chart. April 14, 2026 – Source: TradingView
Stalling at the major 98.00 Support, the US Dollar could be seeing a short-term pause in its selling; hence, it is important not to get caught in the crosswinds of a potential reversal.
However, this could provide opportunities to catch a pullback in the currency and offer decent setups in major FX pairs!
In preparation for the next phase of a longer-run dollar selloff (conditional on the conflict really coming to an end), we will look at three key FX Majors and their intraday timeframes to see how the range in the Dollar Index affects their own currency pairs: EUR/USD, GBP/USD, and USD/CAD.
EUR/USD 4H Chart and Technical Levels
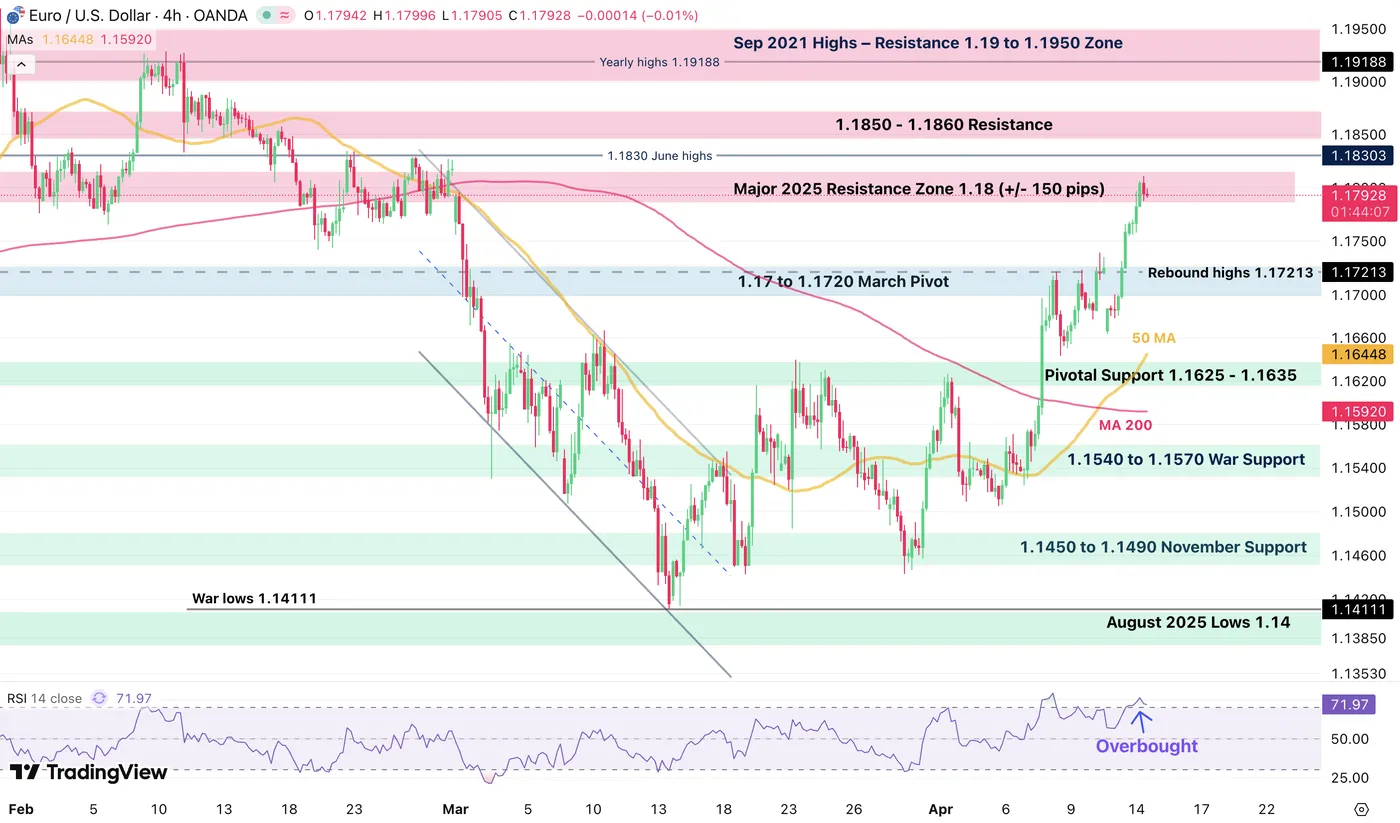
EUR/USD 4H Chart. April 14, 2026– Source: TradingView
EUR/USD quickly profited from the truce to rally 2,000 to 1.18.
However, meeting a significant resistance zone and overbought RSI conditions, the odds for upside continuation from here a slim (on the short-run).
In such conditions, buying on a pullback makes the most sense.
- Aggressive buyers could look at 1.1750 for entries (less optimal)
- The best setup would be located at the 1.17 to 1.1720 March Pivot
- This would require the peace process to keep progressing.
- Aggressive sellers could look to enter at current levels and will want to see a break below 1.17 to add to their positions (in the event of worsening fundamentals)
Levels of interest for EUR/USD Trading
Resistance levels
- Resistance Zone around 1.18 (+/- 150 pips)
- 1.1850 - 1.1860 Resistance
- Morning highs 1.18114
- Sep 2021 Highs – Resistance 1.19 to 1.1950 Zone
Support levels
1.17 to 1.1720 March Pivot
- Pivotal Support 1.1625 - 1.1635
- 1.1540 to 1.1570 War Support
- War and August 2025 Lows 1.14
USD/CAD 4H Chart and Technical Levels
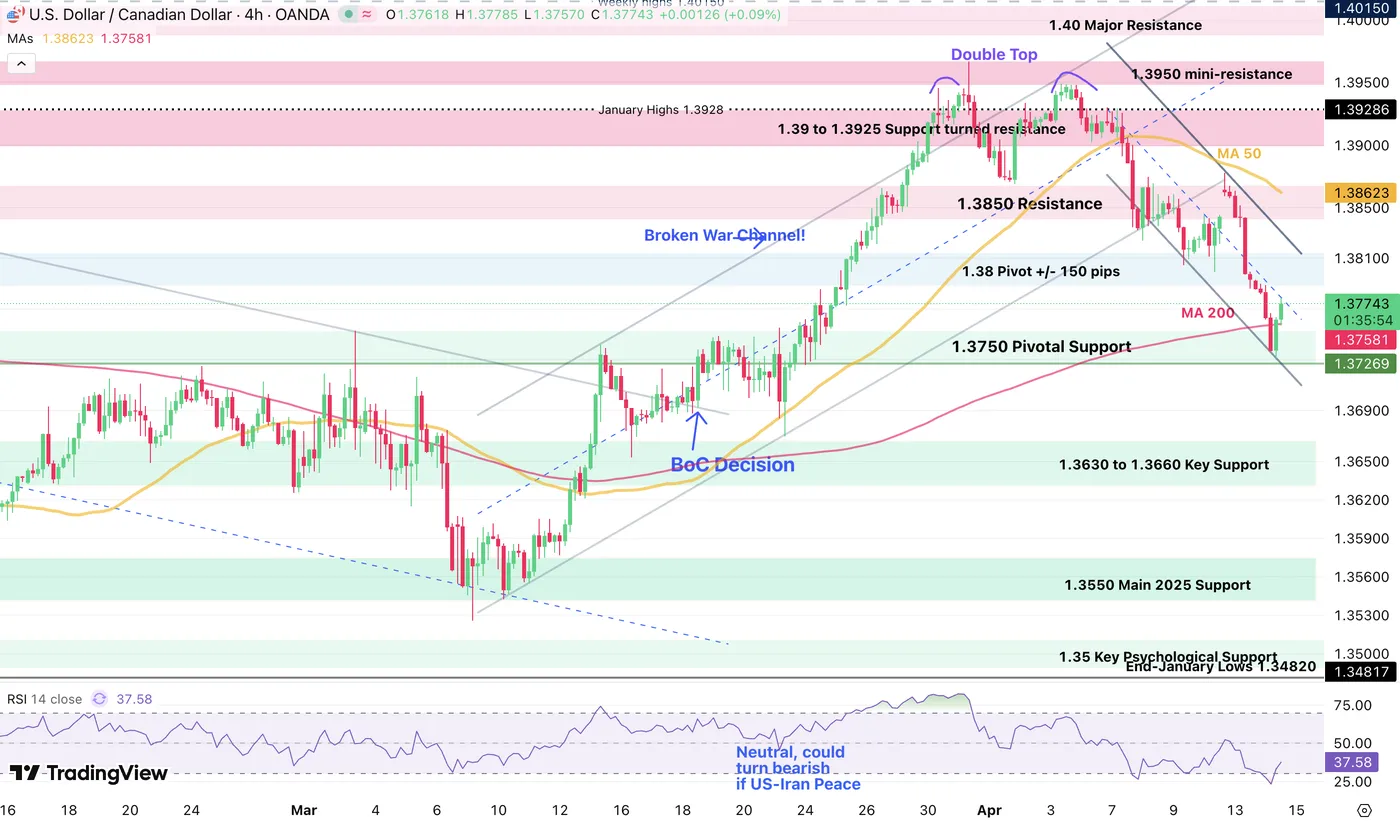
USD/CAD 4H Chart. April 14, 2026– Source: TradingView
USD/CAD had taken quite a lead on its reversal from the higher-part of its 1.3550 to 1.3950 range.
Finding buyers at the 1.3750 Pivotal support, the pair already begun its pullback, hence it could be wise to wait for a retest of the higher bound of the 1.38 pivot zone and bear channel (1.3810) to enter shorts.
Coming back above the 4H 50-period MA (1.3862) would put back the advantage to the bulls.
Levels of interest for USD/CAD Trading
Resistance Levels
- 1.38 Pivot +/- 150 pips
- 1.3850 Resistance
- 1.39 to 1.3925 Support turned resistance
- 1.3950 Range Highs
Support Levels
- 1.3750 Pivotal Support
- 1.3630 to 1.3660 Key Support
- 1.3550 Main 2025 Support
- 1.35 Key Psychological Support
GBP/USD 4H Chart and Technical Levels
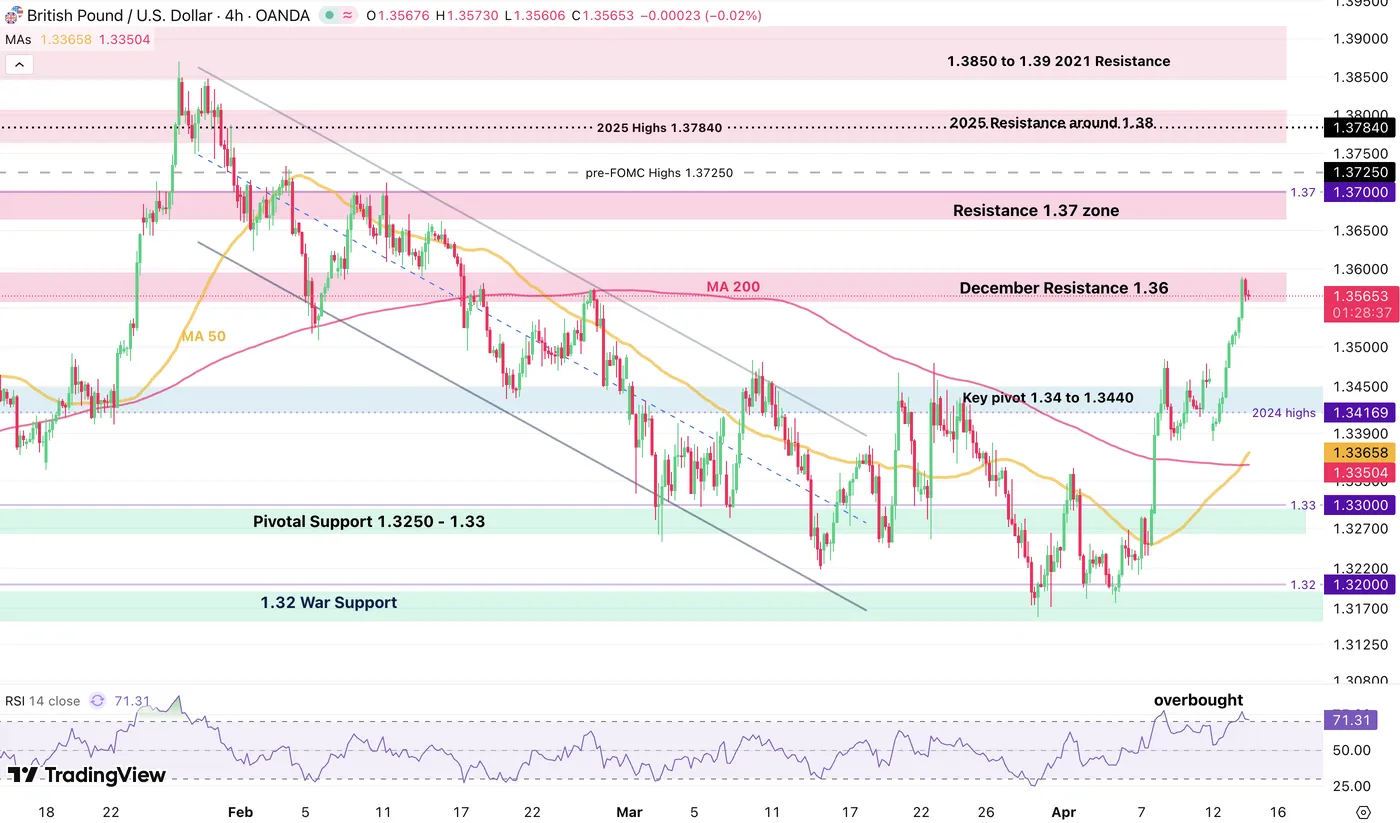
GBP/USD 4H Chart. April 14, 2026 – Source: TradingView
The Pound is under similar conditions as the Euro but grabs the upper hand in terms of strength and momentum against the US Dollar.
GBP/USD is reaching overbought conditions and could see a decent support retest in coming times after extending without pullbacks.
Aggressive buyers will look at the 1.3500 psychological level to catch a wider rally in the pair.
More defensive pullback traders will have to wait for a retest of the key pivot, which would only be reached if the tone sours ahead of Thursday's US-Iran talks.
Levels of interest for USD/CHF Trading
Resistance levels
- December Resistance 1.36 (testing)
- Resistance 1.37 zone
- 2025 Resistance around 1.38
- 1.3850 to 1.39 2021 Resistance
Support levels
- 1.35 minor support
- Key Pivot and Support 1.34 to 1.3440
- Pivotal Support 1.3250 - 1.33
- 1.32 War Support
Safe Trades!
Eco Data 4/15/26
| GMT | Ccy | Events | Act | Cons | Prev | Rev |
|---|---|---|---|---|---|---|
| 23:50 | JPY | Machinery Orders M/M Feb | 13.60% | -1.10% | -5.50% | |
| 09:00 | EUR | Eurozone Industrial Production M/M Feb | 0.40% | 0.20% | -1.50% | -0.80% |
| 12:30 | CAD | Manufacturing Sales M/M Feb | 3.60% | 3.80% | -3.00% | |
| 12:30 | CAD | Wholesale Sales M/M Feb | 2.00% | 0.20% | -1.00% | |
| 12:30 | USD | Empire State Manufacturing Apr | 11 | 0.5 | -0.2 | |
| 12:30 | USD | Import Price Index M/M Mar | 0.80% | 0.80% | 1.30% | |
| 14:00 | USD | NAHB Housing Market Index Apr | 34 | 37 | 38 | |
| 14:30 | USD | Crude Oil Inventories (Apr 10) | 2.1M | 3.1M | ||
| 18:00 | USD | Fed's Beige Book |
| 23:50 | JPY |
| Machinery Orders M/M Feb | |
| Actual | 13.60% |
| Consensus | -1.10% |
| Previous | -5.50% |
| 09:00 | EUR |
| Eurozone Industrial Production M/M Feb | |
| Actual | 0.40% |
| Consensus | 0.20% |
| Previous | -1.50% |
| Revised | -0.80% |
| 12:30 | CAD |
| Manufacturing Sales M/M Feb | |
| Actual | 3.60% |
| Consensus | 3.80% |
| Previous | -3.00% |
| 12:30 | CAD |
| Wholesale Sales M/M Feb | |
| Actual | 2.00% |
| Consensus | 0.20% |
| Previous | -1.00% |
| 12:30 | USD |
| Empire State Manufacturing Apr | |
| Actual | 11 |
| Consensus | 0.5 |
| Previous | -0.2 |
| 12:30 | USD |
| Import Price Index M/M Mar | |
| Actual | 0.80% |
| Consensus | 0.80% |
| Previous | 1.30% |
| 14:00 | USD |
| NAHB Housing Market Index Apr | |
| Actual | 34 |
| Consensus | 37 |
| Previous | 38 |
| 14:30 | USD |
| Crude Oil Inventories (Apr 10) | |
| Actual | |
| Consensus | 2.1M |
| Previous | 3.1M |
| 18:00 | USD |
| Fed's Beige Book | |
| Actual | |
| Consensus | |
| Previous | |
Lagarde Says Too Early to Call ECB Rate Path Despite Energy Surge
ECB President Christine Lagarde pushed back against rising market expectations for near-term rate hikes, signaling caution despite the energy shock from the Middle East conflict. Investors have increasingly priced the risk of tightening as the closure of the Strait of Hormuz drives fuel costs higher in the energy-importing Eurozone, but Lagarde made clear it is too early to draw firm policy conclusions.
Speaking to Bloomberg TV, Lagarde emphasized the high level of uncertainty and rejected attempts to lock in a policy path. “It doesn't predicate that we'll go in one direction or the other,” she said, adding that the current situation “certainly does not determine a rate path” at this stage. She also cautioned against overconfidence, noting that colleagues predicting a specific outcome “don't know, honestly.”
The ECB’s latest projections underscore the dilemma. While the baseline assumes the impact of the Iran war will be short-lived, alternative scenarios point to more persistent risks. In the adverse case, higher energy prices and broader spillovers could push inflation significantly higher, with the most extreme scenario seeing inflation reach 4.8% next year. Lagarde said the economy is currently “between the baseline and the adverse”.