Sample Category Title
IMF Warns Oil Could Average $125 in Severe Scenario as War Shock Persists
The IMF has warned that the global economy faces a more prolonged and damaging shock if the Middle East conflict escalates, with oil prices potentially averaging as high as $125 in 2027 under a severe scenario. Crucially, this is not a short-lived spike but a sustained high-price environment, implying persistent inflation pressure and a more challenging policy backdrop.
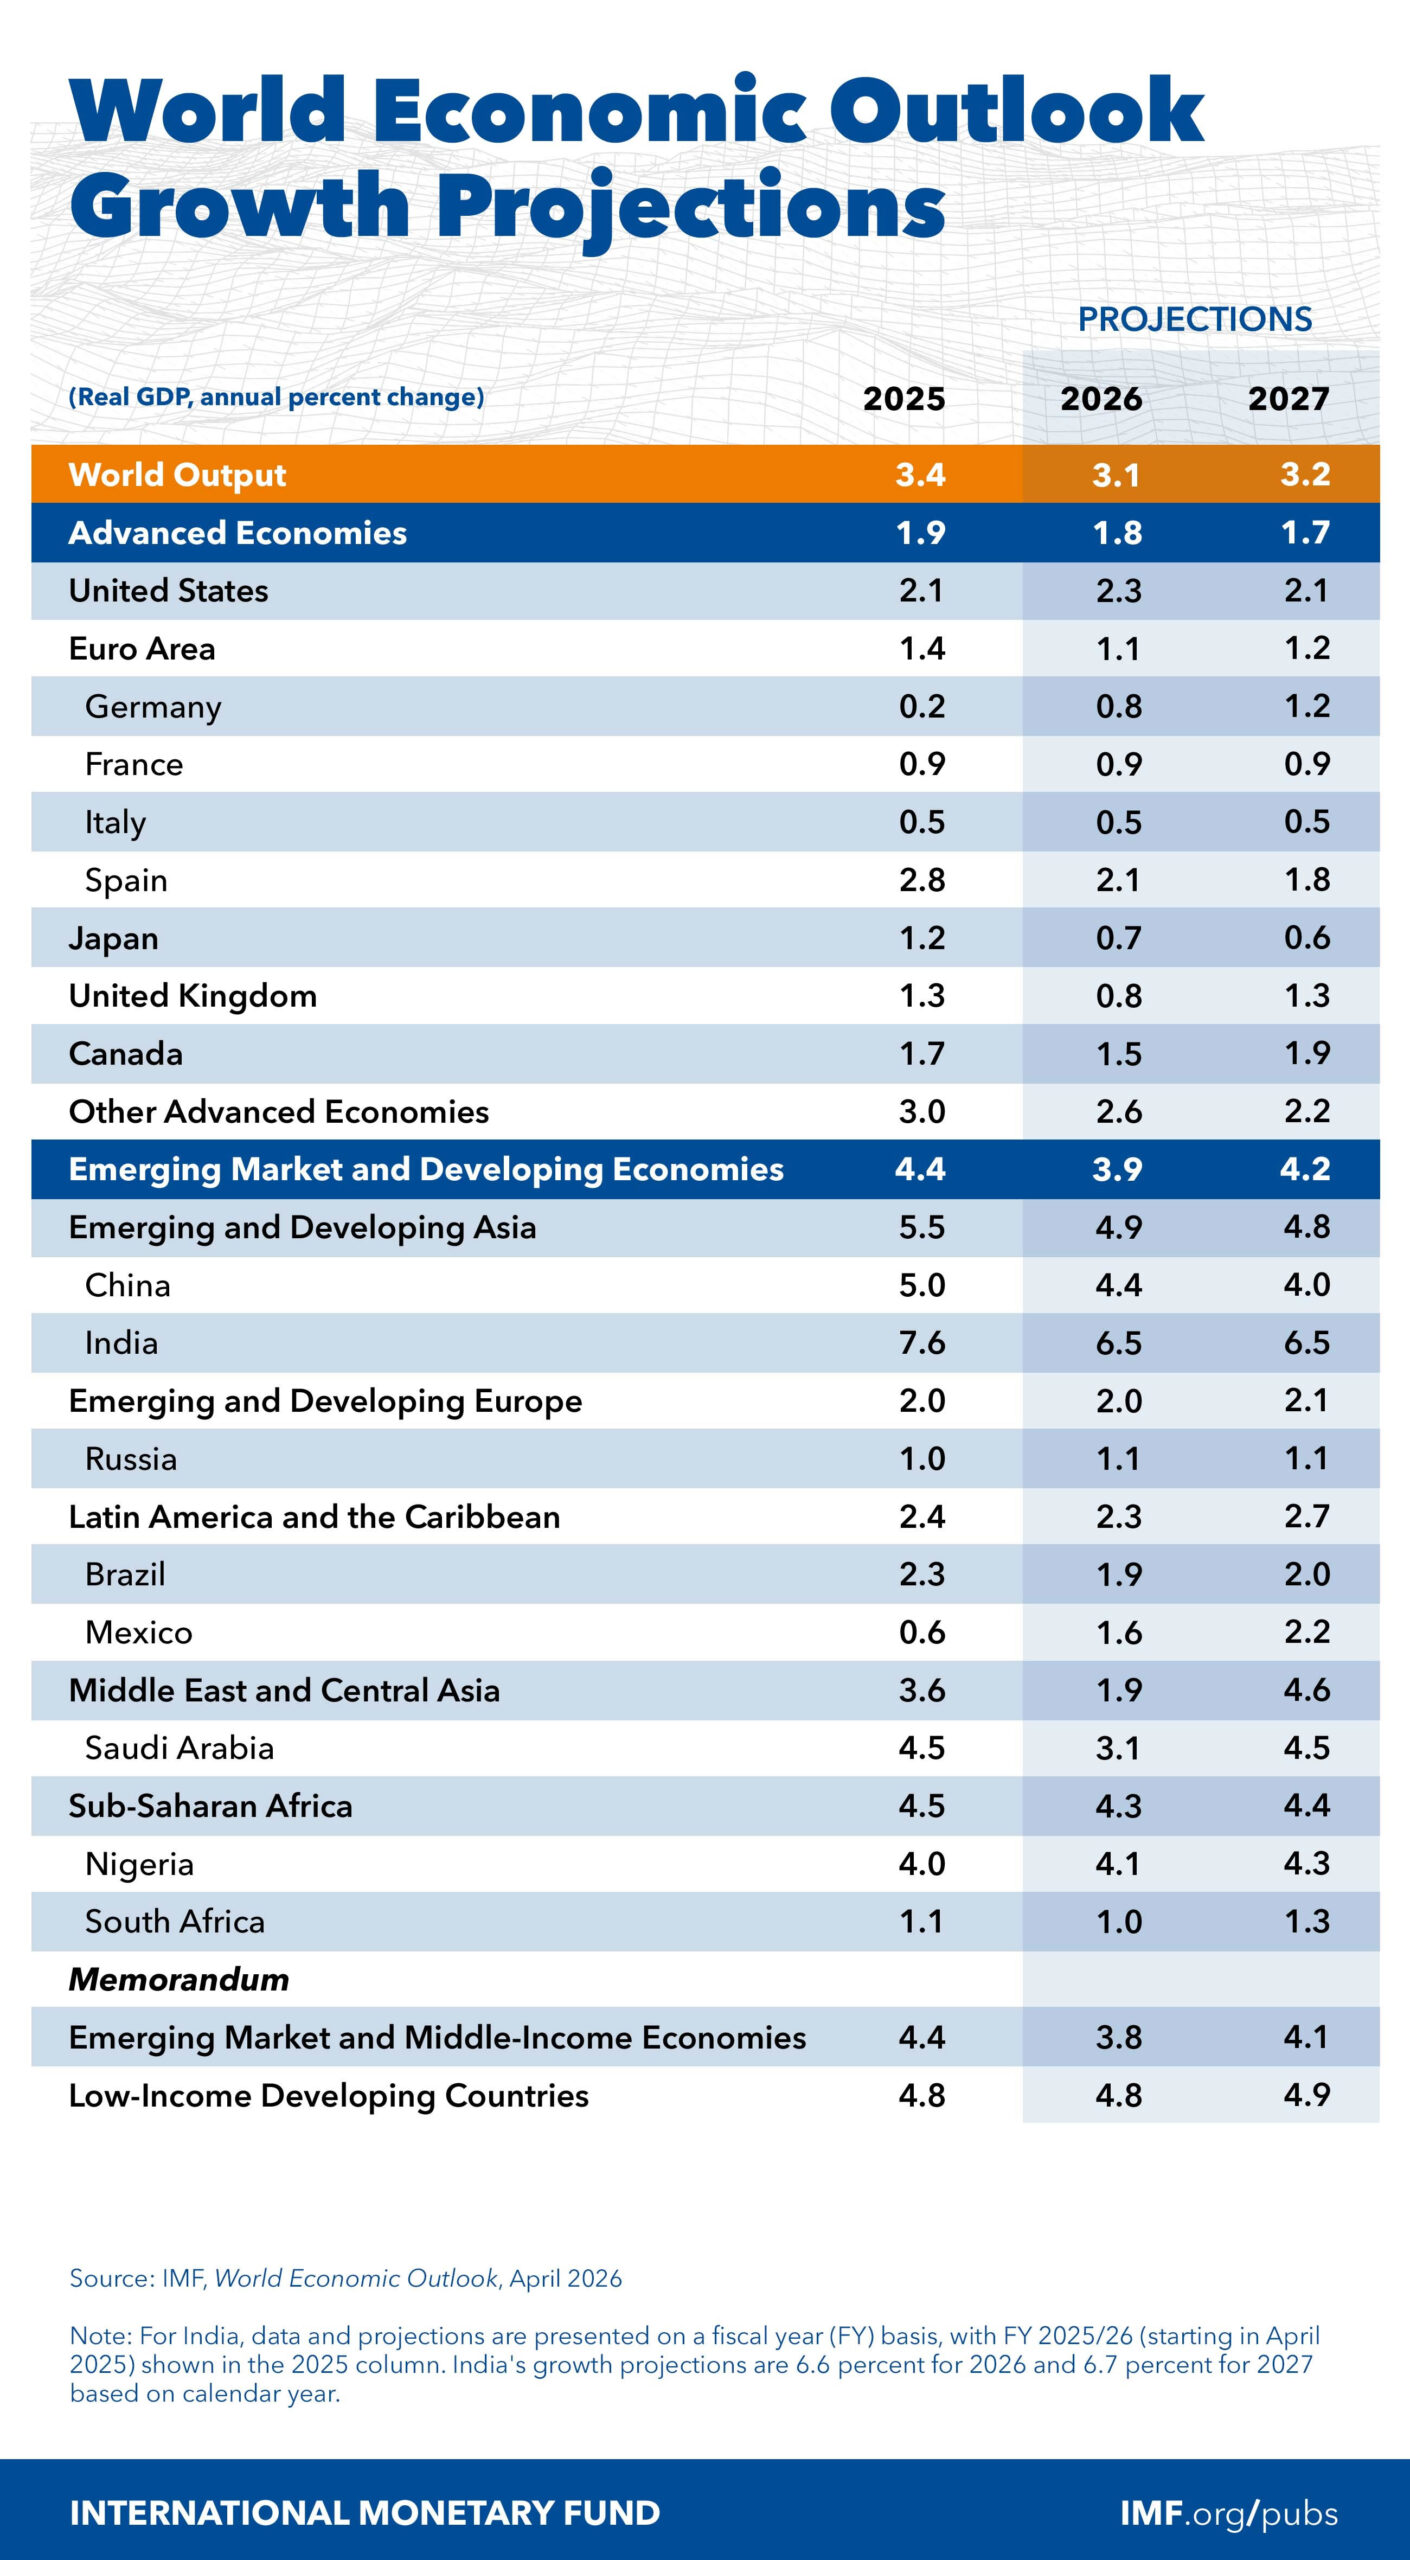
Under its baseline assumption that the conflict remains limited, the IMF projects global growth to slow to 3.1% in 2026 before edging up to 3.2% in 2027. Inflation is expected to rise modestly in 2026 due to energy costs before resuming its decline. However, even this relatively benign scenario points to a fragile balance between slowing growth and lingering price pressures.
The severe scenario paints a much more concerning picture. Oil prices are projected to double relative to earlier assumptions and remain elevated, averaging around $110 in 2026 and $125 in 2027. At the same time, global headline inflation could climb to 5.8% in 2026 and exceed 6% in 2027, reflecting both higher energy costs and a rise in inflation expectations.
| IMF Scenario | 2026 | 2027 |
| REFERENCE FORECAST | ||
| Global GDP growth | 3.1% | 3.2% |
| Oil price average | $82 | $75 |
| Headline inflation | 4.4% | 3.7% |
| ADVERSE SCENARIO | ||
| Global GDP growth | 2.5% | 3.0% |
| Oil price average | $100 | $75 |
| Headline inflation | 5.4% | 3.9% |
| SEVERE SCENARIO | ||
| Global GDP growth | 2.0% | 2.2% |
| Oil price average | $110 | $125 |
| Headline inflation | 5.80% | 6.10% |
That rise in expectations is a key transmission channel. The IMF estimates that one-year-ahead inflation expectations could increase by up to 100 basis points in advanced economies and 130 basis points in emerging markets. This would reinforce price pressures and make it more difficult for central banks to bring inflation back under control.
Financial conditions would also tighten significantly. The IMF warned of a broad risk-off episode, with corporate credit spreads in advanced economies and China widening by around 100 basis points, while emerging markets could see sovereign spreads rise by a similar magnitude and corporate spreads by as much as 200 basis points.
Importantly, policy responses in such a scenario would be constrained. Rather than supporting growth, central banks would be forced to focus on containing inflation, even as activity weakens. This creates a classic stagflationary setup, where tightening financial conditions and elevated borrowing costs further weigh on economic momentum.
Even in the IMF’s adverse scenario, growth slows meaningfully to 2.5% in 2026, with oil averaging around $100 and inflation rising to 5.4%. This underscores that risks are already skewed to the downside, even without a full escalation.
Sunset Market Commentary
Markets
There’s still a role for diplomacy to end the war in the Middle East. It’s the main takeaway from the last couple of days during which geopolitical tensions rose again after a first round of talks collapsed over the weekend. The US naval blockade sparked Iranian outcry but hasn’t triggered formal retaliation just yet. It’s instead rumoured that Iran is considering a pause to its own shipments through the Hormuz Strait to avoid testing the blockade and undermine efforts for a second round of negotiations. These could be held as soon as Thursday. First signs of fresh talks emerged yesterday, pushing Brent oil back below $100. It’s staying there today ($98). European stocks build on yesterday’s intraday comeback by adding 1.1%. The EuroStoxx50 is closing in on the 6k barrier it lost since the war erupted. WS adds another 0.5%-1% with the S&P500 back at the level before the war. When Trump backed down on its own April 8 deadline last week, markets flipped more optimistic on the conflict and they haven’t really let go on that feeling since. Bunds catch up with Treasuries yesterday and push German yields between 2 and 6.5 bps lower in bull steepening fashion. US rates change less than 1 bp across the curve. The US dollar remains in the defensive against most G10 peers. EUR/USD pushes ahead to the next big figure north of 1.18, surpassing pre-war levels. DXY mirrors the move with a decline towards 98. The constructive risk sentiment supports the likes of sterling too, dragging EUR/GBP again below 0.87. Cable (GBP/USD) surges to the highest level since mid-February just shy of 1.36.
Some economic data featured the agenda today, although they didn’t leave any marks on trading. US March PPI missed expectations. The headline print was expected at 1.1% on surging energy prices but rose a more moderate 0.5%, nevertheless bringing the annual figure to a four-year high of 4% from 3.4%. Energy did spike 8.5% m/m and a nearly 16% rise in gas prices was responsible for almost half of the 1.6% goods price rise (most since August 2023), BLS said. Services prices stagnated and underlying PPI gauges showed sub-consensus gains of 0.1% and 0.2%. ADP’s employment measure registered an average increase of 39k per week in the four-week period ending March 28. It’s the fastest since ADP began compiling the data mid-2025. The remainder of the day centers around speeches by BoE governor Bailey and ECB president Lagarde, in which we’ll look for potential hints about their reaction function to structurally elevated energy/oil prices. The IMF in any case downgraded its world growth forecast as a result of the oil shock. The most optimistic projection assumes a short-lived conflict and a moderate gain in energy prices. GDP growth would amount to 3.1% (from 3.3% in January) and inflation would rise to 4.4%. In a middle scenario growth stands at 2.5% and inflation 5.4% while the severe one has <2% (= close to a global recession) and 5.8% penciled in.
News & Views
According to a draft document seen by Bloomberg News, the European Commission will put forward an “AccelerateEU” plan on April 22. It’s a policy umbrella used to accelerate electrification across the economy. The EC targets to increase electricity’s share of final energy consumption from around 23% today to 32% by 2030. Two crisis in the space of less than 5 years time underscore the danger of geopolitical volatility combined with Europe’s dependency on fossil fuel imports. The EU’s plan will be based on five pillars, including boosting coordination among member states on issues such as filling gas storage sites and releasing oil reserves, targeted support for consumers and industry, decreasing consumption of oil and gas, boosting electrification and spurring investments in the transition.
The International Energy Agency published its April oil market report. Oil demand is expected to contract by 80 kb/d this year, as the Iran war upends the global outlook. This is 730 kb/d less than in last month’s Report and a forecast 1.5 mb/d 2Q26 decline would be the sharpest since Covid-19 slashed fuel consumption. Demand destruction will spread as scarcity and higher prices persist. Global oil supply plummeted by 10.1 mb/d to 97 mb/d in March, with continued attacks on energy infrastructure in the Middle East and ongoing restrictions to tanker movements through the Strait of Hormuz leading to the largest disruption in history. Oil prices posted their largest-ever monthly gain in March. Soaring spot crude benchmarks and differentials outpaced futures markets in the process. Resuming flows through the Strait of Hormuz remains the single most important variable in easing the pressure on energy supplies, prices and the global economy.
Technical Levels to Watch as Nasdaq 100 Approaches All-Time Highs
- The Nasdaq 100 has completed a "V-shaped" recovery after the recent sellof.
- The overall trend is clearly bullish across all major timeframes, with the index currently trading above the key 25,320 resistance-turned-support level.
- The RSI is signaling overbought conditions on the Daily, H4, and M15 charts, which suggests that immediate upside momentum may be slowing and consolidation or a minor "retest" is likely.
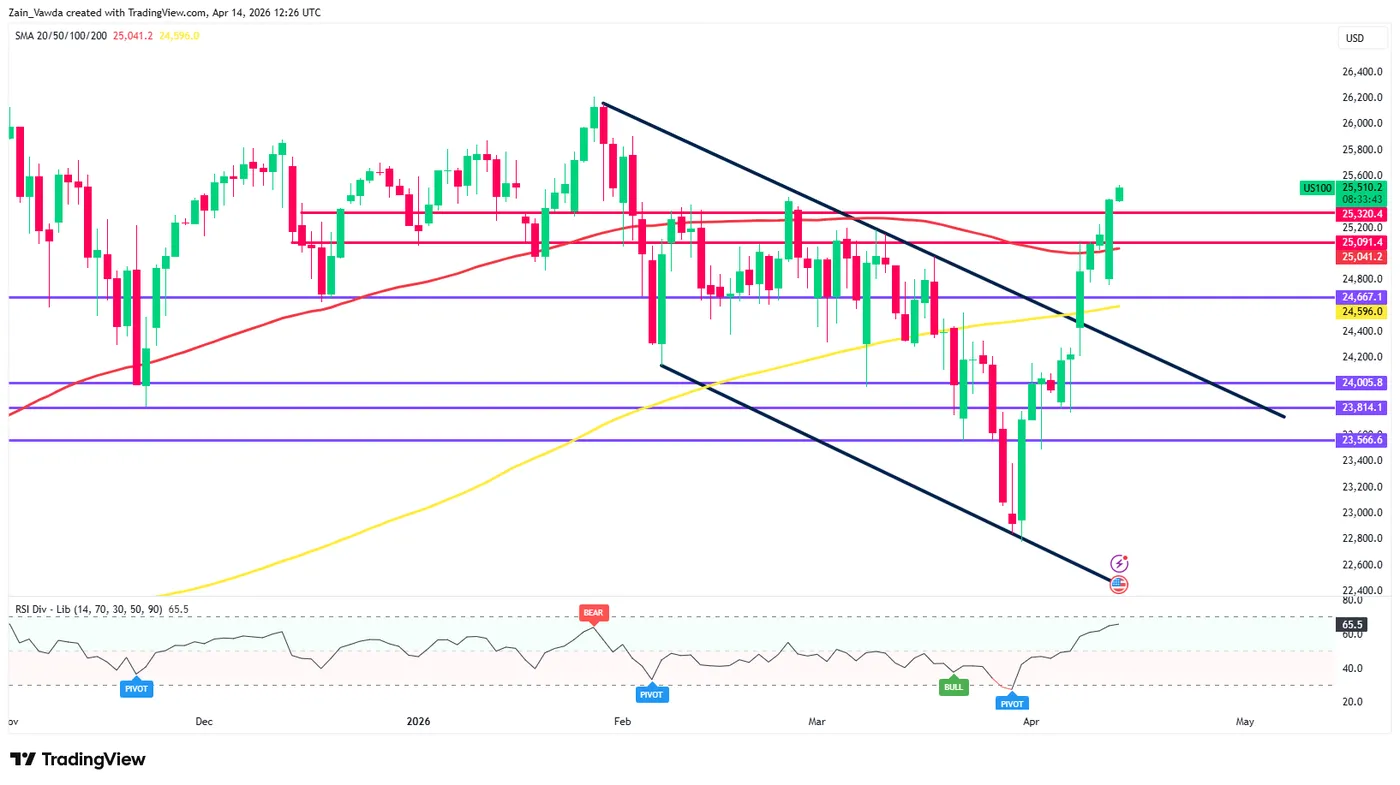
The Nasdaq 100 has undergone a massive rally. After a period of aggressive selling that saw the index dip toward the 22,800 handle, we have seen a textbook "V-shaped" recovery.
The most notable development is the breakout from the descending channel (highlighted by the dark trendlines). This breakout was confirmed with a strong impulsive candle that cleared both the 100-day (red) and 200-day (yellow) Moving Averages (MAs).
Currently, the index is trading above the 25,320 resistance-turned-support level. The RSI on the daily is approaching overbought territory (65.5), but it still shows room for a final push toward the previous all-time highs near 26,200 before a meaningful correction is required.
Nasdaq 100 Daily Chart, April 14, 2026
Source: TradingView (click to enlarge)
H4 and H1 Chart Analysis: Momentum and Market Structure
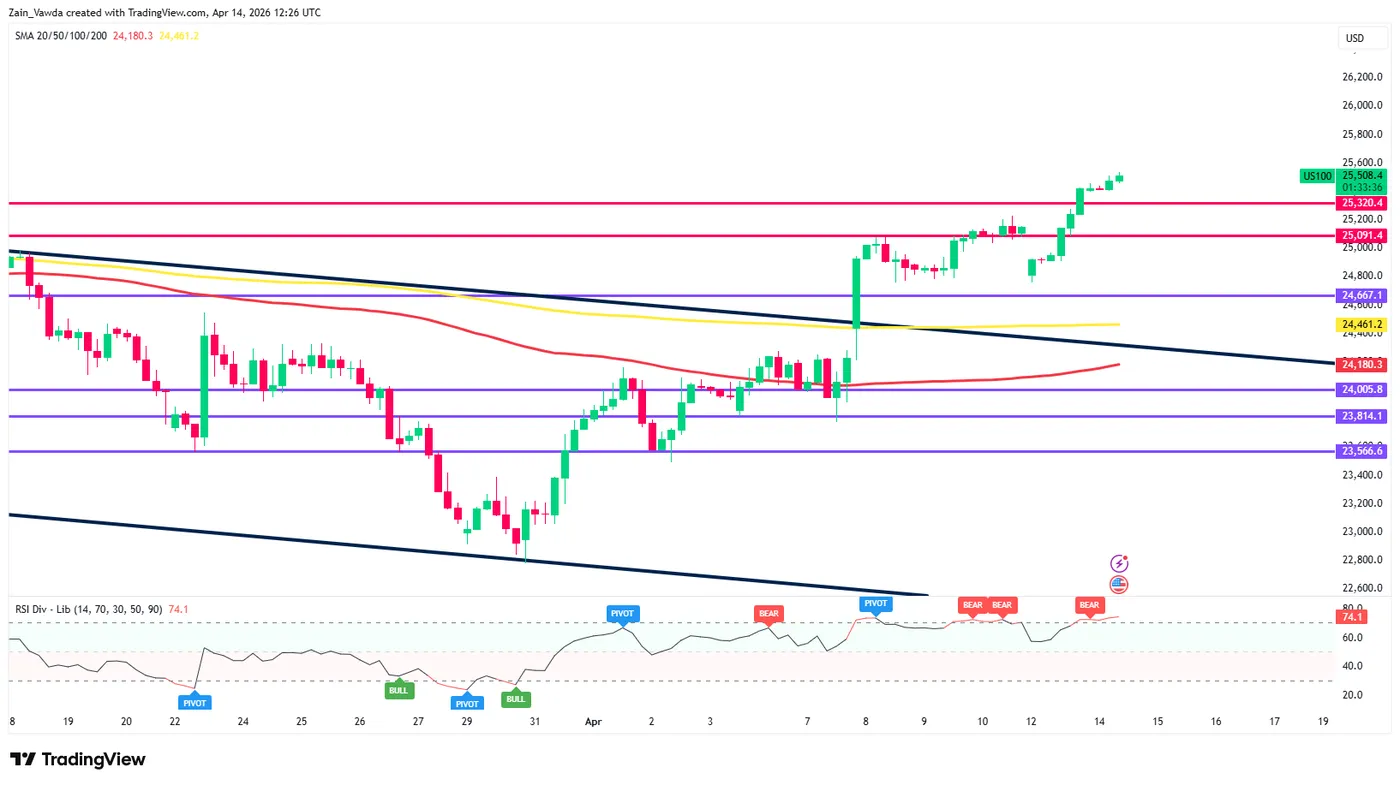
Moving down to the H4 and H1 timeframes, the bullish momentum is even more evident. The "Golden Cross" or proximity of the moving averages suggests that the path of least resistance remains to the upside.
H4 Perspective: The index has cleared the 25,091 level with ease. We see a series of higher highs and higher lows. The H4 RSI is currently at 74.1, indicating that while the trend is strong, we may see some intraday consolidation or a minor "retest" of the breakout zone at 25,320.
H1 Perspective: The hourly chart shows a steep ascending slope. The moving averages are perfectly fanned out in a bullish alignment. We are seeing some "Bear" divergence signals appearing on the RSI (red labels), which suggests that the immediate upside might be slowing down as we approach the US open.
Nasdaq 100 Four-Hour Chart, April 14, 2026
Source: TradingView (click to enlarge)
M15 Analysis: US Session Scenarios
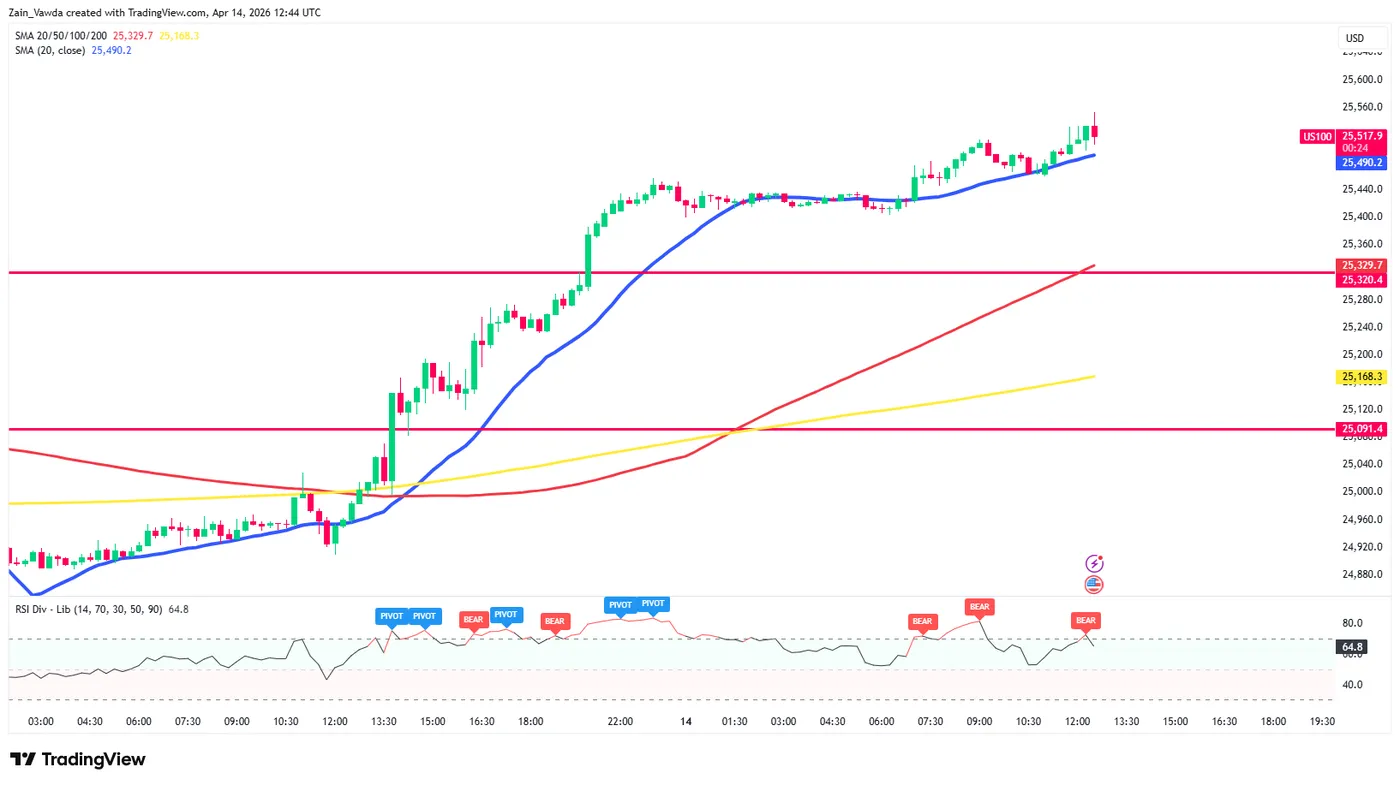
Let us take a look at the M15 ahead of the US session. The index is currently hovering around 25,526.
The Bullish Scenario
If the US session opens with strong buying pressure, look for a sustained hold above 25,500. A break and close above the most recent intraday high (25,560) would open the door for a move toward 25,750. The bulls will be emboldened as long as the price stays above the 20-period MA (Blue line) on this timeframe.
The Bearish Scenario
The RSI is currently signaling overbought conditions (71.0) with several "Bear" pivot markers. If we see a "fake-out" at the open, a move back below 25,480 could trigger a liquidation of intraday long positions. This would likely lead to a move back toward the 25,320 support level (the red horizontal line), which acted as a major ceiling previously.
Key Levels to Watch:
- Resistance: 25,560, 25,750, 26,000
- Support: 25,320, 25,091, 24,667
Nasdaq 100 M15 Chart, April 14, 2026
Source: TradingView (click to enlarge)
The Nasdaq 100 is in a clear bullish cycle across all major timeframes. However, given the vertical nature of the recent move and the RSI levels, the risk-to-reward ratio for new longs at current market prices is less than ideal.
Traders would be wise to look for pullbacks to the 25,320 or 25,100 zones to join the trend, rather than chasing the breakout at these elevated levels.
S&P 500 Has Recouped Its March Losses, Focus Shifts to Earnings
The US stock market has returned to pre-war levels, turning a blind eye to the Fed’s interest rate hike, the oil crisis, and the threat of stagflation. Brent is trading $30 a barrel above levels before the Middle East conflict, Treasury bond yields are 35 to 40 basis points higher, and traders have all but given up hope that the Fed will cut rates in 2026. Conditions are far worse than at the end of February, yet the S&P 500 is at the same levels.
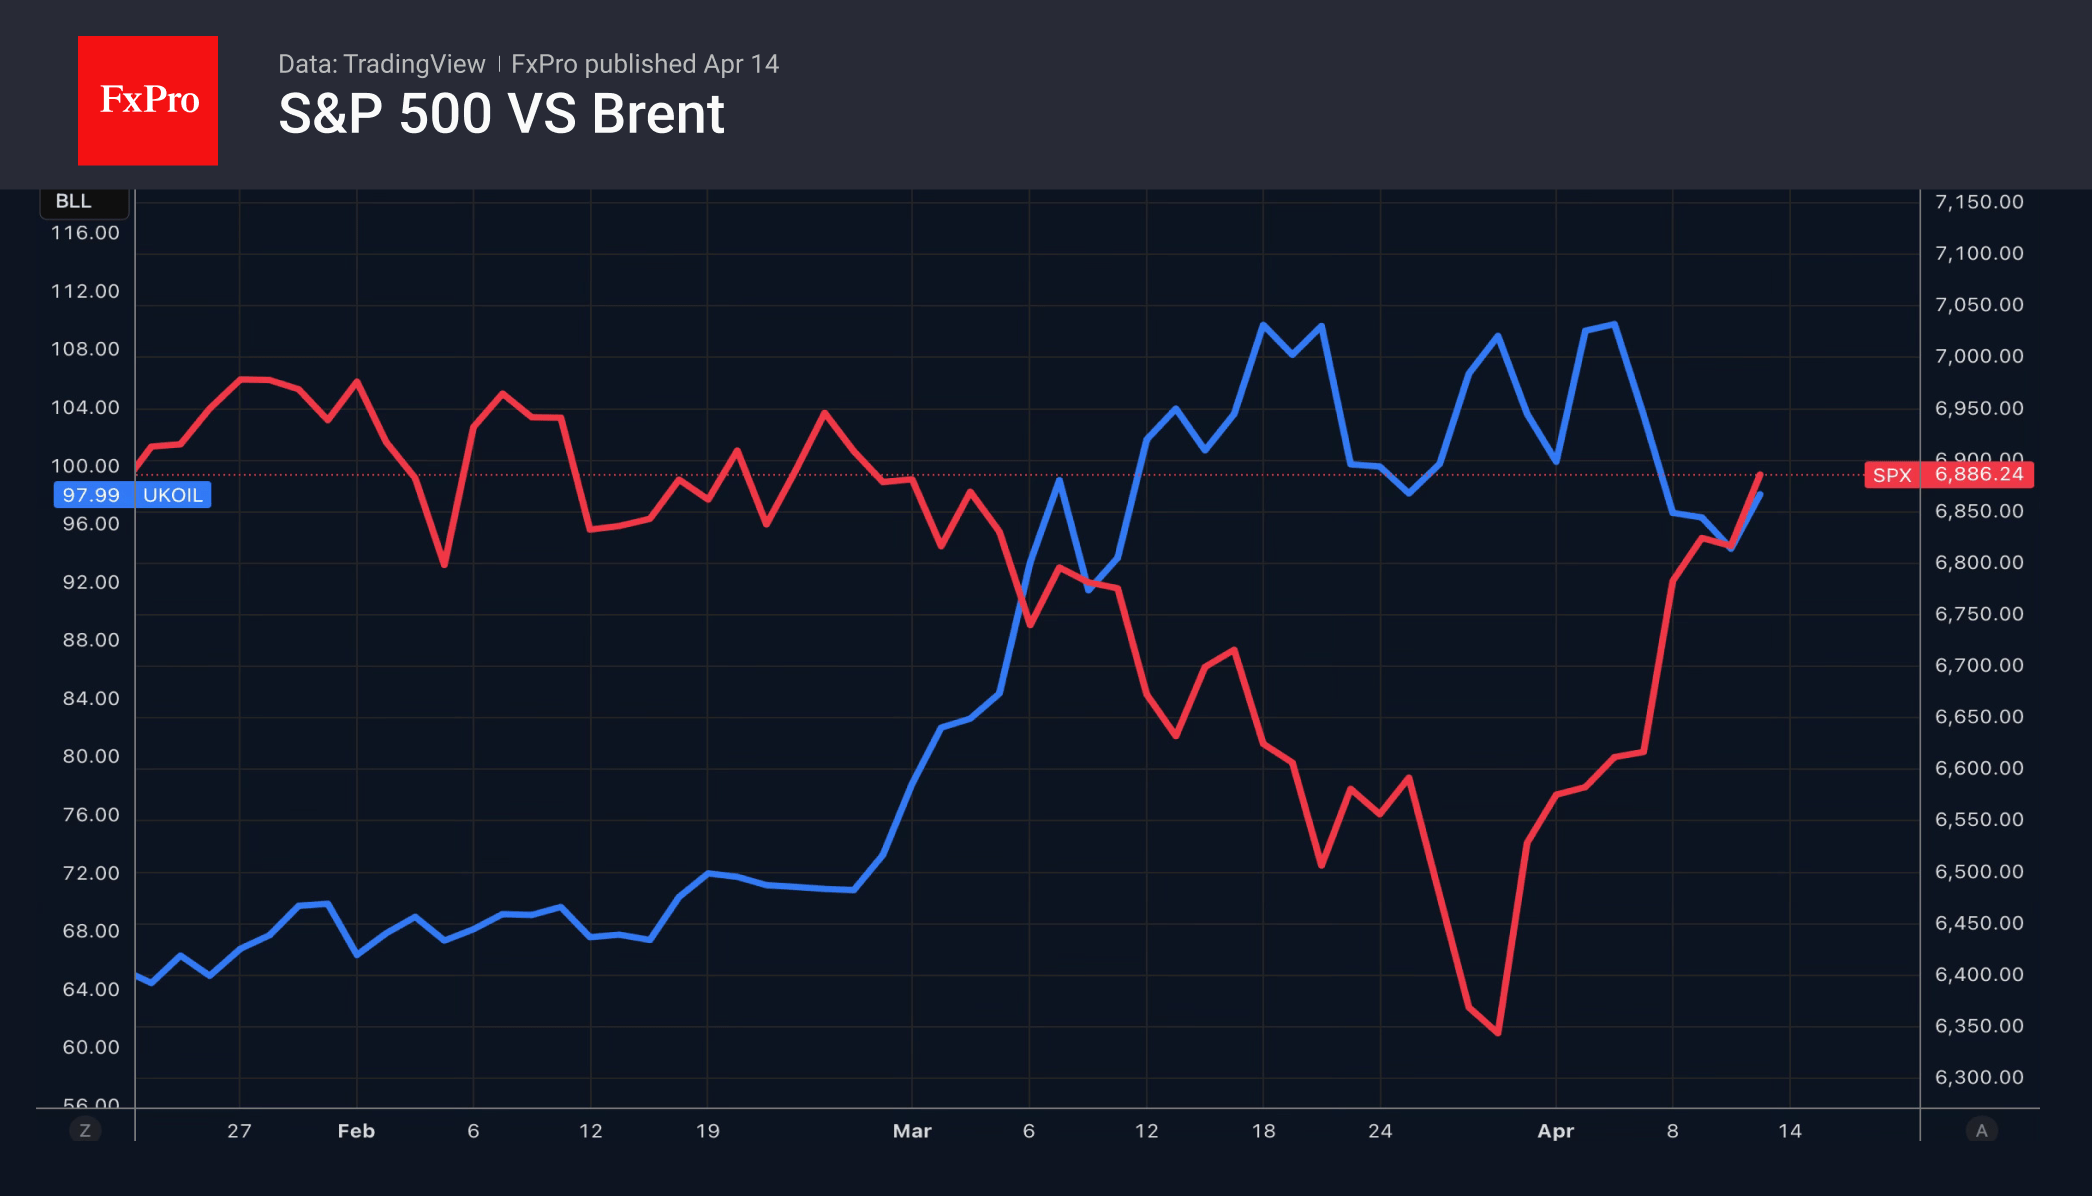
Expectations of strong corporate earnings, a robust economy and peace in the Middle East underpin the rally in the broad stock index. Despite the continuing uncertainty in the region, investors are buying into rumours of an agreement between the US and Iran. Markets are tired of geopolitics and are switching to fundamentals.
According to Wall Street analysts’ forecasts, earnings per share for S&P 500 companies will rise by 12.5% in Q1, the sixth consecutive quarter of double-digit growth. Meanwhile, the number of companies issuing upbeat corporate earnings forecasts is set to reach its highest since 2021.
Strong earnings are impossible without a robust economy. Experts at the Wall Street Journal have slightly lowered their forecast for US GDP in 2026, from 2.2% to 2%, which broadly matches the average growth rate of 2.1% over the past six years. The likelihood of a recession in the next 12 months has also risen only slightly, from 27% to 33%, despite the devastating impact on the economy from events over the past month and a half. All this is thanks to artificial intelligence and the subsequent productivity gains.
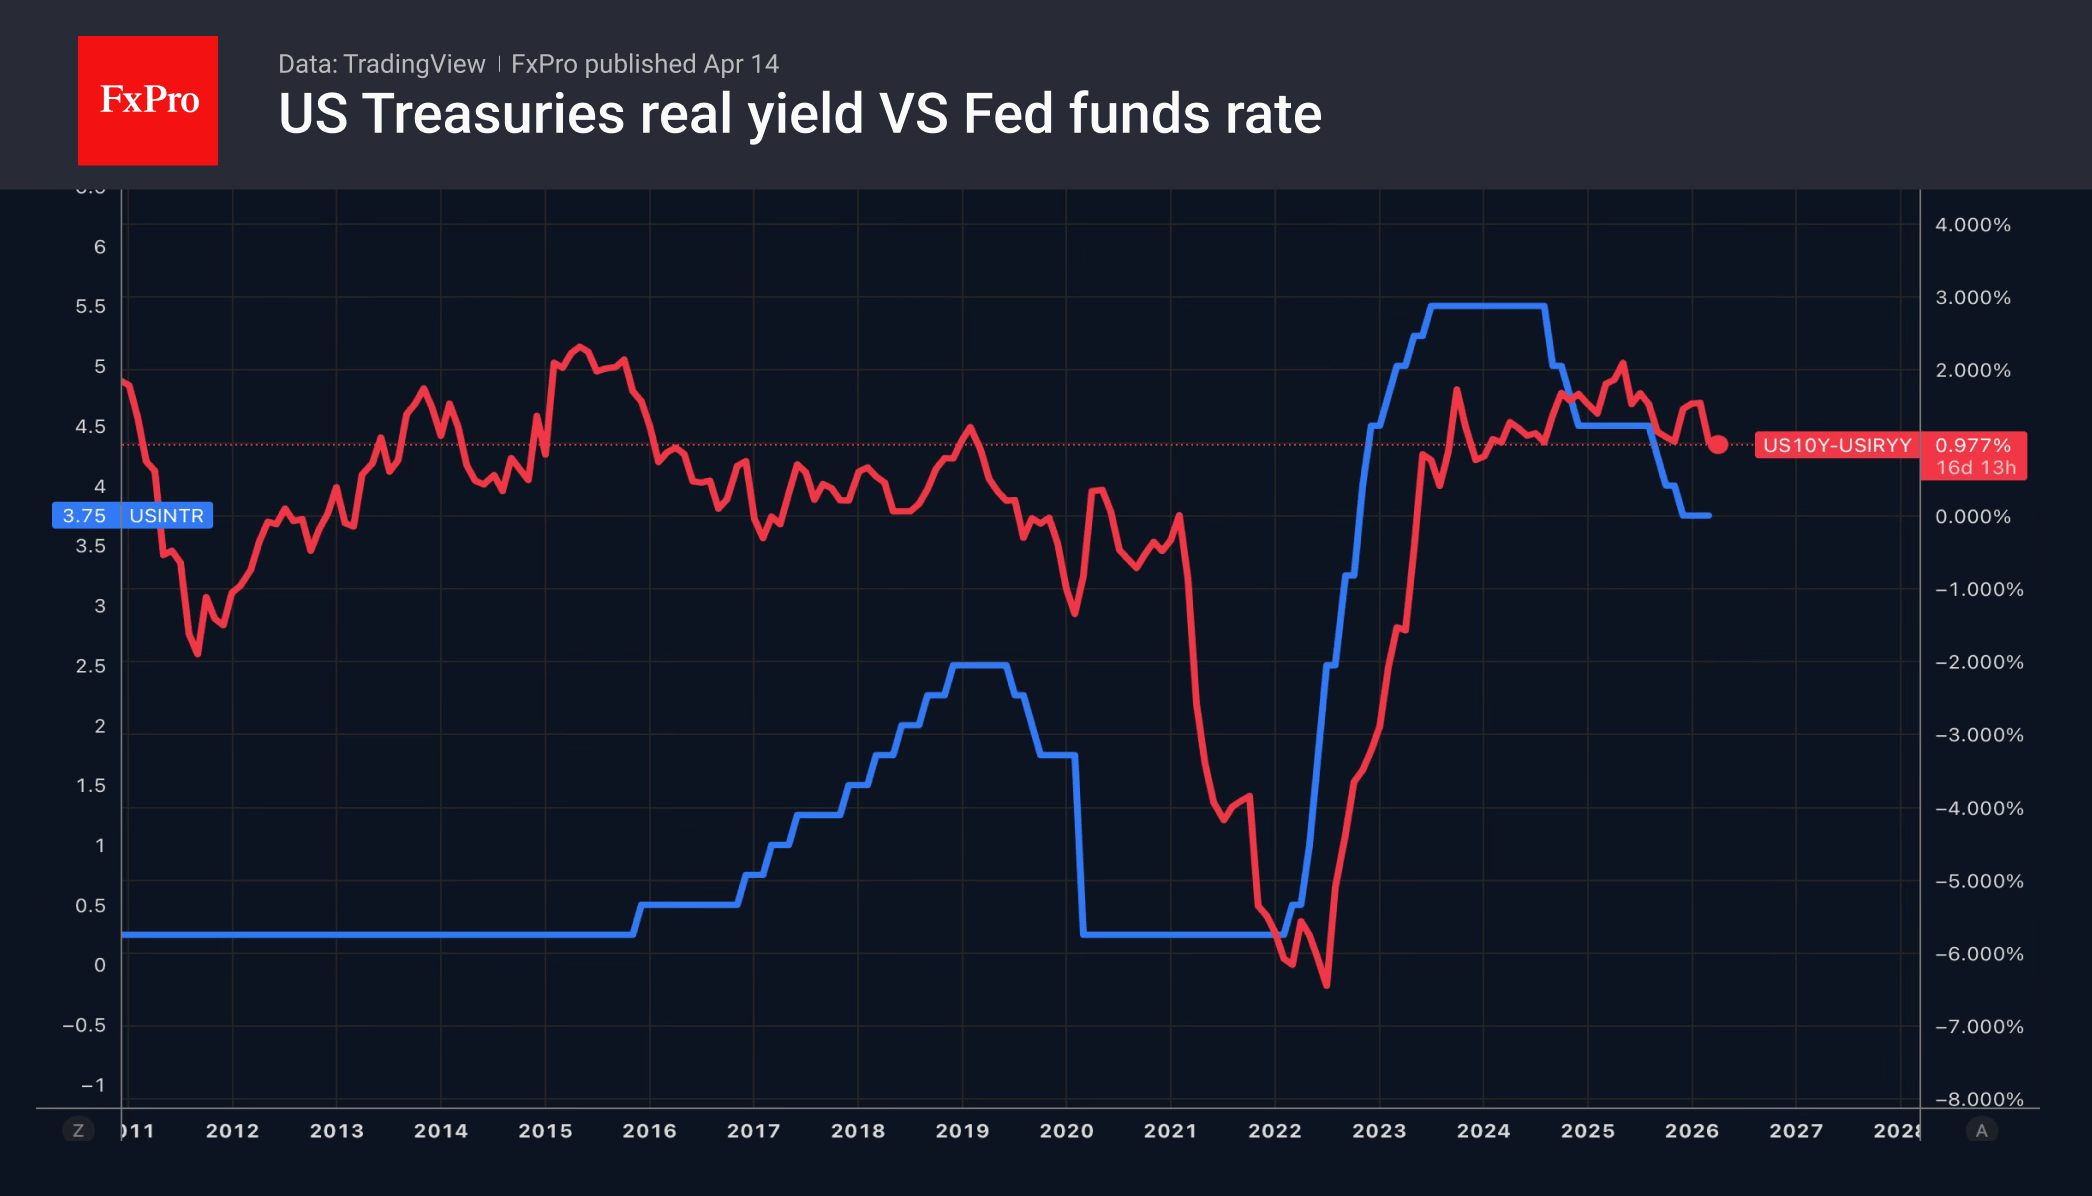
Although Fed rates are high by historical standards, the real yield on US Treasury bonds, against a backdrop of accelerating inflation, does not suggest that monetary policy is too tight.
The S&P 500 correction in March lowered companies’ fundamental valuations. This includes the price-to-forward-earnings ratio. Shares now appear undervalued and attractive, which is stimulating buying.
AUD/USD Mid-Day Report
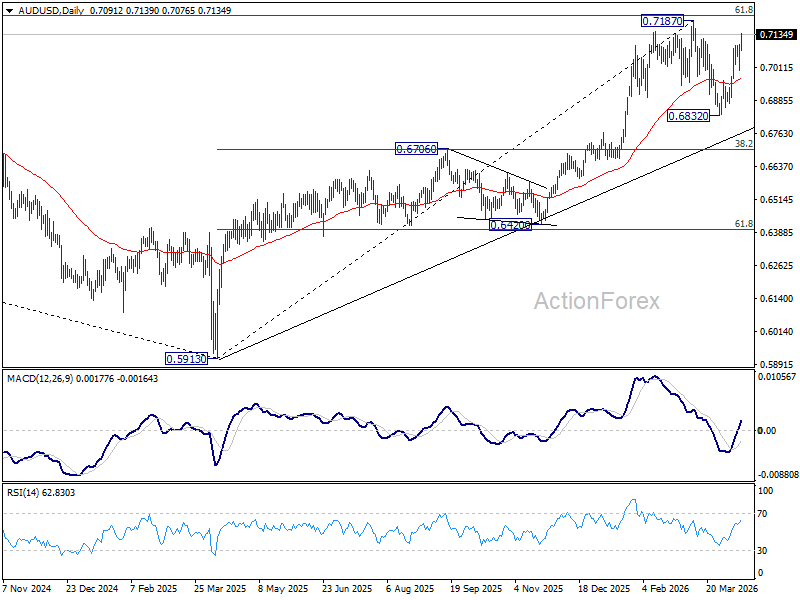
Daily Pivots: (S1) 0.7023; (P) 0.7062; (R1) 0.7136; More...
Intraday bias in AUD/USD stays on the upside for retesting 0.7187 high. Strong resistance could be seen there on first attempt. But for now, further rally is expected as long as 0.7000 support holds, in case of retreat. Meanwhile, decisive break of 0.7187 will confirm larger up trend resumption.
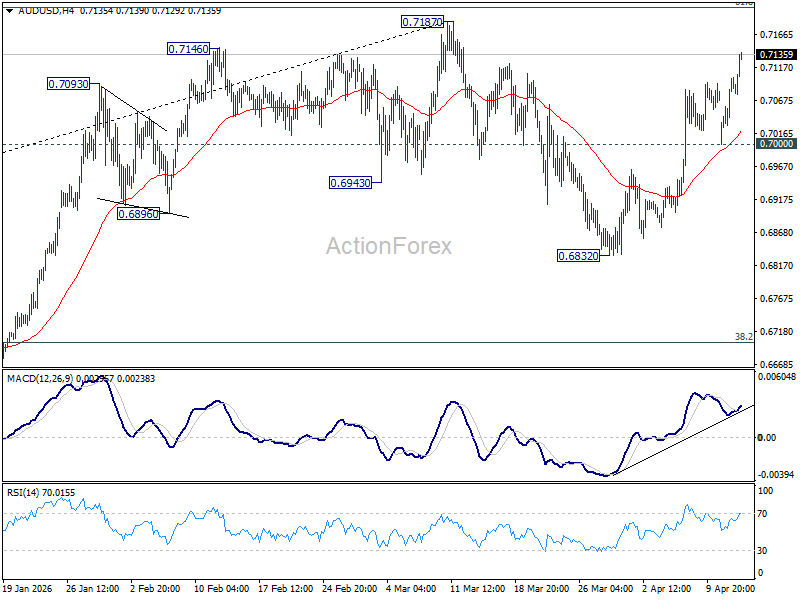
In the bigger picture, as long as 0.6706 cluster support holds, rise from 0.5913 (2024 low) should still be in progress. Decisive break of 61.8% retracement of 0.8006 to 0.5913 at 0.7206 will solidify the case that it's already reversing the down trend from 0.8006 (2021 high). However, firm break of 0.6706 will dampen this bullish case, and bring deeper fall back to 0.6420 support, and possibly below.
USD/CAD Mid-Day Outlook
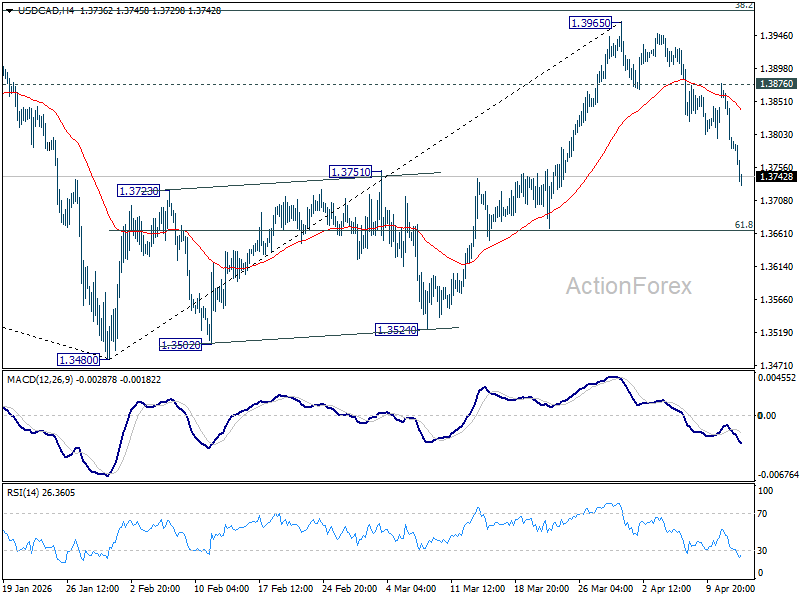
Daily Pivots: (S1) 1.3759; (P) 1.3819; (R1) 1.3851; More...
Intraday bias in USD/CAD remains on the downside for 61.8% retracement of 1.3480 to 1.3965 at 1.3665. Decisive break there will extend the decline from 1.3965 to retest 1.3480 low. For now, risk will stay on the downside as long as 1.3876 resistance holds, in case of recovery.
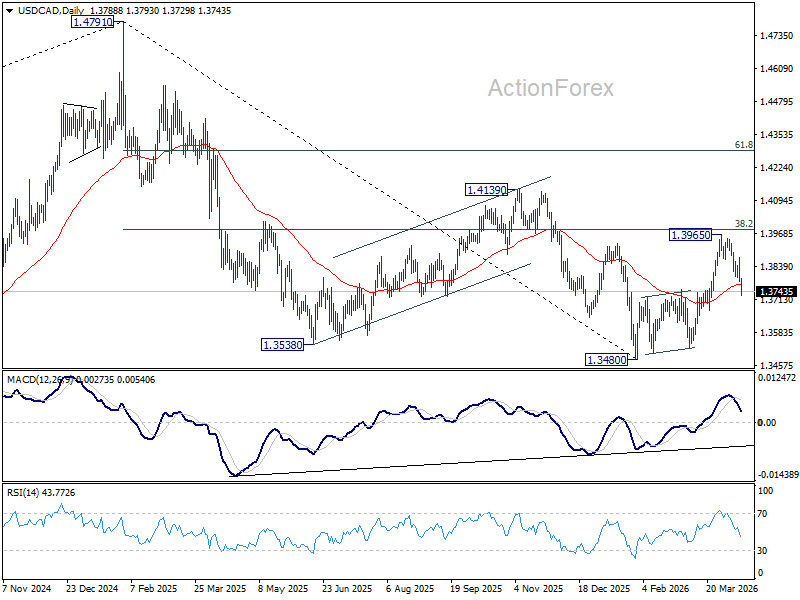
In the bigger picture, price actions from 1.4791 are seen as a corrective pattern to the whole up trend from 1.2005 (2021 low). Deeper fall could be seen, as the pattern extends, to 61.8% retracement of 1.2005 to 1.4791 at 1.3069. However, decisive break of 38.2% retracement of 1.4791 to 1.3480 at 1.3981 will argue that the correction has completed with three waves down to 1.3480 already. Further break of 1.4139 will confirm and bring retest of 1.4791 high.
USD/JPY Mid-Day Outlook
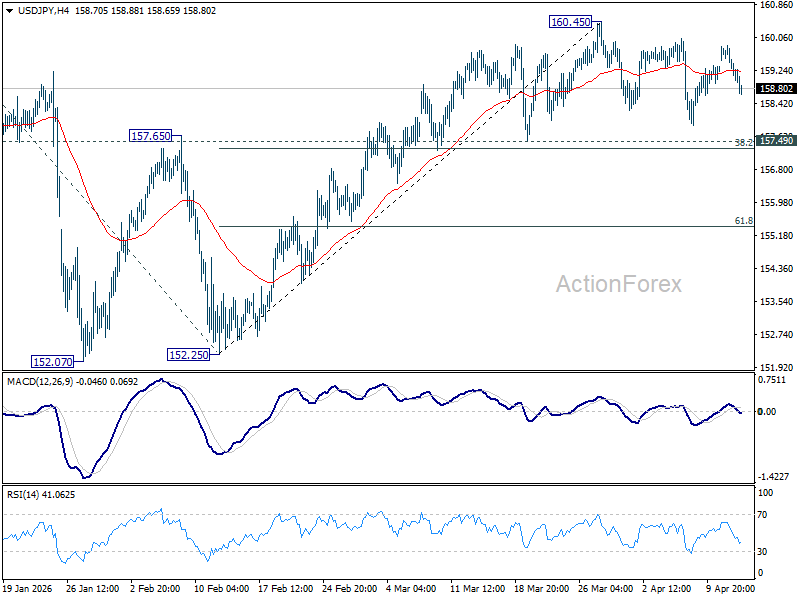
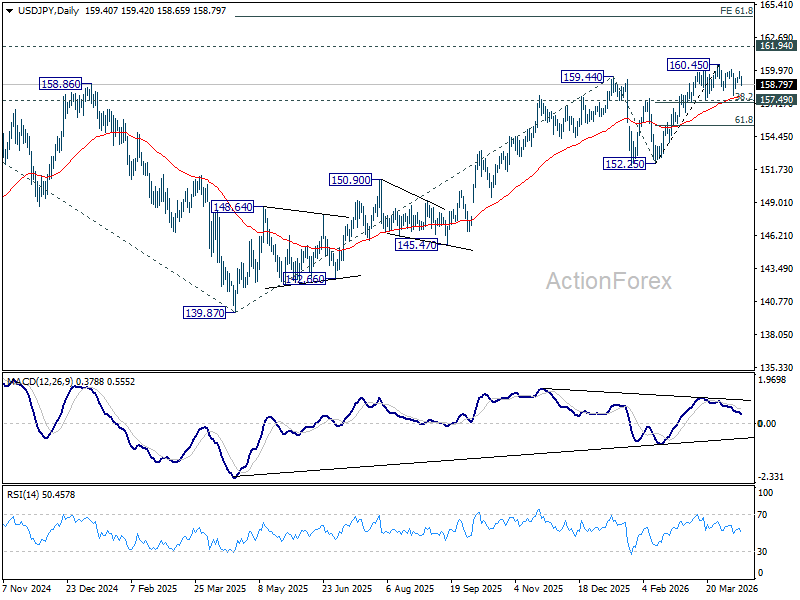
Daily Pivots: (S1) 159.21; (P) 159.53; (R1) 159.78; More...
Intraday bias in USD/JPY remains neutral and more consolidations could be seen below 160.45. Outlook will stay bullish as long as 157.49 cluster support (38.2% retracement of 152.25 to 160.45 at 157.31) holds. On the upside break of 160.45 will target a retest on 161.94 high. However, firm break of 157.31/49 will bring deeper fall back to 61.8% retracement at 155.38 next.
In the bigger picture, outlook is unchanged that corrective pattern from 161.94 (2024 high) should have completed with three waves at 139.87. Larger up trend from 102.58 (2021 low) could be ready to resume through 161.94. This will remain the favored case as long as 55 W EMA (now at 155.24) holds. Firm break of 161.94 will pave the way to 61.8% projection of 102.58 to 161.94 from 139.87 at 176.75.
USD/CHF Mid-Day Outlook
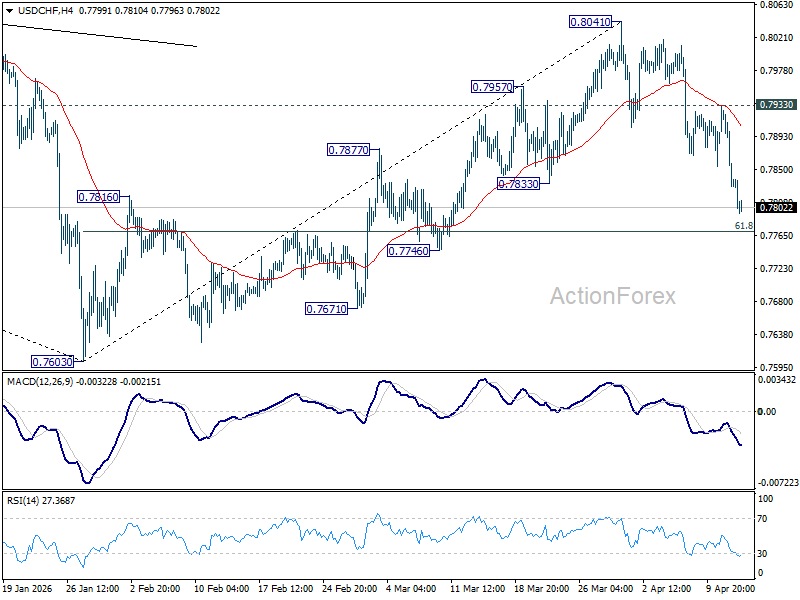
Daily Pivots: (S1) 0.7801; (P) 0.7867; (R1) 0.7906; More….
Intraday bias in USD/CHF remains on the downside for 61.8% retracement of 0.7603 to 0.8041 at 0.7770 . Firm break there will extend the fall from 0.8041 to retest 0.7603 low. For now, risk will stay on the downside as long as 0.7933 resistance holds, in case of recovery.
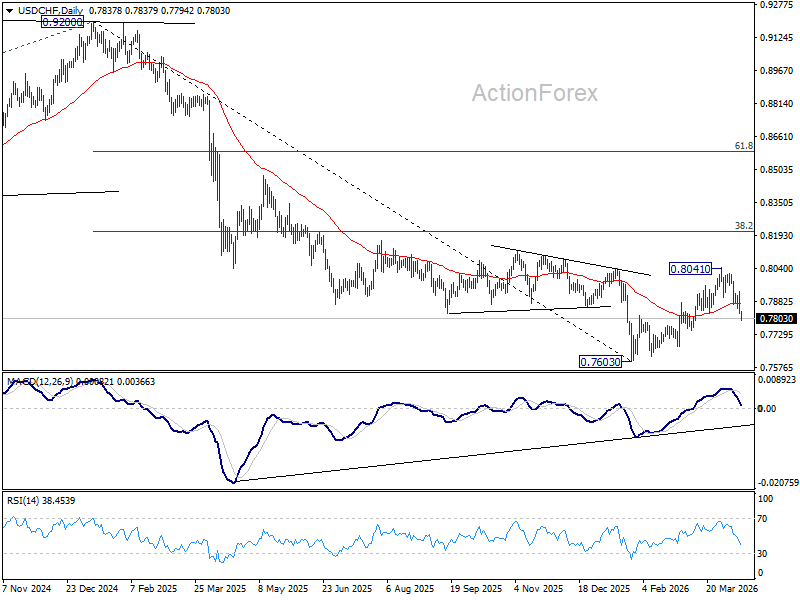
In the bigger picture, rebound from 0.7603 medium term bottom is seen as correcting the fall from 0.9200 only. Rejection by 55 W EMA (now at 0.8071) will affirm this bearish case, and setup down trend resumption to 100% projection of 1.0146 (2022 high) to 0.8332 from 0.9200 at 0.7382 at a later stage. Though, sustained break of 55 W EMA will suggest that it's probably correcting the larger scale down trend from 1.0146 (2022 high).
GBP/USD Mid-Day Outlook
Daily Pivots: (S1) 1.3422; (P) 1.3466; (R1) 1.3551; More...
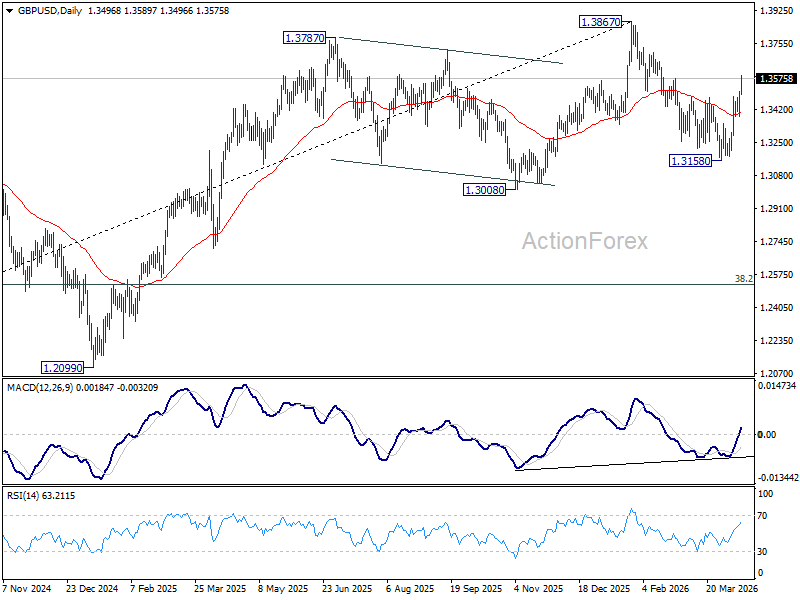
Intraday bias in GBP/USD remains on the upside for 61.8% retracement of 1.3867 to 1.3158 at 1.3596. Decisive break there will extend the rise from 1.3158 to retest 1.3867 high. For now, further rally will remain in favor as long as 1.3379 support holds, in case of retreat.
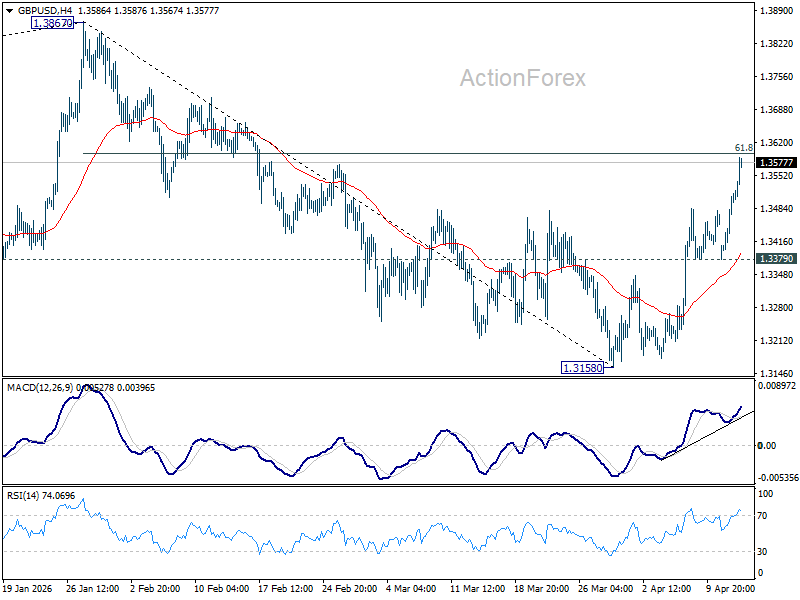
In the bigger picture, current development suggests that price actions from 1.3867 are merely a corrective pattern within the broader up trend from 1.0351 (2022 low). With 1.3008 support intact, medium term bullishness is maintained and break of 1.3867 is back in favor for a later stage, towards 1.4248 key resistance (2021 high).
EUR/USD Mid-Day Outlook
Daily Pivots: (S1) 1.1694; (P) 1.1729; (R1) 1.1795; More….
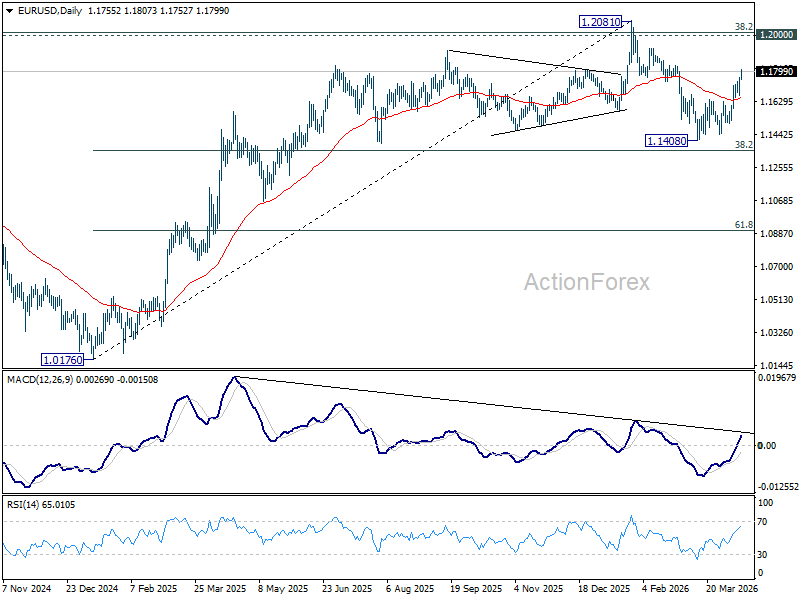
Intraday bias in EUR/USD remains on the upside for 61.8% retracement of 1.2081 to 1.1408 at 1.1824. Decisive break there will extend the rally from 1.1408 to retest 1.2081 high. For now, further rally will remain in favor as long as 1.1662 support holds, in case of retreat.
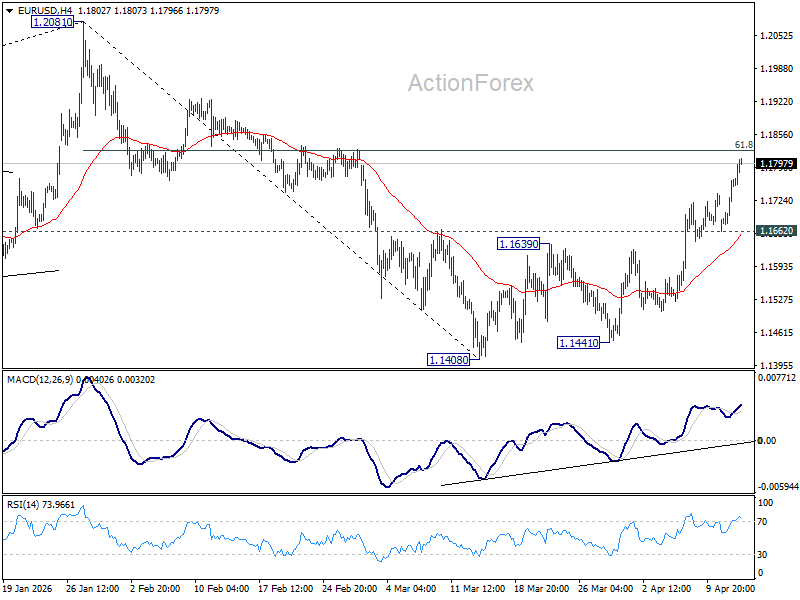
In the bigger picture, the strong support from 38.2% retracement of 1.0176 to 1.2081 at 1.1353 suggests that the pullback from 1.2081 is more likely a corrective move. Strong support was also found in 55 W EMA (now at 1.1513). Focus is back on 1.2 key cluster resistance level. Decisive break there will carry long term bullish implications. Nevertheless, break of 1.1408 support will revive the case of medium term bearish trend reversal.