Sample Category Title
Dollar Steady ahead of FOMC, Sterling Weakens on GDP Data
The currency markets are currently in a state of anticipation, with Dollar trading within familiar range as investors await FOMC rate decision. The critical question facing the markets is whether Fed will signal the pace of rate cuts in its updated dot plot. In September, the median projection indicated the federal funds rate would remain at 5.125% by the end of 2024, implying no rate cuts from the current level. While revisions to this projection are expected, the exact pace and extent of potential rate cuts remain uncertain.
Meanwhile, Sterling has weakened broadly following release of GDP data that showed deeper-than-anticipated contraction. This has raised concerns that the UK economy may already be in a recession. Additionally, the slowing wage growth combined with a less optimistic economic outlook could lead to a shift in stance among the more hawkish members of BoE's MPC. While BoE Governor Andrew Bailey is expected to push back against speculations on rate cut following tomorrow's decision, there are discussions suggesting BoE might cut rates sooner than previously anticipated due to subdued growth.
Regarding weekly performance, Swiss Franc leads as the strongest currency so far, followed by Euro and Canadian Dollar. Japanese Yen is at the bottom of the list, with New Zealand and Australian Dollars trailing close behind. Sterling and Dollar are exhibiting mixed performances.
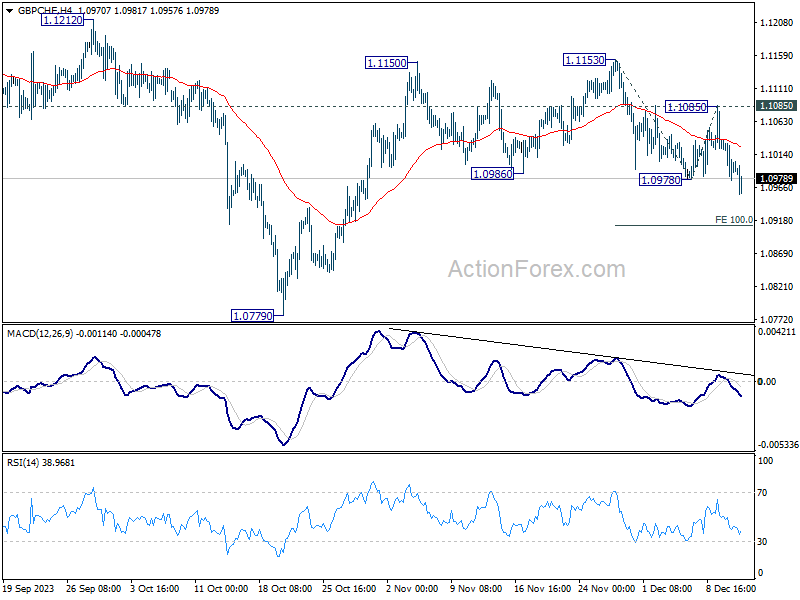
Technically, GBP/CHF's break of 1.0978 invalidated our original bullish view and indicates that fall from 1.1153 is in progress. Near term outlook is mixed for now, with focus on 100% projection of 1.1153 to 1.0978 from 1.1085 at 1.0910. Sustained break there could prompt downside acceleration to 1.0779 to resume larger down trend. Nevertheless, strong rebound from this projection level could revive near term bullishness for another rise through 1.1153 at a later stage.
In Europe, at the time of writing, FTSE is up 0.32%. DAX is up 0.07%. CAC is up 0.18%. Germany 10-year yield is down -0.031 at 2.197. UK 10-year yield is down -0.122 at 3.852. Earlier in Asia, Nikkei rose 0.25%. Hong Kong HSI fell -0.89%. China Shanghai SSE fell -1.15%. Singapore Strait Times rose 0.06%. Japan 10-year JGB yield fell -0.0484 to 0.690.
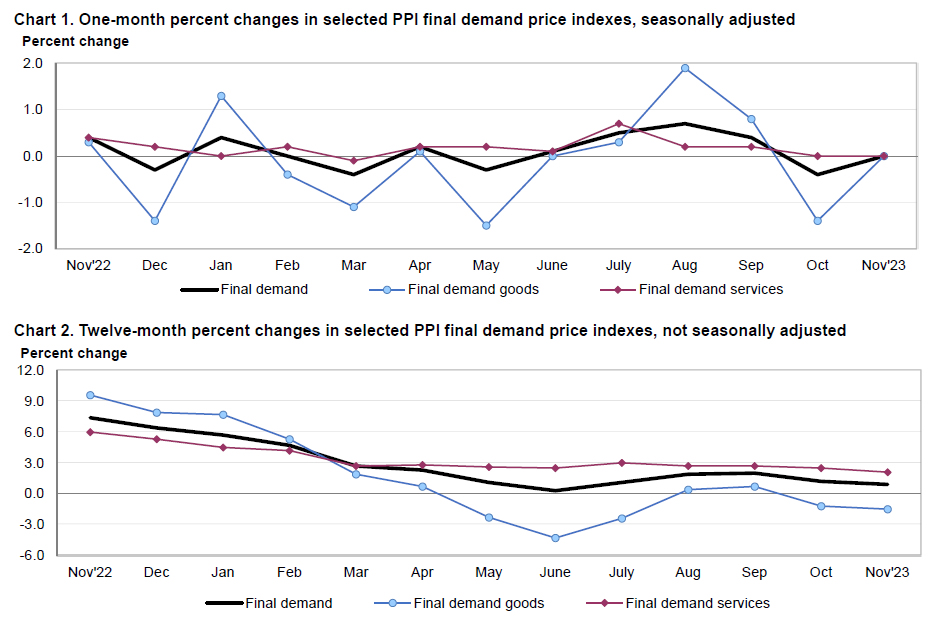
US PPI at 0.0% mom, 0.9% yoy in Nov
US PPI for final demand was unchanged at 0.0% mom in November, below expectation of 0.1% mom. Both indexes for final demand goods and services were unchanged. PPI less foods, energy, and trade services edged up by 0.1% mom.
For the 12 months period, PPI slowed from 1.2% yoy to 0.9% yoy, below expectation of 1.0% yoy. PPI less foods, energy and trade services slowed from 2.8% yoy to 2.5% yoy.
UK GDP shrinks -0.3% mom in Oct, all sectors contract
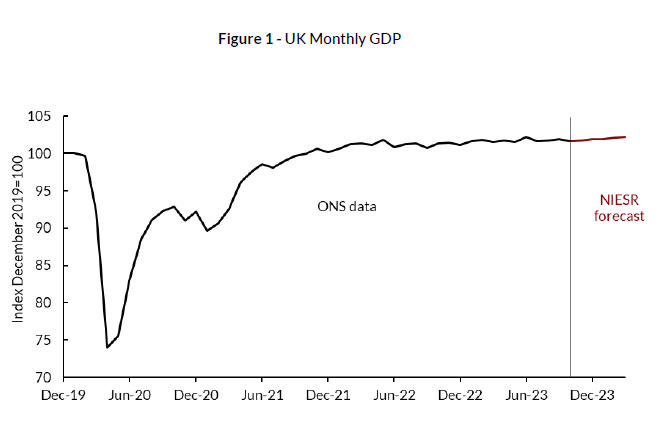
UK's GDP contracted by -0.3% mom in October, a figure that is notably worse than the expected -0.1% mom. The primary factor contributing to this downturn was the decline in services output, which fell by -0.2% mom. Additionally, production output experienced a sharper drop of -0.8% mom, and construction output also saw a contraction of -0.5% mom.
When examining the three-month period leading up to October, UK's real GDP showed no growth compared with the three months leading to July. During this quarter, while services output saw a marginal growth of 0.1%, both production and construction outputs declined, falling by -0.7% and -0.3%, respectively.
NIESR: BoE may cut rates earlier due to subdued growth
NIESR forecasts that UK's GDP will remain flat Q3. An early prediction for Q1 of 2024 indicates a modest GDP growth of 0.3%, primarily driven by the services sector. NIESR noted that these projections align with UK's long-term trend of low but stable economic growth.
Today's subdued GDP data, as suggested by NIESR, might be interpreted as a sign by BoE that "no further monetary tightening is needed". This could pave the way for BoE to "start cutting interest rates earlier than previously expected", depending on future inflation trends.
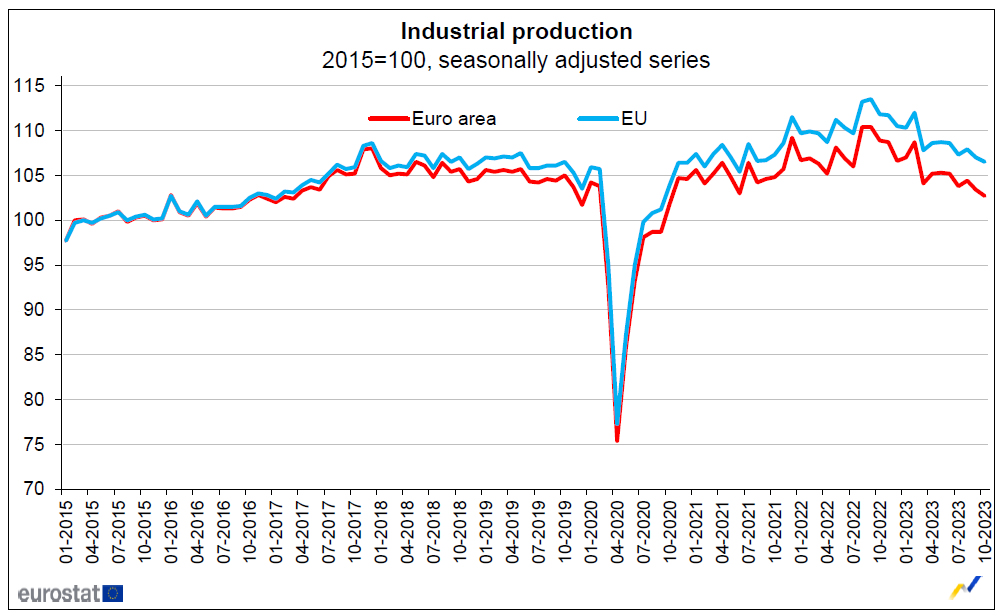
Eurozone industrial production falls -0.7% mom in Oct, EU down -0.5% mom
Eurozone industrial production fell -0.7% mom in October, worst than expectation of -0.3% mom. Production of capital goods fell by -1.4%, intermediate goods and non-durable consumer goods both by -0.6%, while production of durable consumer goods grew by 0.2% and energy by 1.1%.
EU industrial production declined -0.5% mom. Among Member States for which data are available, the largest monthly decreases were registered in Ireland (-7.0%), Malta (-2.5%) and the Netherlands (-2.1%). The highest increases were observed in Greece (+6.0%), Portugal (+3.8%) and Czechia (+2.9%).
SECO downgrades 2024 Swiss growth outlook
Swiss State Secretariat for Economic Affairs has revised down its 2024 economic growth forecast for Switzerland, now expecting a growth of 1.1% instead of previous 1.2%. This revision indicates an expectation of below-average growth for the Swiss economy for a second consecutive year. A key factor influencing this outlook is the expected slow growth in the eurozone in 2024, which is anticipated to impact Swiss exports.
Looking ahead to 2025, SECO forecasts an economic recovery with growth projected at 1.7%, driven by a gradual global economic rebound. On the inflation front, SECO anticipates deceleration from 2.1% in 2023 (revised down from 2.2%) to 1.9% in 2024, followed by a further reduction to 1.1% in 2025.
SECO's report also underscores several considerable risks to the economic outlook. Ongoing conflict in the Middle East poses geopolitical risks that could lead to surge in oil prices and, consequently, higher inflation. Additionally, the report warns of possibility of tighter international monetary policy in response to sustained core inflation.
Other highlighted risks include global debt, potential market corrections in real estate and finance, and balance sheet vulnerabilities at financial institutions. Further, economic developments in Germany and China are noted as potential risks for the international economy that could adversely affect Swiss foreign trade.
Energy security remains a concern for Switzerland. Significant energy shortage in Europe, leading to widespread production stoppages and a severe economic downturn, could push Switzerland into a recession coupled with high inflation.
Japan's Tankan manufacturing index rose to 12, highest in nearly 2 years
Japan's Tankan survey for Q4 show signs of strength in both manufacturing and non-manufacturing sectors. Yet, the cautious outlook among manufacturers suggests uncertainty about future economic conditions.
Large Manufacturing Index rose from 9 to 12, surpassing the expected figure of 10. This increase marks the third consecutive quarter of improvement and the highest level since Q1 2022. The Non-Manufacturing Index also showed positive development, rising from 27 to 30, exceeding the forecast of 27. This improvement represents the seventh consecutive quarter of growth, reaching its highest point since 1991.
However, the outlook for the next three months tells a different story. Large Manufacturing Outlook Index fell from 10 to 8, falling short of the expected 9, indicating less optimism among manufacturers for the near future. In contrast, Non-Manufacturing Outlook Index did improve from 21 to 24, yet it missed the anticipated mark of 25.
In terms of capital expenditure, big firms in Japan are projecting an increase of 13.5% for the current fiscal year ending in March 2024. This projection is more optimistic than the median market forecast, which anticipated a 12.4% increase.
ADB raises 2023 growth forecast, driven by stronger performance in China and India
Asian Development Bank upgrades growth forecasts Developing Asia for 2023, raising projection from 4.7% to 4.9%. This upgrade is primarily attributed to stronger than expected growth in two of the region's largest economies, China and India. On the other hand, growth forecast for 2024 remains unchanged at 4.8%.
Specifically, for China, ADB now projects growth to reach 5.2% in 2023, an increase from previous forecast of 4.9% made in September. Growth rate for China in 2024 is expected to slow to 4.5%, unchanged from prior predictions. In contrast, India's growth forecast for 2023 is raised from 6.3% to 6.7%, and the country is anticipated to maintain this robust growth rate of 6.7% in 2024.
In terms of inflation, ADB made slight adjustments to its forecasts for Developing Asia. Inflation expectation for 2023 is reduced from 3.6% to 3.5%, while forecast for 2024 sees a minor increase from 3.5% to 3.6%.
ADB, in its release, highlighted several downside risks to these forecasts. Key among these are the potential for "higher-for-longer interest rates in advanced economies," which could lead to financial instability. Additionally, potential supply disruptions from factors like El Niño and the ongoing Russian invasion of Ukraine pose risks of renewing energy and food security challenges, which could reignite inflationary pressures.
USD/JPY Mid-Day Outlook
Daily Pivots: (S1) 144.74; (P) 145.47; (R1) 146.19; More...
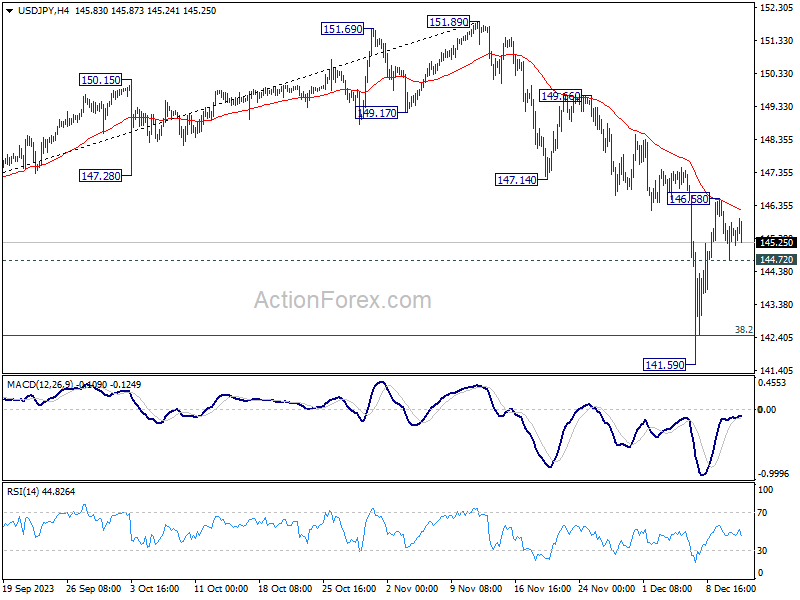
Intraday bias in USD/JPY remains neutral, and outlook stays bearish with 147.14 support turned resistance intact. On the downside, break of 144.72 minor support will suggest that rebound from 141.59 has completed at 146.58. Intraday bias will then be back on the downside for retesting 141.59 low. However, decisive break of 147.14 will dampen the bearish view, and bring stronger rally back towards 149.56/151.89 resistance zone.
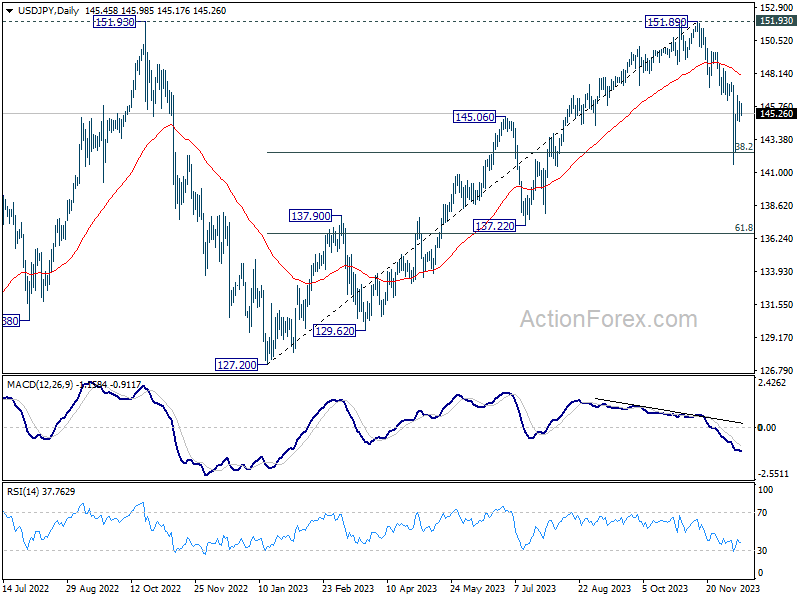
In the bigger picture, current fall from 151.89 is seen as the third leg of the corrective pattern from 151.93 (2022 high). Deeper decline would be seen through 38.2% retracement of 127.20 to 151.89 at 142.45 to 61.8% retracement at 136.63. This will now remain the favored as long as 147.14 support turned resistance holds.
Economic Indicators Update
| GMT | Ccy | Events | Actual | Forecast | Previous | Revised |
|---|---|---|---|---|---|---|
| 23:50 | JPY | Tankan Large Manufacturing Index Q4 | 12 | 10 | 9 | |
| 23:50 | JPY | Tankan Large Manufacturing Outlook Q4 | 8 | 9 | 10 | |
| 23:50 | JPY | Tankan Non - Manufacturing Index Q4 | 30 | 27 | 27 | |
| 23:50 | JPY | Tankan Non - Manufacturing Outlook Q4 | 24 | 25 | 21 | |
| 23:50 | JPY | Tankan Large All Industry Capex Q4 | 13.50% | 12.40% | 13.60% | |
| 07:00 | GBP | GDP M/M Oct | -0.30% | -0.10% | 0.20% | |
| 07:00 | GBP | Industrial Production M/M Oct | -0.80% | -0.10% | 0.00% | |
| 07:00 | GBP | Industrial Production Y/Y Oct | 0.40% | 1.10% | 1.50% | |
| 07:00 | GBP | Manufacturing Production M/M Oct | -1.10% | 0.00% | 0.10% | |
| 07:00 | GBP | Manufacturing Production Y/Y Oct | 0.80% | 1.90% | 3.00% | |
| 07:00 | GBP | Goods Trade Balance (GBP) Oct | -17.0B | -14.1B | -14.3B | |
| 08:00 | CHF | SECO Economic Forecasts | ||||
| 10:00 | EUR | Eurozone Industrial Production M/M Oct | -0.70% | -0.30% | -1.10% | -1.00% |
| 13:30 | USD | PPI M/M Nov | 0.00% | 0.10% | -0.50% | -0.40% |
| 13:30 | USD | PPI Y/Y Nov | 0.90% | 1.00% | 1.30% | 1.20% |
| 13:30 | USD | PPI Core M/M Nov | 0.00% | 0.20% | 0.00% | |
| 13:30 | USD | PPI Core Y/Y Nov | 2.00% | 2.20% | 2.40% | |
| 15:30 | USD | Crude Oil Inventories | -1.9M | -4.6M | ||
| 19:00 | USD | Fed Interest Rate Decision | 5.50% | 5.50% | ||
| 19:30 | USD | FOMC Press Conference |
US PPI at 0.0% mom, 0.9% yoy in Nov
US PPI for final demand was unchanged at 0.0% mom in November, below expectation of 0.1% mom. Both indexes for final demand goods and services were unchanged. PPI less foods, energy, and trade services edged up by 0.1% mom.
For the 12 months period, PPI slowed from 1.2% yoy to 0.9% yoy, below expectation of 1.0% yoy. PPI less foods, energy and trade services slowed from 2.8% yoy to 2.5% yoy.
NIESR: BoE may cut rates earlier due to subdued growth
NIESR forecasts that UK's GDP will remain flat Q3. An early prediction for Q1 of 2024 indicates a modest GDP growth of 0.3%, primarily driven by the services sector. NIESR noted that these projections align with UK's long-term trend of low but stable economic growth.
Today's subdued GDP data, as suggested by NIESR, might be interpreted as a sign by BoE that "no further monetary tightening is needed". This could pave the way for BoE to "start cutting interest rates earlier than previously expected", depending on future inflation trends.
NZD/USD Slips Ahead of GDP, Fed Meeting
- New Zealand GDP expected to decelerate
- US inflation ticks lower
- Fed widely expected to pause
The New Zealand dollar is sharply lower in Wednesday trade. In the European session, NZD/USD is trading at 0.6095, down 0.61%.
US inflation ticks lower, all eyes on Fed
US inflation ticked lower in October as expected and the release was a non-event for the markets, which slightly reduced their rate-cut pricing. Headline CPI climbed 3.1% year-on-year in November, down from 3.2% in October and in line with the market estimate of 3.1%. Core CPI, which is considered a more reliable gauge of inflation trends, climbed 4.0% year-on year in November, unchanged from October. This matched the market estimate of 4.0%.
On a monthly basis, both CPI and Core CPI ticked higher. CPI came in at 0.1%, up from 0.0% in October and the core rate also rose from 0.2% to 0.3%. Both readings matched the market estimates. A decline in gasoline prices helped pull down inflation. However, a wide range of goods and services experienced price increases, suggesting that underlying inflation remains sticky.
Today’s FOMC meeting could provide clues as to what the Fed has in mind in the New Year. The markets have priced in a pause today at close to 100%, so the focus will be the rate statement and Jerome Powell’s post-meeting press conference. If Powell is hawkish and pushes back against rate cuts, it could force the market to again reduce rate cut expectations.
New Zealand GDP expected to decelerate to 0.2%
New Zealand releases GDP for the third quarter on Thursday, with expectations for a weak gain of 0.2% q/q, compared to a sharp gain in Q2 of 0.9%. On an annualized basis, the market consensus stands at 0.5%, following a 1.8% gain in the second quarter. An unexpected reading could have a strong impact on the direction of the New Zealand dollar.
NZD/USD Technical
- NZD/USD is putting pressure on support at 0.6076. Below, there is support at 0.6031
- There is resistance at 0.6150 and 0.6195
Can Fed Deliver This Year’s Santa Rally? Is UK at Risk of Recession?
We're seeing some caution in the markets this week and that is particularly true today, with Europe trading broadly flat and US futures pointing to a similar start on Wall Street.
The final Fed meeting of the year could also be the most eventful, with the central bank likely to acknowledge it's done with tightening and even signal rate cuts next year. The question is how many, with markets now pricing in four starting in May.
The interest rate decision itself will almost certainly be straightforward - on hold - but with new economic forecasts, the dot plot, a statement, and the press conference to follow, there could be fireworks.
Investors love a Santa rally to see the year out and whether we do or not may well hang on how the central bank positions itself. Any acknowledgment of rate cuts next year could be well received, although only one may receive a cool response as that would suggest policymakers view it as coming very late in the year.
Traders may well shake on two as that would point to a third-quarter rate cut which seems odd as that still wouldn't be nearly as aggressively as markets are positioned but it's unlikely the Fed will pivot to the extent that it aligns with the very optimistic expectation currently priced into the markets. That isn't to say they won't get there over the next few months.
UK at risk of recession after disappointing October GDP reading
The UK economy got the fourth quarter off to a bad start, contracting by 0.3% in October from the month before. The UK economy is struggling under the pressure of higher interest rates and it seems wet weather compounded those challenges for retailers, encouraging consumers to stay indoors.
There's every chance spending bounces back in November and December, with the weather being less of a deterrent and households spending more ahead of the festive period. That said, they may well be looking at a more slimmed-down Christmas this year after two years of high inflation which could leave the economy at risk of recession.
Oil near 2023 lows amid economic pessimism
Oil prices are relatively flat on the day after coming under pressure again earlier in the session. They fell heavily again on Tuesday, with Brent losing close to 4%. Concerns around the global economy next year, a weak commitment to output cuts from OPEC+ and higher output elsewhere, including record levels in the US, is weighing heavily on prices into year-end, with Brent and WTI now not far from the lows of earlier this year.
Gold falls below $2,000 ahead of the Fed
Gold traders have seemingly not been too pleased with the US jobs and inflation data, pushing the yellow metal back below $2,000 ahead of the Fed announcement. This comes just over a week after it soared to record highs, albeit buoyed by very thin trade. It's since given back 50% of the gains from the early October lows to last week's new record high which highlights how optimistic traders were and how some of that enthusiasm has since faded.
Nasdaq 100: It’s All About Liquidity to Maintain Current Bullish Momentum
- Nasdaq 100 recent bullish trend has moved in synch with a significant improvement in the net US liquidity since late October 2023.
- The major liquidity contributor has been a significant drawdown in the Fed’s overnight reverse repo facility that negates the adverse effects of Quantitative Tightening (QT).
- Watch the 16,160 key short-term support ahead of Fed’s FOMC.
The tech-heavy Nasdaq 100 has continued its relentless uptrend after it failed to break below the highlighted downside trigger 15,690 level in our previous analysis and cleared above the 16,160 minor range resistance in place since 22 November 2023 on Monday, 11 December.
So far, the Nasdaq 100 has recorded a month-to-date gain of +2.55% in December that outperformed the S&P 500 (+1.66%) and Dow Jones Industrial Average (1.74%) except against the small-caps Russell 2000 (+3.99%) as of 12 December 2023.
On the surface, the ongoing optimism seen in the major US benchmark stock indices since late October 2023 seems to be primarily driven by an increasing expectation of a dovish US Federal Reserve in 2024; the CME FedWatch tool based on calculations from Fed funds futures pricing has indicated at least four interest rate cuts of 100 basis points (bps) to the Fed funds rate in 2024 with still a rather high chance of 43% for the first rate cut to come early in the March 2024 FOMC meeting despite a better than expected US non-farm payrolls data and a recent uptick in the services inflation year-on-year growth rate for November.
Improvement in net liquidity condition moves in sync with the current bullish trend of Nasdaq 100
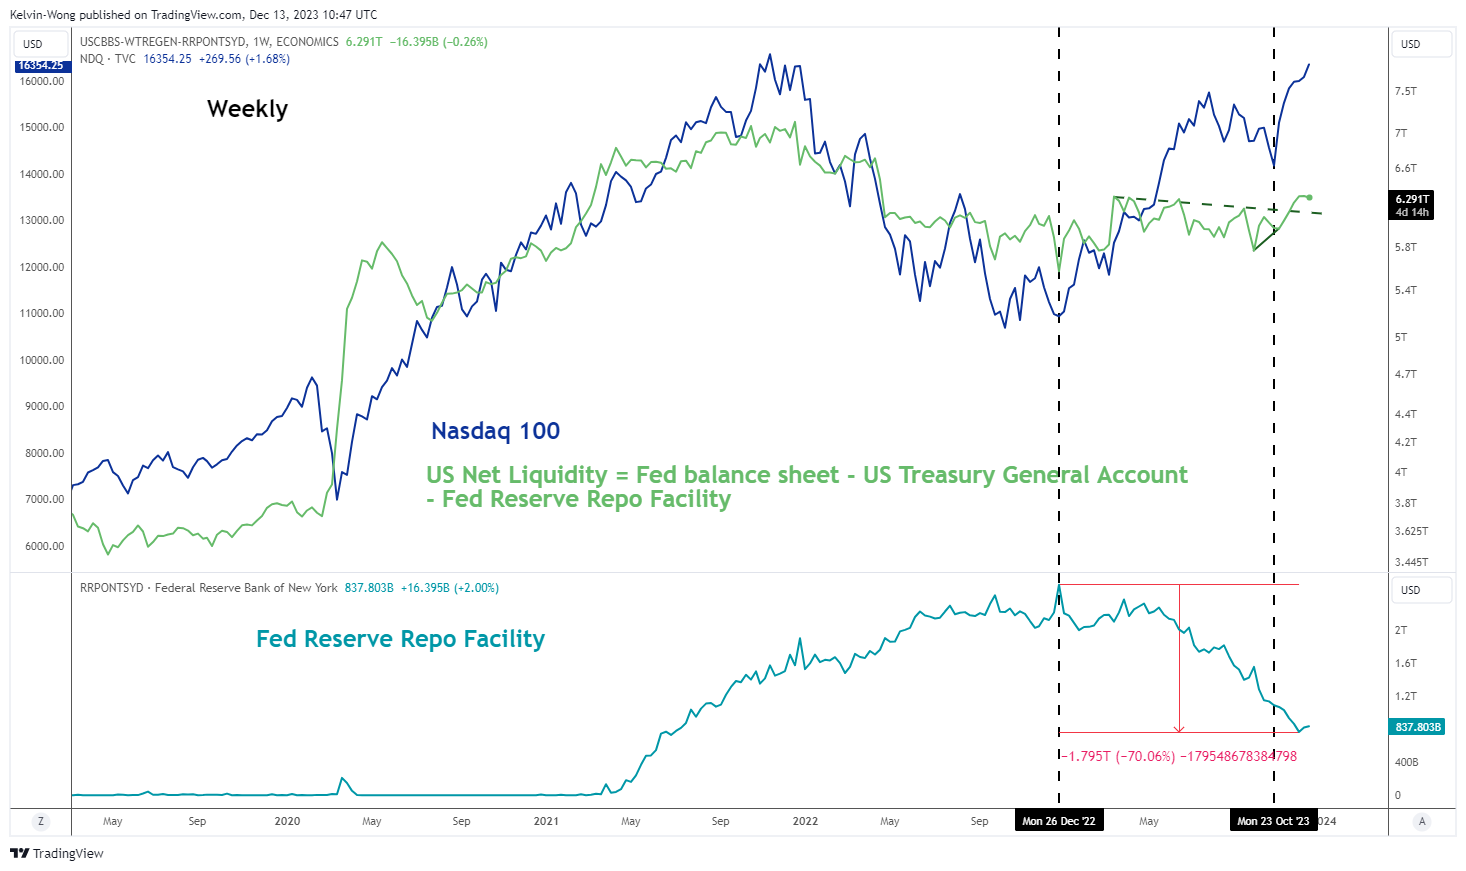
Fig 1: US net liquidity condition with Nasdaq 100 as of 13 Dec 2023 (Source: TradingView, click to enlarge chart)
On closer inspection, the short to medium-term uptrend phases in the Nasdaq 100 together with the rest of the US stock indices are driven by a significant improvement in the net liquidity condition (Fed’s balance sheet minus US Treasury general account & Fed reserve repo facility) since late October 2023.
The most glaring contribution has come from a huge fall in the Fed’s overnight reserve repo facility where US financial institutions such as money market funds park their excess cash with the Fed. Since its peak of US$2.55 trillion in December 2022, it has dwindled by around 70% to US$838.80 billion as of the week starting 11 December 2023. The net effect of lesser usage of such overnight reverse repo facility by money market funds that choose to invest their surplus cash in short-term US Treasury bills instead is likely to negate adverse effects from the ongoing Quantitative Tightening (QT) program enacted by the Fed (see Fig 1).
Watch the 16,160 key short-term support
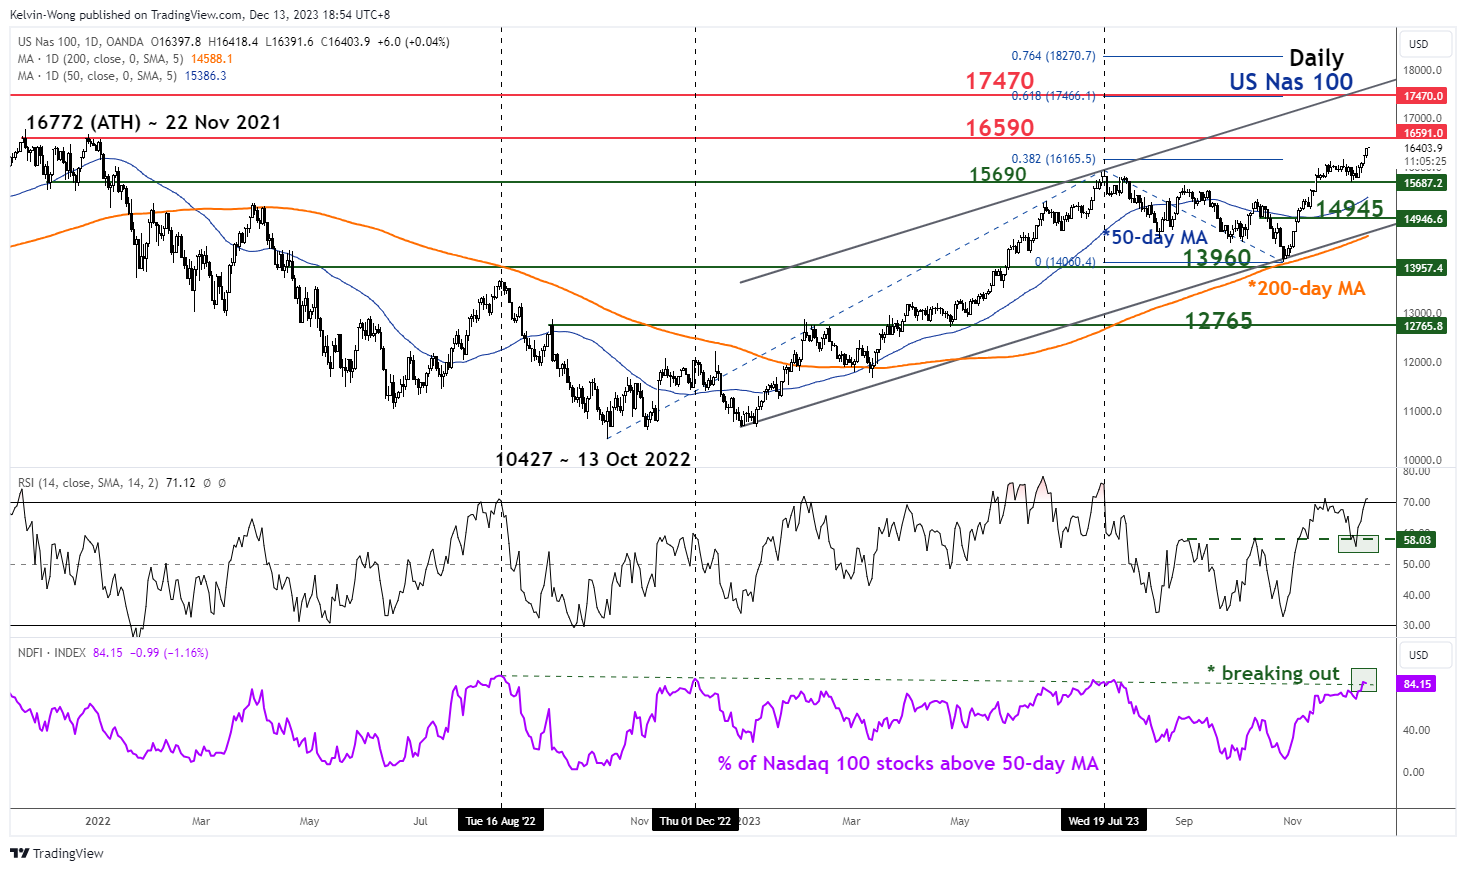
Fig 2: US Nas 100 medium-term trend as of 13 Dec 2023 (Source: TradingView, click to enlarge chart)
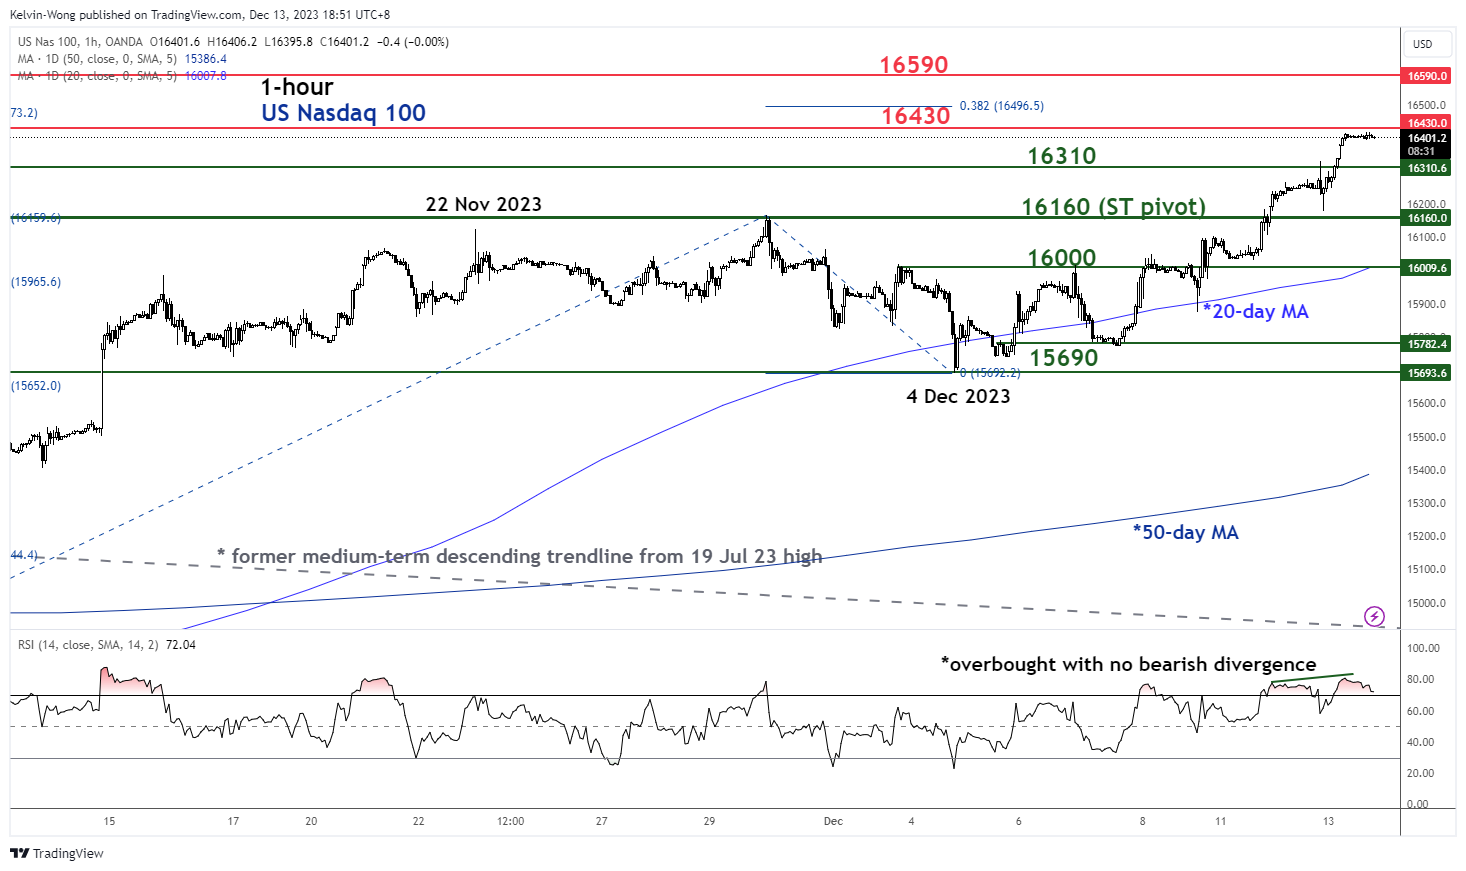
Fig 3: US Nas 100 minor short-term trend as of 13 Dec 2023 (Source: TradingView, click to enlarge chart)
In the run-up to today’s Fed FOMC, the price actions of the US Nas 100 Index (a proxy for the Nasdaq 100 futures) have continued to oscillate within a short-term minor uptrend phase in place since the 4 December 2023 low of 15,690.
Medium-term momentum and breadth readings have improved in the past week as the daily RSI indicator has tested and staged a rebound at a parallel support of 58. In addition, the percentage of Nasdaq 100 components stocks that are above their respective 50-day moving averages have inch higher towards 84%, a bullish breakout from its prior resistance hurdle.
If the 16,160 key short-term pivotal holds, the Index may see its next intermediate resistance coming in at 16,590 in the first step (the range top that comprises its current all-time high of 16,772 printed on 22 November 2021).
On the other hand, failure to hold at 16,160 negates the bullish tone for a deeper minor corrective pull-back to retest the 20-day moving average acting as the next intermediate support at 16,000.
UK Needs Lower Rates and a Weaker Currency
A series of macro statistics continue to be published to help build a picture of the economy ahead of the Bank of England’s final decision on Thursday. The economy is reported to have lost 0.3% for October, pulling back in volume to July levels.
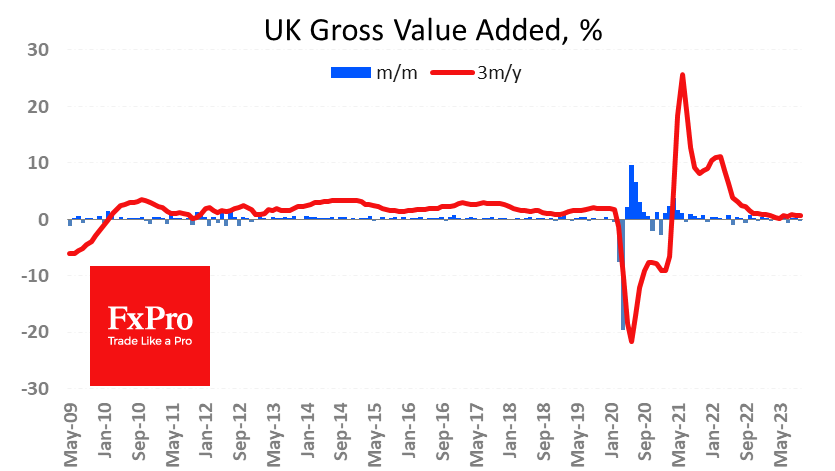
This is a wake-up call from industrial production and construction, which are considered leading indicators of the business cycle. The index of industrial production fell immediately by 0.8% in October (-0.1% was expected), and the nominal index rolled back close to plateau levels from the final quarter of last year. Industrial production is only 0.6% above post-pandemic lows. If we exclude the lockdown period, UK industrial production last saw such a low back in 2017.
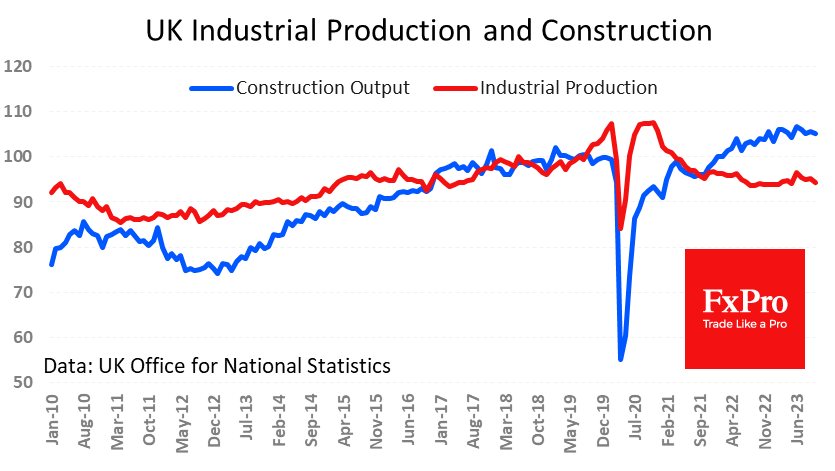
High interest rates are putting pressure on the industry. The strengthening of the pound against the euro by 4% and the dollar by 12% over the year is also not helping the economy. The combination of deteriorating global demand and the appreciating pound is suppressing exports, which were 24% lower in October than a year earlier. Imports are also falling in the wake of commodity and energy prices and are now 18% below their peak in August last year, but the year-on-year fall is a modest 6%.
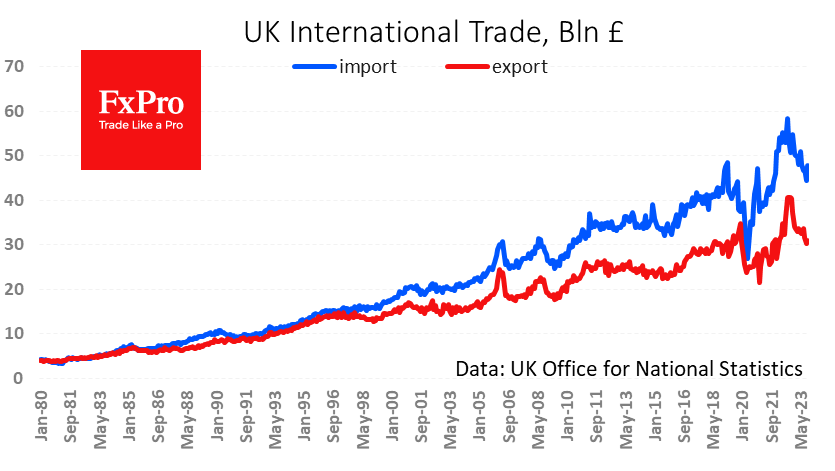
The UK economy needs stimulus in the form of a weaker GBP exchange rate, which would support the country’s global competitiveness and lower interest rates to boost production and domestic consumption. On the other hand, UK prices and wages are rising at the fastest rate among major economies, which prevents the Bank of England from its easing policy.
This combination of factors leaves the Bank of England no choice but to declare the end of the rate hike cycle and dutifully wait for the shrinking economy to bring inflation down to acceptable levels to start the easing policy.
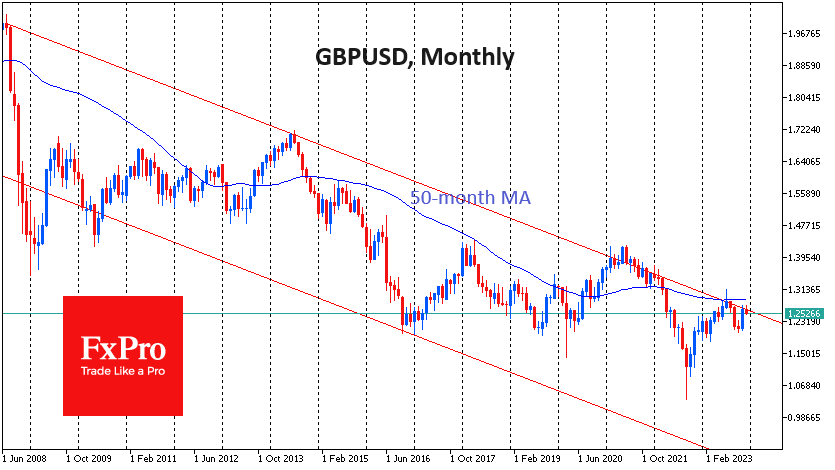
The British pound has a long-standing downward trend against the dollar, dating back to the times of the global financial crisis. In July and recent weeks, GBPUSD has made its way to resistance. Technically, we can see both a breakdown of this multi-year trend and a reversal to growth, as well as the formation of a powerful downward impulse. The latest macroeconomic data package gives more chances for the second – a pessimistic – scenario.
EUR/USD, GBP/USD, USD/JPY Analysis: Dollar Falling ahead of Fed Report
At the upcoming meeting, the American department is not expected to take steps aimed at changing monetary parameters. At the same time, officials will likely abandon overly hawkish or dovish rhetoric and focus on incoming macroeconomic data. November inflation statistics were published yesterday: as expected, the rate of growth in consumer prices accelerated from 0.0% to 0.1% in monthly terms and slowed down from 3.2% to 3.1% in annual terms, and the figure does not take into account prices for food and energy adjusted from 0.2% to 0.3%. During the day, November statistics on manufacturing inflation will be published in the US: forecasts suggest a further slowdown in annual dynamics from 1.3% to 1.0%, while in monthly terms the indicator may show an increase of 0.1% after -0.5% in the previous month.
EUR/USD
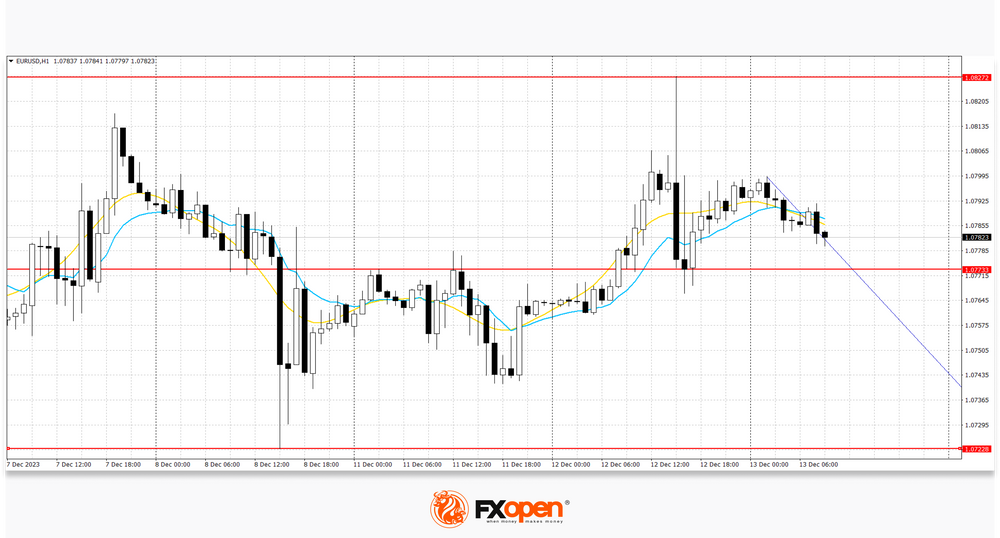
The EUR/USD pair shows mixed trading dynamics, consolidating near the 1.0785 mark. According to the EUR/USD technical analysis, immediate resistance can be seen at 1.0822, a break higher could trigger a move towards 1.0842. On the downside, immediate support is seen at 1.0750, a break below could take the pair towards 1.0695.
Market activity remains subdued as market participants are hesitant to open new positions ahead of the US Federal Reserve's interest rate decision. The ECB will meet on Thursday. It is assumed that the regulator will also not change the parameters of monetary policy, but will indicate further maintaining the key interest rate at 4.50% for a long time. Today, investors will pay attention to the October statistics on industrial production in the eurozone: the indicator is expected to decline by 0.3% after -1.1% in the previous month, and in annual terms it may change from -6.9% to -4.6%.
During the week, a trading range formed with boundaries of 1.0723 and 1.0827. Now, the price has moved away from the upper limit and may continue to decline.
GBP/USD
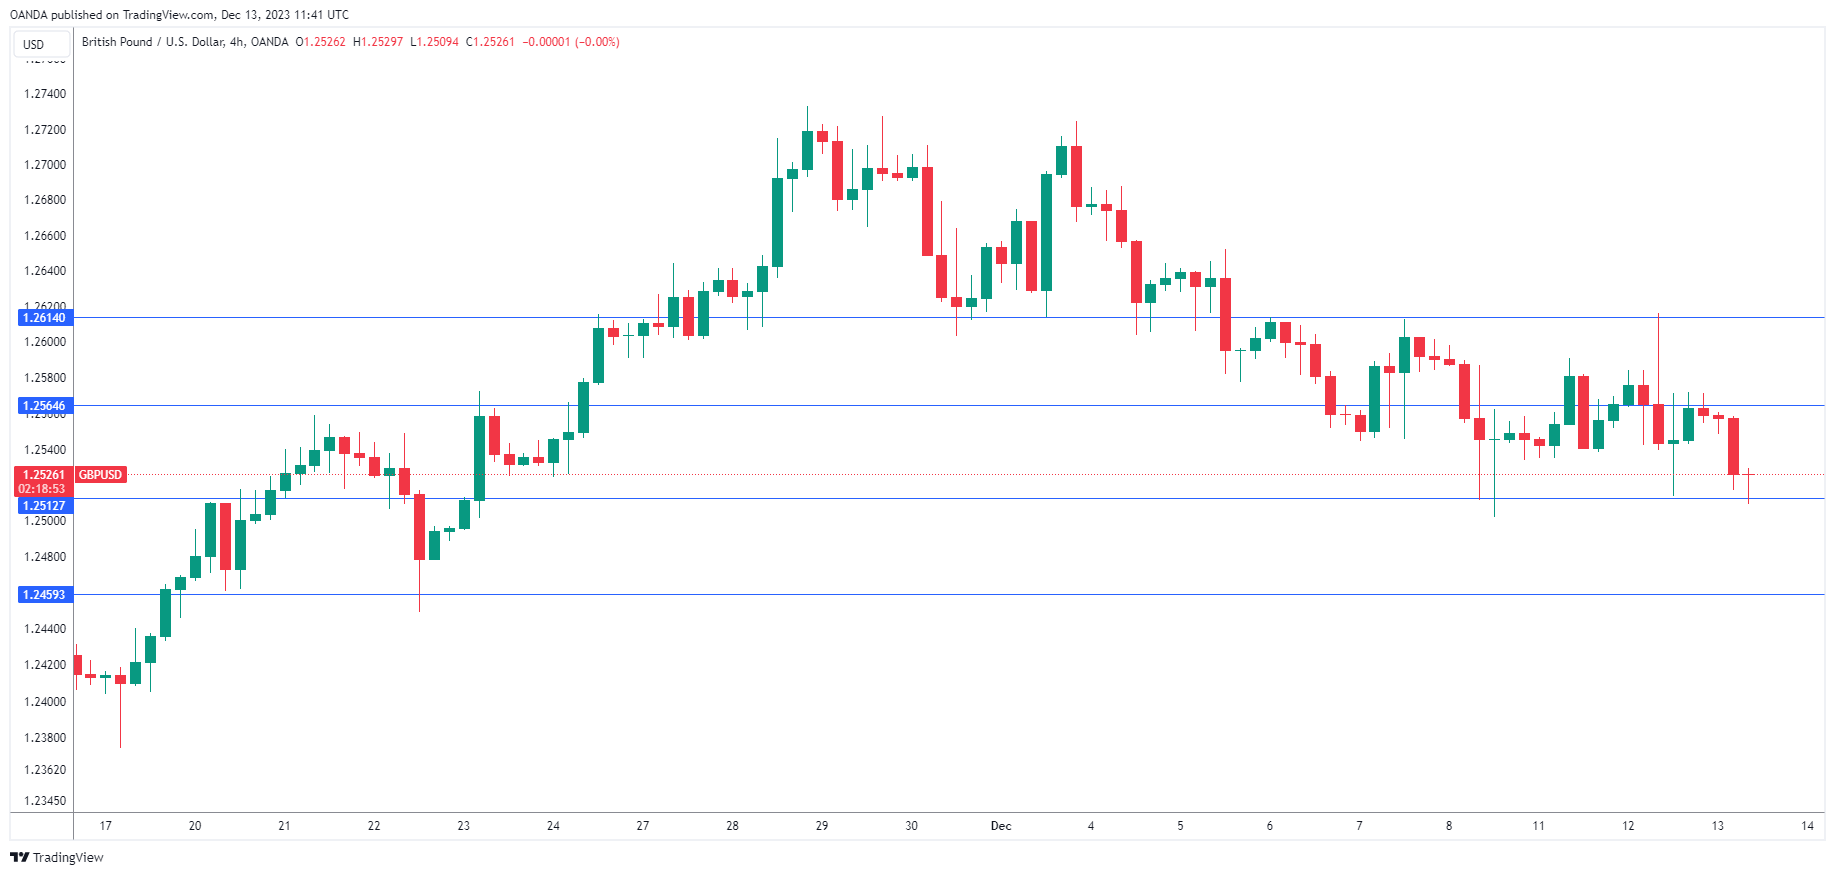
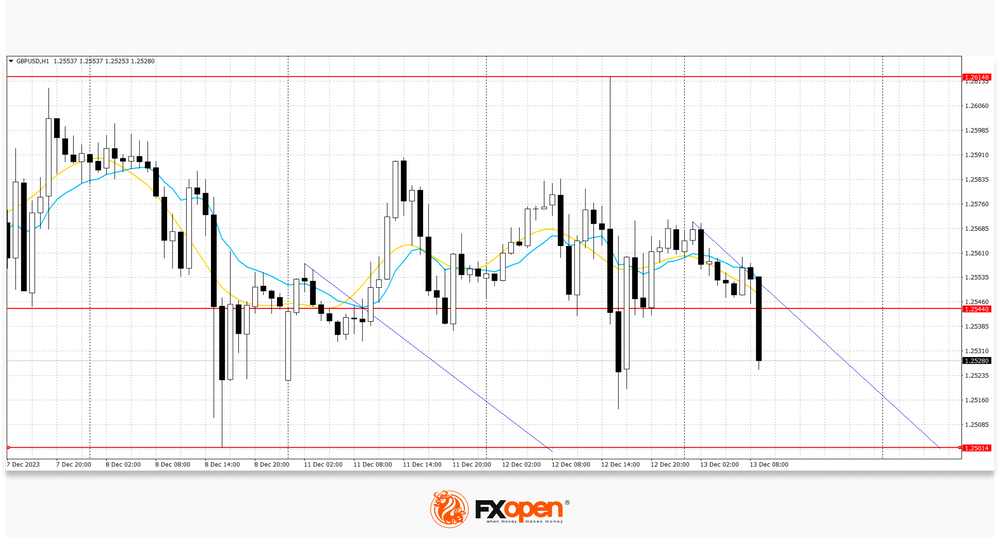
On the GBP/USD chart, the pair is declining slightly, testing the 1.2545 mark for a breakdown downwards. Immediate resistance can be seen at 1.2604, a break higher could trigger a rise towards 1.2614. On the downside, immediate support is seen at 1.2505, a break below could take the pair towards 1.22427.
Labour market data put some pressure on the pound the day before: the number of applications for unemployment benefits in November increased from 8.9k to 16.0k, while analysts expected 20.3k, the employment level in October adjusted from 54.0k to 50.0k, and unemployment remained at 4.2%. At the same time, the average salary excluding bonuses in October decreased from 7.8% to 7.3%, which turned out to be slightly lower than market expectations of 7.4%. The slowdown in wage growth indirectly indicates a further weakening of inflationary pressure in the country, which may push the Bank of England to more decisive actions aimed at easing monetary policy. However, analysts do not yet predict a quick softening of the British regulator’s position, emphasising that it may begin to lower interest rates after the US Federal Reserve and the ECB.
Today, the focus of investors' attention is on statistics on UK GDP dynamics. The national economy slowed by 0.3% in October after growing by 0.2% in the previous month, with expectations at -0.1%. In addition, industrial production volumes decreased by 0.8% after zero dynamics in September with a forecast of -0.1%, and in annual terms the dynamics slowed from 1.5% to 0.4%, while analysts expected 1.1%.
Since the end of last week, a range of prices has formed with boundaries of 1.2500 and 1.2615. Now, the price is at the bottom of the range and may continue to decline.
USD/JPY
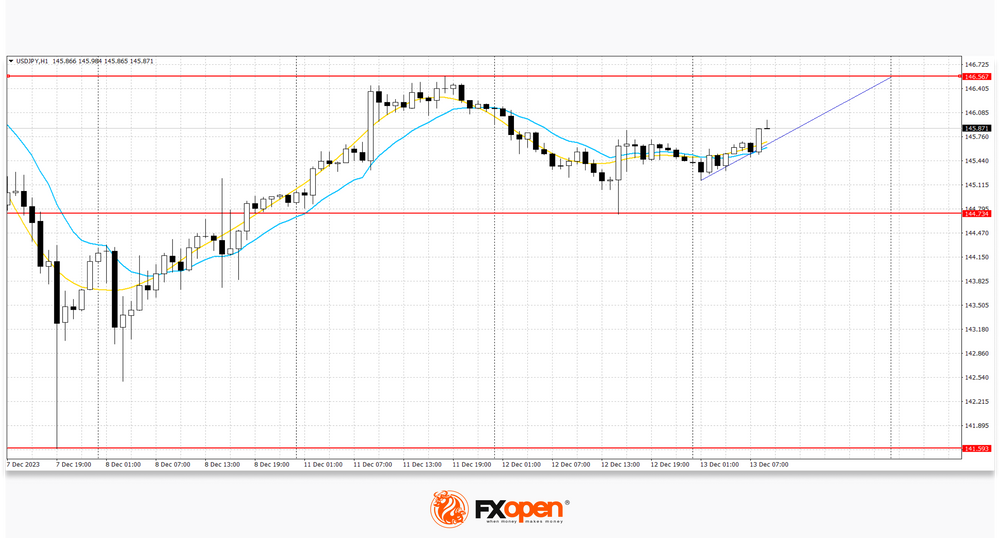
On the USD/JPY chart, the pair shows slight growth, testing the 145.60 mark for an upward breakout. Strong resistance can be seen at 146.60, a break higher could trigger a rise towards 146.57. On the downside, immediate support is seen at 144.44. A break below could take the pair towards 144.00.
Investors are in no hurry to open new positions, despite active trading at the beginning of the week, preferring to wait for the US Federal Reserve's decision on interest rates, as well as updated forecasts regarding the vector of monetary policy for the coming years. The yen is moderately supported today by publications from Japan: the Tankan index of business activity for large enterprises of all industries in the fourth quarter decreased from 13.6% to 13.5%, while analysts expected 12.4%, the indicator of business conditions for large enterprises rose from 9.0 points to 12.0 points with a forecast of 10.0 points, and in the services sector - from 27.0 points to 30.0 points. Bloomberg analysts are confident that the Bank of Japan will continue its policy of negative interest rates, keeping the rate at -0.10%, since the regulator did not see sufficient evidence of wage growth to justify persistent inflation. Most likely, officials will keep the parameters of monetary stimulus unchanged at the meeting on December 19, despite investors' expectations of a change in course. Such rhetoric will continue to put pressure on the yen's position.
The previous range of prices remains with the boundaries of 141.60 and 147.50. The price is currently at the top of the range and may continue to rise.
This article represents the opinion of the Companies operating under the FXOpen brand only. It is not to be construed as an offer, solicitation, or recommendation with respect to products and services provided by the Companies operating under the FXOpen brand, nor is it to be considered financial advice.
WTI Oil: Hits the Lowest Levels in Nearly Six Months Ahead of FOMC Decision
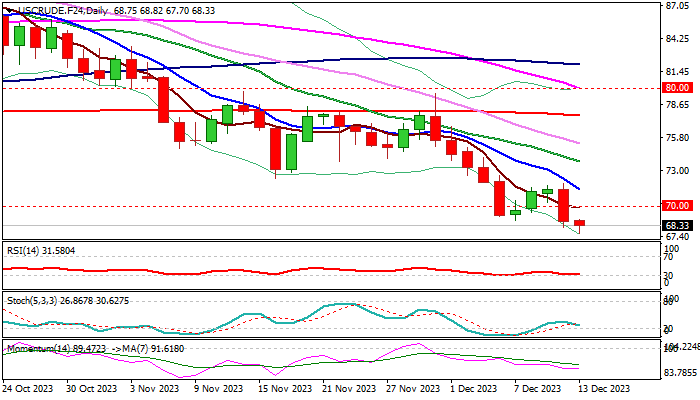
WTI oil price hit new multi-month low on Wednesday morning, in extension of Tuesday’s nearly 4% drop which fully reversed recovery of past three days.
Larger bears regained full control after limited correction and signal continuation of broader downtrend from 2023 peak ($95.00, posted on Sep 28).
Higher than expected US inflation numbers for November weighed on growing hopes that the Fed will start cutting rates early next year and sparked fresh acceleration lower, adding to concerns about global demand.
Markets also focus on Feds decision (due later today) which is expected to provide fresh direction signals, with more hawkish than expected stance to further boost bears
Bears look for weekly close below psychological $70 (reinforced by 200WMA) support for the first in six months, which would open way for test of a base at $67.00 (May/June) and 2023 low at $63.63 (Apr 30).
Upticks should ideally stay capped under $70 and not exceed falling 10DMA ($71.36) to keep bears intact.
Res: 68.79; 70.00; 71.36; 71.93.
Sup: 67.70; 67.02; 66.39; 65.65.
Eurozone industrial production falls -0.7% mom in Oct, EU down -0.5% mom
Eurozone industrial production fell -0.7% mom in October, worst than expectation of -0.3% mom. Production of capital goods fell by -1.4%, intermediate goods and non-durable consumer goods both by -0.6%, while production of durable consumer goods grew by 0.2% and energy by 1.1%.
EU industrial production declined -0.5% mom. Among Member States for which data are available, the largest monthly decreases were registered in Ireland (-7.0%), Malta (-2.5%) and the Netherlands (-2.1%). The highest increases were observed in Greece (+6.0%), Portugal (+3.8%) and Czechia (+2.9%).