Sample Category Title
AUD/USD Daily Report
Daily Pivots: (S1) 0.6551; (P) 0.6567; (R1) 0.6584; More...
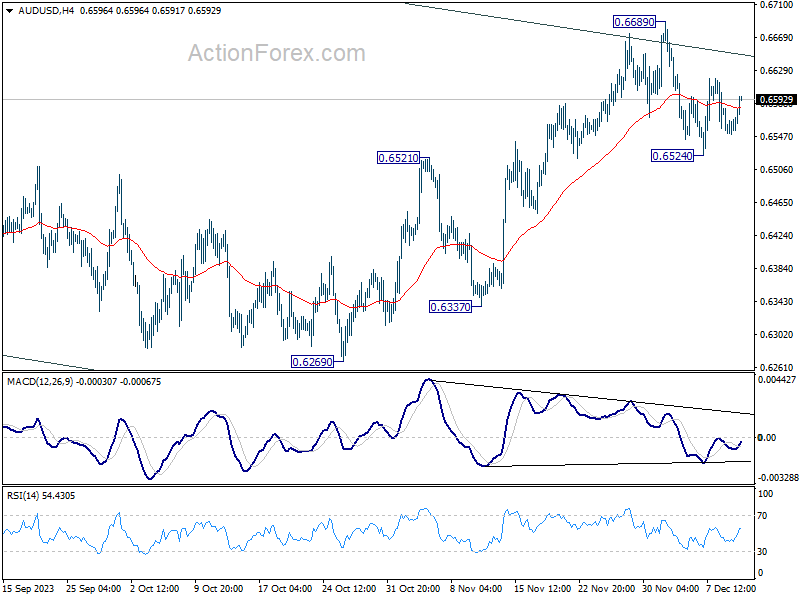
AUD/USD recovers today but stays inside range below 0.6689. Intraday bias remains neutral for the moment, and risk stays mildly on the downside. Break of 0.6524 will affirm the case of rejection by channel resistance, and resume the fall from 0.6689 short term top to 55 D EMA (now at 0.6500) and below. Nevertheless, firm break of 0.6689 will resume the rise from 0.6269 instead.
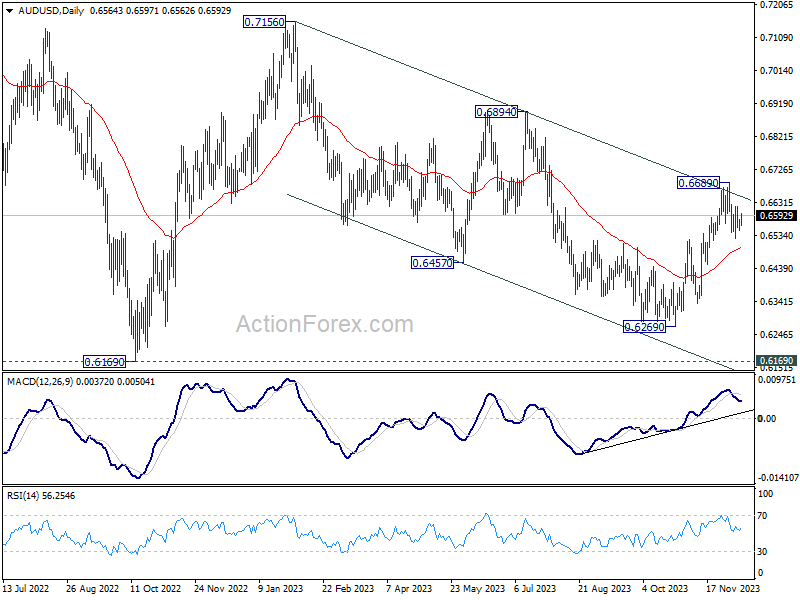
In the bigger picture, there is no confirmation that down trend from 0.8006 (2021 high) has completed. Price actions from 0.6169 (2022 low) could be just a medium term corrective pattern, with fall from 0.7156 as the second leg. For now, range trading should be seen between 0.6169 and 0.7156 (2023 high), until further developments.
Dollar Softens Mildly ahead of US CPI, Aussie Gains as China Relaxes Some Trade Sanctions
Dollar softens slightly in today's Asian session, as the global markets await forthcoming US consumer inflation data. Headline CPI is anticipated to show a modest deceleration to 3.2% in November, while core CPI is expected to remain stubbornly high at 4%. Fed's mandate to bringing inflation down to its 2% target necessitates a persistent slowdown in core inflation through the tough "last mile". Absent this, interest rates will either be maintained at their current elevated levels "for longer" or potentially be increased further. This context amplifies the importance of today's data as well as tomorrow's FOMC rate decision and the accompanying economic projections, which are poised to be major catalysts in the financial markets.
In stark contrast, Yen, Australian Dollar, and New Zealand Dollar have emerged as the stronger currencies in the session, each buoyed by distinct factors. Japanese Yen has halted its recent pullback from last week's strong rally, seemingly unaffected by data showing continued slowdown in Japan's wholesale inflation. The near-term trading range for Yen seems to be established, with future movements to be influenced by BoJ's policy decision scheduled for next week.
Australian Dollar, meanwhile, received a boost from positive trade news. China's decision to lift suspensions on three Australian abattoirs, part of a broader easing of trade sanctions, has been interpreted as a sign of further thawing in the previously tense economic relations due to political disagreements. However, it's crucial to note that restrictions still apply to several other Australian abattoirs and key exports like red wine, lobster, and meat, indicating that some trade challenges persist.
European major currencies display mixed performance in today's session. Euro and Swiss Franc are showing signs of softness, whereas Sterling is gaining a little strength. These currencies are currently positioned in a holding pattern, awaiting the outcome of this week's pivotal policy decisions by ECB, SNB and BoE.
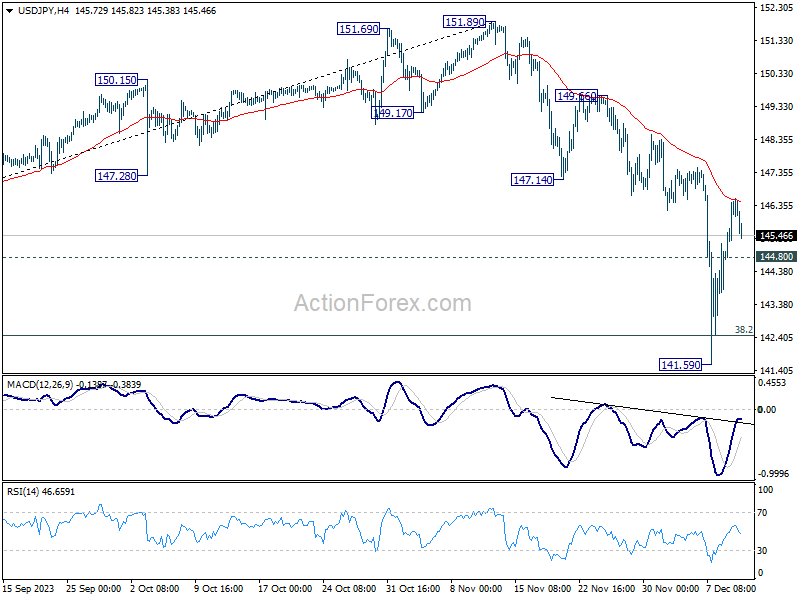
From a technical analysis standpoint, after initial rejection by 55 4H EMA (now at 146.46) focus is back on 144.80 minor support in USD/JPY. Break there will bring deeper decline towards 141.59, as the second leg of a near term consolidation pattern.
In Asia, at the time of writing, Nikkei is up 0.26%. Hong Kong HSI is up 0.62%. China Shanghai SSE is up 0.03%. Singapore Strait Times is up 0.36%. Japan 10-year JGB yield is down -0.0408 at 0.738. Overnight, DOW rose 0.43%. S&P 500 rose 0.39%. NASDAQ rose 0.20%. 10-year yield fell -0.006 to 4.239.
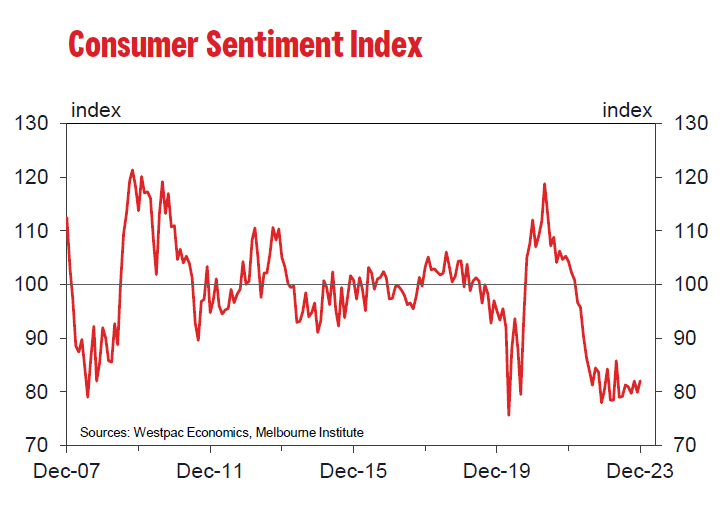
Australia's Westpac consumer sentiment rose to 82.1, still far from upbeat
The latest release from Australia reveals a modest uptick in Westpac Consumer Sentiment Index, which rose by 2.7% mom to 82.1 in December. Despite this increase, Westpac's analysis describes the sentiment as "still very weak," emphasizing that "consumers remain far from upbeat."
Regarding RBA's next meeting on February 5-6, Westpac said, the "there is now a higher bar" to further tightening. It highlights the "subdued growth profile" and a "particularly weak household sector" underscored by the recent consumer sentiment results, suggesting that these factors might raise the threshold for another rate hike.
However, it's important to note the central bank's stance towards inflation. RBA has expressed a "very low tolerance for any upside surprises" in inflation rates, making the upcoming inflation data and the detailed quarterly release, due in late January, pivotal for February policy decision.
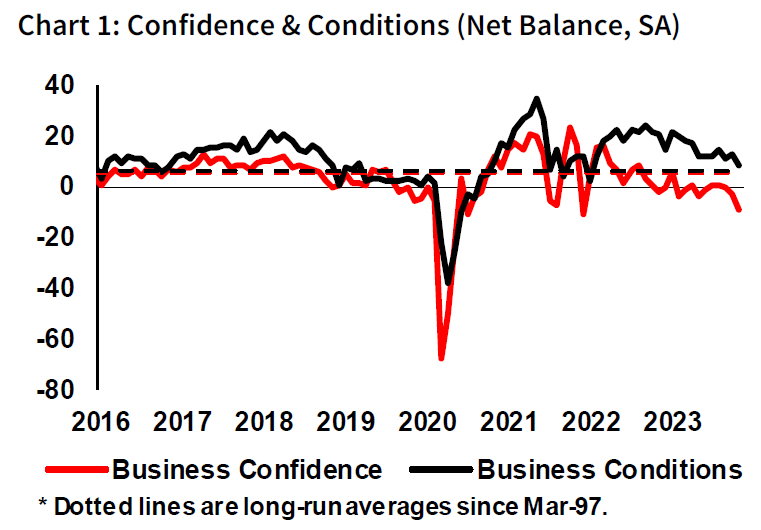
Australia's NAB business confidence and conditions decline, signaling continued soft growth
Australia NAB Business Confidence fell from -3 to -9 in November. Business Conditions fell from 13 to 9. Trading conditions fell from 19 to 13. Profitability conditions fell from 11 to 6. Employment conditions were unchanged at 8.
NAB Chief Economist Alan Oster remarked, "Both confidence and conditions declined in the month and after a period of relative stability through mid-2023 appear to be softening further." He pointed out that, excluding the pandemic period, business confidence is at its weakest since around 2012. This was a time characterized by significantly weaker conditions and slowing growth in advanced economies.
Despite these declines, Oster noted that business conditions remain above average, reflecting their strong starting point. He emphasized the importance of monitoring whether this drop in confidence continues and if a trend develops in business conditions. For the moment, these indicators suggest "ongoing soft growth in Q4".
Japan's PPI slows to weakest pace since February 2021
Japan's PPI slowed notably from 0.9% yoy to 0.3% yoy in November, but beat expectation of 0.1% yoy. That's nonetheless still the weakest pace since February 2021. November marked the 11th straight month in which the pace slowed.
Export prices was unchanged at 0.9% yoy. Import price decline slowed from -12.7% yoy to -9.7% yoy, staying negative for the eighth month.
During the month, PPI rose 0.2% mom. Import prices rose 0.7% mom. Export prices fell -0.2 %Mom.
Producer price growth stayed below the most recent consumer inflation reading for a third month. Growth in consumer prices excluding fresh food inched up to 2.9% in October.
Looking ahead
UK employment data and Germany ZEW economic sentiment are the main focus in European session. US CPI will take center stage later in the day.
AUD/USD Daily Report
Daily Pivots: (S1) 0.6551; (P) 0.6567; (R1) 0.6584; More...
AUD/USD recovers today but stays inside range below 0.6689. Intraday bias remains neutral for the moment, and risk stays mildly on the downside. Break of 0.6524 will affirm the case of rejection by channel resistance, and resume the fall from 0.6689 short term top to 55 D EMA (now at 0.6500) and below. Nevertheless, firm break of 0.6689 will resume the rise from 0.6269 instead.
In the bigger picture, there is no confirmation that down trend from 0.8006 (2021 high) has completed. Price actions from 0.6169 (2022 low) could be just a medium term corrective pattern, with fall from 0.7156 as the second leg. For now, range trading should be seen between 0.6169 and 0.7156 (2023 high), until further developments.
Economic Indicators Update
| GMT | Ccy | Events | Actual | Forecast | Previous | Revised |
|---|---|---|---|---|---|---|
| 23:30 | AUD | Westpac Consumer Confidence Dec | 2.70% | -2.60% | ||
| 23:50 | JPY | PPI Y/Y Nov | 0.30% | 0.10% | 0.80% | 0.90% |
| 00:30 | AUD | NAB Business Confidence Nov | -9 | -2 | -3 | |
| 00:30 | AUD | NAB Business Conditions Nov | 9 | 13 | ||
| 07:00 | GBP | Claimant Count Change Nov | 20.3K | 17.8K | ||
| 07:00 | GBP | ILO Unemployment Rate (3M) Oct | 4.20% | 4.20% | ||
| 07:00 | GBP | Average Earnings Including Bonus 3M/Y Oct | 7.70% | 7.90% | ||
| 07:00 | GBP | Average Earnings Excluding Bonus 3M/Y Oct | 7.40% | 7.70% | ||
| 10:00 | EUR | Germany ZEW Economic Sentiment Dec | 8.8 | 9.8 | ||
| 10:00 | EUR | Germany ZEW Current Situation Dec | -75.5 | -79.8 | ||
| 10:00 | EUR | Eurozone ZEW Economic Sentiment Dec | 11.2 | 13.8 | ||
| 11:00 | USD | NFIB Business Optimism Index Nov | 90.7 | 90.7 | ||
| 13:30 | USD | CPI M/M Nov | 0.10% | 0.00% | ||
| 13:30 | USD | CPI Y/Y Nov | 3.10% | 3.20% | ||
| 13:30 | USD | CPI Core M/M Nov | 0.30% | 0.20% | ||
| 13:30 | USD | CPI Core Y/Y Nov | 4.00% | 4.00% |
Technical Outlook and Review
DXY:
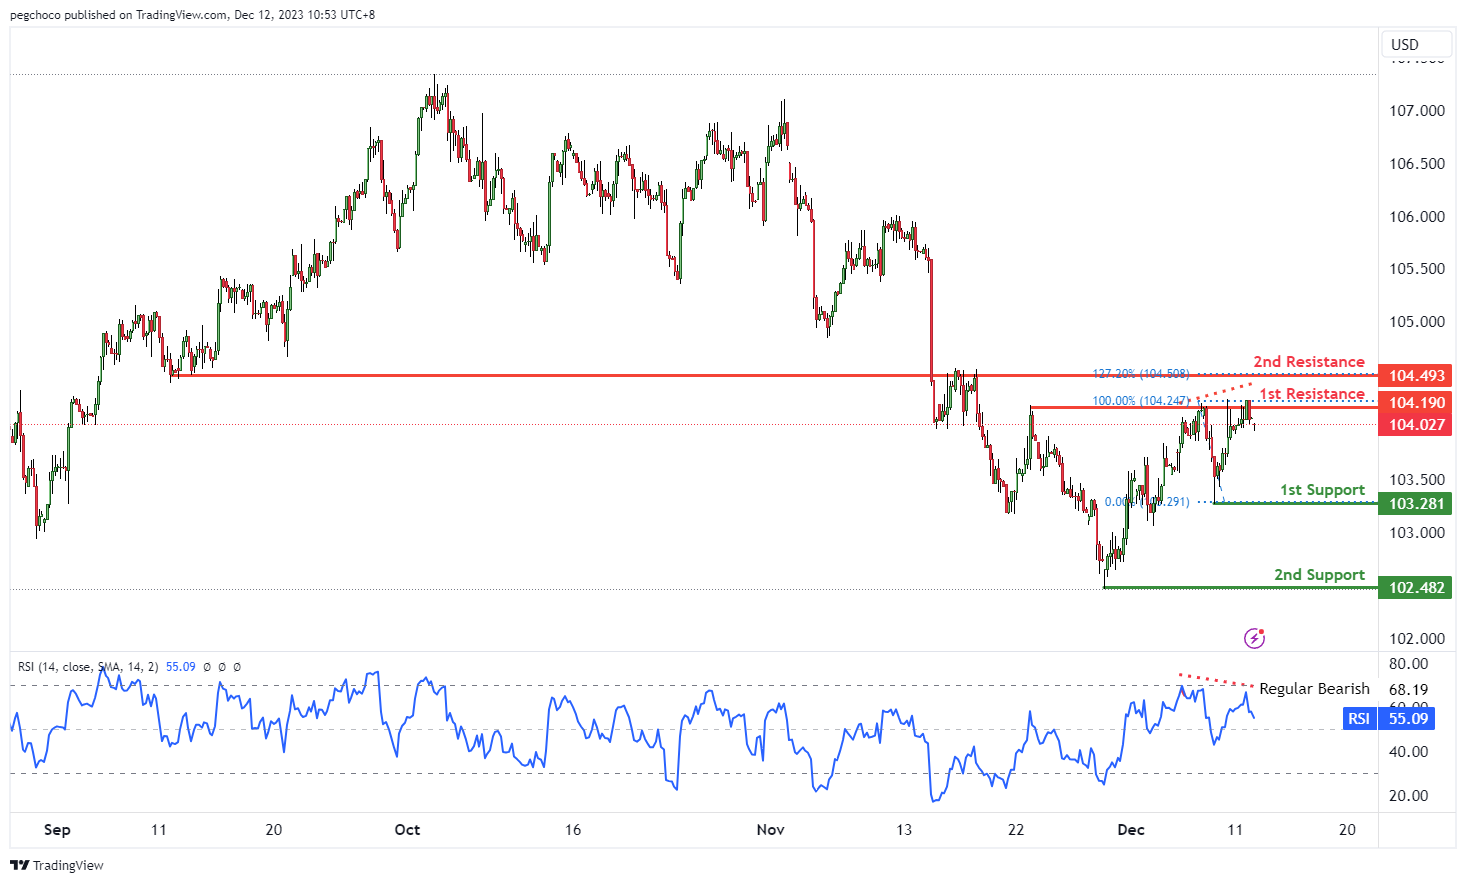
The DXY (US Dollar Index) chart currently has a bearish overall momentum, and there’s a potential scenario where price could make a bearish reaction off the 1st resistance level and drop towards the 1st support.
The 1st support at 103.28 is categorized as a swing low support. This level is significant as it suggests a potential area where buying interest may emerge, providing temporary support for the DXY.
The 2nd support at 102.48 is another swing low support level, further reinforcing its importance as a potential area where buyers might become active.
On the resistance side, the 1st resistance at 104.19 is noted as a multi-swing high resistance. This level is likely to act as a substantial barrier where selling interest may intensify, potentially triggering a bearish reversal.
The 2nd resistance at 104.49 is categorized as an overlap resistance and coincides with the 127.20% Fibonacci Extension level, indicating potential Fibonacci confluence. This level is also expected to be a strong resistance level.
Additionally, the RSI (Relative Strength Index) is displaying bearish divergence versus price, suggesting that a reversal might occur soon. This divergence can be a bearish signal, aligning with the overall bearish momentum.
EUR/USD:
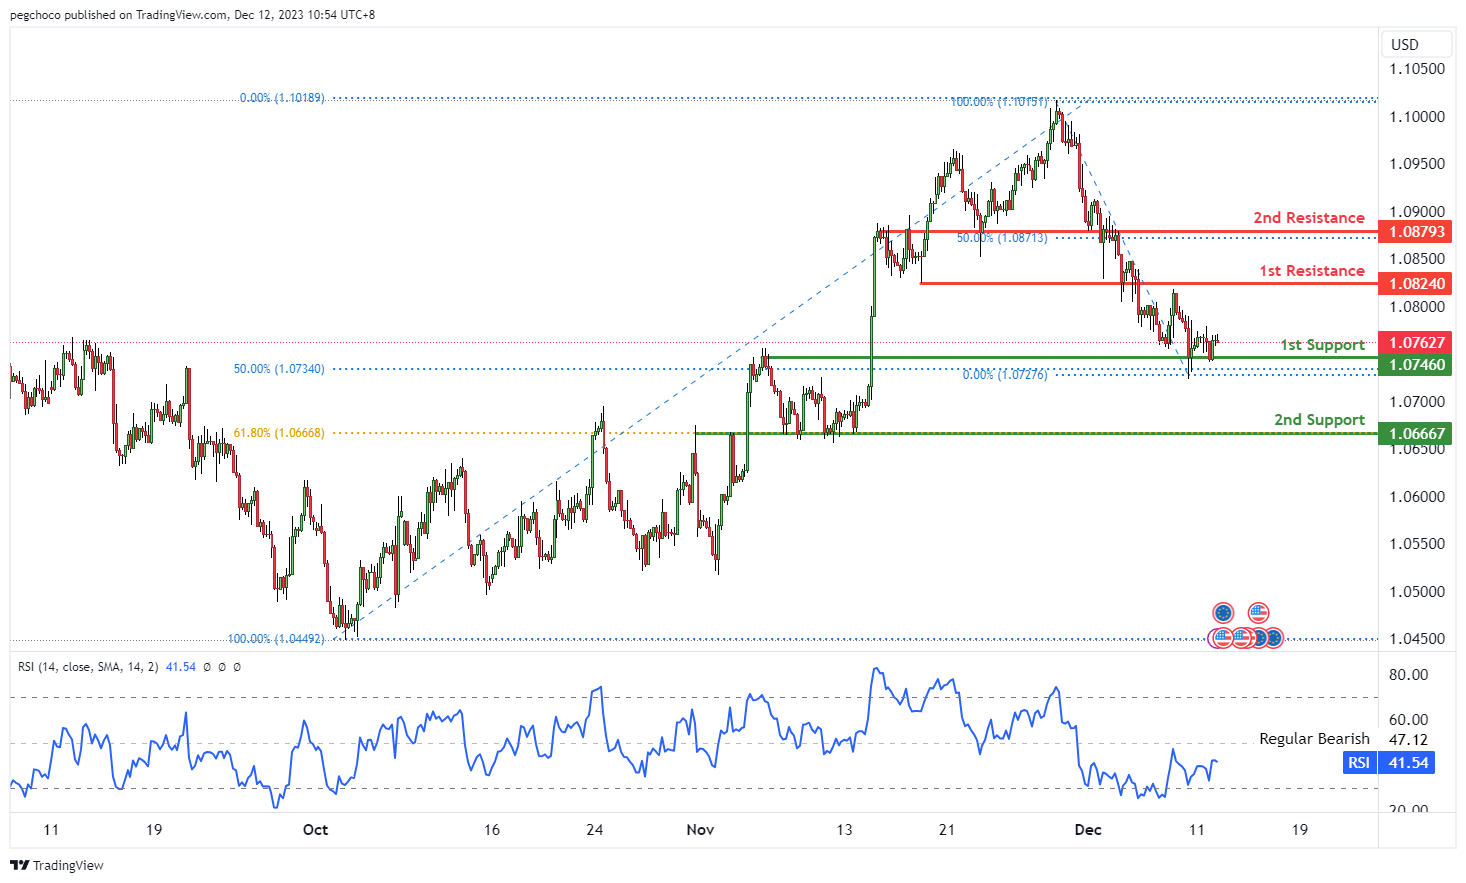
The EUR/USD chart currently has a bullish overall momentum, and there’s a potential scenario where price could make a bullish bounce off the 1st support level and head towards the 1st resistance.
The 1st support at 1.0746 is categorized as an overlap support and coincides with the 50% Fibonacci Retracement level. This level is significant as it suggests a potential area where buying interest may emerge, providing support for the EUR/USD pair.
The 2nd support at 1.0666 is also identified as an overlap support and coincides with the 61.80% Fibonacci Retracement level, further reinforcing its importance as a potential level where buyers might become active.
On the resistance side, the 1st resistance at 1.0824 is categorized as an overlap resistance, suggesting it as a substantial barrier where selling interest could intensify, potentially limiting upward movements.
The 2nd resistance at 1.0879 is noted as a pullback resistance and coincides with the 50% Fibonacci Retracement level, indicating potential Fibonacci confluence. This level is also expected to be a strong resistance level.
EUR/JPY:
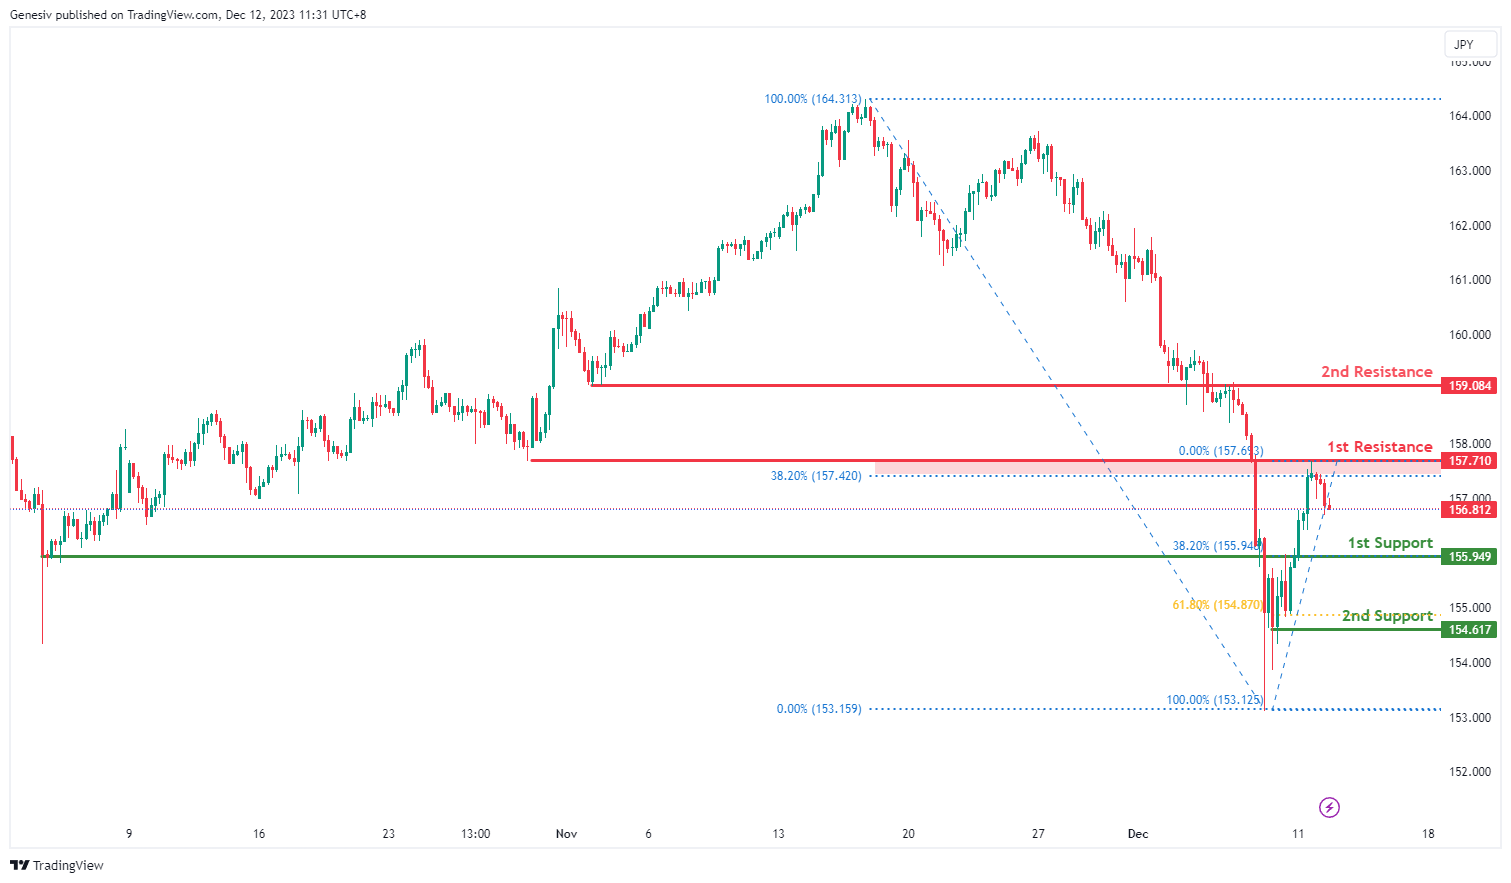
The EUR/JPY chart currently has a bearish overall momentum, suggesting a downward trend. In this scenario, there’s potential for a bearish continuation towards the 1st support level.
The 1st support at 155.94 is categorized as a pullback support and coincides with the 38.20% Fibonacci Retracement level, making it a significant level to watch for potential buying interest and temporary support for EUR/JPY.
Further down, the 2nd support at 154.61 is noteworthy as it’s a multi-swing low support and coincides with the 61.80% Fibonacci Retracement level. This level adds to the importance of the potential support area.
On the resistance side, the 1st resistance at 157.71 is identified as an overlap resistance and coincides with the 38.20% Fibonacci Retracement level. This level could act as a substantial barrier where selling interest may intensify, potentially limiting further upward movements.
Additionally, there’s a 2nd resistance at 159.08, which is also categorized as an overlap resistance.
EUR/GBP:
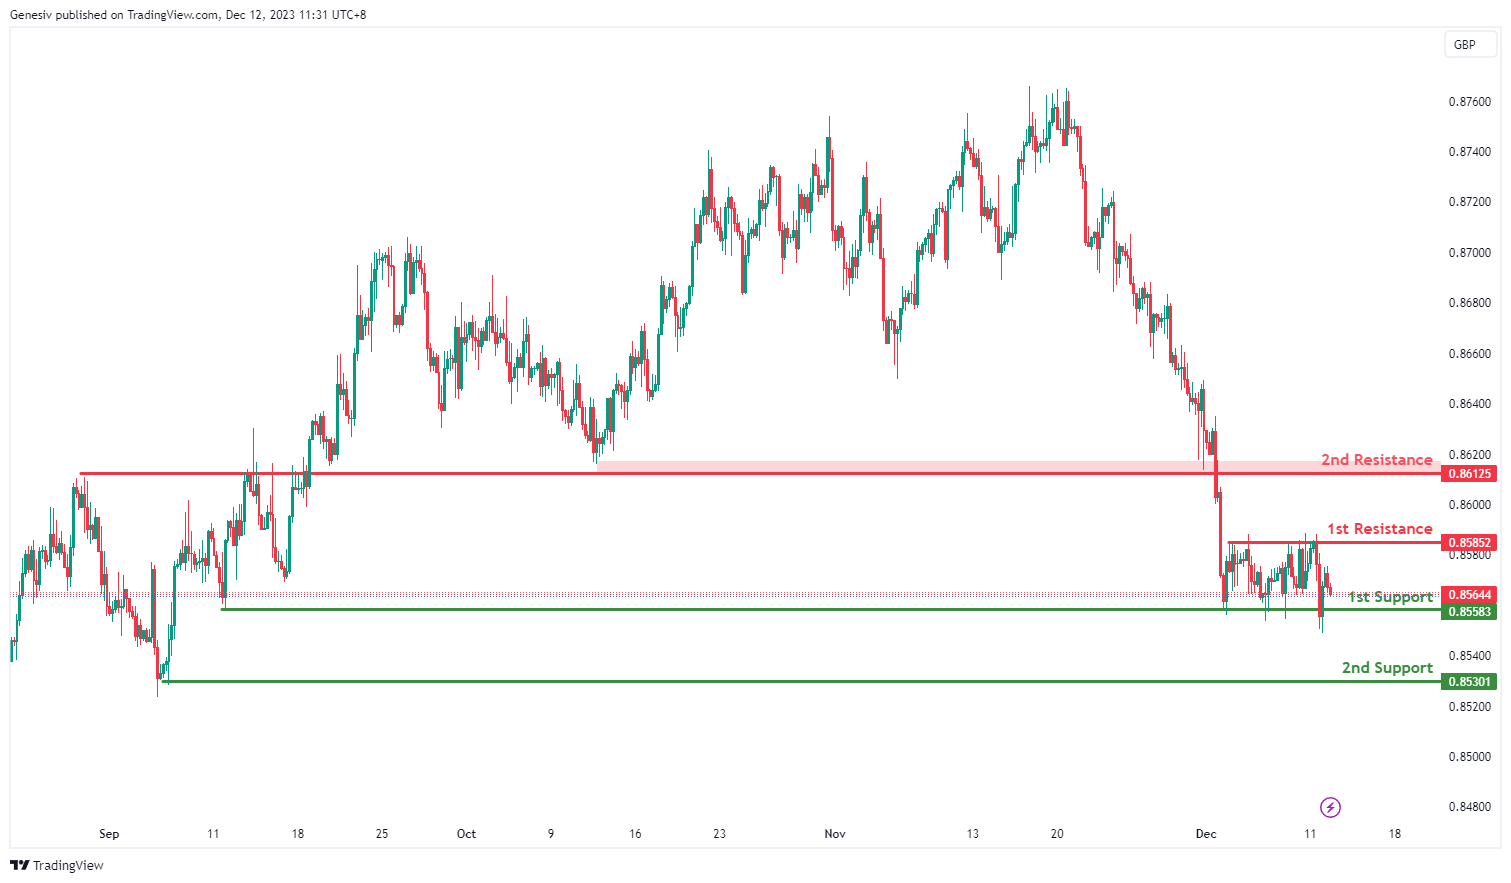
The EUR/GBP chart currently has a neutral overall momentum, suggesting that there is no clear directional bias at the moment. In such a scenario, price could potentially fluctuate between the 1st resistance and 1st support levels.
The 1st support at 0.8558 is considered a multi-swing low support, indicating that it has previously acted as a level where buying interest emerged. Traders may look for potential buying opportunities or temporary support around this level.
Similarly, the 2nd support at 0.8530 is another multi-swing low support level, further reinforcing the potential for price to find support in this area.
On the resistance side, the 1st resistance at 0.8585 is categorized as a multi-swing high resistance, suggesting that it has historically acted as a barrier to further upside movements. Traders may consider this level as a potential area where selling interest could intensify.
Further up, the 2nd resistance at 0.8612 is identified as a pullback resistance, indicating that it could also pose a challenge to upward movements.
GBP/USD:
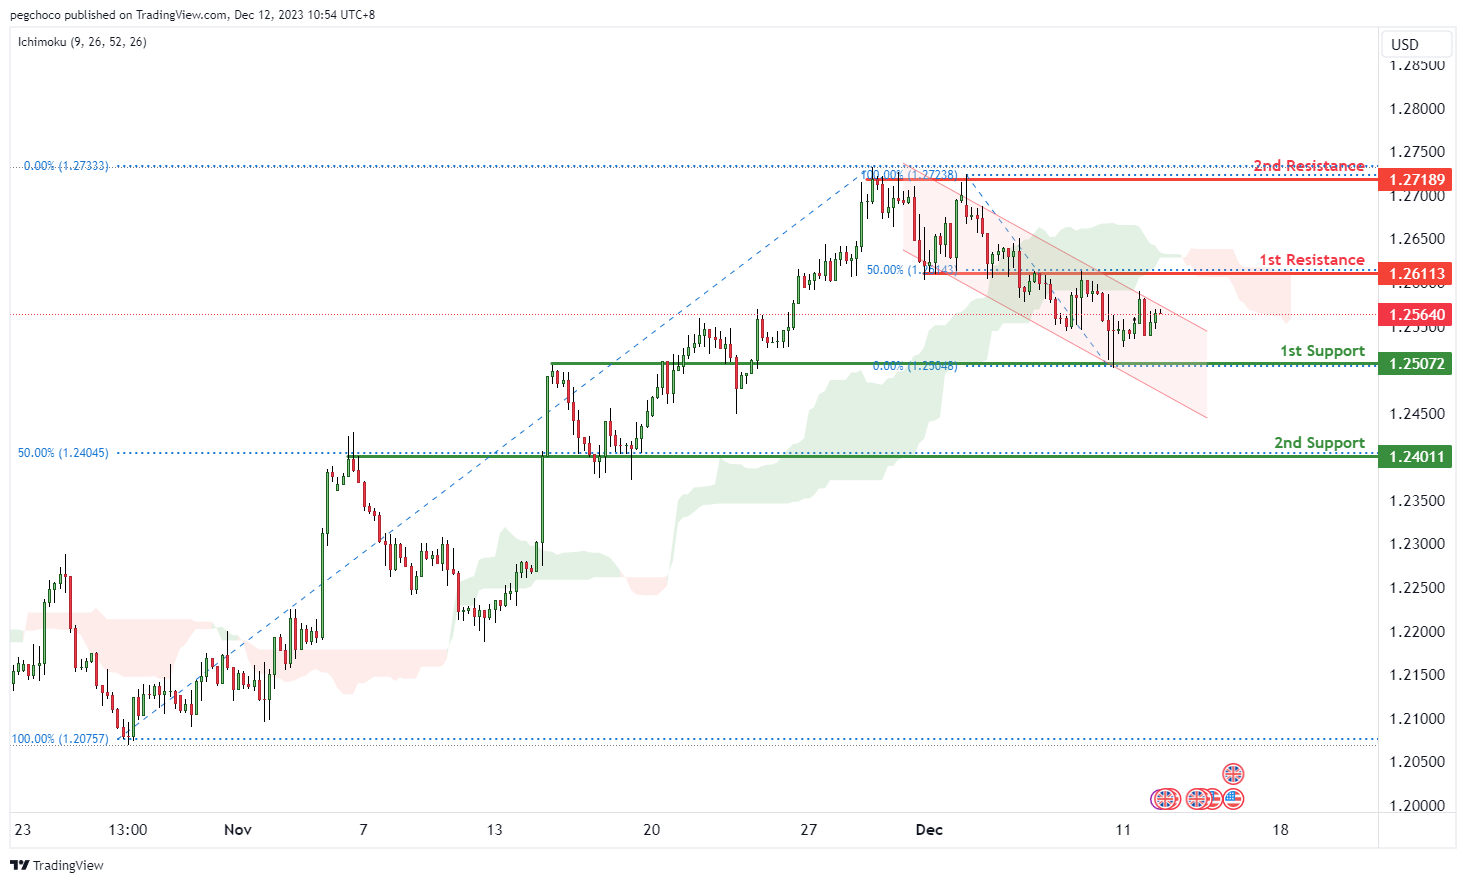
The GBP/USD chart currently exhibits a bearish overall momentum, and there are factors contributing to this bearish sentiment, including the price being below the bearish Ichimoku cloud and within a bearish channel. These indications suggest that the price might continue to move lower due to its bearish momentum.
In this scenario, there’s a potential for a bearish continuation towards the 1st support level.
The 1st support at 1.2507 is categorized as an overlap support. This level is significant as it suggests a potential area where buying interest may emerge, providing temporary support for the GBP/USD pair.
The 2nd support at 1.2401 is identified as an overlap support and coincides with the 50% Fibonacci Retracement level, further reinforcing its importance as a potential level where buyers might become active.
On the resistance side, the 1st resistance at 1.2611 is categorized as an overlap resistance and coincides with the 50% Fibonacci Retracement level. This level is likely to act as a substantial barrier where selling interest could intensify, potentially limiting upward movements.
The 2nd resistance at 1.2718 is noted as a multi-swing high resistance, indicating it as another significant level where selling pressure may increase.
GBP/JPY:
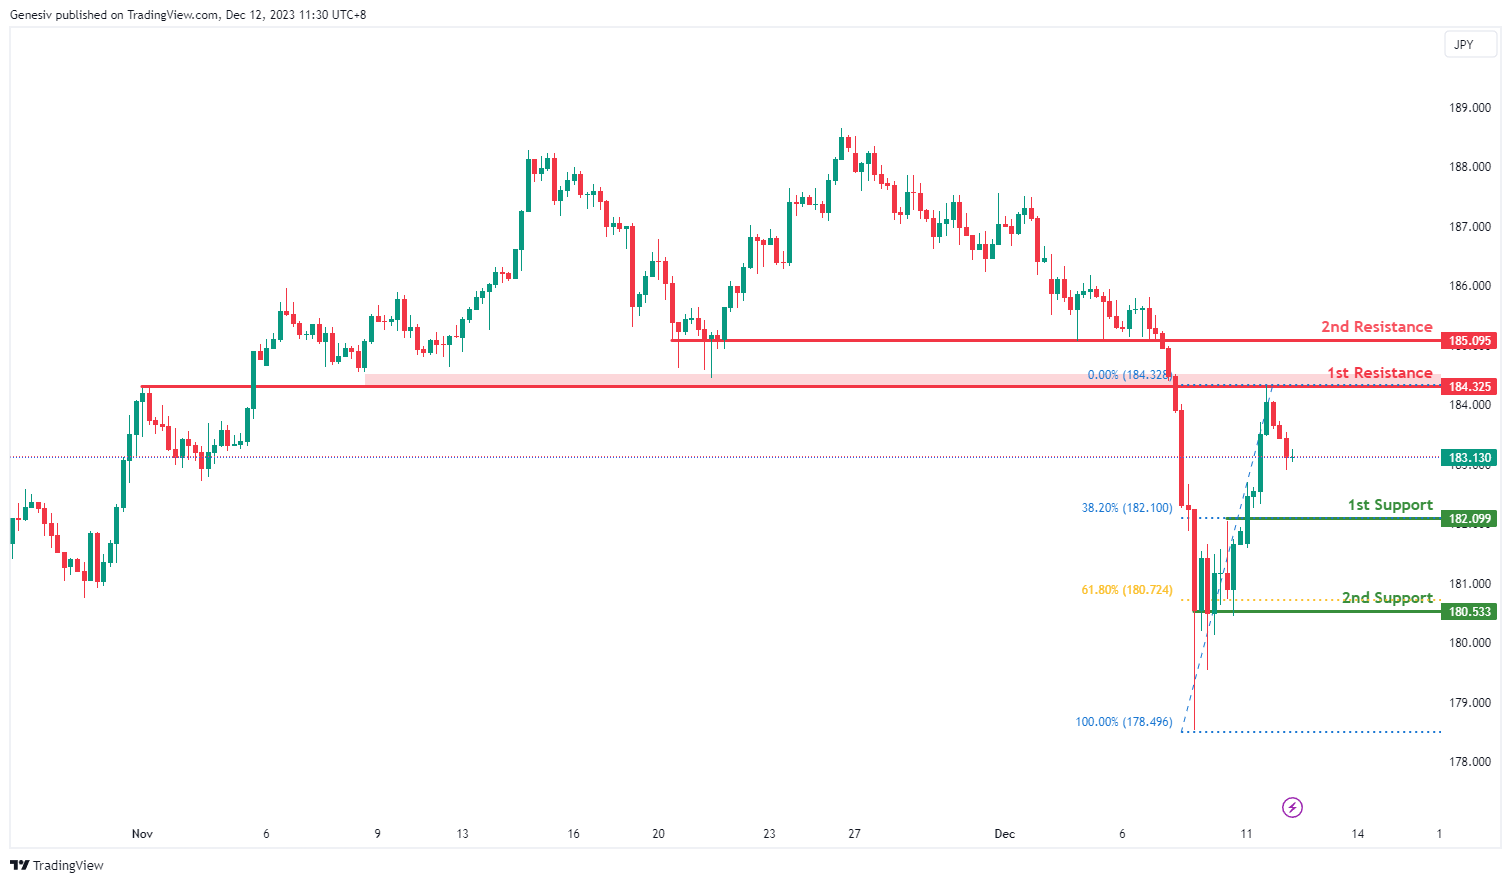
The GBP/JPY chart currently has a bearish overall momentum, indicating a downward trend. In this context, there’s potential for a bearish continuation towards the 1st support level.
The 1st support at 182.09 is identified as a pullback support and coincides with the 38.20% Fibonacci Retracement level. This level is significant as it suggests a potential area where buying interest may emerge, providing temporary support for GBP/JPY.
Further down, the 2nd support at 180.53 is categorized as a multi-swing low support and coincides with the 61.80% Fibonacci Retracement level, making it another important level to watch for potential support.
On the resistance side, the 1st resistance at 184.32 is identified as an overlap resistance, indicating it as a substantial barrier where selling interest could intensify, potentially limiting further upward movements. Additionally, there’s a 2nd resistance at 185.09, which is categorized as a pullback resistance.
USD/CHF:
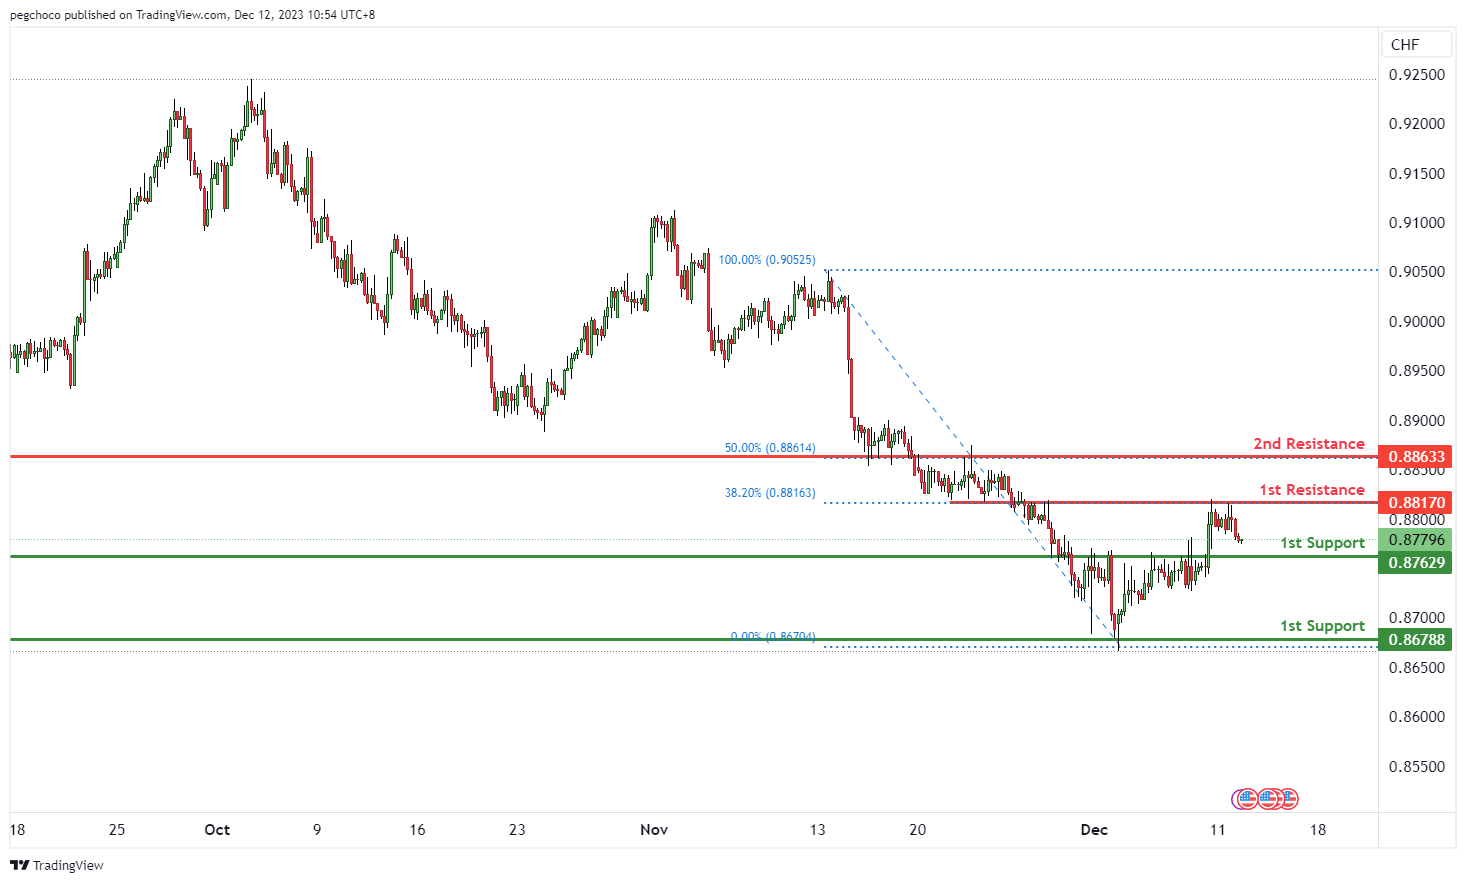
The USD/CHF chart currently demonstrates a bearish overall momentum, indicating a prevailing downward trend. In this context, there’s potential for a bearish continuation towards the 1st support level.
The 1st support at 0.8762 is categorized as a pullback support. This level is significant as it suggests a potential area where buying interest may emerge, providing temporary support for the USD/CHF pair.
The 2nd support at 0.8678 is identified as a multi-swing low support, further reinforcing its importance as a potential level where buyers might become active.
On the resistance side, the 1st resistance at 0.8817 is categorized as an overlap resistance and coincides with the 38.20% Fibonacci Retracement level. This level is likely to act as a substantial barrier where selling interest could intensify, potentially limiting upward movements.
The 2nd resistance at 0.8863 is also categorized as an overlap resistance and coincides with the 50% Fibonacci Retracement level, further indicating its significance as a level where selling pressure may increase.
USD/JPY:
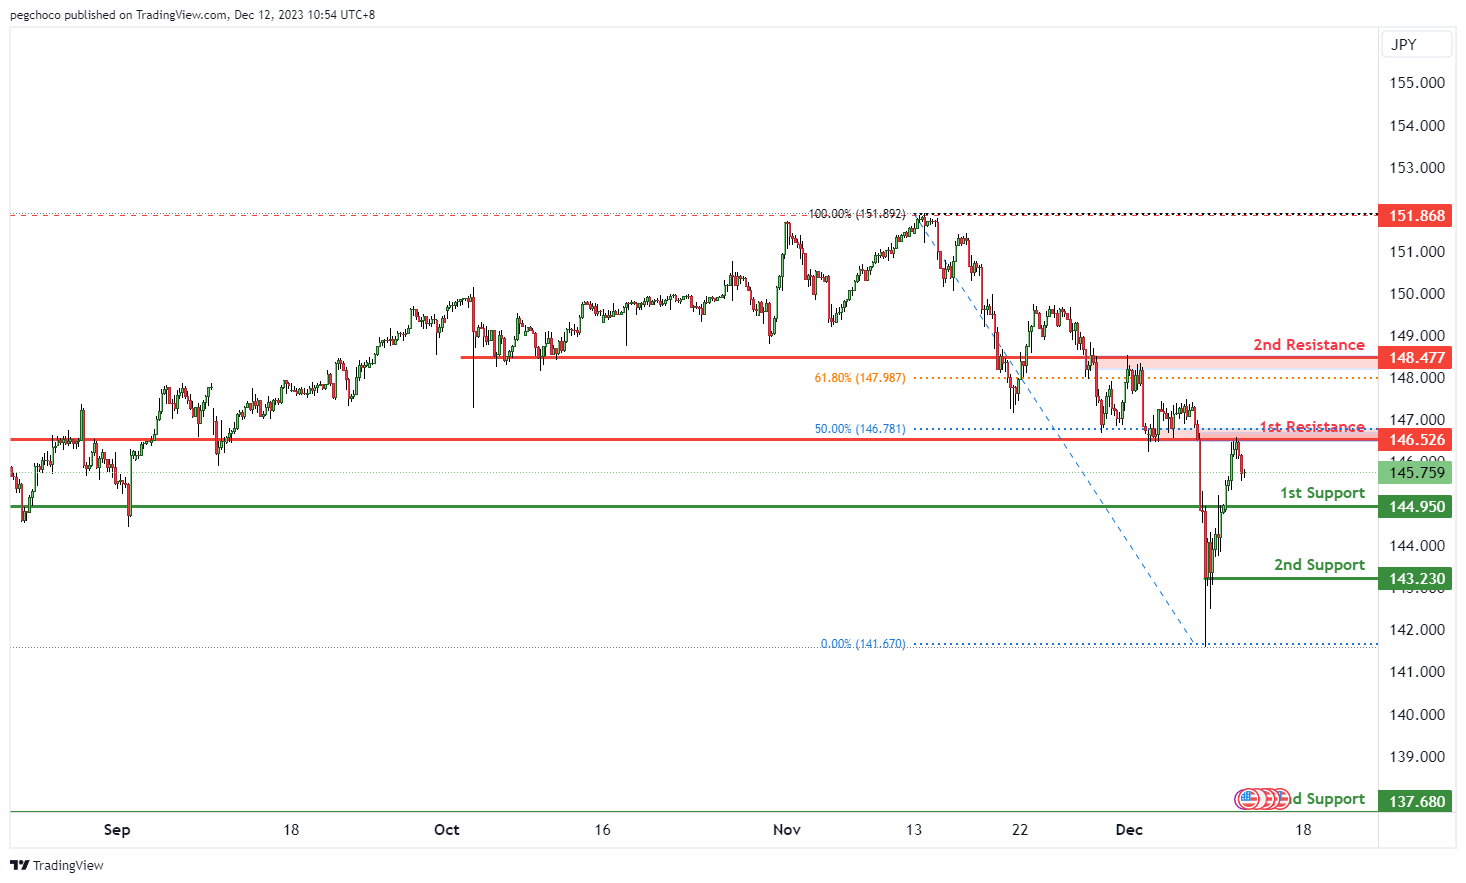
The USD/JPY chart currently exhibits a bearish overall momentum, indicating a prevailing downward trend. In this context, there’s potential for a bearish continuation towards the 1st support level.
The 1st support at 144.95 is categorized as a pullback support. This level is significant as it suggests a potential area where buying interest may emerge, providing temporary support for the USD/JPY pair.
The 2nd support at 143.23 is identified as a multi-swing low support, further reinforcing its importance as a potential level where buyers might become active.
On the resistance side, the 1st resistance at 146.52 is categorized as an overlap resistance and coincides with the 50% Fibonacci Retracement level. This level is likely to act as a substantial barrier where selling interest could intensify, potentially limiting upward movements.
The 2nd resistance at 148.47 is also categorized as an overlap resistance and coincides with the 61.80% Fibonacci Retracement level, further indicating its significance as a level where selling pressure may increase.
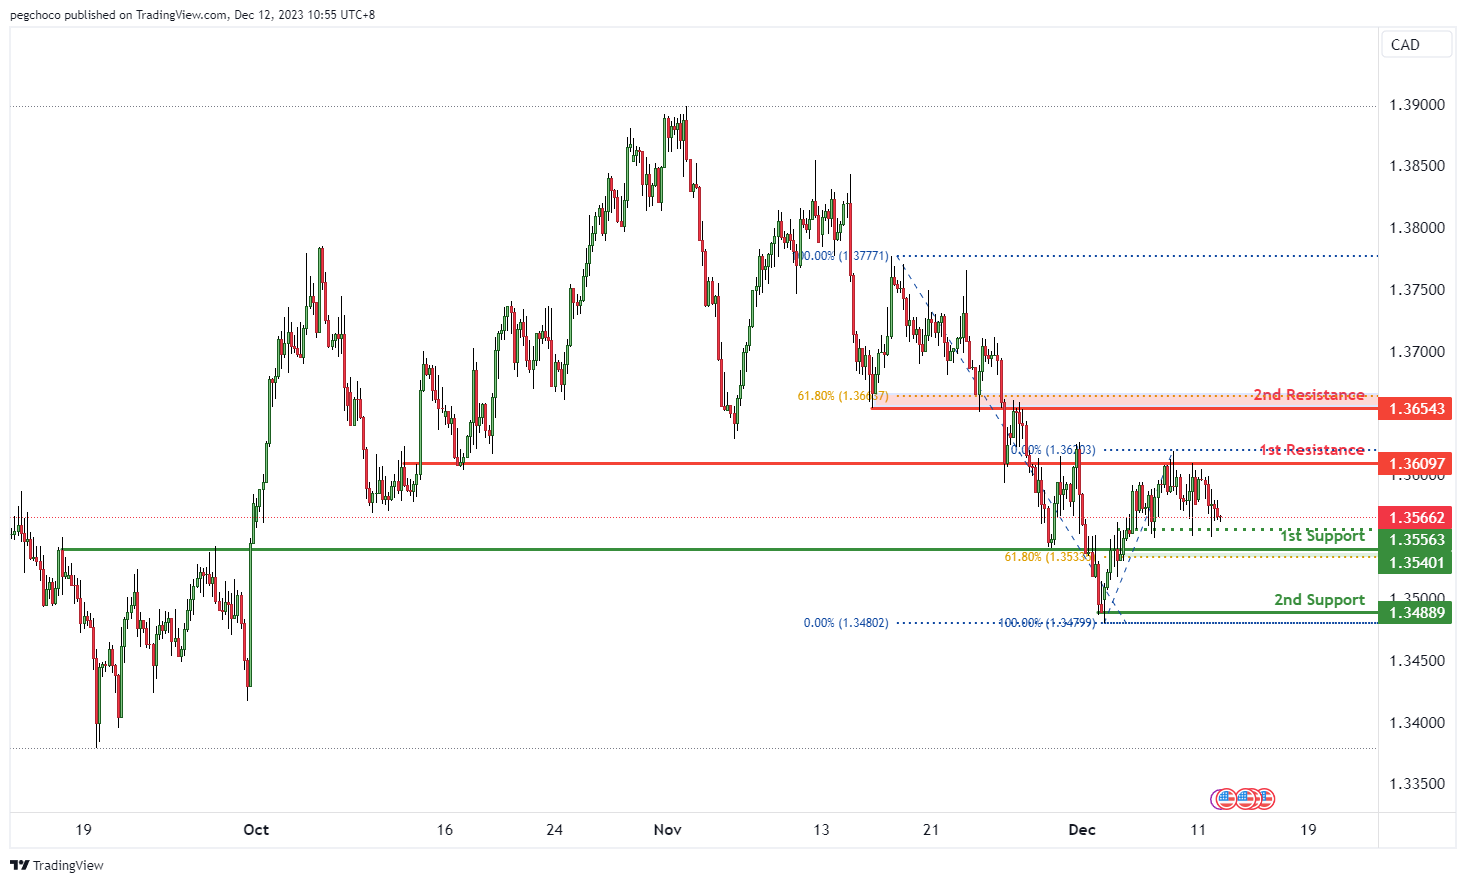
USD/CAD:
The USD/CAD chart currently exhibits a bullish overall momentum, indicating a prevailing upward trend. In this context, there’s potential for a bullish bounce off the 1st support level, leading to a movement towards the 1st resistance.
The 1st support at 1.3540 is categorized as a swing low support and coincides with the 61.80% Fibonacci Retracement level. This level is significant as it suggests a potential area where buying interest may emerge, providing support for USD/CAD prices.
The 2nd support at 1.2488 is identified as a multi-swing low support, further reinforcing its importance as a level where buyers might become active.
On the resistance side, the 1st resistance at 1.3609 is labeled as an overlap resistance. This level is likely to act as a significant barrier where selling interest could intensify, potentially leading to a temporary halt in the bullish movement.
The 2nd resistance at 1.3654 is categorized as an overlap resistance and coincides with the 61.80% Fibonacci Retracement level, suggesting its potential significance as a level where selling pressure may increase.
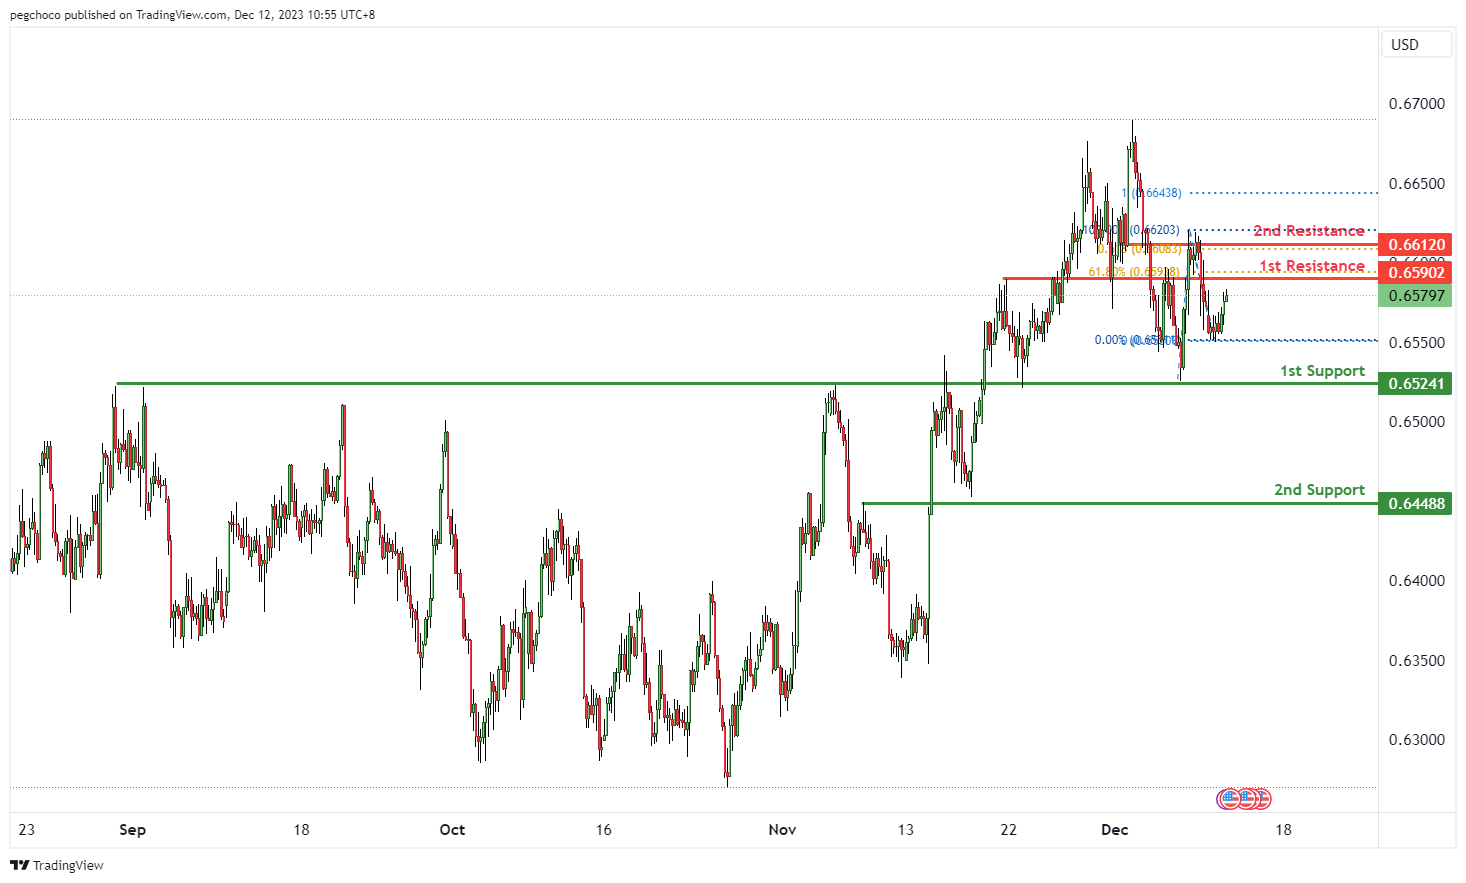
AUD/USD:
The AUD/USD chart currently exhibits a bearish overall momentum, indicating a prevailing downward trend. In this context, there’s potential for a bearish reaction off the 1st resistance level, leading to a drop towards the 1st support.
The 1st support at 0.6524 is categorized as an overlap support, suggesting its significance as a potential level where buying interest may emerge, providing support for AUD/USD prices.
The 2nd support at 0.6448 is also identified as an overlap support, reinforcing its importance as a level where buyers might become active.
On the resistance side, the 1st resistance at 0.6590 is labeled as a pullback resistance. This level is likely to act as a substantial barrier where selling interest could intensify, potentially leading to a bearish reaction.
The 2nd resistance at 0.6612 is categorized as an overlap resistance, and it coincides with the 61.80% Fibonacci Projection, indicating its potential significance as a level where selling pressure may increase.
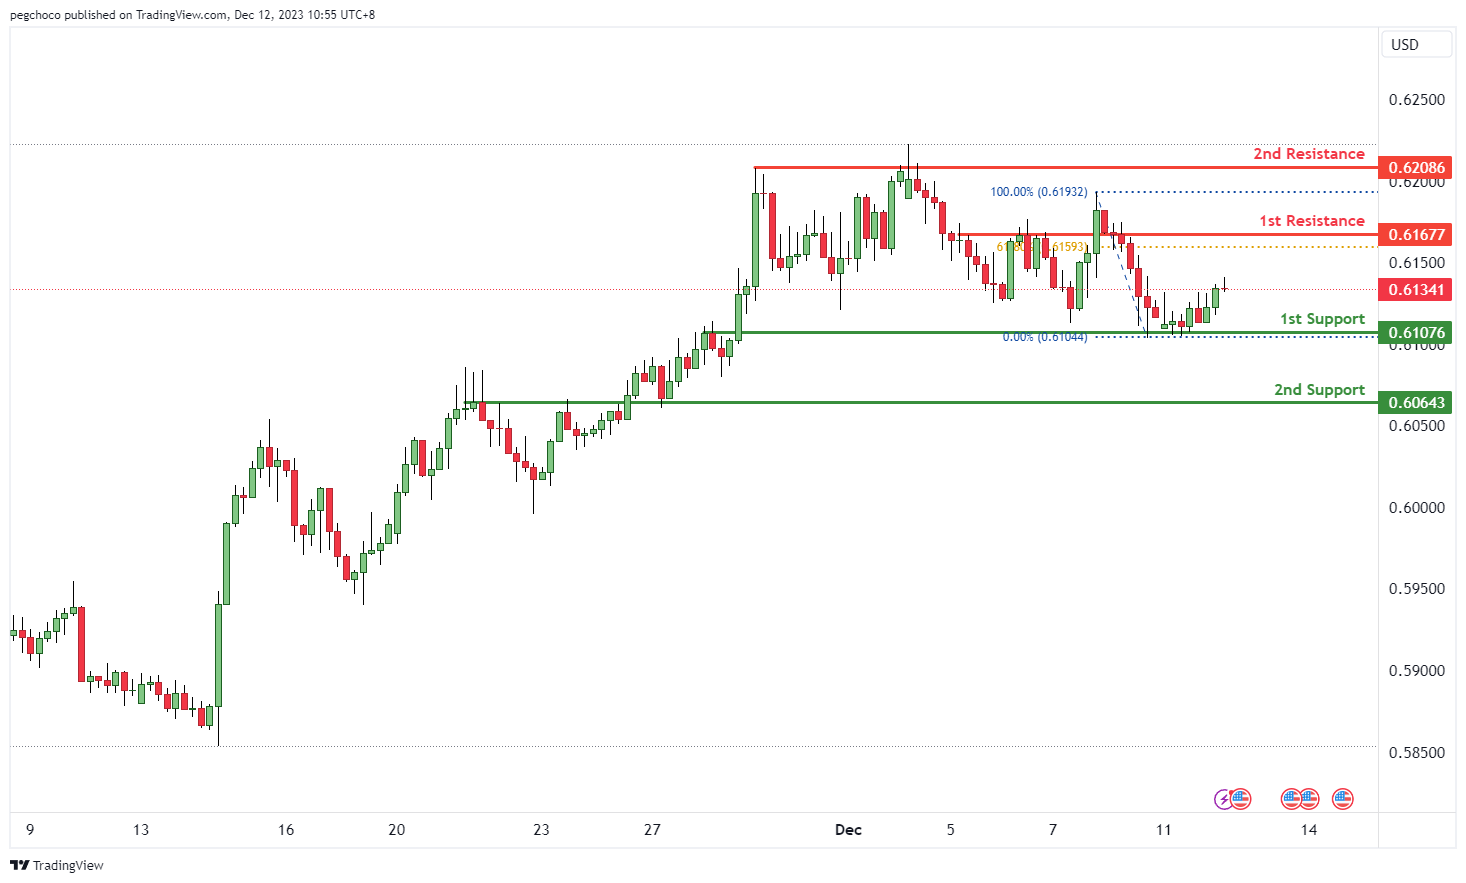
NZD/USD
The NZD/USD chart currently has a bullish overall momentum, indicating a prevailing upward trend. Within this context, there’s potential for a bullish continuation towards the 1st resistance level.
The 1st support at 0.6107 is categorized as an overlap support, suggesting its significance as a potential level where buying interest may emerge, providing support for NZD/USD prices.
The 2nd support at 0.6006 is also identified as an overlap support, further reinforcing its importance as a level where buyers might become active.
On the resistance side, the 1st resistance at 0.6167 is labeled as a pullback resistance. This level is likely to act as a substantial barrier where selling interest could intensify, potentially limiting upward movements.
The 2nd resistance at 0.6208 is categorized as a multi-swing high resistance, indicating its potential significance as a level where selling pressure may increase.
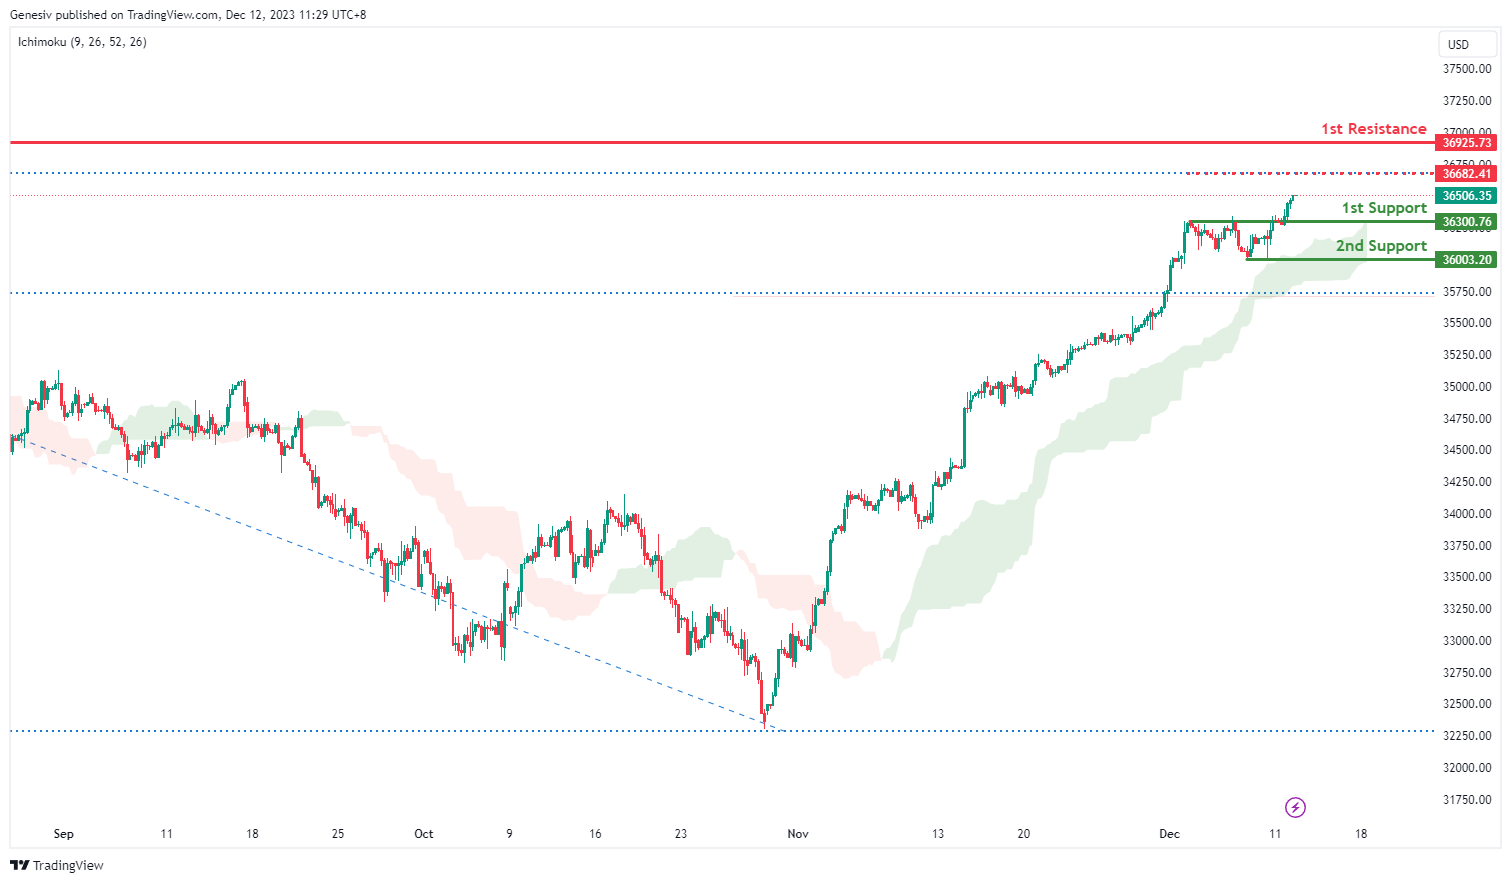
DJ30:
The DJ30 (Dow Jones Industrial Average) chart currently has a bullish overall momentum, with price trading above the bullish Ichimoku cloud, indicating a strong upward trend. In this context, there’s potential for a bullish continuation towards the 1st resistance level.
The 1st support at 36300.76 is identified as an overlap support, suggesting it could be a significant level where buying interest may emerge, providing potential support for the DJ30 index.
On the resistance side, the 1st resistance at 36925.73 is categorized as a swing high resistance, indicating it as a substantial barrier where selling interest could intensify, potentially limiting further upward movements.
Additionally, there’s an intermediate resistance at 36682.41, which coincides with the 127.20% Fibonacci Extension, indicating potential Fibonacci confluence.
GER40:
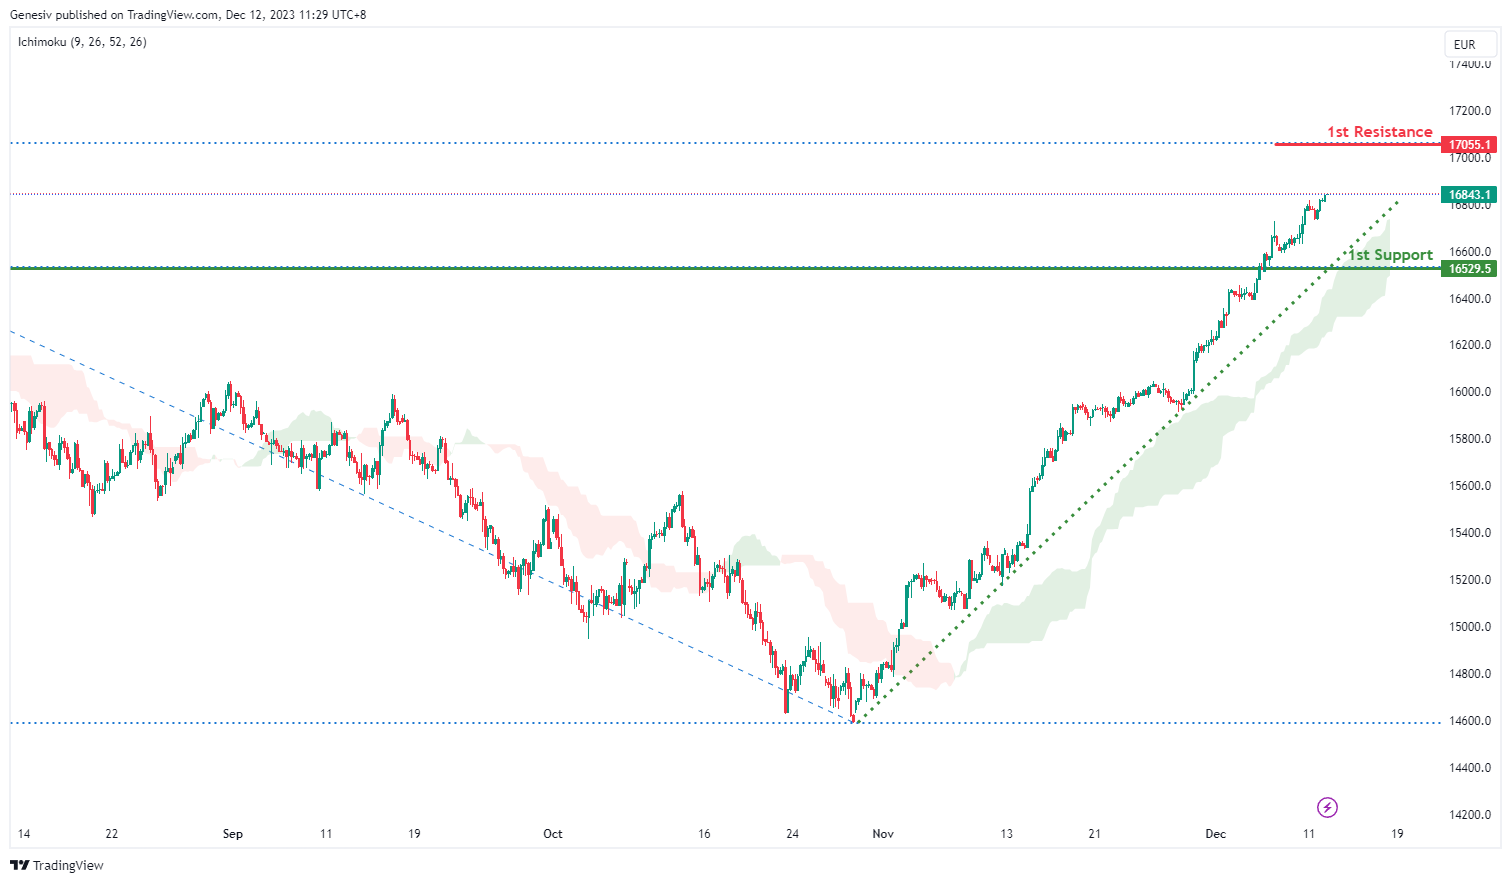
The GER40 (DAX) chart currently exhibits a bullish overall momentum, with price trading above a major ascending trend line, indicating a strong upward trend. Within this context, there’s potential for a bullish continuation towards the 1st resistance level.
The 1st support at 16529.5 is categorized as a pullback support, suggesting it could be a significant level where buying interest may emerge, providing temporary support for the GER40 index.
On the resistance side, the 1st resistance at 17055.10 is identified as a level that coincides with the 127.20% Fibonacci Extension, indicating potential Fibonacci confluence.
This level is likely to act as a substantial barrier where selling interest could intensify, potentially limiting further upward movements.
US500:
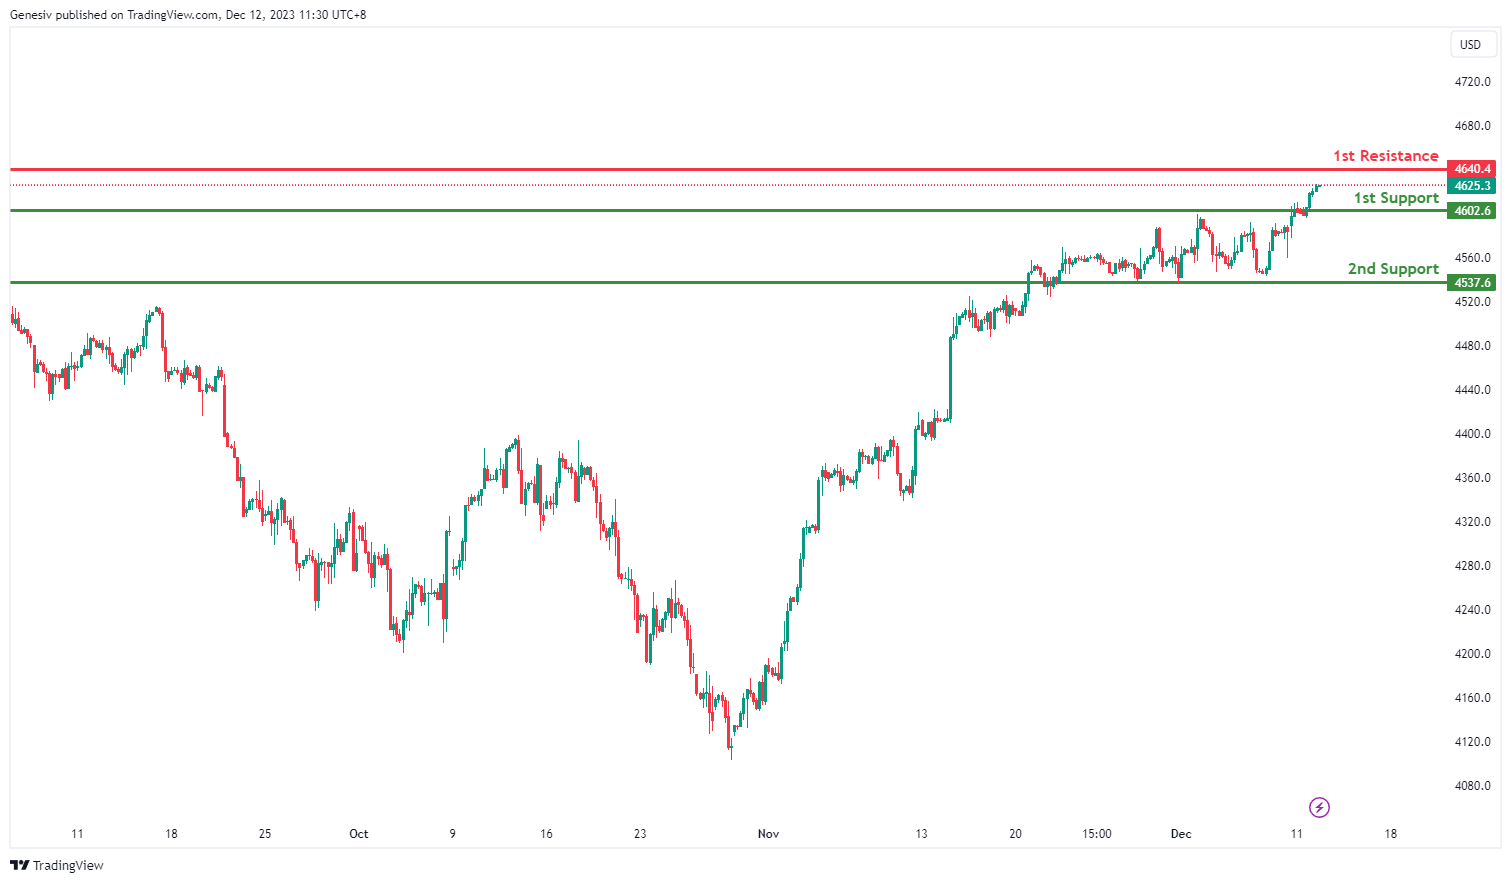
The US500 chart currently has a bullish overall momentum, indicating a prevailing upward trend. Within this context, there’s potential for a bullish bounce off the 1st support level, which could lead to a move towards the 1st resistance.
The 1st support at 4602.6 is categorized as a pullback support, indicating that it’s a significant level where buying interest may emerge, potentially providing support for the US500 index.
The 2nd support at 4537.6 is identified as an overlap support, further reinforcing its importance as a potential level where buyers might become active.
On the resistance side, the 1st resistance at 4640.4 is noted as a swing high resistance. This level is likely to act as a substantial barrier where selling interest could intensify, potentially limiting further upward movements.
BTC/USD:
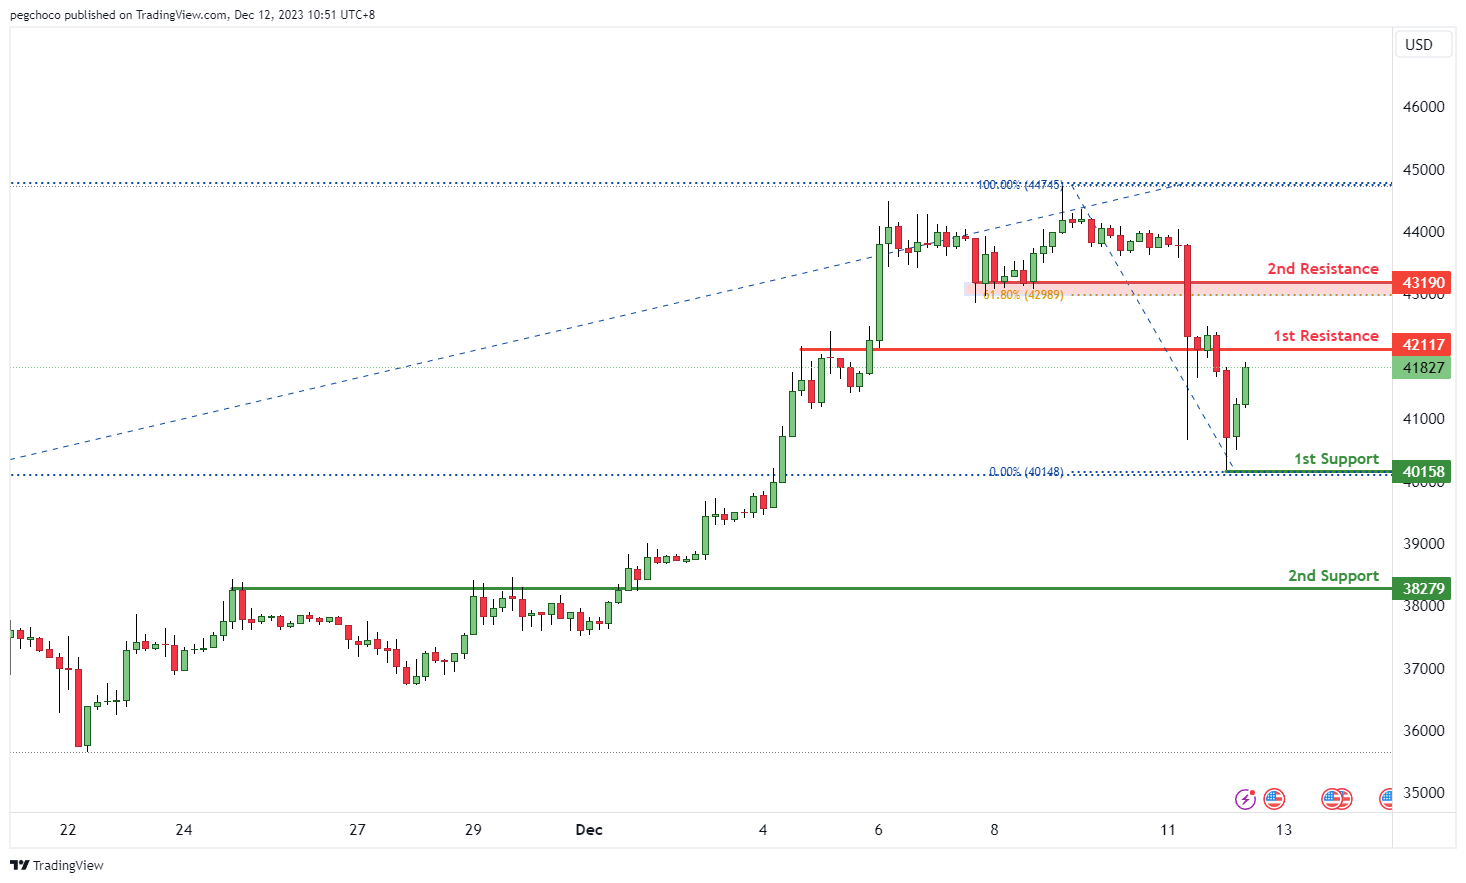
he BTC/USD chart currently exhibits a bearish overall momentum, indicating a prevailing downward trend. In this context, there’s potential for a bearish reaction off the 1st resistance level, leading to a drop towards the 1st support.
The 1st support at 40158 is identified as a swing low support, signifying its significance as a potential level where buying interest may emerge, potentially providing support for Bitcoin’s price.
The 2nd support at 38279 is categorized as a pullback support, further reinforcing its importance as a potential area where buyers might become active.
On the resistance side, the 1st resistance at 42117 is noted as a pullback resistance. This level is likely to act as a substantial barrier where selling interest could intensify, potentially triggering a bearish reversal.
Further up, the 2nd resistance at 43190 is characterized as a pullback resistance and coincides with the 61.80% Fibonacci Retracement level, indicating a potential confluence of technical factors that could strengthen it as a level where selling pressure may increase.
ETH/USD:
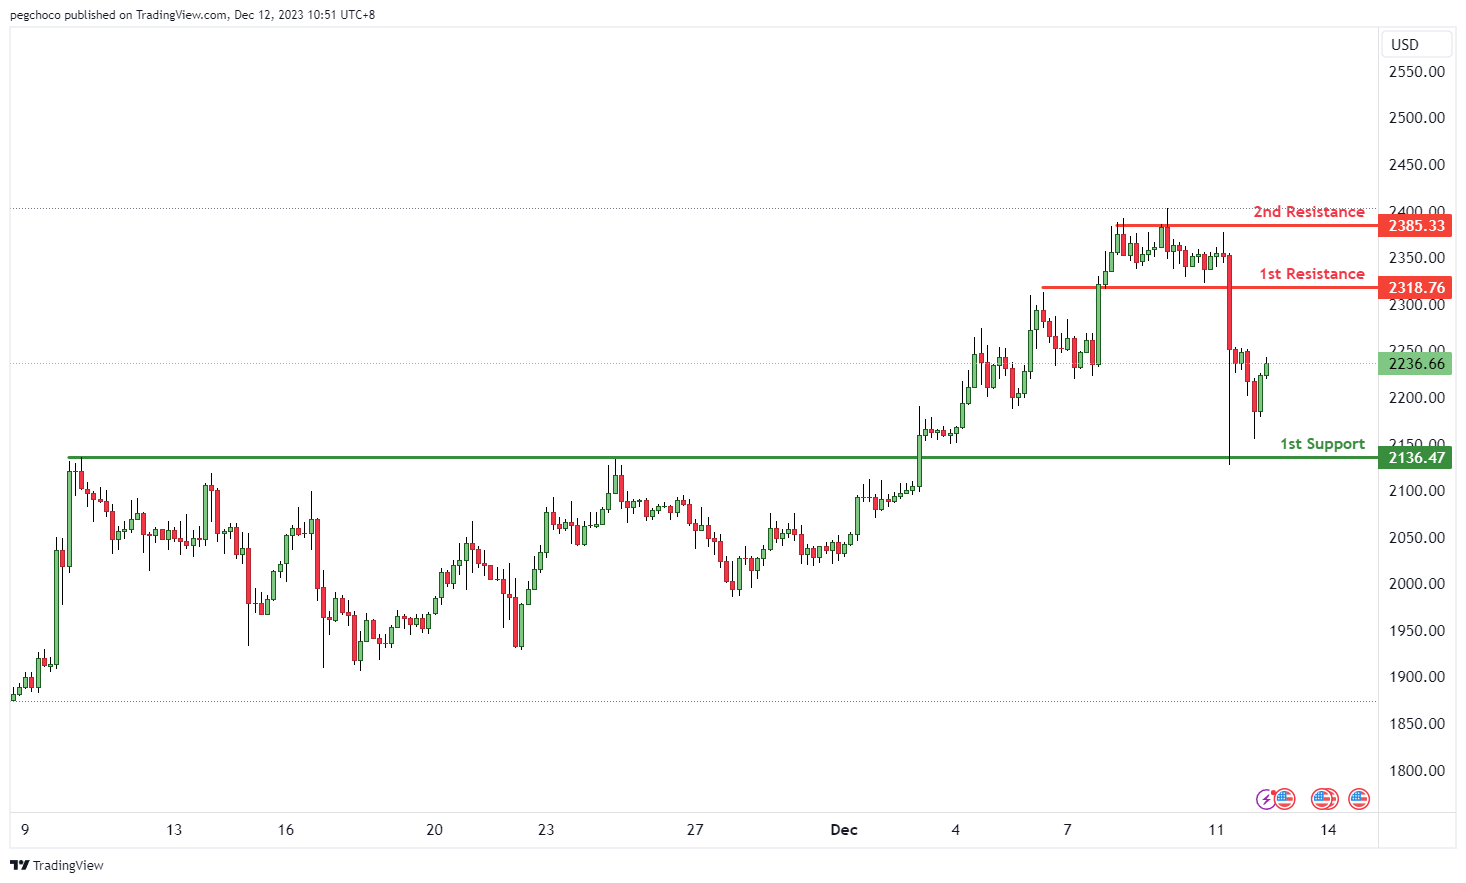
The ETH/USD chart currently has a bullish overall momentum, indicating a prevailing upward trend. In this context, there’s potential for a bullish continuation towards the 1st resistance level.
The 1st support at 2136.47 is identified as an overlap support. This level may act as a significant area where buying interest could emerge, providing support for Ethereum’s price.
On the resistance side, the 1st resistance at 2318.76 is categorized as a pullback resistance. This level is likely to serve as a substantial barrier where selling interest could intensify, potentially slowing down or reversing the bullish momentum.
Further up, the 2nd resistance at 2385.33 is labeled as a multi-swing high resistance, reinforcing its significance as a potential level where selling pressure may increase.
WTI/USD:
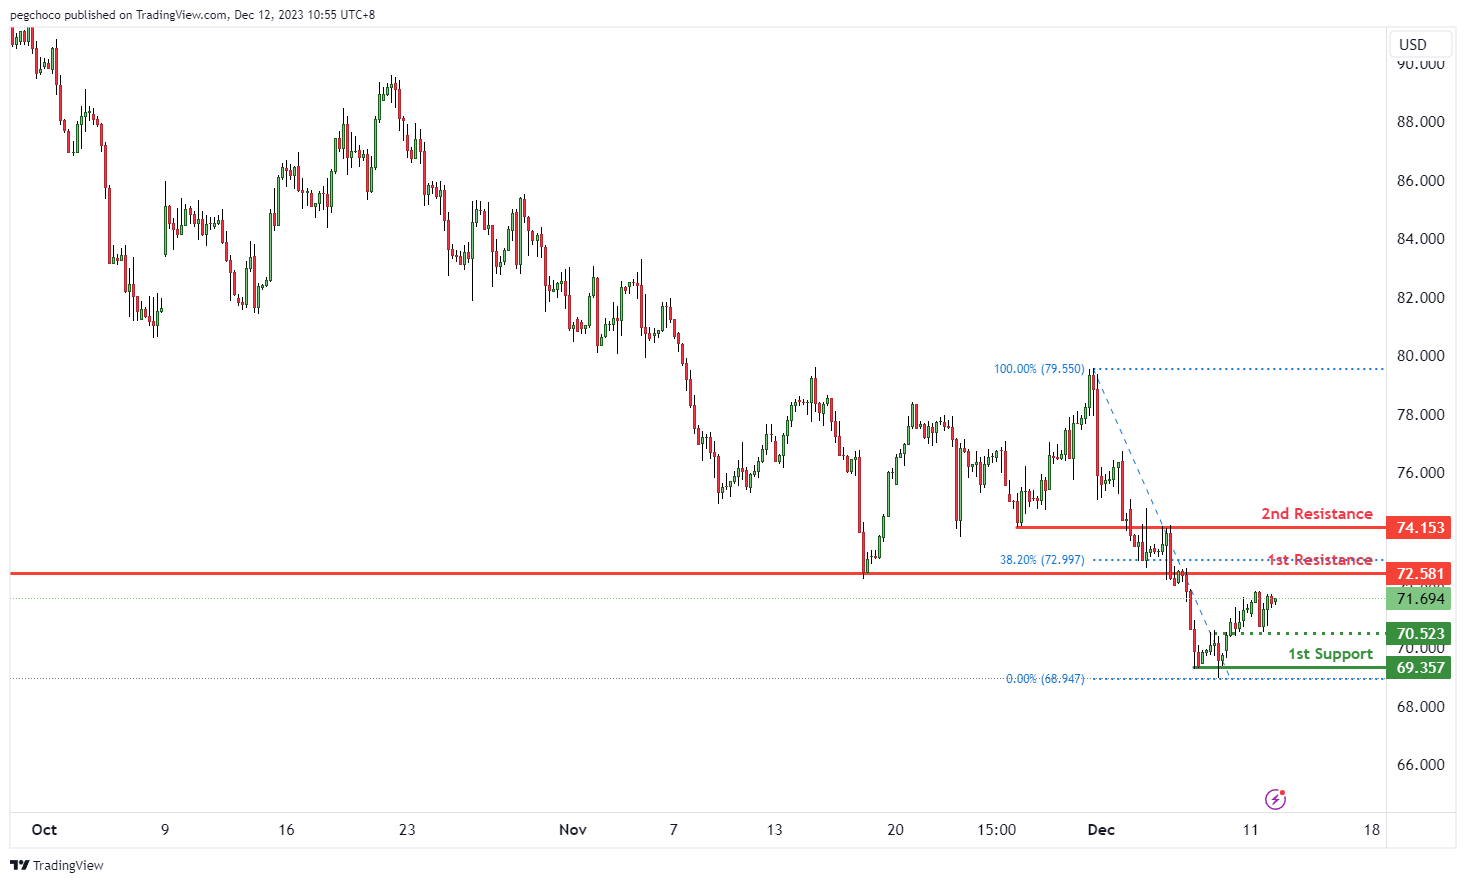
The WTI chart currently exhibits a bearish overall momentum, suggesting a prevailing downward trend. Within this context, there’s potential for a bearish reaction off the 1st resistance level, followed by a drop towards the 1st support.
The 1st support at 69.35 is identified as a multi-swing low support, indicating its potential significance as a level where buying interest may emerge, providing temporary support for WTI prices.
The intermediate support at 70.52 is categorized as an overlap support, reinforcing its importance as a potential level where buyers might become active.
On the resistance side, the 1st resistance at 72.58 is labeled as a pullback resistance. This level is likely to act as a substantial barrier where selling interest could intensify, potentially triggering a bearish reversal.
The 2nd resistance at 74.15 is categorized as an overlap resistance, further indicating its potential significance as a level where selling pressure may increase.
XAU/USD (GOLD):
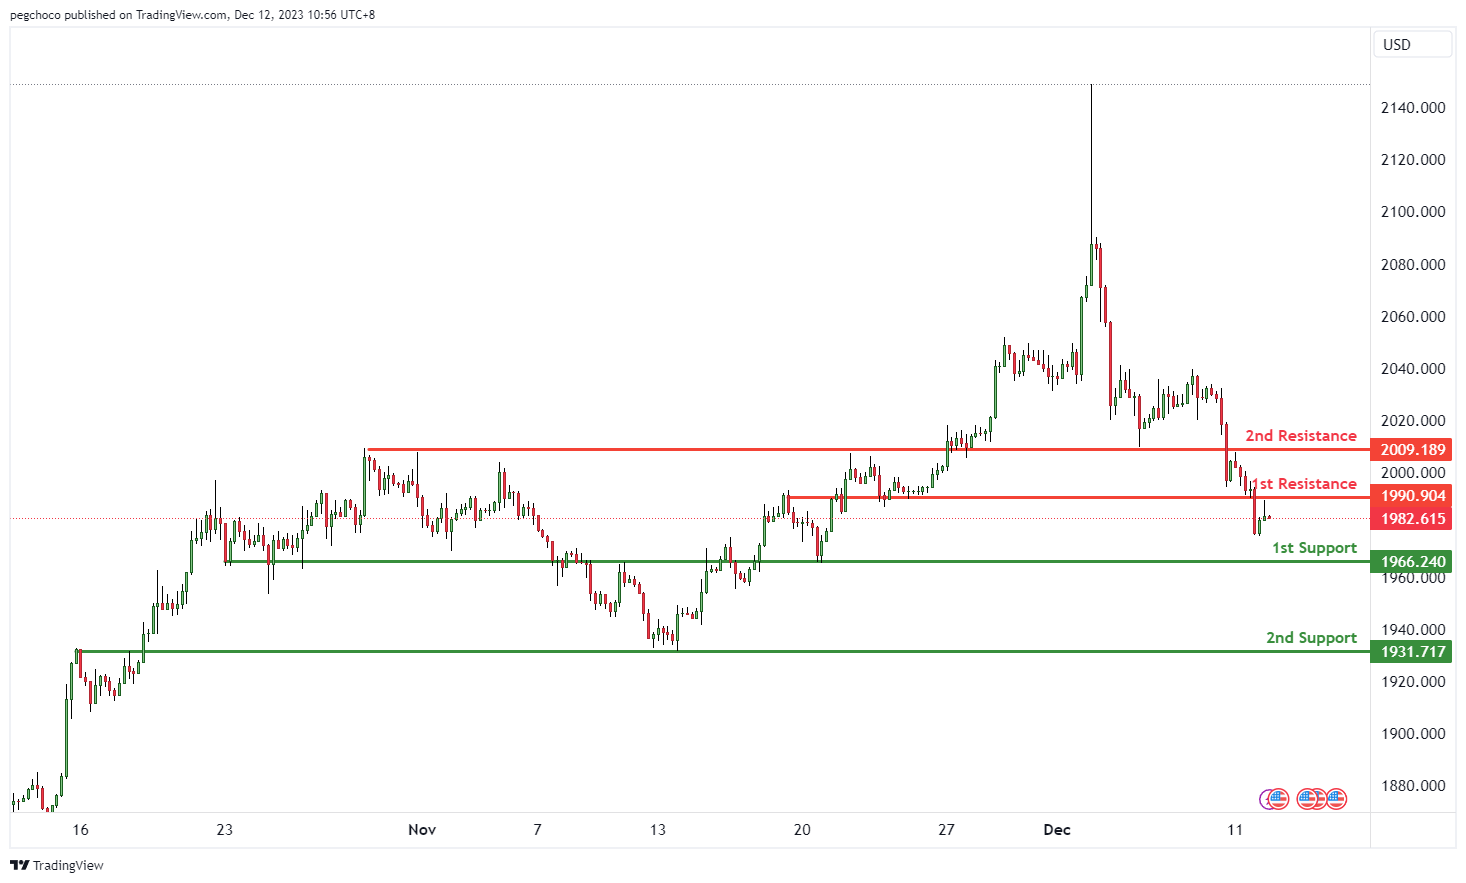
The XAU/USD chart currently has a bearish overall momentum, suggesting a prevailing downward trend. In this context, there’s potential for a bearish reaction off the 1st resistance level, followed by a drop towards the 1st support.
The 1st support at 1966.24 is identified as an overlap support, indicating its potential significance as a level where buying interest may emerge, providing temporary support for the XAU/USD pair.
The 2nd support at 1931.71 is also categorized as an overlap support, reinforcing its importance as a potential level where buyers might become active.
On the resistance side, the 1st resistance at 1990.90 is labeled as a pullback resistance. This level is likely to act as a substantial barrier where selling interest could intensify, potentially triggering a bearish reversal.
The 2nd resistance at 2009.18 is categorized as an overlap resistance, further indicating its potential significance as a level where selling pressure may increase.
GBP/USD Consolidates, US CPI and UK Employment Reports Next
Key Highlights
- GBP/USD started a downside correction from the 1.2732 zone.
- It traded below a key bullish trend line with support at 1.2640 on the 4-hour chart.
- The UK Claimant count could change by 20.3K in Nov 2023, up from 17.8K.
- The US CPI could decline further to 3.1% in Nov 2023 (YoY) from 3.2%.
GBP/USD Technical Analysis
The British Pound faced sellers near the 1.2735 zone against the US Dollar. GBP/USD started a downside correction and traded below the 1.2650 support.
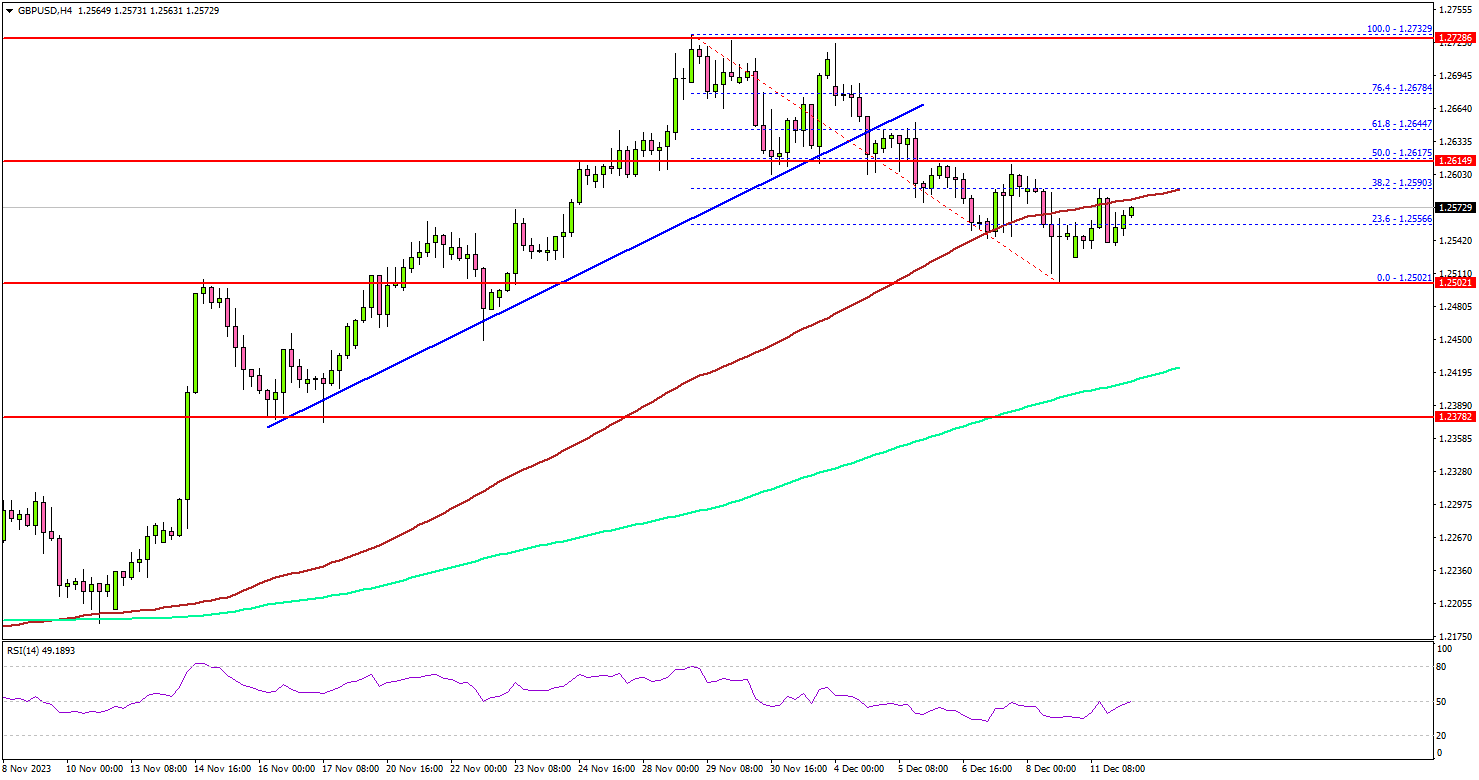
Looking at the 4-hour chart, the pair traded below a key bullish trend line with support at 1.2640. There was a spike below the 100 simple moving average (red, 4 hours) and 1.2550.
However, the bulls were active above the 1.2500 level. A low was formed near 1.2502 and the pair is now consolidating losses and trading well above the 200 simple moving average (green, 4 hours). On the upside, immediate resistance is near the 1.2620 level.
The 50% Fib retracement level of the recent decline from the 1.2732 swing high to the 1.2502 low is also near 1.2620. The next key resistance is near the 1.2640 level.
The main resistance is near 1.2670. A close above the 1.2670 zone could open the doors for more upsides. The next stop for the bulls might be 1.2740.
If there is another decline, the pair might find support near the 1.2500 level. If there is a downside break below the 1.2500 support, the pair could drop toward the 1.2450 level. The next major support is 1.2420, below which the bears might aim for 1.2300.
Looking at EUR/USD, the pair declined heavily toward 1.0740 and there is a risk of more downsides in the near term.
Economic Releases
- UK Claimant Count Change for Nov 2023 – Forecast 20.3K, versus 17.8K previous.
- UK ILO Unemployment Rate for Oct 2023 (3M) – Forecast 4.2%, versus 4.7% previous.
- US Consumer Price Index for Nov 2023 (MoM) – Forecast +0.1%, versus 0% previous.
- US Consumer Price Index for Nov 2023 (YoY) – Forecast +3.1%, versus +3.2% previous.
- US Consumer Price Index Ex Food & Energy for Nov 2023 (YoY) – Forecast +4%, versus +4% previous.
Japan’s PPI slows to weakest pace since February 2021
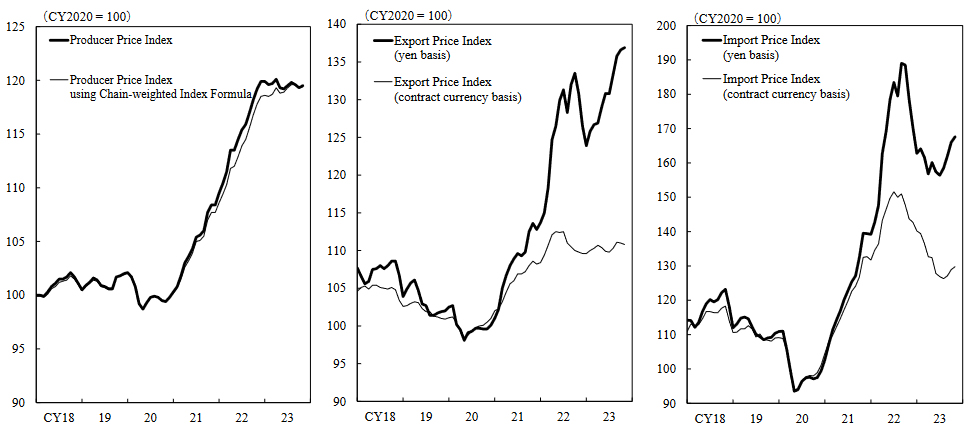
Japan's PPI slowed notably from 0.9% yoy to 0.3% yoy in November, but beat expectation of 0.1% yoy. That's nonetheless still the weakest pace since February 2021. November marked the 11th straight month in which the pace slowed.
Export prices was unchanged at 0.9% yoy. Import price decline slowed from -12.7% yoy to -9.7% yoy, staying negative for the eighth month.
During the month, PPI rose 0.2% mom. Import prices rose 0.7% mom. Export prices fell -0.2 %Mom.
Producer price growth stayed below the most recent consumer inflation reading for a third month. Growth in consumer prices excluding fresh food inched up to 2.9% in October.
Australia’s NAB business confidence and conditions decline, signaling continued soft growth
Australia NAB Business Confidence fell from -3 to -9 in November. Business Conditions fell from 13 to 9. Trading conditions fell from 19 to 13. Profitability conditions fell from 11 to 6. Employment conditions were unchanged at 8.
NAB Chief Economist Alan Oster remarked, "Both confidence and conditions declined in the month and after a period of relative stability through mid-2023 appear to be softening further." He pointed out that, excluding the pandemic period, business confidence is at its weakest since around 2012. This was a time characterized by significantly weaker conditions and slowing growth in advanced economies.
Despite these declines, Oster noted that business conditions remain above average, reflecting their strong starting point. He emphasized the importance of monitoring whether this drop in confidence continues and if a trend develops in business conditions. For the moment, these indicators suggest "ongoing soft growth in Q4".
Australia’s Westpac consumer sentiment rose to 82.1, still far from upbeat
The latest release from Australia reveals a modest uptick in Westpac Consumer Sentiment Index, which rose by 2.7% mom to 82.1 in December. Despite this increase, Westpac's analysis describes the sentiment as "still very weak," emphasizing that "consumers remain far from upbeat."
Regarding RBA's next meeting on February 5-6, Westpac said, the "there is now a higher bar" to further tightening. It highlights the "subdued growth profile" and a "particularly weak household sector" underscored by the recent consumer sentiment results, suggesting that these factors might raise the threshold for another rate hike.
However, it's important to note the central bank's stance towards inflation. RBA has expressed a "very low tolerance for any upside surprises" in inflation rates, making the upcoming inflation data and the detailed quarterly release, due in late January, pivotal for February policy decision.
Swiss Franc Shines, Turns to SNB Decision for Fuel
- SNB announces its decision at 08:30 GMT Thursday
- Markets pricing in 25% probability for a rate cut
- However, that's unlikely to happen so soon
- Overall, outlook for Swiss franc remains positive
Swiss economy slows
The Swiss economy hit a road bump lately. Economic growth almost came to a standstill in the third quarter, printing just 0.3% from a year earlier as the manufacturing sector continued to struggle.
Similarly, inflation slowed sharply in November. The annual inflation rate fell to just 1.4%, some distance below the Swiss National Bank's target of "less than 2%". Hence, one could argue the SNB is the first major central to have won the war against inflation.
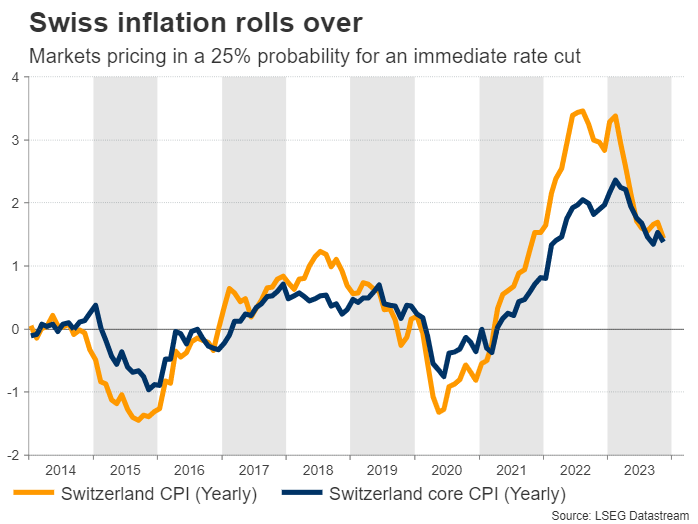
Against this backdrop, markets are pricing in a 25% probability of an immediate rate cut when the SNB meets on Thursday. For next year, traders anticipate almost three rate cuts in total, which is much less than what the Fed and the European Central Bank are expected to deliver.
Is a rate cut realistic?
Admittedly, it seems highly unlikely that the SNB will cut rates so soon. The latest commentary from SNB Chairman Jordan in mid-November included a warning that rates can still be raised further, so it would be a dramatic reversal to abandon that stance and cut rates immediately.
It would make more sense for the SNB to keep rates steady, but drop its tightening bias and shift to a neutral stance instead, putting the emphasis on incoming data to guide its future decisions. That was also the playbook adopted by the European Central Bank, which is usually the SNB's role model in terms of strategy.
The question is, would such a shift be enough to hurt the Swiss franc? Markets are already pricing in rate cuts in 2024, so a neutral shift at this stage would not be much of a surprise for traders.
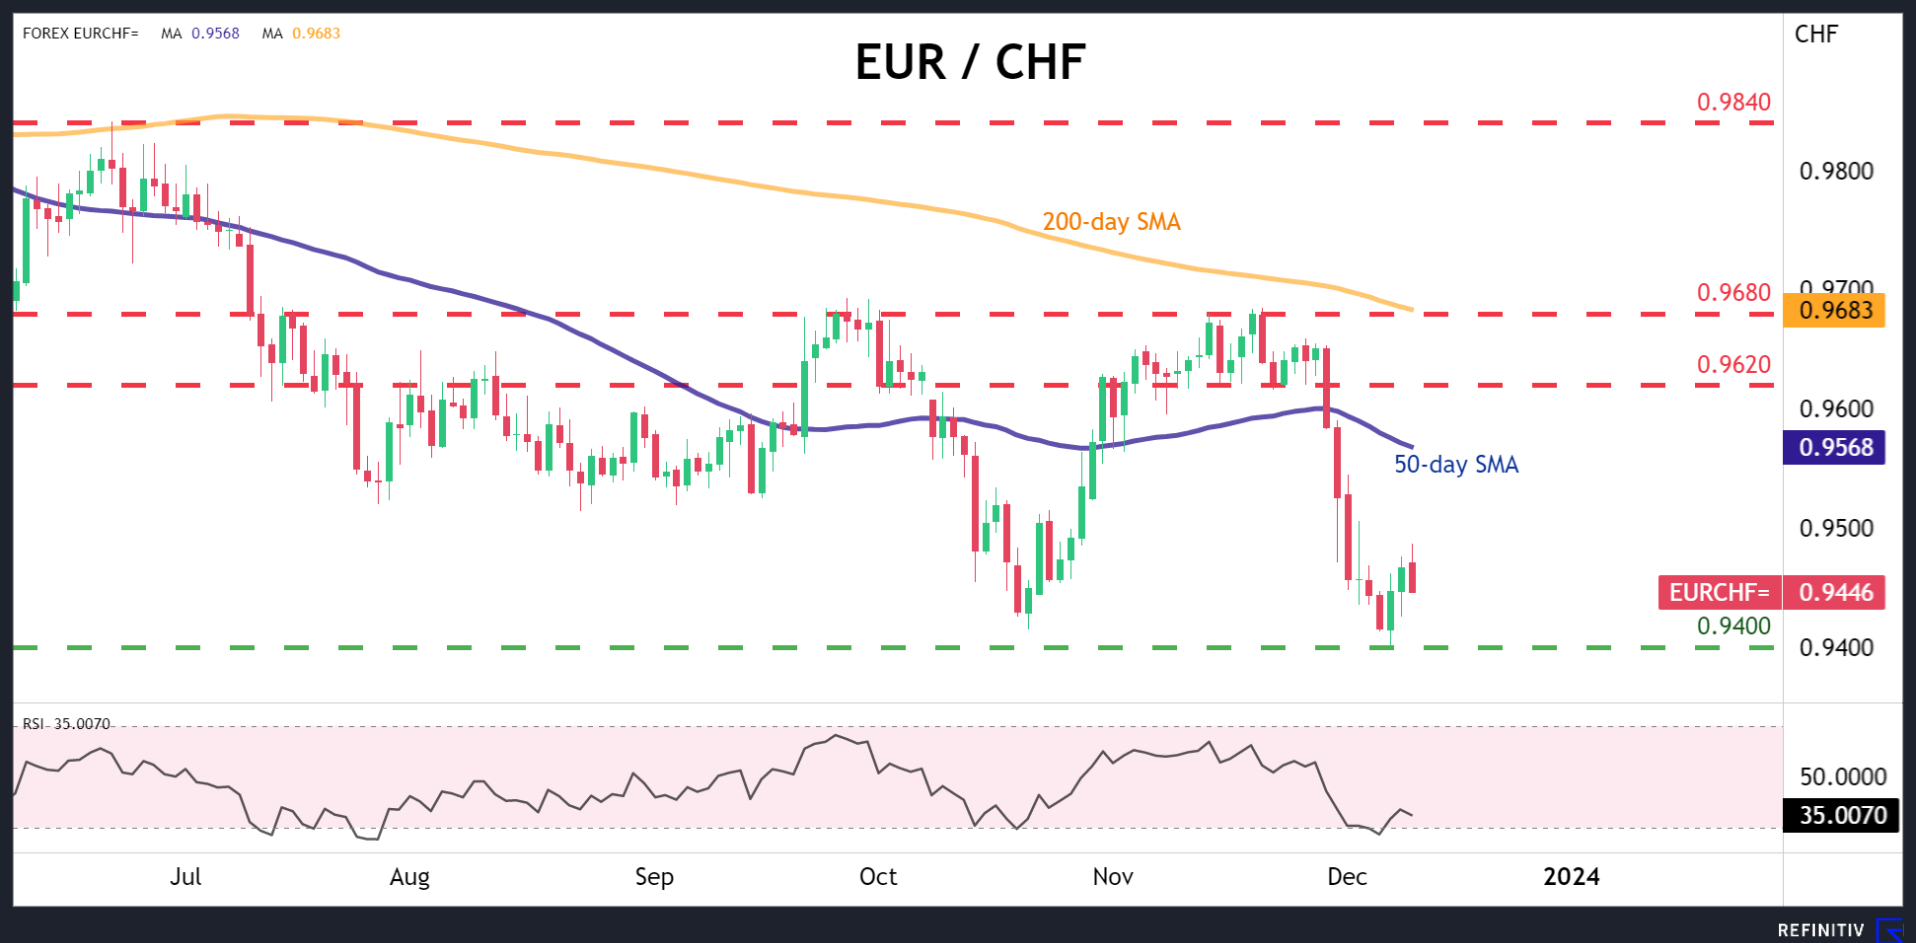
In fact, with the market pricing in a 25% probability for an immediate rate cut, the initial reaction in the Swiss franc will likely be positive if the SNB ultimately keeps rates unchanged. Looking at the euro/franc chart, the 0.9400 region could provide support to any declines, while on the upside, the first major resistance barrier might be around 0.9620.
What does 2024 hold for the franc?
In the big picture, the Swiss franc is the best performing major currency of this year, hitting an eight-year high against the euro and a record high against the Japanese yen lately. The SNB's long-awaited exit from negative interest rates and its FX interventions to prop up the franc this year in order to fight inflation were major factors, alongside the nation's classic current account surplus.
Looking into next year, this stellar performance could continue. Even though the SNB probably won't be so active in the FX market now that inflation has cooled, there might be other positive developments for the franc. For instance, foreign central banks like the Fed and ECB will likely cut rates faster and deeper than the SNB will.
Finally, the franc could also benefit from a slowing global economy, thanks to its safe-haven status. The unfolding economic weakness in Europe and China coupled with the uncertainty surrounding the US presidential election could be a combination that keeps the franc supported, as nervous investors search for shelter.
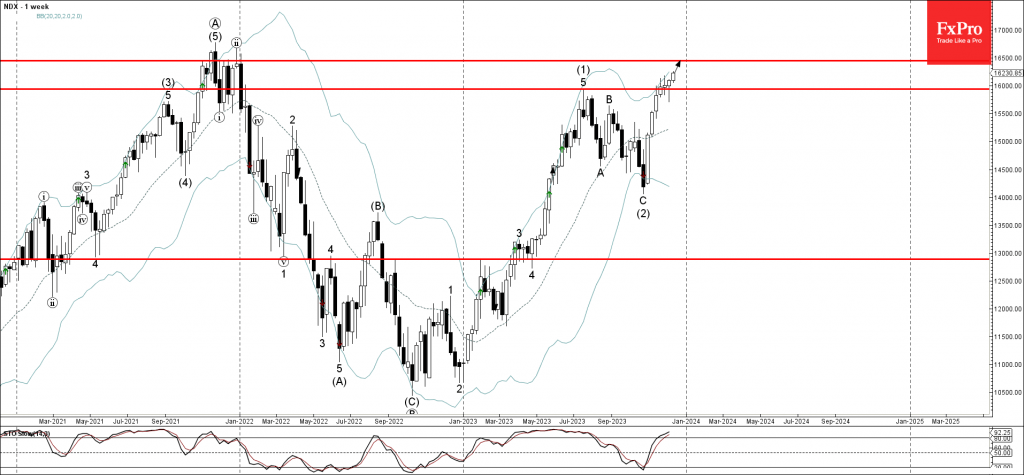
Nasdaq-100 Wave Analysis
- Nasdaq-100 broke resistance level 16000.00
- Likely to rise to resistance level 16500.00
Nasdaq-100 index recently under the bullish pressure after the price broke above the round resistance level 16000.00, which stopped the weekly uptrend earlier this year, as can be seen below.
The breakout of the resistance level 16000.00 accelerated the active intermediate impulse wave (3) .
Given the strong uptrend from the start of this year, Nasdaq-100 index can be expected to rise further to the next resistance level 16500.00 (which started the weekly downtrend at the end of 2021).
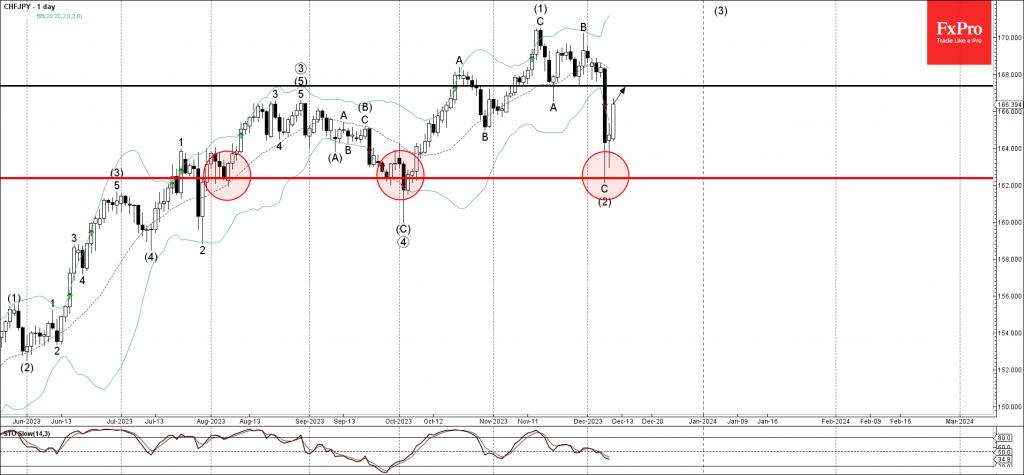
CHFJPY Wave Analysis
- CHFJPY reversed from support level 162.40
- Likely to rise to resistance level 167.35
CHFJPY recently reversed up sharply from the key support level 162.40, which has been reversing the pair from the start of August.
The upward reversal from the support level 162.40 created the daily Japanese candlesticks reversal pattern Long legged Doji.
Given the strong daily uptrend, CHFJPY currency pair can be expected to rise further to the next resistance level 167.35 (former support from the end of November).