Sample Category Title
German ZEW rises to 12.8 on increasing expectation of ECB rate cut
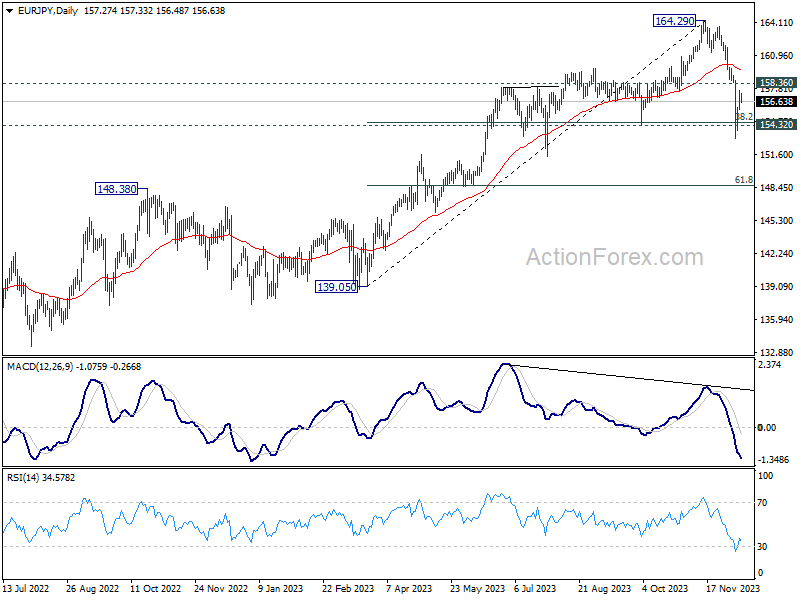
German ZEW Economic Sentiment rose slightly from 9.8 to 12.8 in December, above expectation of 8.8. Current Situation Index rose from -79.8 to -77.1, but missed expectation of -75.5.
Eurozone ZEW Economic Sentiment rose sharply from 13.8 to 23.0, well above expectation of 11.2. Current Situation Index, however, fell marginally by -0.9 pts to -62.7.
ZEW President Achim Wambach noted the slight improvement in Germany's economic outlook could be attributed to doubled expectations of interest rate cuts by ECB in the medium term. In particular, significantly more optimistic expectations are observed in the construction industry.
Dollar Index in a Corrective Wave (4) Rally – Technical Resistance at 104.50
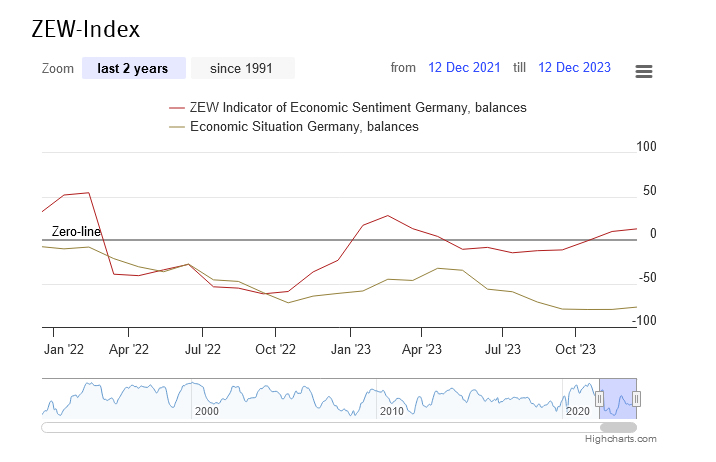
It's an important day for the markets with the US CPI release and expectation of 3.1% down from 3.2%, so dollar and us yields can be volatile today on speculations regarding further policy rate decisions from the FED tomorrow. From an Elliott wave perspective, the DXY is still seen in a corrective phase so I think there can be some limited upside, ideally, near 104.50. If USD index comes down, I still think kiwi can do well; its been one of the strongest in recent weeks. If Dollar jumps after the release then watch out for more weakness on EURUSD pair.
Germany 30 Technical: A Potential Minor Corrective Decline Looms
- Short-term RSI momentum indicator has flashed out bullish exhaustion condition after 6 consecutive weekly positive closes.
- At the risk of minor corrective decline sequence below 16,910 key short-term resistance.
- Intermediate supports rest at 16,590 and 16,440.
The Germany 30 Index (a proxy for the DAX futures) has managed to soar towards the 16,780/850 resistance zone as highlighted in our last analysis and printed a fresh all-time high of 16,829 yesterday, 12 December.
Overall, the major uptrend phase from the October 2022 low of 11,795 remains intact with its major resistance zone at 17,780/18,170 (see Fig 1).
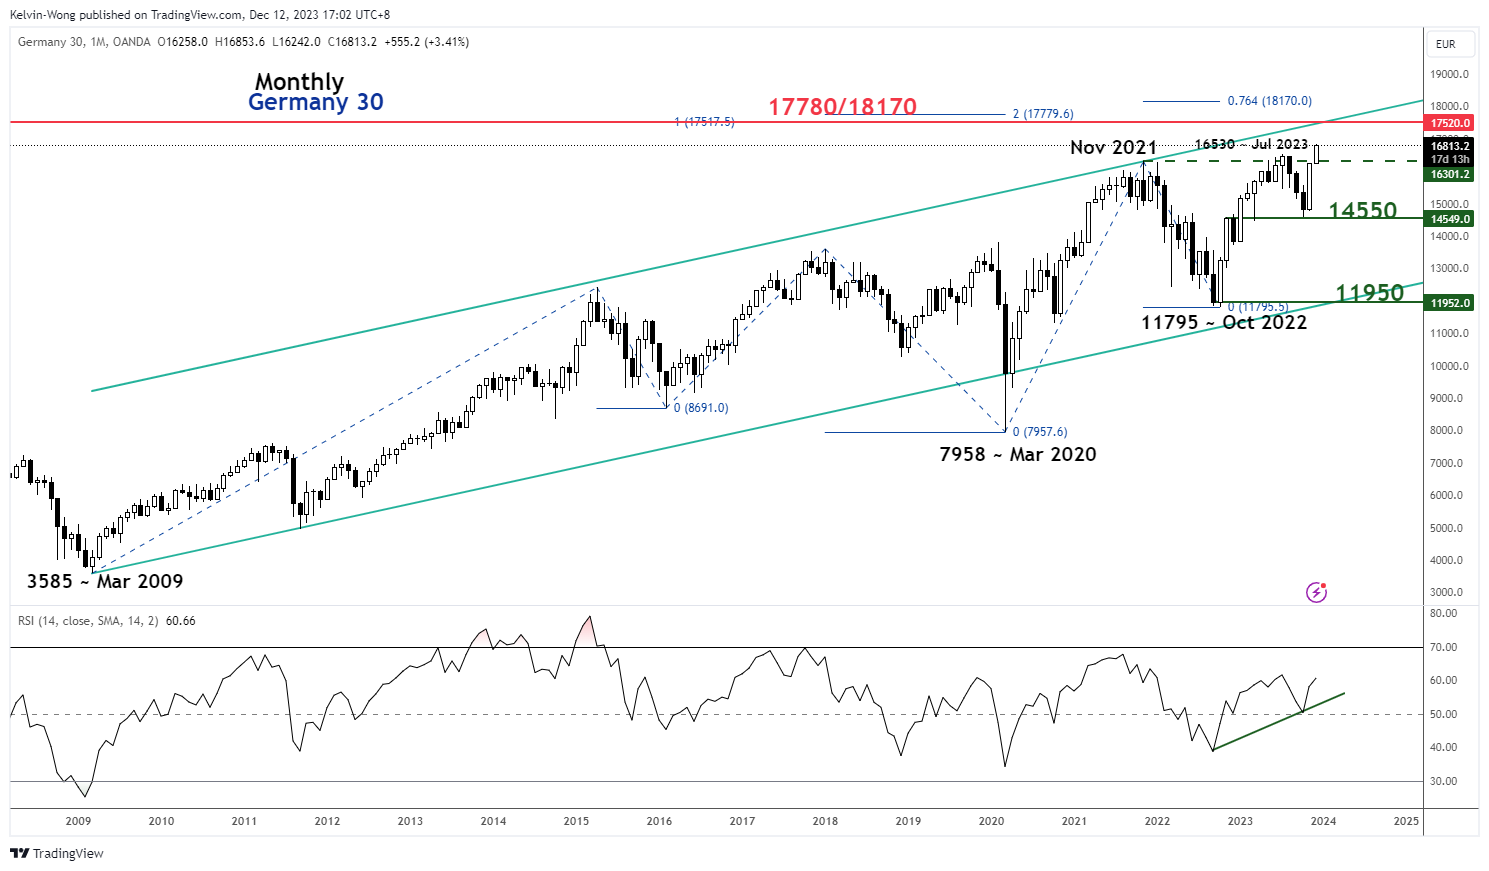
Fig 1: Germany 30 long-term secular trend as of 12 Dec 2023 (Source: TradingView, click to enlarge chart)
At risk of minor corrective decline after 6 consecutive weekly positive closes
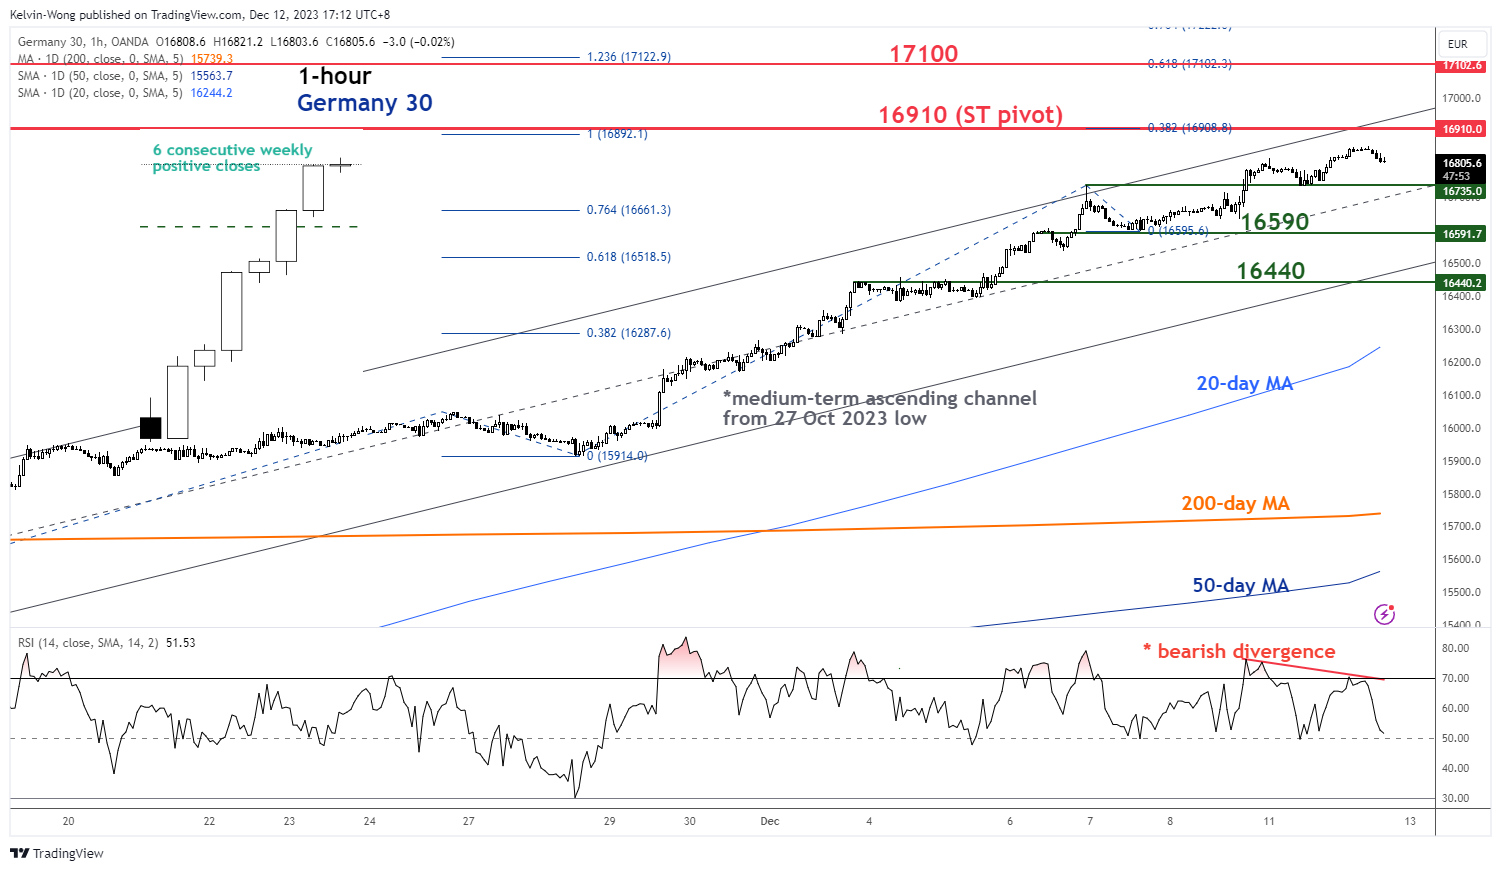
Fig 2: Germany 30 minor short-term trend as of 12 Dec 2023 (Source: TradingView, click to enlarge chart)
In the shorter term, its medium-term uptrend phase in place since the 27 October 2023 low of 14,586 has reached overstretched conditions as it has recorded six consecutive weekly positive closes.
In addition, current price actions have almost reached the upper boundary of the medium-term ascending channel with a bearish divergence condition being flashed out by its hourly RSI momentum indicator at its overbought region yesterday, 11 December.
These observations suggest an increasing risk of an impending minor corrective decline sequence with 16,910 as a key short-term pivotal resistance and break down below 16,735 near-term support sees the next intermediate supports coming in at 16,590 and 16,440.
However, a clearance above 16,910 negates the bearish tone to expose the next intermediate resistance at 17,100.
GBPUSD Pulls Back from 3-month High
- GBPUSD corrects lower after advance pauses
- But seems to be finding traction in the last couple of sessions
- Oscillators lose ground but remain in their positive zones
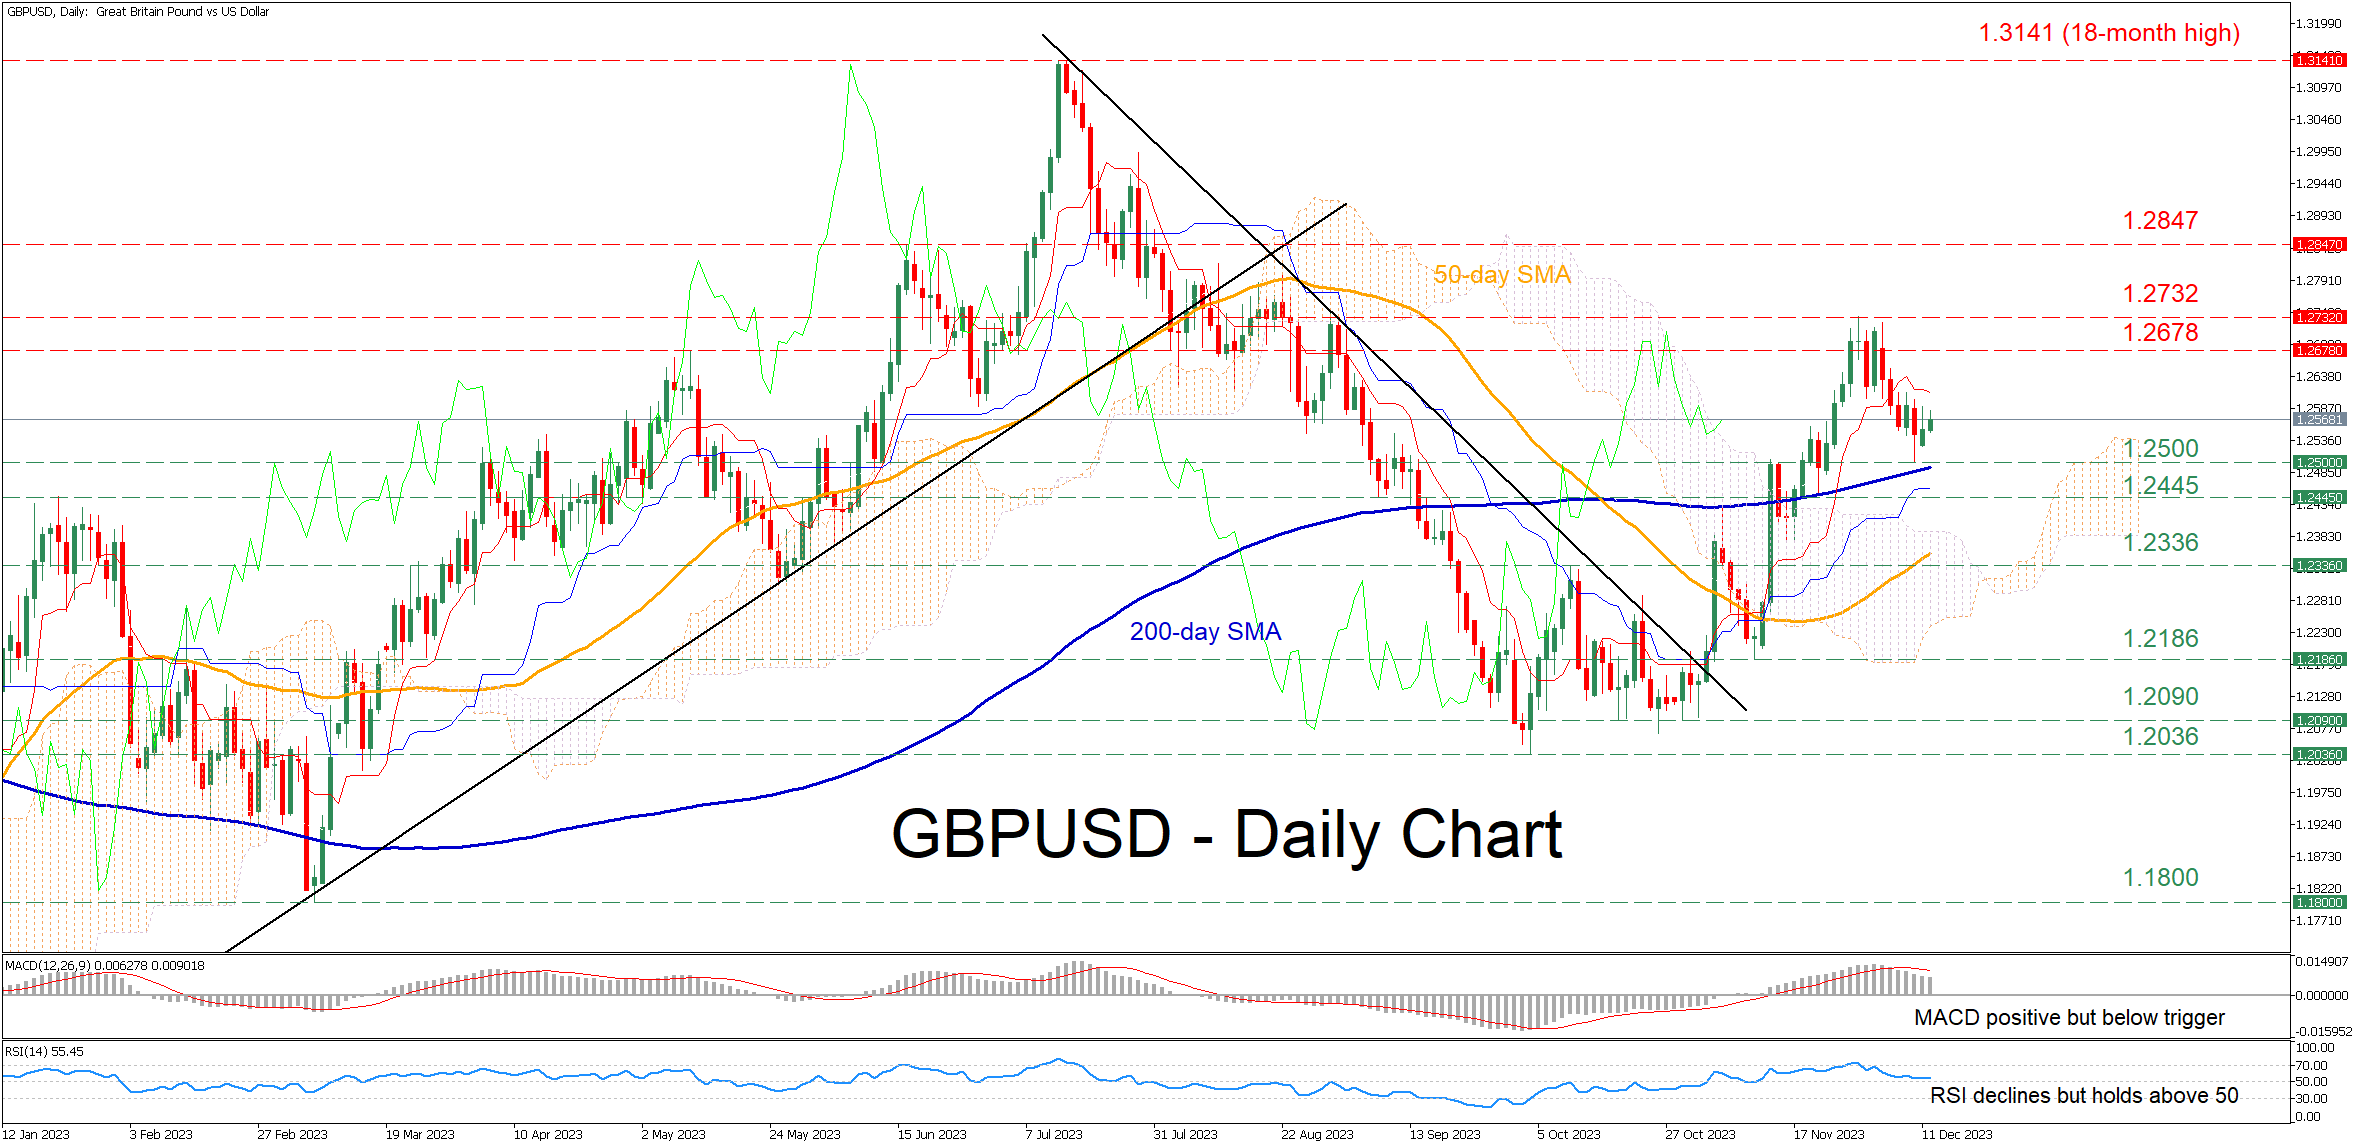
GBPUSD had been forming a profound structure of higher highs and higher lows following its break above the crucial descending trendline in early November. However, the pair’s rally paused at the three-month peak of 1.2732, with the price retracing lower towards the 200-day simple moving average (SMA).
Given that both the RSI and MACD managed to stay within their positive territories, the bulls could attempt to erase the latest pullback and propel the price towards the May peak of 1.2678. A violation of that hurdle could bring the recent rejection region of 1.2732 under examination. Failing to halt there, the pair might advance towards the June high of 1.2847.
On the flipside, should the latest slide persist, the pair could challenge the recent support of 1.2500, which lies very close to the 200-day SMA. Piercing through that floor, the price may then descend towards the December-January resistance zone of 1.2445 that could serve as support in the future. Even lower, the October resistance of 1.2336 could act as the next barrier for the bears to claim.
In brief, GBPUSD experienced a mild correction after reaching overbought conditions. Nevertheless, the pair seems to have found its footing in the last few sessions as it managed to hold above the 200-day SMA.
WTI Crude Oil Holds Neutral in 2023
- WTI oil finds significant support at 200-week SMA
- Will the price end the bearish move soon?
- RSI and stochastic suggest upside correction
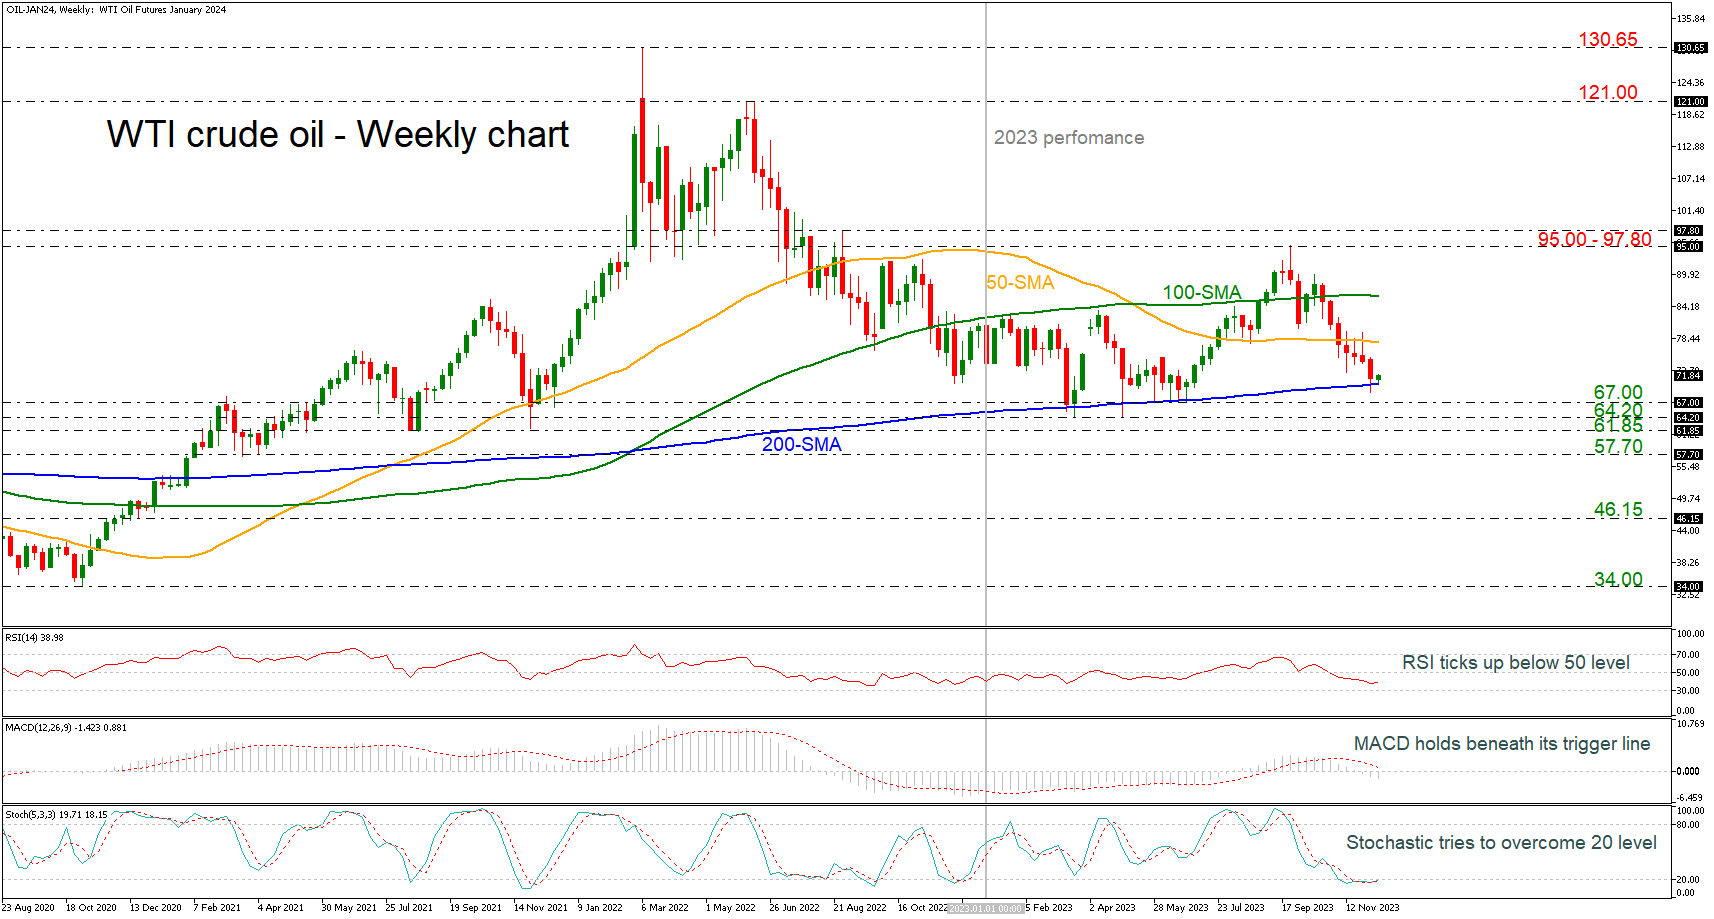
As the year 2023 is coming to an end, WTI crude oil is developing beneath January’s market price. The price is currently testing the 200-week simple moving average (SMA) after seven consecutive red weeks, suggesting that the bearish action may come to an end and 2024 could be more optimistic for oil prices.
Weekly oscillators suggest that downside momentum is losing steam, reflecting the latest pullback in the market. The RSI has turned up in the negative area, while the stochastic oscillator is posting a bullish crossover within its %K and %D lines in the oversold territory. However, the MACD is still strengthening its bearish momentum below its trigger and zero lines.
In case buyers take back control and pierce above the 50-week SMA, which stands near 77.90, that would bring the price towards the 100-week SMA at 86.14 which provides strong resistance to advances. Even higher, another significant region to watch is 95.00-97.80 which if penetrated would switch the outlook to bullish.
Now should sellers stay in charge, the first obstacle to the downside is the 200-week SMA at 71.80, which has been supporting the price since January 2021. If violated, the spotlight would then shift to the 67.00 handle ahead of the next support lines at 64.20 and 61.85, taken from the lows on April 30 and the bottom in November 2021.
Summarizing, the one-year outlook remains neutral. A decisive break above 95.00 is needed to bring that into doubt, although a downside movement would require much heavier declines below 67.00.
Recent Inflation Data Probably Will Allow Fed to Remove a Final Rate Hike
Markets
Markets yesterday understandably started the week in a wait-and-see modus, looking forward to key eco data, including US CPI and policy meetings of the Fed, the ECB and the Bank of England later this week. One-year inflation expectations in the New York Fed’s consumer expectations survey eased slightly from 3.57% to 3.36%, the lowest level since April 2021, but were unchanged for the horizon 3-y (3.0% ) and 5-y ahead. The immediate impact on US bond trading was limited. US yields trended higher ahead of a $50 bln 3-y Treasury Note auction and a $37 bln 10-y note sale. Both auctions only attracted mediocre investor interest. Still yields finally trended south again after the auctions were out of the way. US yields changed between -1.3 bps (2-y) and +2.3 bps (30-y). German yields also altered less than 2 bps across the curve. Expectations for easier financial conditions continue to support equities. The Dow and the S&P 500 touched now top levels for 2023. The Nasdaq set a 2023 closing high. On FX market headlines/speculation on whether or the BOJ will change its ultra-easy policy anytime soon still were an important driver for trading. Bloomberg comments said that BOJ officials considered it too early to already leave the era of sub-zero rates. USD/JPY throughout the day rebounded to the mid 146 area to close at 146.18. Gains in the DXY index (close 104.1) were limited and technically insignificant. EUR/USD even closed little changed at 1.0765. Sterling tested the EUR/GBP 0.8550 area, but a sustained break again didn’t occur.
Today, the US November CPI release will take center stage. Headline inflation is expected unchanged on the month with the Y/Y measure to ease from 3.2% to 3.1%. The consensus expects core inflation at 0.3% M/M and 4.0% Y/Y (from 0.2% and 4.0% previous month). We assume that a big surprise in either direction will be needed to trigger a big/sustained market reaction going to tomorrow’s Fed policy decision. In the meantime, we look out whether the bottom in yields set last week might become more solid. The recent inflation data probably will allow Fed governors in the dots to remove a final rate hike. Question now is how much room for rate cuts they see in 2024. A maximum of 50 bps expected rate cuts might help to trigger some consolidation on the recent decline in yields. Such a scenario might also put a floor for the dollar. In Europe, we look out whether ZEW German investor confidence might bring some good/less negative news.This morning, UK November labour market data printed on the soft side of expectations. Payrolled employees declined 13k compared to the previous month and there was a slowdown in the October average weekly earnings (7.2% from 8.0% vs 7.7% expected overall; 7.3% from 7.8% vs 7.4% expected ex bonus). EUR/GBP currently gains about 10-15 ticks to trade near 0.857.
News & Views
The Polish parliament yesterday appointed Donald Tusk as the new prime minister in a 248-201 vote. It did so after outgoing PM Morawiecki lost a vote of confidence a few hours earlier, effectively bringing eight years of PiS rule to an end. Tusk’s centre-right and pro-European Civic Plaftorm, a coalition of opposition parties, won the elections in October. But the PiS being still the biggest single party was given a first shot by president Duda to try to secure another term in office even as key potential partners to form a majority ruled out working together in advance. Duda is a PiS appointee and is said to have helped stalling Tusk’s nomination. He’s also seen as the biggest threat to Tusk’s legislative agenda due to its veto powers. The president on Monday left for a two-day visit to Switzerland, meaning Tusk only can be signed into office upon his return tomorrow. The incoming prime minister will nevertheless present his government and its programme in parliament later today and attend a EU summit later this week.
Indian authorities recently banned onion exports, restricted the use of sugar for ethanol production and cut the size of wheat stocks traders and retailers are allowed to hold. This comes on top of other export restrictions on rice, wheat and sugar that were already in place and have helped sent global prices materially higher amid weather-related supply disruptions in other major producers as well. Despite a recent correction, sugar prices are at multiyear highs. Rice in recent weeks is being sold for prices well above historical averages. India’s decision is seen in light of next year’s general elections with the Modi government trying to dampen domestic prices in the run-up.
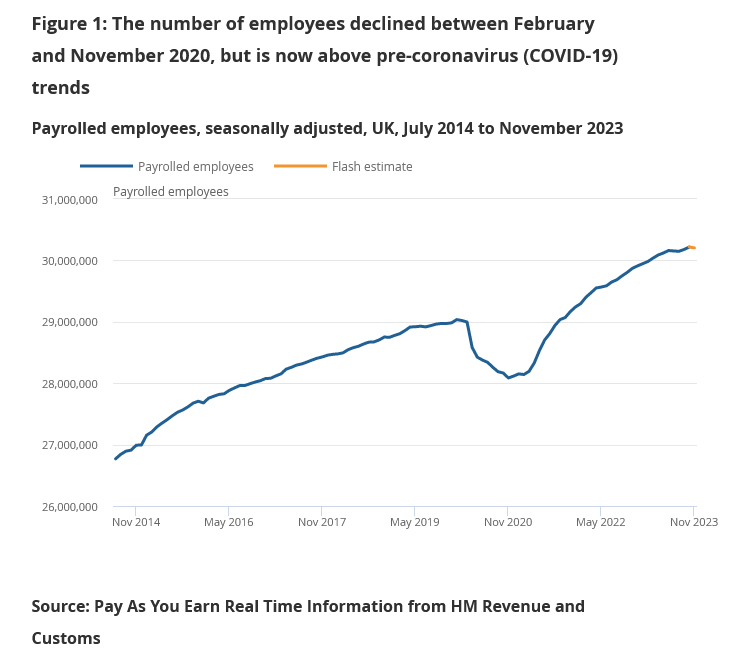
UK payrolled employment fell -13k in Nov, unemployment rate steady at 4.2% in Oct
UK payrolled employment fell slightly by -13k in November, compared with October. Comparing with November 2022, payrolled employment rose 1.1% yoy or 333k. Meanwhile monthly pay increased by 5.3% yoy, slowed from 6.2% yoy.
In the three months to October, unemployment rate was unchanged at 4.2% yoy. Average earnings (including bonus) growth slowed from 8.0% yoy to 7.2% yoy, below expectation of 7.7% yoy. Average earnings (excluding bonus) growth slowed from 7.7% yoy to 7.3% yoy, below expectation of 7.4% yoy.
Nikkei Strong Reaction Higher From The Equal Legs Area
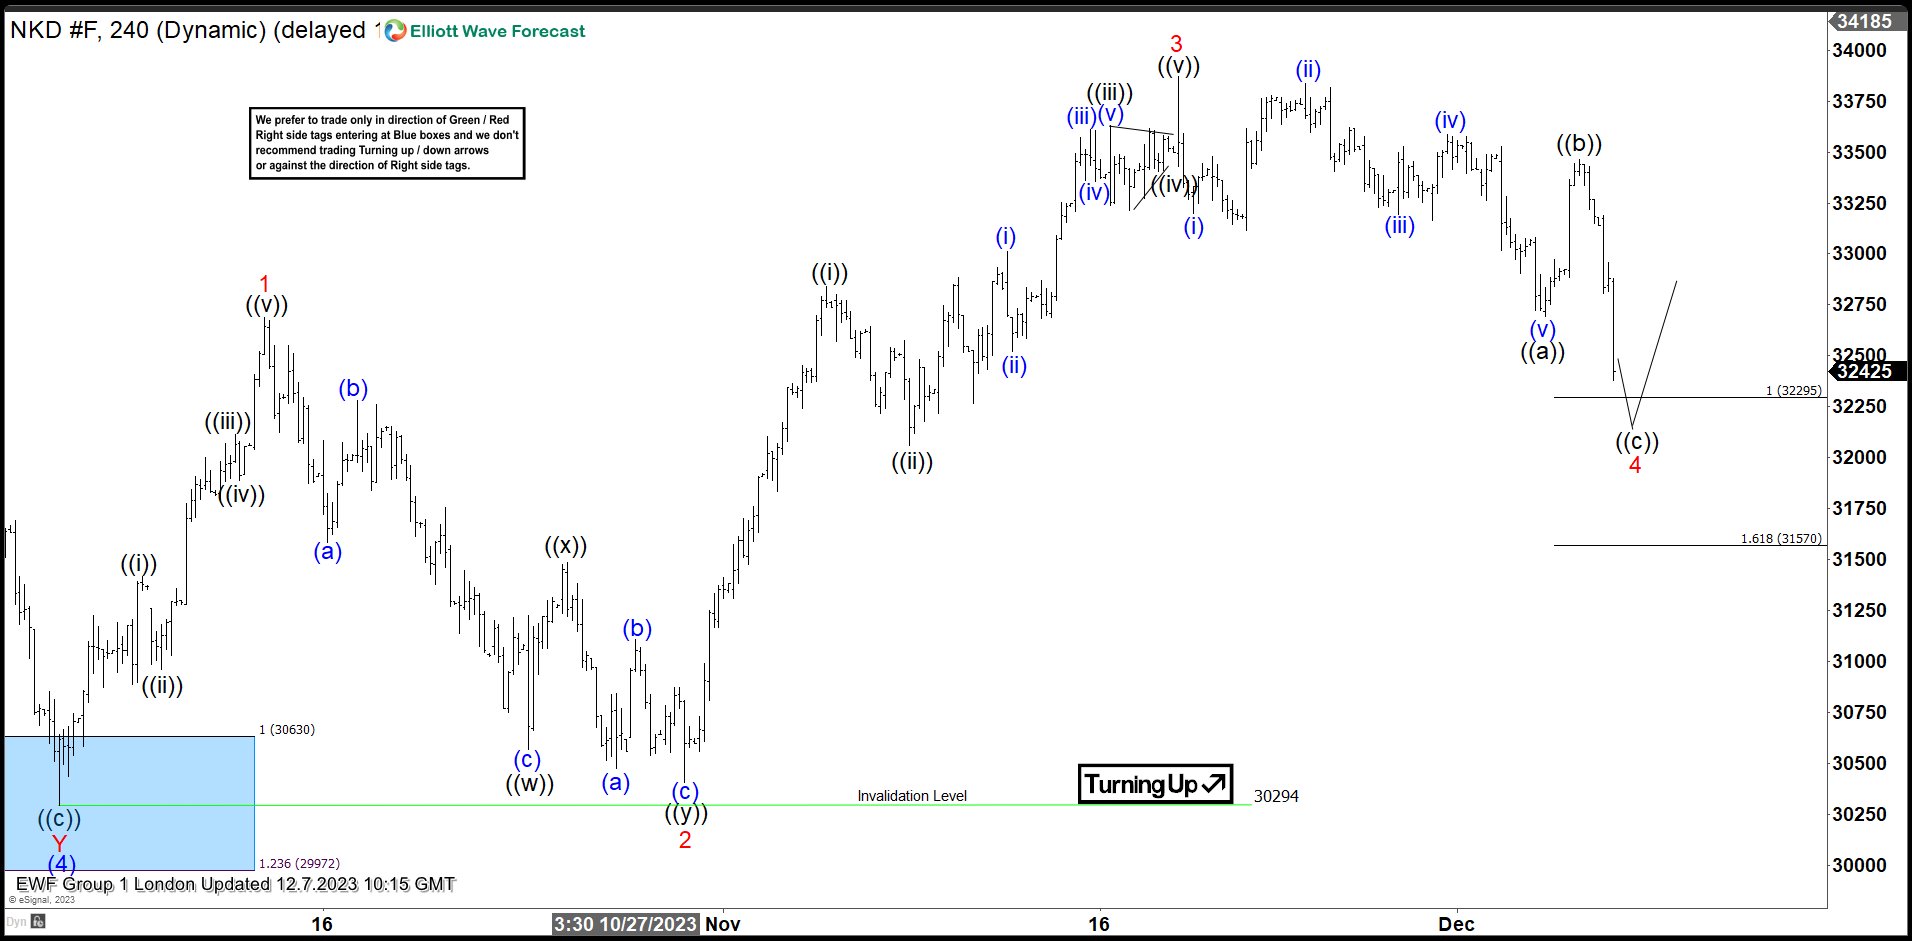
In this technical blog, we will look at the past performance of the 4-hour Elliott Wave Charts of Nikkei. We presented to members at the elliottwave-forecast. In which, the rally from 04 October 2023 low unfolded as an impulse structure. And showed a higher high sequence favored more upside extension to take place. Therefore, we advised members not to sell the $NKD_F & buy the dips in 3, 7, or 11 swings. We will explain the structure & forecast below:
Nikkei 4-Hour Elliott Wave Chart From 12.07.2023
Here’s the 4-hour Elliott wave chart from the 12/07/2023 London update. In which, the cycle from the 10/30/2023 low ended in wave 3 as an impulse structure at 33870 high. Down from there, the index made a pullback in wave 4 to correct that cycle. The internals of that pullback unfolded as Elliott wave zigzag structure where wave ((a)) at 32695 low. Wave ((b)) ended at 33465 high and wave ((c)) managed to reach the equal legs area at 32295- 31570 area. From there, buyers were expected to appear looking for the next leg higher or for a 3-wave bounce minimum.
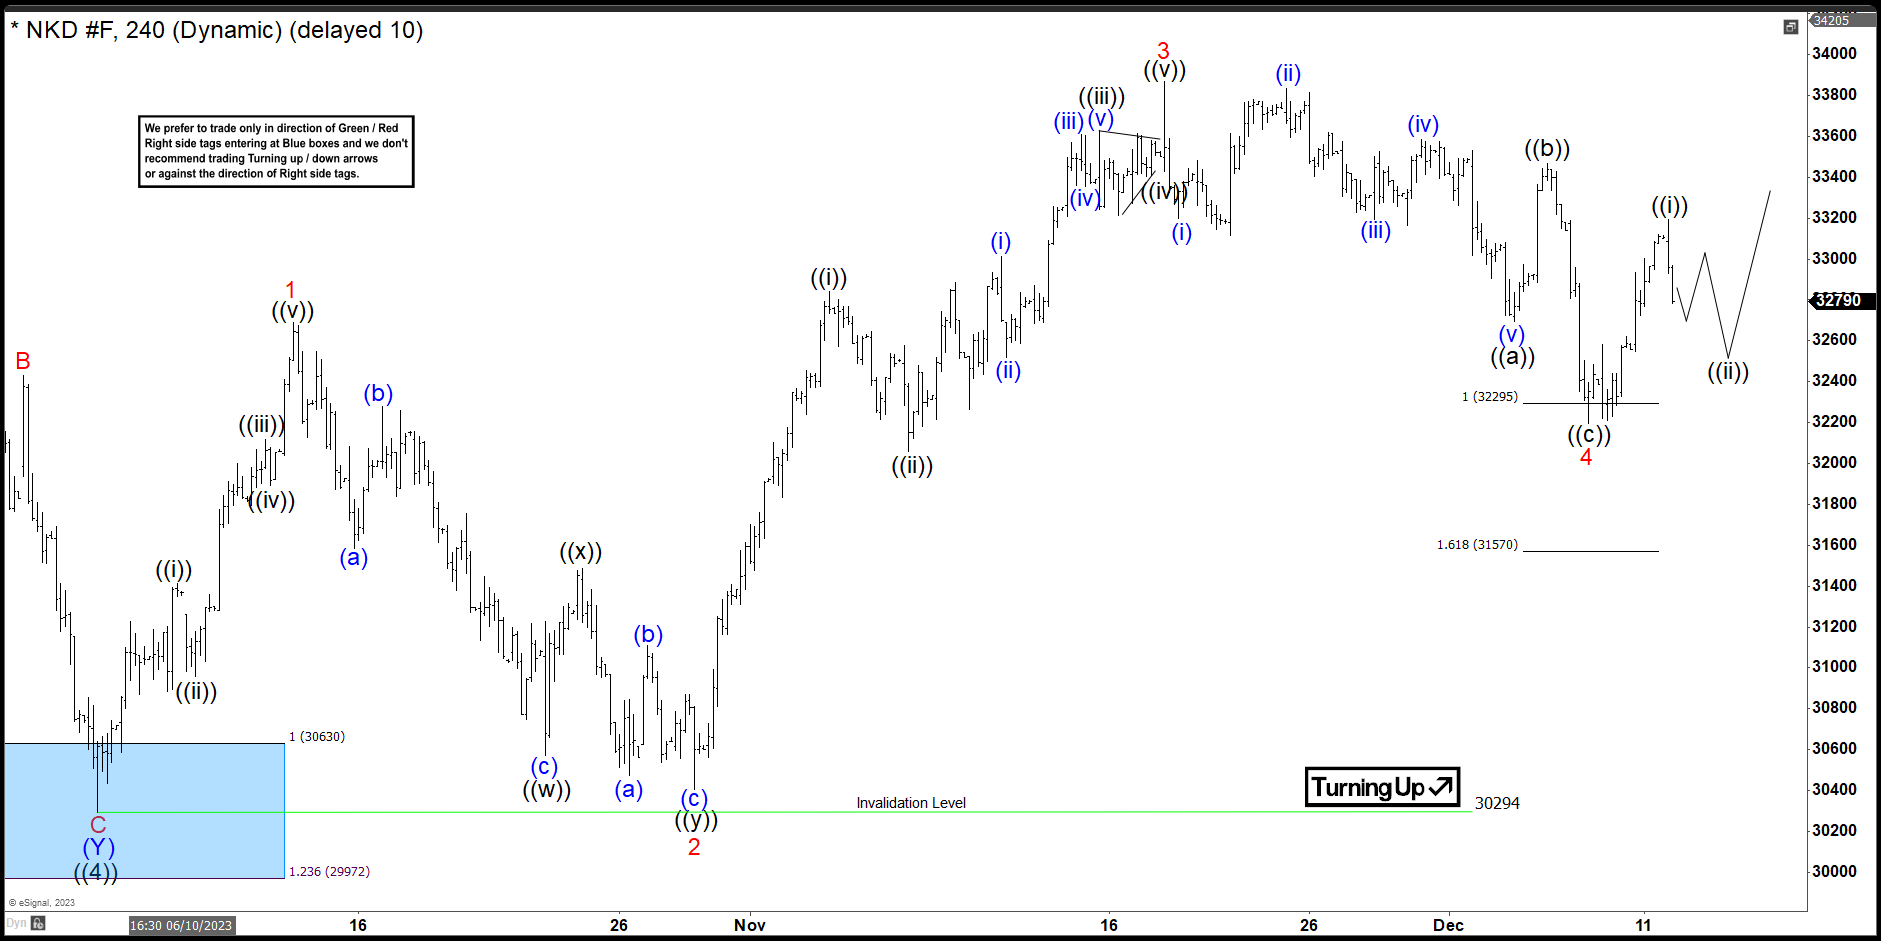
Nikkei Latest 4-Hour Elliott Wave Chart
This is the latest 4-hour Elliott wave Chart update. In which the Nikkei is showing a strong reaction taking place, right after ending the zigzag correction within the equal legs area. Allowed members to create a risk-free position shortly after taking the long position. However, a break above the 33870 high is still needed to confirm the next extension higher & avoid a double correction lower.
GBP/JPY Daily Outlook
Daily Pivots: (S1) 182.01; (P) 183.17; (R1) 184.68; More...
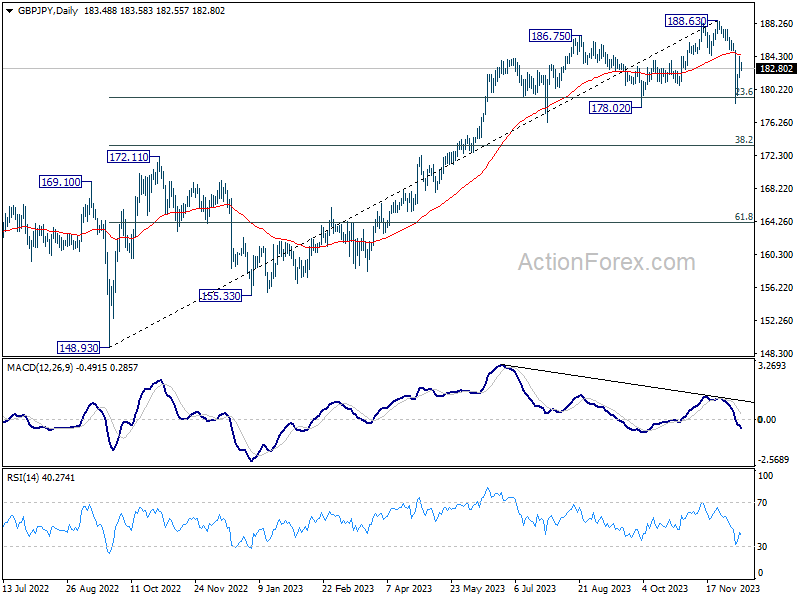
Intraday bias in GBP/JPY is turned neutral first with current retreat. On the downside, break of 181.66 minor support will suggest that rebound from 178.58 has completed. Intraday bias will be back to the downside for retesting 178.58 low. Overall outlook will stay bearish as long as 184.44 support turned resistance support turned resistance holds.
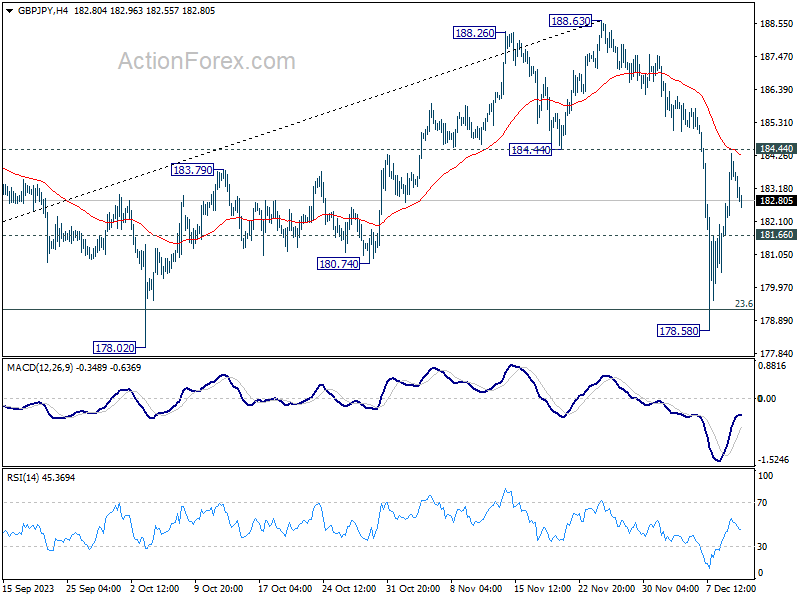
In the bigger picture, while a medium term top is in place at 188.63, there is no clear sign of long term bearish trend reversal yet. As long as 55 W EMA (now at 175.67) holds, price actions from 188.63 are seen as a corrective move only. Larger up trend from 123.94 (2022 low) could resume at a later stage.
EUR/JPY Daily Outlook
Daily Pivots: (S1) 156.26; (P) 156.98; (R1) 158.04; More..
While EUR/JPY's recovery from 153.15 could extend higher, upside should be limited below 158.36 minor resistance to bring another fall. On the downside, below 155.98 will turn bias to the downside for retesting 153.15. Break of 153.15 and sustained trading below 38.2% retracement of 139.05 to 164.29 at 154.64 will target 61.8% retracement at 148.69 next.
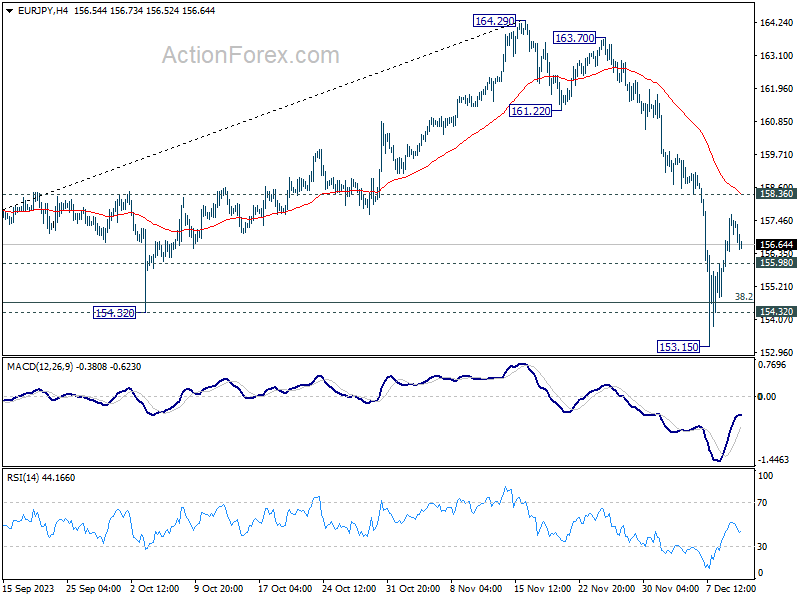
In the bigger picture, price actions from 164.29 medium term top are tentatively seen as a correction to rise from 139.05 for now. As long as 148.48 resistance turned support holds (2022 high), larger up trend from 114.42 (2020 low) could still resume through 164.29 at a later stage.