Sample Category Title
EURUSD Wave Analysis
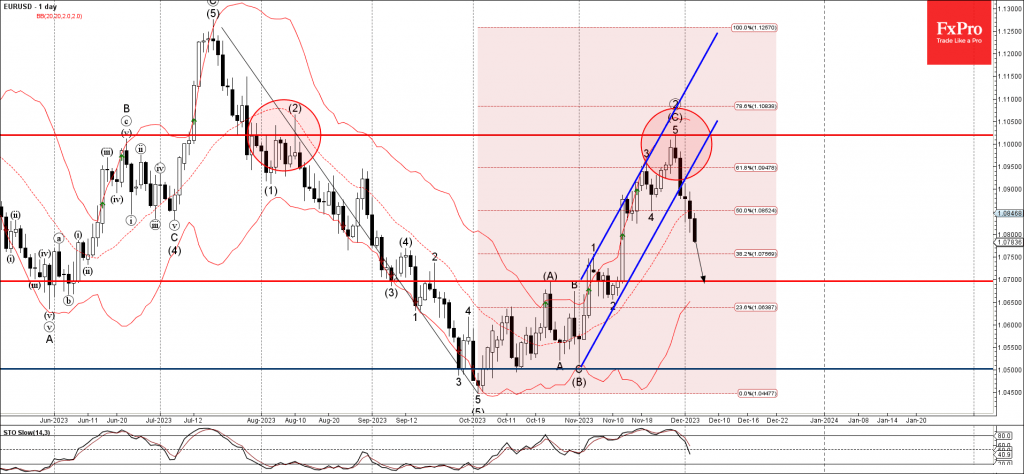
- EURUSD broke daily up channel
- Likely to fall to support level 1.7000
EURUSD currency pair under the bearish pressure after the earlier breakout of the support trendline of the daily up channel, which enclosed the previous impulse wave (C) from the start of November.
The breakout of this daily up channel accelerated the active impulse wave 1.
Given the clear daily downtrend and the strong USD bullish sentiment seen today, EURUSD can be expected to fall further to the next support level 1.7000 (former monthly high from October).
Nasdaq – How Sustainable is the Stock Market Rally? PMIs a Positive Surprise
- Are interest rate expectations too optimistic?
- PMI revisions positive but the outlook is broadly unchanged
- NAS100 nears all-time highs
Equity markets in Europe and the US continued to edge higher on Tuesday despite many now questioning whether investors are getting too carried away.
The rally appears to be based on the view that central banks from the Fed to the ECB and BoC will start cutting interest rates in March and then do so another three times over the rest of 2024. That’s quite the difference from what policymakers have insisted on for many months but there has undoubtedly been a change in tone recently.
Whether that’s been enough to warrant such optimism is what many are now questioning and what, I’m guessing policymakers will address at the December meeting. Regardless of whether they push back against the scale of cuts next year, it’s clear now that there’ll be quite a shift from central banks at their meetings this month, based on recent commentary.
Whether that will be enough to constitute the pivot that’s been so talked about this year may well determine whether markets continue to price in a March cut as a u-turn of that magnitude will have to be clear from the meeting. The Fed in September indicated it expected to raise rates again, after all.
Services PMIs revised higher but outlook remains relatively unchanged
There were a lot of upward revisions to the PMI surveys from Europe and the US today and in the all-important services sector. While the revisions don’t really change the outlook in any considerable way – euro area still facing a mild recession, UK flat growth, US resilient – it is encouraging that a soft landing is still attainable.
Nasdaq nears all-time highs
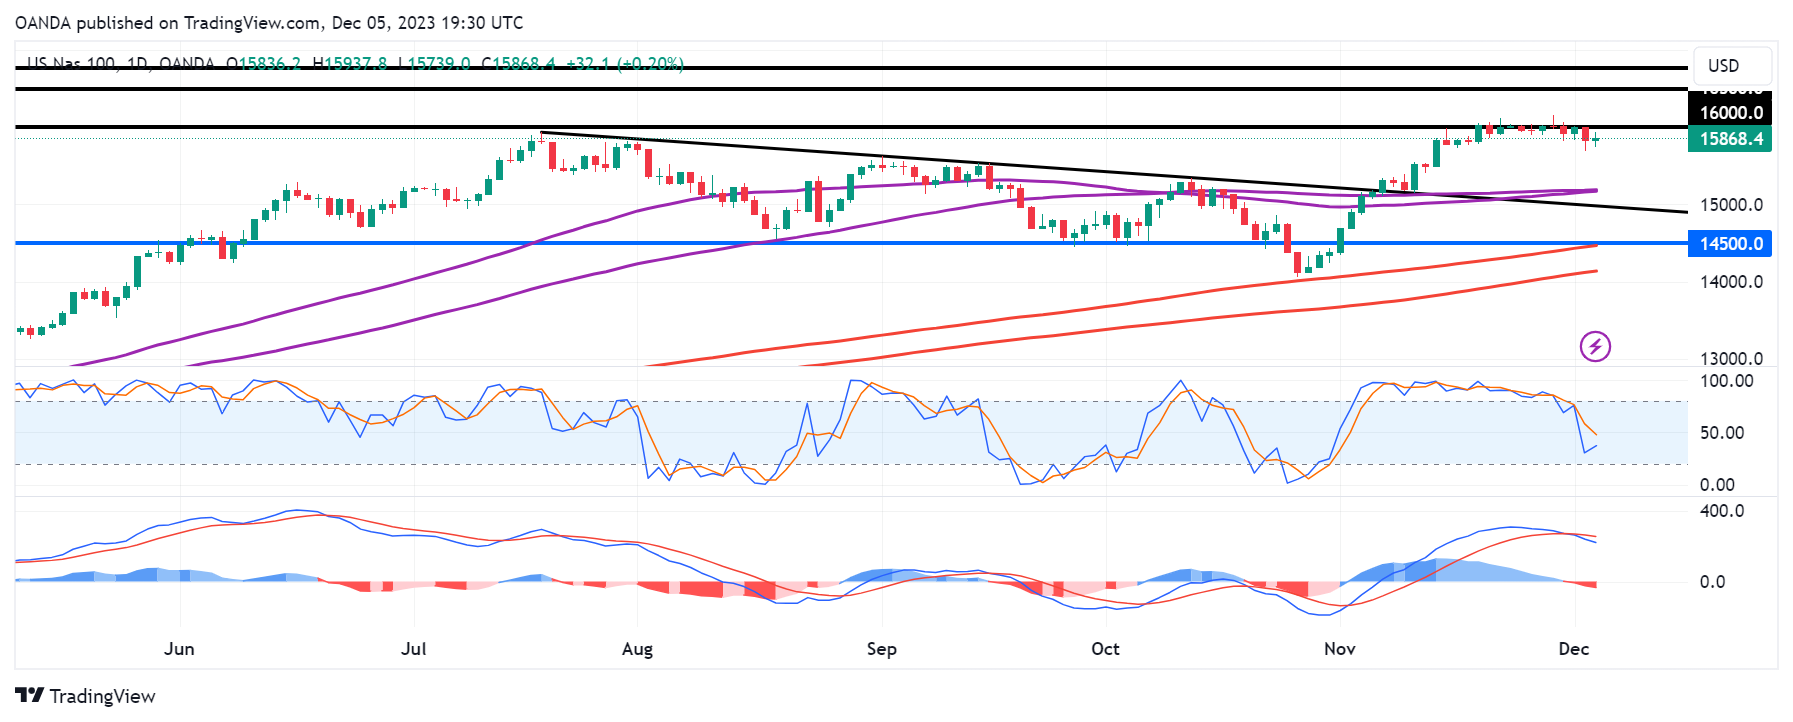
The NAS100 appears to have stalled around 16,000 over the last couple of weeks which may be what’s making investors a little nervous.
NAS100 Daily
Source – OANDA on Trading View
The momentum indicators don’t look particularly healthy either, with both the stochastic and MACD making lower highs during the recent new peak in the price. A negative divergence doesn’t necessarily mean the price has peaked but it may suggest the rally is running on fumes.
Will US NFP Report Come to Dollar’s Rescue?
- Data and Fed rhetoric prompt investors to increase rate cut bets
- Dollar’s next major test comes in the form of the US jobs report
- The data comes out on Friday at 13:30 GMT
Dollar bleeds as investors ramp up bets of massive rate cuts
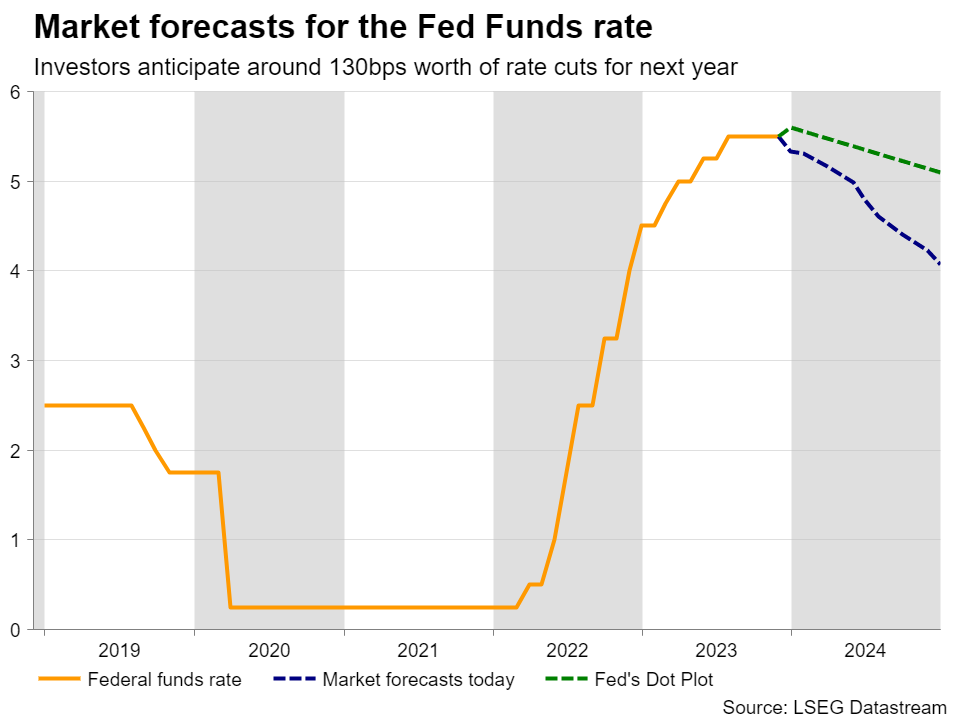
The US dollar has been bleeding lately as the market keeps adding to its Fed rate cut bets on every opportunity. Following the disappointing jobs data for October and the larger-than-expected inflation slowdown for the same month, it was Fed Governor Waller’s turn to add fuel to expectations of massive rate cuts next year. Early last week, Waller said that if the decline in inflation continues for several more months, they could start lowering the policy rate, marking the first time a Fed official discussed the possibility of lower rates. The latest hit for the dollar came from Fed Chair Powell, who said that the risks of the Fed slowing the economy more than necessary have become more balanced with the risks of not moving interest rates high enough to control inflation.
Although he did not shut the door to more increases if deemed necessary and was clearly more hawkish than Waller, the market may have interpreted his comments on balanced risks as validating the end of this tightening crusade and was encouraged to bring forth its rate-cut bets. According to Fed funds futures, a quarter point rate cut is more-than-fully priced in for May, with the probability of it being delivered in March rising to nearly 70%. What’s more, the total number of basis points worth of rate reductions expected by the end of 2024 has gone up to around 130.
Spotlight turns to the US employment numbers for November
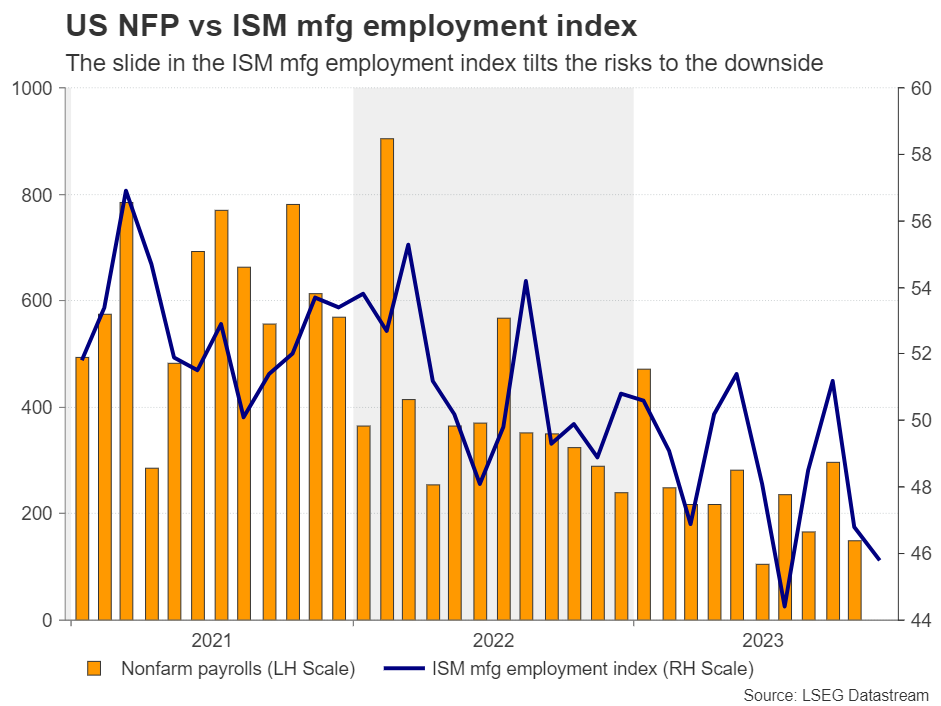
After Powell, investors will turn their attention back to economic data as Fed policymakers have entered the blackout period before next week’s policy decision. Following the ISM manufacturing PMI for November last week, which stayed below the boom-or-bust zone of 50 for the 13th consecutive month, Tuesday’s non-manufacturing index may attract special attention. However, the highlight of the week will most likely be the US employment report for November on Friday.
The unemployment rate is expected to have remained unchanged at 3.9% and nonfarm payrolls to have accelerated to 180k from 150k in October. That said, the ISM manufacturing PMI revealed that factory employment declined further as hiring slowed and layoffs increased. Thus, if the non-manufacturing survey paints a similar picture, then the risks surrounding the NFP print could be tilted to the downside.
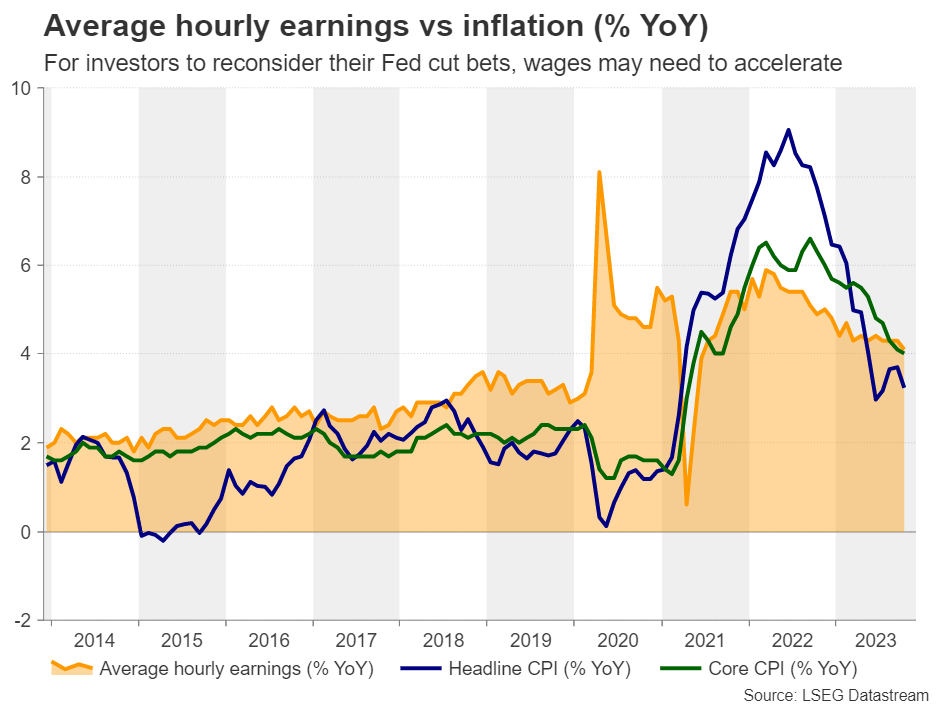
But, even if the forecasts are met, for investors to scale back some rate-cut bets for next year, these numbers may need to be accompanied by a reacceleration in wages. This could spark some fear that inflation could pick up steam in the months to come, thereby prompting the Fed to keep interest rates high for a longer period than currently anticipated. That said, the forecast for average hourly earnings is for a further slowdown to 4.0% y/y from 4.1%, which could solidify investors’ belief and push the dollar lower. After all, lately, market moves suggest that investors are selling the dollar more aggressively when data or headlines corroborate their view, rather than buying it when there are indications supporting the opposing ‘higher for longer’ case.
Aussie and kiwi may continue outperforming the dollar
Expectations of several rate cuts by the Fed do not only translate into dollar weakness and sliding Treasury yields, but also into improving risk appetite and rallying stocks, as lower yields mean higher present values for high-growth firms that are usually valued by discounting expected future cash flows. Ergo, the risk-linked currencies, like the aussie and the kiwi, are getting an extra boost against the US dollar compared to other major currencies.
On top of that, the RBNZ appeared hawkish at its latest gathering, and although the RBA adopted a softer tone this week, investors are still assigning a 20% probability for another hike at the Bank’s February gathering. So, the divergence in policy expectations between those two Banks and the Fed also supports more gains in aussie/dollar and kiwi/dollar.
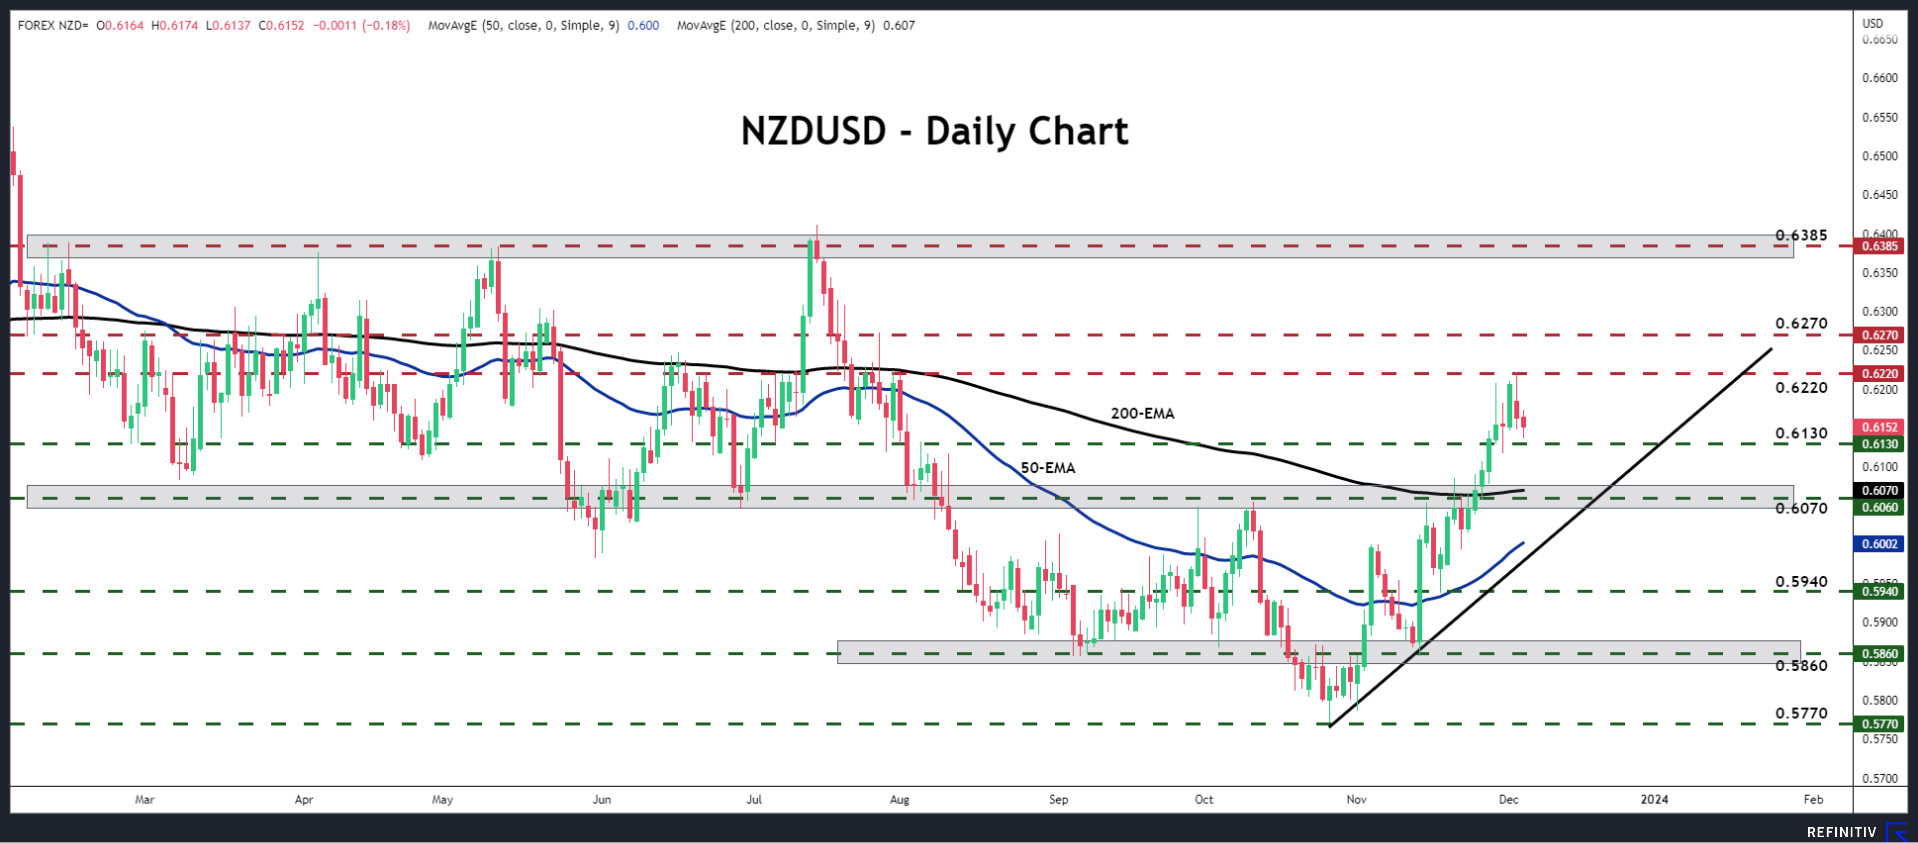
From a technical standpoint, following last week’s hawkish hold by the RBNZ, kiwi/dollar extended its recovery against its US counterpart, breaking above the key barrier of 0.6130, marked by the high of August 4. Although the pair pulled back after hitting 0.6220, the price structure still consists of higher highs and higher lows above a short-term uptrend line, and thus, should investors continue to believe that the Fed will cut rates sharply next year, the bulls may be tempted to challenge the peak of July 27 at 0.6270 soon. A break higher could carry extensions towards the important area of 0.6385, which acted as a ceiling between February and July.
For the bullish picture to be dismissed, the pair may need to slide all the way back below the crossroads of the 200-day exponential moving average and the very important 0.6060 area. Such a dip may turn the near-term outlook back to neutral.
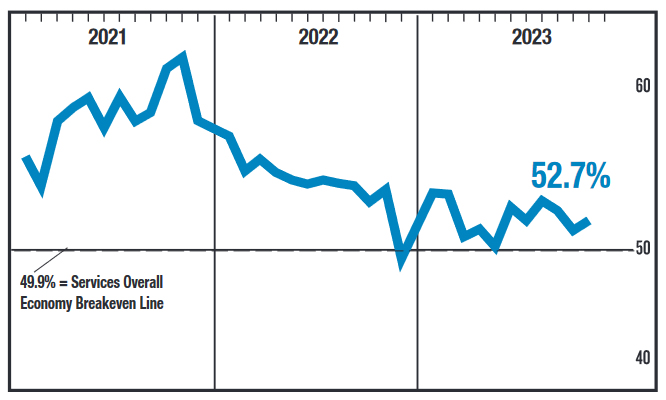
US ISM services rose to 52.7 in Nov, corresponds to 1% annualized GDP growth
US ISM Services PMI rose from 51.8 to 52.7 in November, a touch above expectation of 52.6. Looking at some details, business activity/production rose from 54.1 to 55.1. New orders was unchanged at 55.5. Employment rose slightly from 50.2 to 50.7. Price fell from 58.6 to 58.3.
ISM said: "The past relationship between the Services PMI and the overall economy indicates that the Services PMI for November (52.7 percent) corresponds to a 1-percent increase in real gross domestic product (GDP) on an annualized basis."
Sunset Market Commentary
Markets
US JOLTS job openings and the services ISM (both still to be published at CET 16:00) and to a lesser extent the ECB consumer expectations survey were supposed to provide some guidance as to whether recent decline in yields could finally slow down. Markets had frontloaded expectations on a first Fed and ECB rate hike as early as the March meetings (>70% discounted). In context, a bit surprisingly, it was ECB executive board member Schnabel who added fuel to the bond market rally. In an interview published on the ECB website, she labelled the November CPI flash estimate as a pleasant surprise, especially as underlying inflation which until now has proven more stubborn, is now falling more quickly than expected. Even as she reiterated that central banks have to err the side of caution, she concluded that a further rate increase now is rather unlikely. Reconfirming a data-dependent approach, she even didn’t formally rule out a rate cut before mid-year. She also confirmed that the ECB is going to discuss reinvestments under PEPP in a not-too-distant future. Later in the session, 1-y inflation expectations in the ECB October consumer survey remained at 4.0% while an easing to 3.8% was expected. 3-y expectations remained at 2.5%. Other topics in the survey showed that consumers turned slightly more negative on their nominal income and spending for next year. The also expect a slightly bigger economic contraction (-1.3% vs -1.2%) for the next 12 months. Expectations for unemployment over next 12 months (11.4%) was unchanged. This report evidently wasn’t enough to profoundly change the post-Schnabel sentiment on EMU interest rate markets. German yields currently again are ceding between 6 bps (2-y) and 10 bps (30-y). Markets now discount a >80% chance of a first 25 bps ECB rate cut in March. US yields also ease further though less pronounced than in EMU, declining between 1 bp (2-y) and 5 bps (30-y). Contrary to what was the case of late, UK Gilts today even slightly outperform Bunds (minus 9-11 bps across the curve. European equities opened hesitantly (spill-over from Asia/China) but gradually again received support from lower yields. The EuroStoxx 50 extends gains north of 4400 (+0.55%). The 4491.5 cycle top is within reach. US equities open with modest losses (S&P 500: -0.25%). Oil continues drifting south (Brent $77.6 p/b) even as OPEC+ tries to convince markets that it will deliver on the announced production cuts. Gold this time doesn’t profit from lower yields ($ 2028 p/oz). On FX markets, the dollar gains modestly (DXY 103.75). The yen slightly outperforms on lower core yields (USD/JPY 147). EUR/USD losses also stay modest despite the sharp further decline in EMU yields (1.082). In line with yesterday’s price action EUR/GBP is going nowhere (0.857) after last week’s sterling outperformance.
News & Views
Rating agency Moody’s changed the outlook on China’s A1 credit rating from stable to negative. The new assessment reflects rising evidence of financial support by the government and wider public sector to stressed (mostly related to property sector) regional/local governments and state-owned enterprises. These risk significantly deteriorating Chinese debt dynamics. Moody’s sees increased risks related to structurally and persistently lower growth as well. Growth is forecast at 4% for next year and 2025 before averaging 3.8% from 2026-2030. That’s significantly below this year’s official 5% growth target. Rating agency S&P uses a similar A+ rating for China though still with a stable outlook. Both Moody’s and S&P last downgraded China back in 2017 citing concerns that efforts to support growth would spur rising debt in the economy. Main Chinese stock markets closed 1.6% to 2% weaker this morning with CNY slightly weakening towards USD/CNY 7.15.
Brazilian GDP growth beat consensus once more. The economy grew marginally in Q3 (0.1% Q/Q), avoiding a feared decline (-0.3% Q/Q) while the Q2 figure was slightly increased from 0.9% to 1%. A demand-side breakdown showed positive contributions from household consumption (1.1% Q/Q), government spending (+0.5% Q/Q) and net export (export +3% vs import -2.1%). Investment (-2.5% Q/Q) were the only drag on growth. The resilient Brazilian economy suggests that the Brazilian central bank will keep a cautious approach during its rate cutting cycle which started in August. Three 50 bps rate cuts brought the policy rate at the current level of 12.25% since, supported by disinflationary forces. Brazilian inflation was 4.82% Y/Y in October compared to this year’s 3.25% inflation target (with a permissible range of 1.5 ppt).
AUD/USD: Falls Further as RBA Decision Disappoints Traders
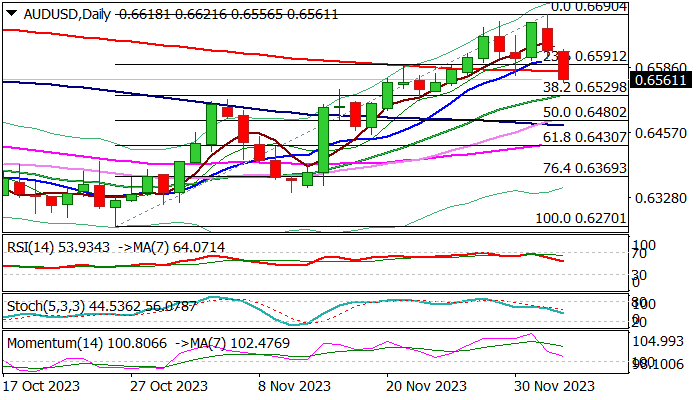
AUDUSD extends pullback from four month high (0.6690) into second straight day, additionally pressured from decision of Australian Central Bank to keep interest rates unchanged.
Although the RBA’s statement kept hawkish bias, traders were disappointed and continued to sell Aussie dollar.
Fresh weakness broke below 200DMA (0.6578), to further soften near-term structure for attack at pivotal support at 0.6529 (Fibo 38.2% of 0.6270/0.6690, reinforced by rising 20DMA) violation of which would generate reversal signal and open way for deeper drop.
Sharp loss of bullish momentum and south-heading RSI contribute to negative outlook, in addition to daily cloud twist early next week, which could be magnetic.
Upticks should stay capped under 0.6600 zone to keep bears in play.
Res: 0.6578; 0.6591; 0.6614; 0.6663.
Sup: 0.6529; 0.6502; 0.6480; 0.6430.
XAUUSD: Fake Breakout or New Reality?
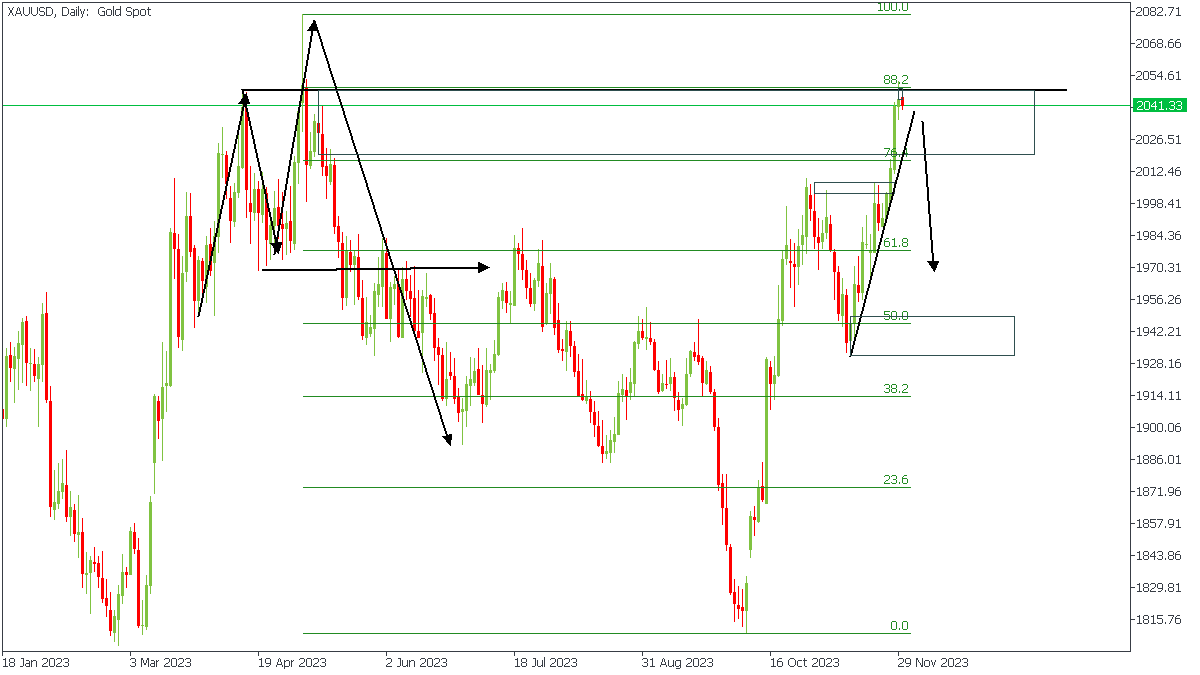
Gold price experienced a notable turnaround, gaining fresh bids after a $125 pullback from its recent peak. Federal Reserve Chair Jerome Powell's recent speech suggested a reluctance towards aggressive rate cuts, dampening speculations of immediate policy easing. Market sentiment leans towards the belief that the Fed has concluded its tightening cycle, with a growing likelihood of a rate cut by March 2024. A modest uptick in the US Dollar acts as a headwind, yet gold maintains a steady bullish tone amid concerns over a potential conflict in the Middle East. The ongoing global economic uncertainties and a shift to safer assets contribute to gold's upside, with upcoming economic data and the monthly jobs report anticipated to guide future trends.
XAUUSD - BEFORE & NOW
In my last article on GOLD (XAUUSD), I mentioned that the safe approach to consider before selling Gold would be a break below the trendline, where the retest of the trendline would serve as the entry. However, due to rumors of possible conflict and civil unrest across several quarters, it is evident that earlybird investors may have already begun stacking up Gold as a hedging strategy. By the way, price didn’t break the trendline support; at least not until recently.
XAUUSD - W1 Timeframe
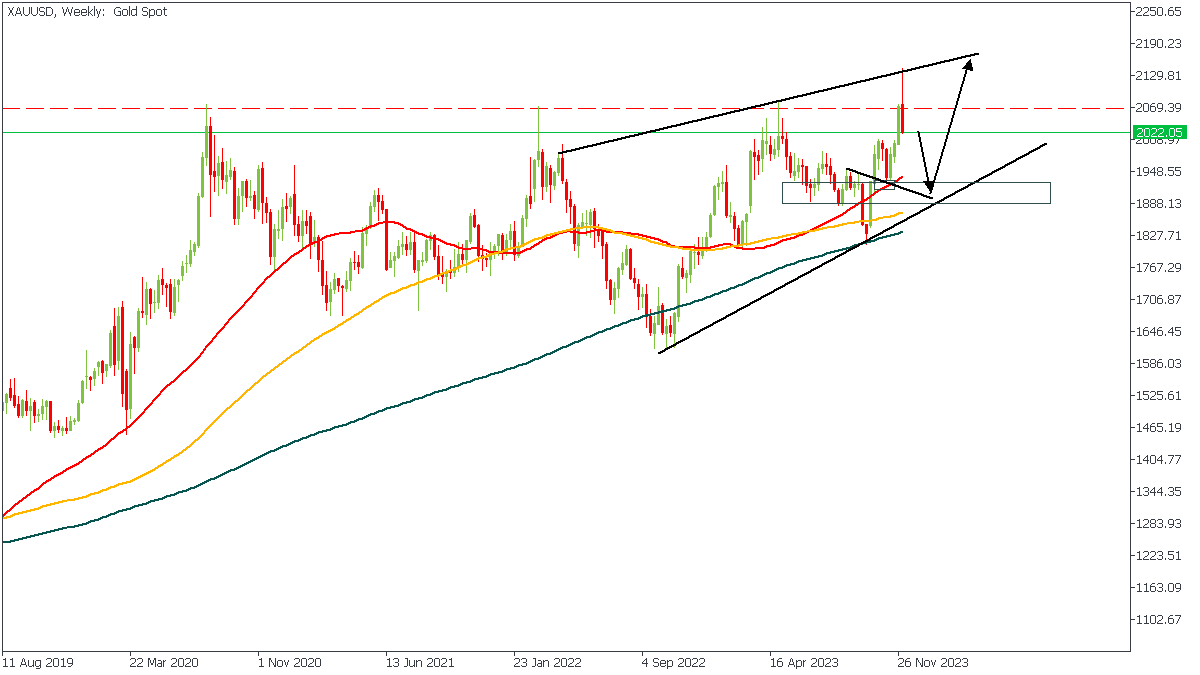
XAUUSD on the weekly timeframe appears to have hit the trendline resistance on the weekly timeframe, leading to a rejection of the price action, and ultimately a bearish move. It is notable to me, however, that the recent high is an actual break of structure, not a mere fakeout. This said, I expect price to drop into the demand zone I have marked in order to regain its bullish momentum. The confluences at that ‘point-of-interest’ include;
- Bullish array of the moving averages;
- 50-period moving average support;
- Trendline support;
- 70% of the Fibonacci retracement; and
- A rally-base-rally demand zone.
Analyst’s Expectations:
- Direction: Bearish
- Target: 1938.50
- Invalidation: 2071.28
CONCLUSION
The trading of CFDs comes at a risk. To succeed, you have to manage risks properly. To avoid costly mistakes while you look to trade these opportunities, be sure to do your due diligence and manage your risk appropriately.
Australian Dollar Slides as RBA Holds Rates
- RBA maintains cash rate at 4.35%
- Australian dollar extends slide
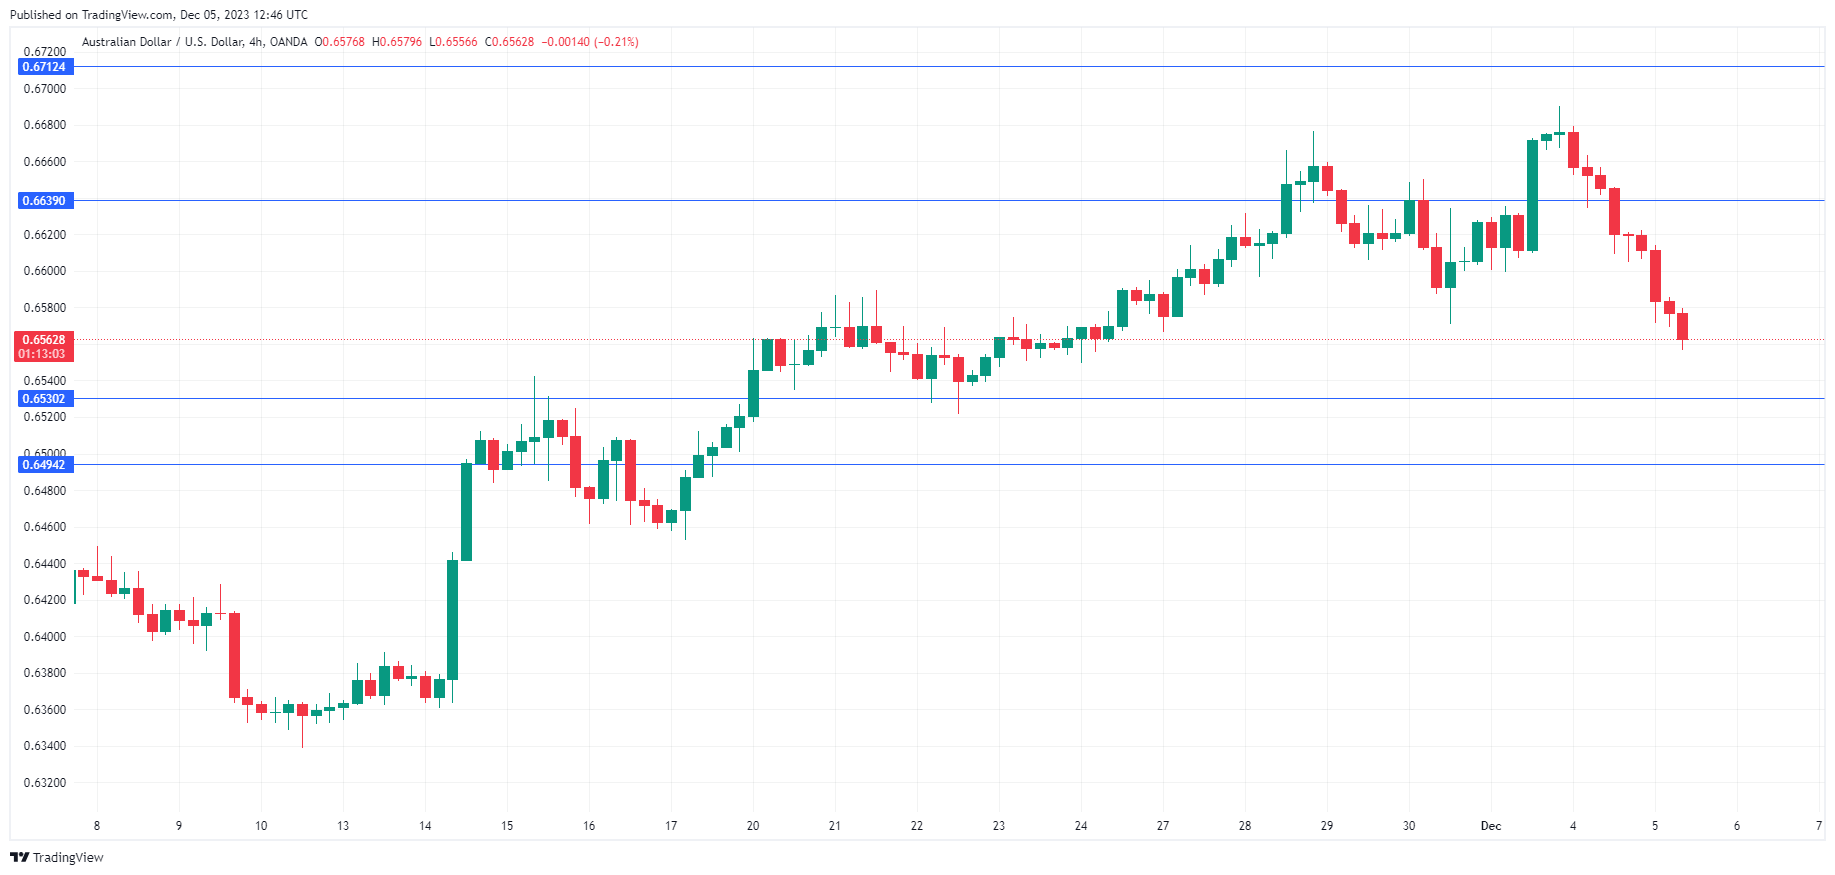
The Australian dollar is down sharply for a second straight day. In the European session, AUD/USD is trading at 0.6561, down 0.88%. The Australian dollar has taken a tumble this week, falling 1.70%.
RBA holds rates as expected
The Reserve Bank of Australia maintained the cash rate at 4.35% today. The move had been fully priced in by the markets, so that was no surprise. Nevertheless, the Australian dollar is down sharply, largely on speculation that the RBA’s pause is further speculation that the central bank’s tightening cycle is over.
RBA Governor Michele Bullock trotted out her familiar script that further tightening was on the table if warranted by the data, but after five straight pauses, the markets have their focus on a rate cut in mid-2024. Bullock mentioned that were “significant uncertainties around the outlook” and expressed concern about China. Bullock’s somewhat hawkish rhetoric didn’t help the Australian dollar but was a reminder that although a rate hike is unlikely at the next meeting in February, it can’t be ruled out.
China has endured a bumpy recovery from Covid and earlier today Moody’s rating agency cut its credit outook for China from stable to negative. Moody’s cited concern over slowing growth, rising debt and the crisis in the property sector. China is Australia’s largest export market and a weaker Chinese economy is bad news for Australia’s export sector and the Australian dollar.
The US releases the ISM Services PMI later today. The October print fell to 51.8, down from 53.6 and the lowest in five months. The PMI isn’t expected to show much change in November, with a consensus estimate of 52.0.
Australia releases GDP on Wednesday. The economy is expected to have grown by 1.8% in the third quarter, compared to 1.8% in Q2. An unexpected GDP reading could have a strong impact on the movement of the Australian dollar.
AUD/USD Technical
- There is support at 0.6530 and 0.6494
- 0.6639 and 0.6712 are the next resistance lines
USD/JPY Mid-Day Outlook
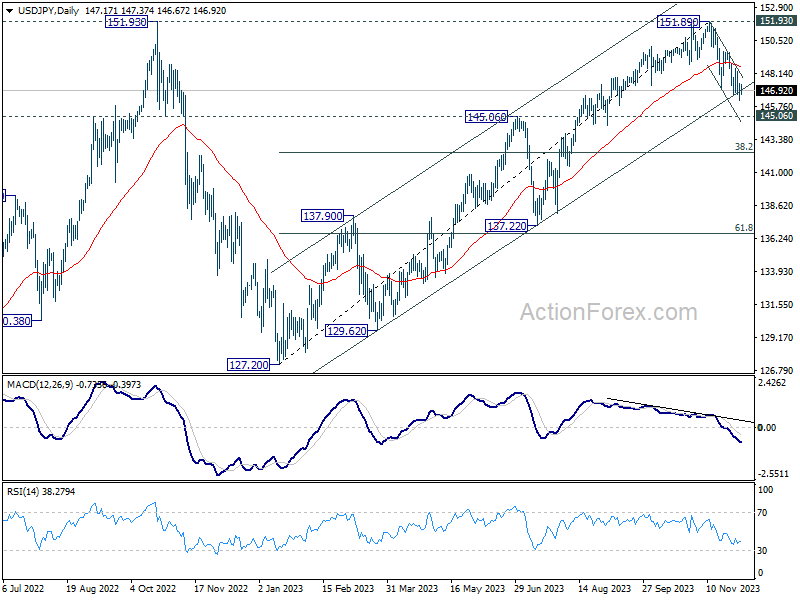
Daily Pivots: (S1) 146.48; (P) 146.97; (R1) 147.70; More...
Intraday bias in USD/JPY remains neutral for consolidation above 146.22 temporary top. Further decline is expected as long as 148.50 resistance holds, even in case of stronger recovery. On the downside, firm break of 146.22 will resume the fall from 151.89 to 145.06 key support level.
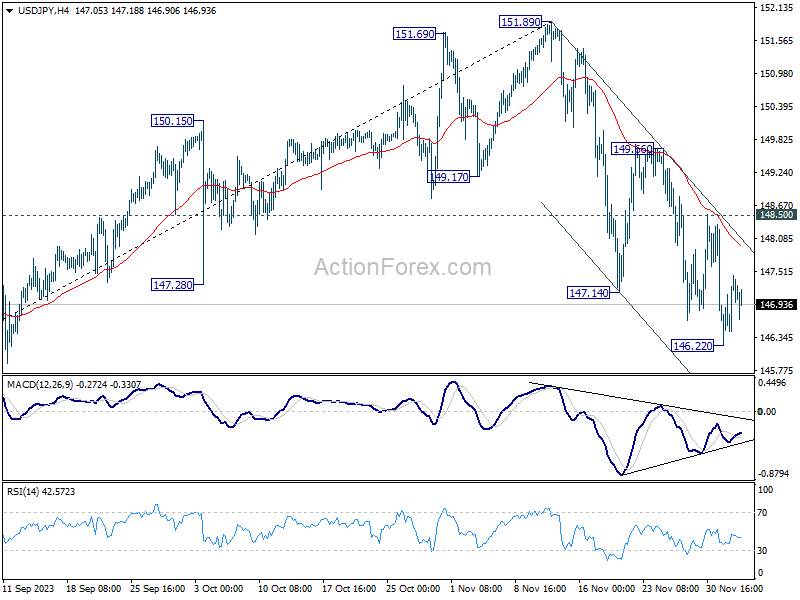
In the bigger picture, rise from 127.20 (2023 low) is seen as the second leg of the pattern from 151.93 (2022 high). Decisive break of 145.06 resistance turned support will confirm that this second leg has completed, after rejection by 151.93. Deeper fall would be seen through 38.2% retracement of 127.20 to 151.89 at 142.45 to 61.8% retracement at 136.63. Nevertheless strong bounce from 145.06 will retain medium term bullishness for another test on 151.93 at a later stage.