

Sample Category Title
EUR/GBP Daily Outlook
Daily Pivots: (S1) 0.8563; (P) 0.8575; (R1) 0.8586; More....
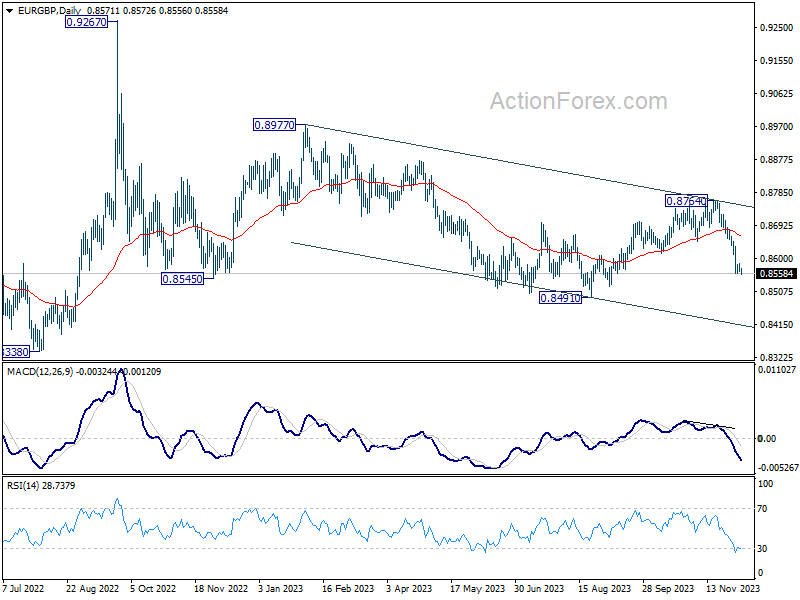
Despite some loss of downside momentum, there is no sign of bottoming yet. Intraday bias stays on the downside. Fall from 0.8764 should target a retest on 0.8491 low. Firm break there will resume larger down trend. On the upside, above 0.8587 minor resistance will turn intraday bias neutral and bring consolidations first, before staging another decline.
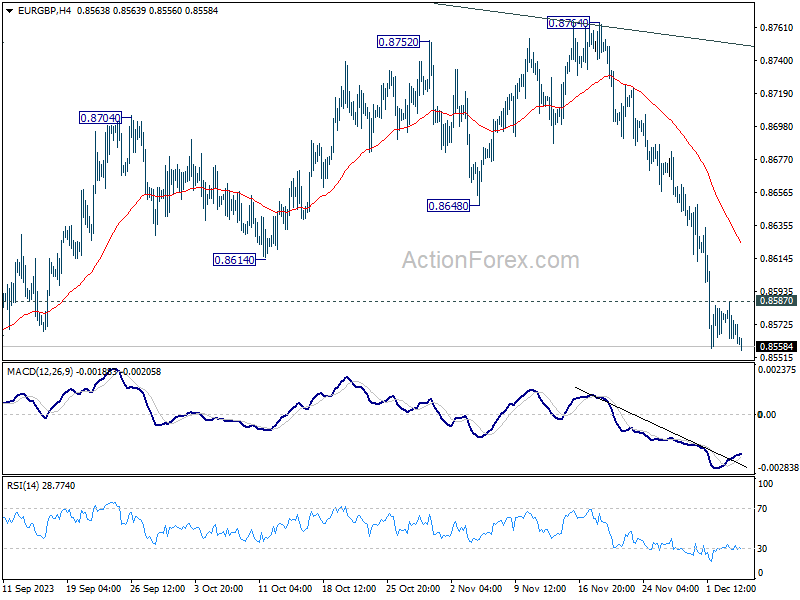
In the bigger picture, current development suggests that down trend from 0.9267 (2022 high) is still in progress. This decline is now seen as the third leg of the pattern from 0.9499 (2020 high). Break of 0.8201 will target 100% projection of 0.9499 to 0.8201 from 0.9267 at 0.7969. In any case, outlook will stay bearish as long as 0.8764 resistance holds.
EUR/AUD Daily Outlook
Daily Pivots: (S1) 1.6382; (P) 1.6449; (R1) 1.6548; More...
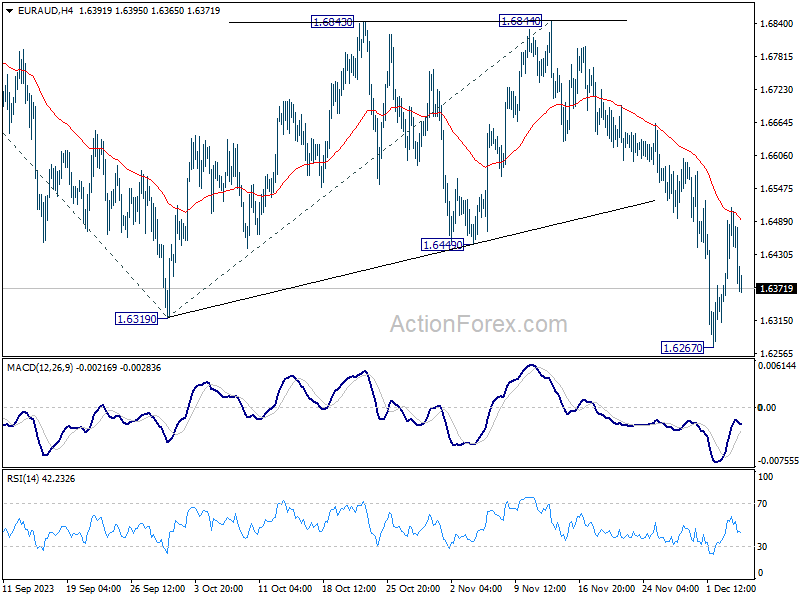
Intraday bias in EUR/AUD remains neutral at this point as consolidations from 1.6267 is extending. Outlook stays bearish as long as 1.6844 resistance holds. On the downside, break of 1.6267 will resume larger decline from 1.7062 to 100% projection of 1.7062 to 1.6319 from 1.6844 at 1.6106 next.
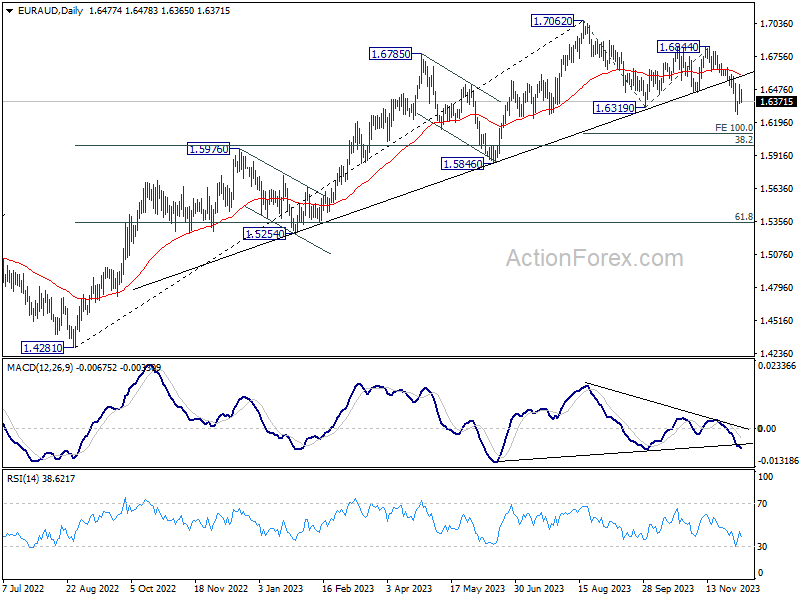
In the bigger picture, the break of medium term trend line support now suggests fall from 1.7062 correcting the whole up trend from 1.4281 (2022 low). Deeper decline would be seen to 38.2% retracement of 1.4281 to 1.7062 at 1.6000. Strong support could be seen there to bring rebound on first attempt. But risk will stay on the downside as long as 1.6844 resistance holds. Sustained break of 1.6000 would bring further fall to 61.8% retracement at 1.5343.
DXY Escaped Downward November Trend Channel
Markets
Monday’s uptick in yields already got wiped out yesterday. Culprit this time: US JOLTS. October job openings fell from a downwardly revised 9350k to 8733k vs the 9300k expected. It’s still a historically high number but it suggests the labour market is further normalizing. In current circumstances this is all the evidence (for a quick Fed pivot) markets are looking for. The US services ISM rose to a higher than expected 52.7 on a combination of rising business activity (55.1) and a solid flow of new orders (55.5). Employment, however, undershot expectations by growing only marginally, strengthening the message coming from the JOLTS. Prices paid barely eased from 58.6 to 58.3. US yields shed between 5.9 (2-y) and 11.3 bps (30-y). ECB’s Schnabel Reuters interview triggered Bund outperformance for most of the day before UST’s caught up later. German yields dropped 8.5-14.2 bps with the long end outperforming. Stocks in Europe eked out a nice gain, allowing the EuroStoxx50 to surpass important resistance in the 4400 area. In the US however, the yield drop offered much less equity support. The jury’s out on whether the soft landing scenario is all but priced in now. EUR/USD dropped towards next support at 1.08. DXY escaped the downward November trend channel by closing above 104. Currencies Down Under underperformed. Moody’s cut the rating outlook of a key trading partner, China, to negative. It highlighted the economic and financial uncertainty surrounding the country. While the CNY held its nerves yesterday, it is facing stronger selling pressures this morning. USD/CNY gaps higher to 7.158. With news flow thin otherwise, we move on to today’s eco calendar. On the agenda are meetings by the Canadian and Polish central bank and US ADP employment growth. The latter is expected at 130k. Risks for an asymmetric market reaction remain live. The US 10-y is nearing the 50% retracement on the 2023 rise fast (4.13%). In the corrections of the past several years, this often served as an important support. However, we don’t want to call the end until we actually see yields stop moving south on disappointing (activity) data. Since US yield moves lately easily spilled over to Europe, we hold on to a stronger dollar, more so given the recessionary vibe that’s looming over the continent. EUR/USD is currently losing the 1.08 with next support kicking in at 1.0756 and 1.0733. Sterling continues to be in a sweet spot. EUR/GBP is stabilizing near the recent lows just north of support at 0.8557.
News & Views
Australian GDP growth unexpectedly slowed to 0.2% in Q3 from 0.4% in Q2, the country’s bureau of statistics released this morning. Activity was 2.1% higher compared to the same month last year. It was the eighth straight rise in quarterly GDP, but consensus expected a faster 0.5% Q3 growth. Government spending and capital investment were the main drivers of Q3 GDP growth. Government final consumption expenditure rose 1.1%, driven by social benefits to households. Defense also contributed to growth. A 1.1% increase in gross capital formation was also supported by public corporation activity. Change in inventories contributed 0.4% to GDP growth but this mainly reflected falling exports. Net trade contributed a net -0.6% to growth. Household consumption in Q3 was flat, even as the household saving to income ratio dropped for the eight straight quarter to 1.1%, the lowest since Q4 2007. The Q3 GDP release allows the RBA to keep a guarded wait-and-see approach. The 2-y government bond yield dropped 10 bps this morning (3.98%). The Aussie dollar initially rose in a positive risk sentiment, but the rebound slowed after the release of the GDP data. AUD/USD currently trades slightly below 0.66.
Spain, which currently holds the EU presidency, proposed a new framework aimed at reducing government deficits while at the same time leaving room for green and defense investments, Bloomberg reported citing people familiar with the matter. The proposal would oblige countries to cut debt as a percentage of GDP by an average 1 ppt over an adjusted period when it exceeds 90% of GDP. Countries with debt to GDP levels between 60% and 90% would have to reduce their debt by half that pace. According the report, countries would also need to build a fiscal buffer of 1.5% of GDP, below the ECB’s 3.0% target, but it would give governments leeway to finance the green transition and support the block’s military capacity. In the proposal, a government expenditure cap might also be an important mechanism to reduce the deficits.
EUR/USD Daily Outlook
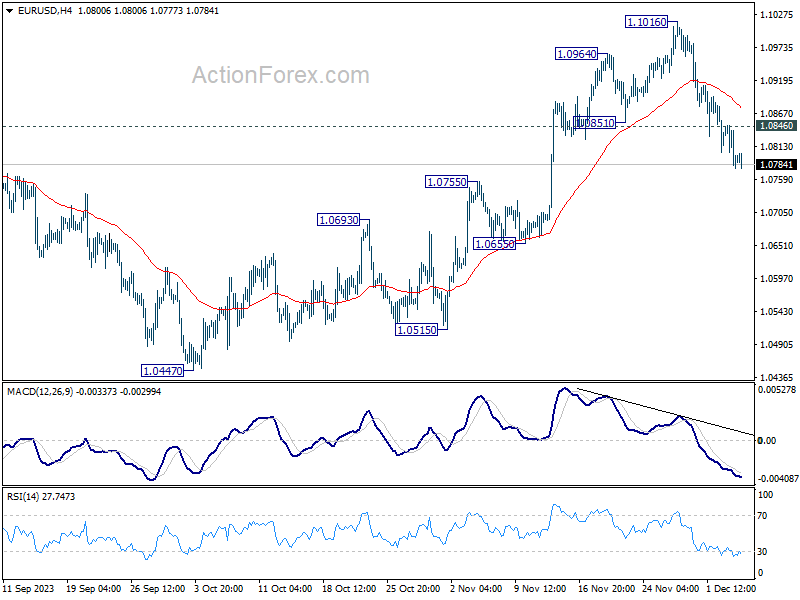
Daily Pivots: (S1) 1.0768; (P) 1.0808; (R1) 1.0838; More...
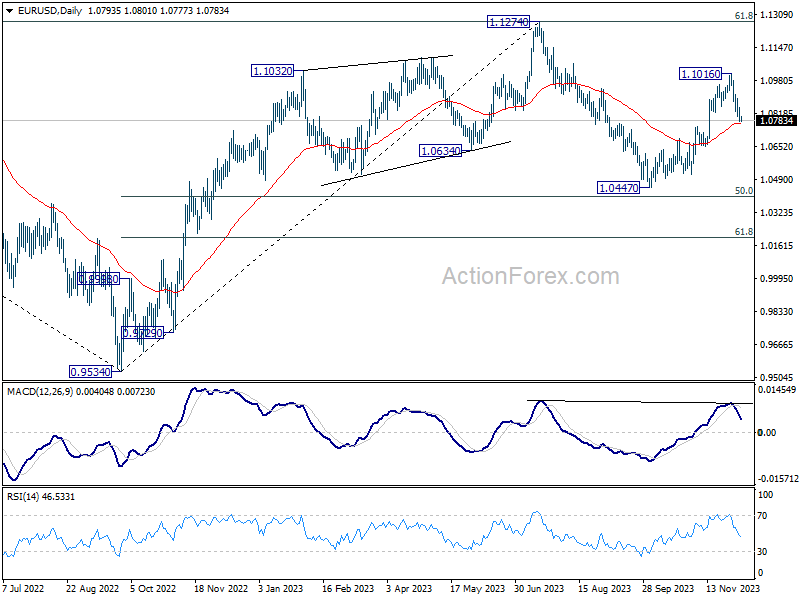
Intraday bias in EUR/USD remains on the downside at this point. Current fall from 1.1016 short term top is in progress. Sustained break of 55 D EMA (now at 1.0770) will pave the way to retest 1.0447 support. On the upside, above 1.0846 minor resistance will turn intraday bias neutral first. But risk will stay on the downside as long as 1.1016 resistance holds, in case of recovery.
In the bigger picture, price actions from 1.1274 are viewed as a corrective pattern to rise from 0.9534 (2022 low). Rise from 1.0447 is tentatively seen as the second leg. Hence while further rally could be seen, upside should be limited by 1.1274 to bring the third leg of the pattern. Meanwhile, sustained break of 55 D EMA will argue that the third leg has already started for 1.0447 and below.
GBP/USD Daily Outlook
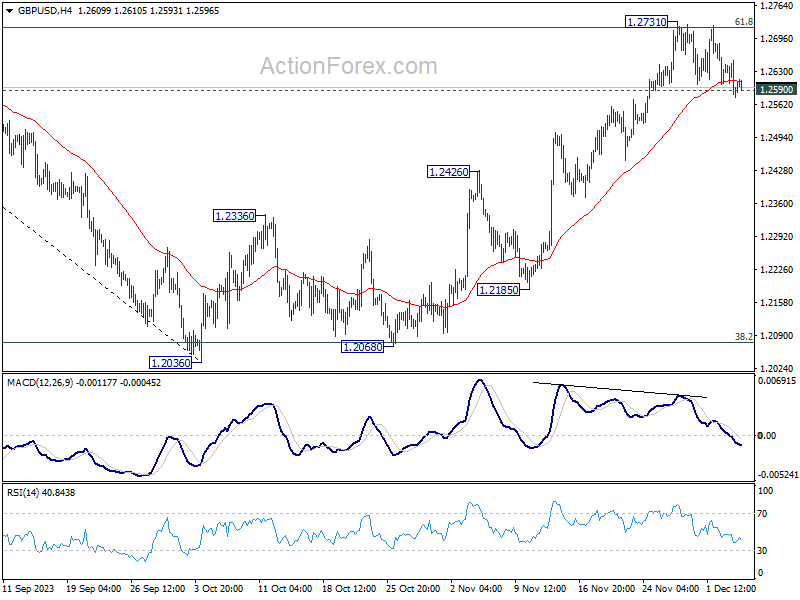
Daily Pivots: (S1) 1.2565; (P) 1.2608; (R1) 1.2640; More...
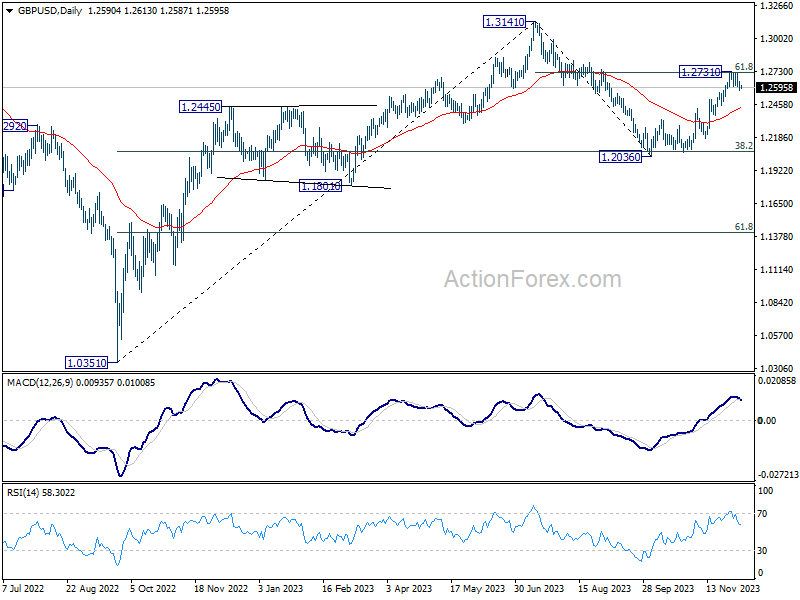
GBP/USD's breach of 1.2590 minor support suggests short term topping at 1.2731, on bearish divergence condition in 4H MACD. Intraday bias is mildly on the downside for deeper pull back to 55 D EMA (now at 1.2427). For now, risk will stay on the downside as long as 1.2731 resistance holds, in case of recovery.
In the bigger picture, price actions from 1.3141 are seen as a corrective pattern to rise from 1.0351 (2022 low). Strong rebound from 38.2% retracement of 1.0351 (2022 low) to 1.3141 at 1.2075 suggests that current rise from 1.2036 is already the second leg. However, while further rally could be seen, upside should be limited by 1.3141 to bring the third leg of the pattern.
USD/CHF Daily Outlook
Daily Pivots: (S1) 0.8721; (P) 0.8743; (R1) 0.8773; More....
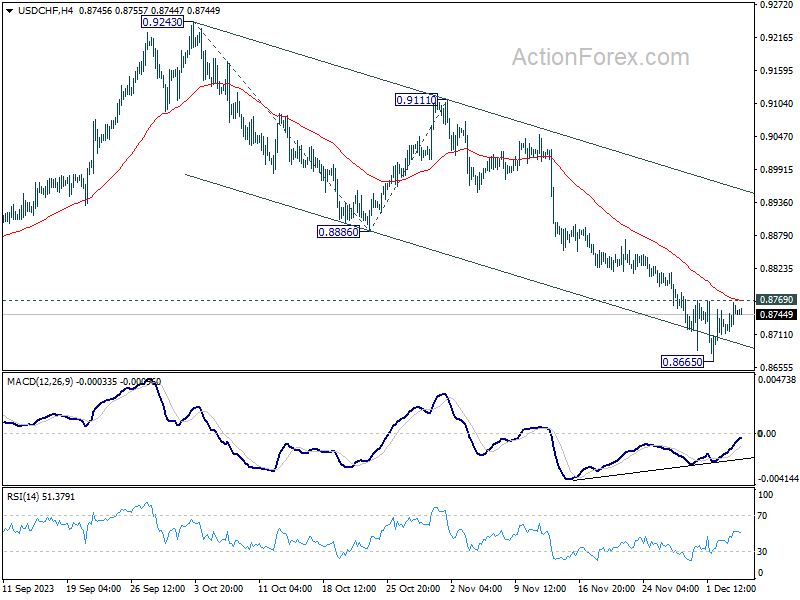
Range trading continues in USD/CHF and intraday bias remains neutral for the moment. Another fall is in favor as long as 0.8769 minor resistance holds. Below 0.8665 will resume the decline from 0.9243 to 161.8% projection of 0.9243 to 0.8886 from 0.9111 at 0.8533, which is close to 0.8551 low. However, break of 0.8769 minor resistance should indicate short term bottoming, and turn bias back to the upside for stronger recovery to 0.8886 support turned resistance.
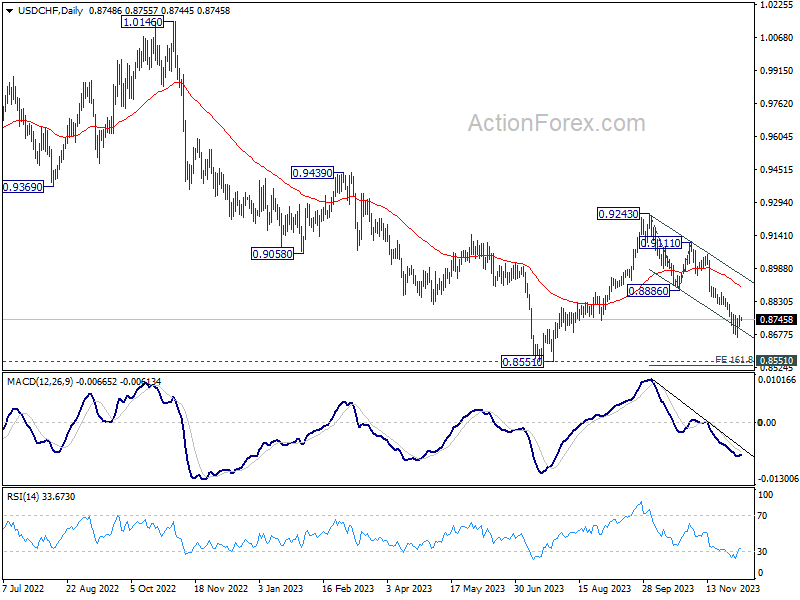
In the bigger picture, price actions from 0.8551 are currently seen as part of a corrective pattern to the decline from 1.0146 (2022 high). Fall from 0.9243 is seen as the second leg for now. Deeper decline could be seen to 0.8551 low but strong support should be seen there to bring rebound. For now, this will remain the favored case as long as 0.8886 support turned resistance holds.
USD/JPY Daily Outlook
Daily Pivots: (S1) 146.68; (P) 147.03; (R1) 147.51; More...
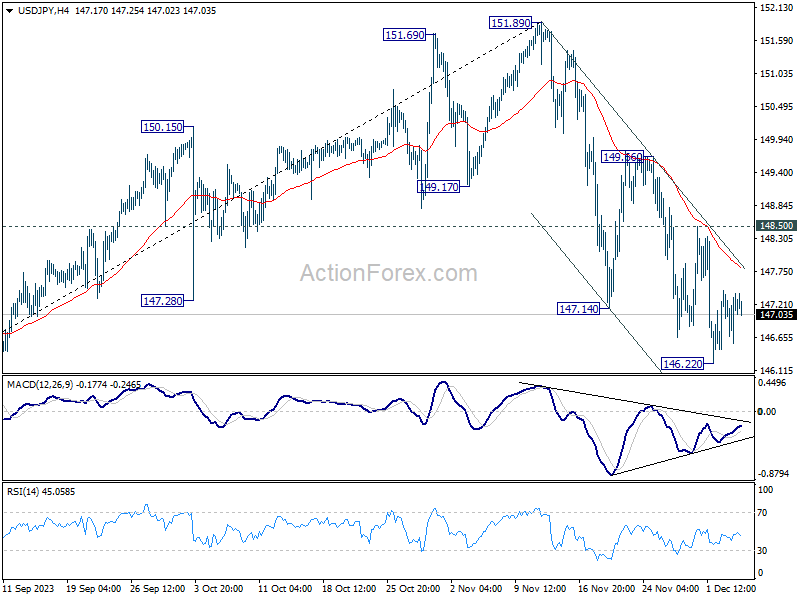
USD/JPY is still bounded in consolidation from 146.22 and intraday bias stays neutral for the moment. Further decline is expected as long as 148.50 resistance holds, even in case of stronger recovery. On the downside, firm break of 146.22 will resume the fall from 151.89 to 145.06 key support level.
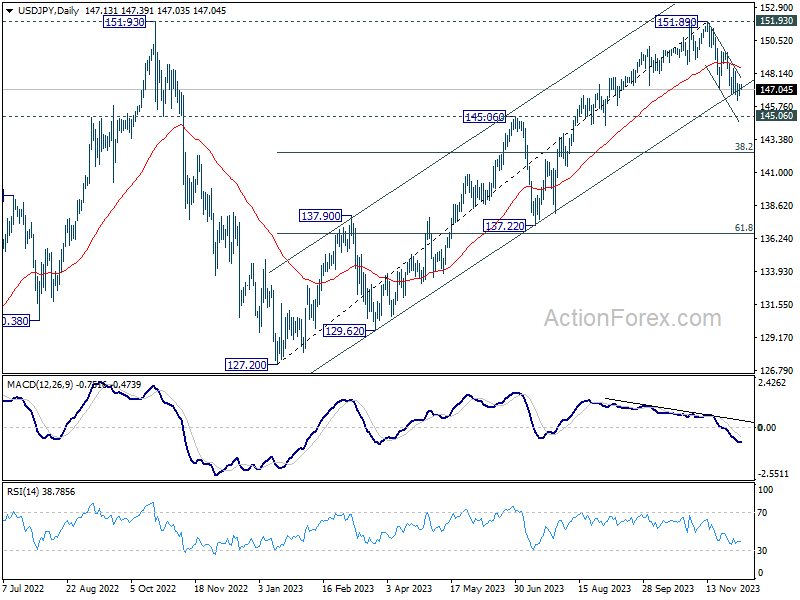
In the bigger picture, rise from 127.20 (2023 low) is seen as the second leg of the pattern from 151.93 (2022 high). Decisive break of 145.06 resistance turned support will confirm that this second leg has completed, after rejection by 151.93. Deeper fall would be seen through 38.2% retracement of 127.20 to 151.89 at 142.45 to 61.8% retracement at 136.63. Nevertheless strong bounce from 145.06 will retain medium term bullishness for another test on 151.93 at a later stage.
AUD/USD Daily Report
Daily Pivots: (S1) 0.6523; (P) 0.6573; (R1) 0.6601; More...
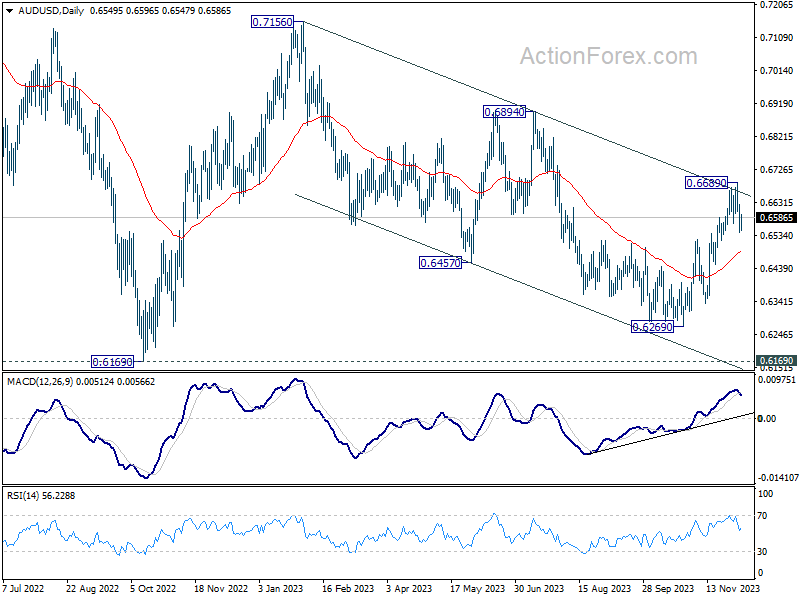
AUD/USD's breach of 0.6570 support suggests that a short term top was formed at 0.6689, after rejection by falling channel resistance. Intraday bias is now mildly on the downside for 55 D EMA (now at 0.6488). For now, risk is mildly on the downside as long as 0.6689 resistance holds, in case of recovery.
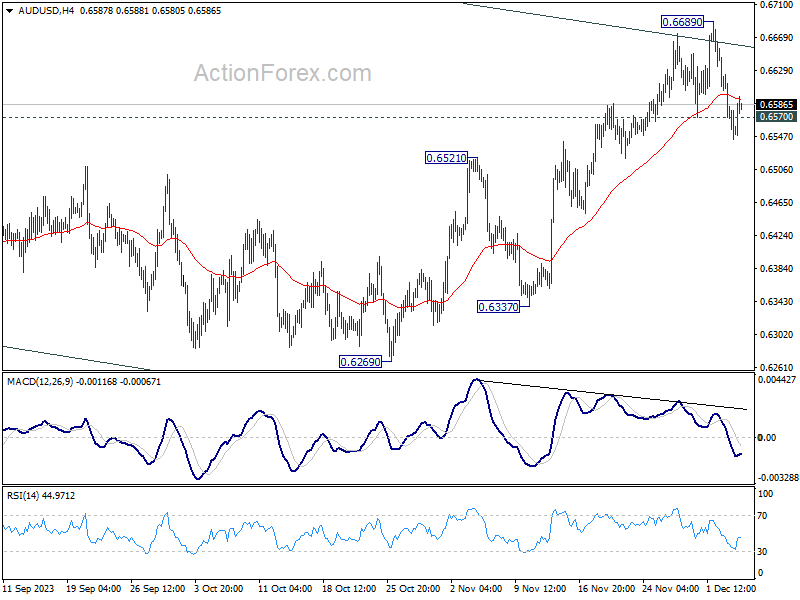
In the bigger picture, there is no confirmation that down trend from 0.8006 (2021 high) has completed. price actions from 0.6169 (2022 low) could be just a medium term corrective pattern, with rise from 0.6269 as the third leg. For now, range trading should be seen between 0.6169 and 0.7156 (2023 high), until further developments.
USD/JPY: Bearish Momentum Remains Intact Despite Softer Tokyo CPI
- Tokyo’s CPI for November slowed down further due to a recent drop in oil prices.
- Tokyo’s services prices accelerated to 3% y/y in November, its fastest pace since 1994.
- Japan’s latest consumer sentiment data for November also improved to its highest level since August 2023.
- A boost in consumer sentiment coupled with services inflation on the uptick indicates signs of a potential demand-driven increase in prices has emerged in Japan.
- Technical analysis suggests a further potential weakness in USD/JPY.
Yesterday Japan’s statistical government agency released November’s CPI data for Tokyo, which tends to be a leading economic indicator for Japan’s nationwide inflationary environment.
The headline Tokyo’s CPI print for November has continued to decelerate to 2.6% y/y from 3.3% y/y in October which indicated the lowest inflationary growth reading in around one and a half-year due to the recent drop in oil prices since late September 2023.
In addition, the Tokyo core-core CPI (after stripping out fresh food and energy components), a closely watched inflationary gauge by the Bank of Japan (BoJ) also slowed to 3.6% y/y from 3.8% y/y in October.
Tokyo services inflation has risen at a faster pace since 1994
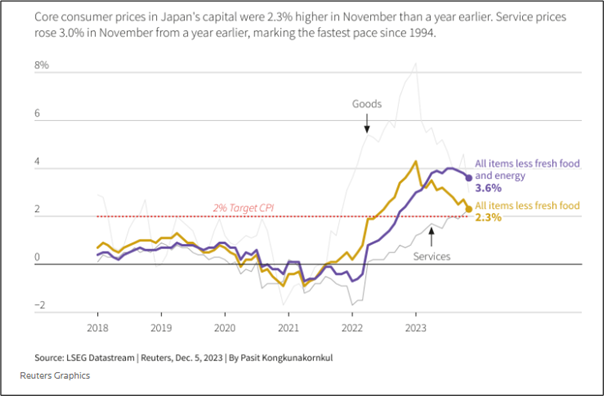
Fig 1: Tokyo CPI readings for November 2023 (Source: Reuters, click to enlarge chart)
In contrast, service prices in Tokyo rose at their fastest pace since 1994 to a record gain of 3% y/y in November, indicating an increase in the odds of sustainable wage-driven inflationary growth that BoJ is monitoring to justify more tweaks to normalize its current ultra-accommodative monetary policy.
BoJ Governor Ueda has stressed in his public speeches that the recent cost-push inflation needs to be replaced by a sustainable demand-driven increase in prices backed by wage gains before BoJ can consider exiting its current short-term negative interest rate policy, an outlier among developed nations.
Another encouraging sign of a potential uptick in demand-driven domestic spending is the recent uptick in consumer sentiment in Japan where it rose to 36.1 in November from 35.7, surpassed consensus expectations of 35.6, and has been on an increasing upward trend since August 2023.
No significant change in BoJ’s monetary policy on 18 December but keep a lookout on 23 January next year
Given the “conservative modus operandi” of BoJ, it is likely that it will not make a significant policy change in the upcoming 18 December monetary policy meeting but keep a lookout on the next meeting on 23 January next year where BoJ will release its latest economic outlook report that highlights latest inflation and growth forecasts.
A rise in inflation forecast for 2024 and 2025 is likely to bring BoJ closer to ending its short-term negative interest rate policy which in turn may kickstart a herding behaviour that favors a potential further strengthening of the JPY.
Looking vulnerable for a medium-term bearish breakdown in USD/JPY
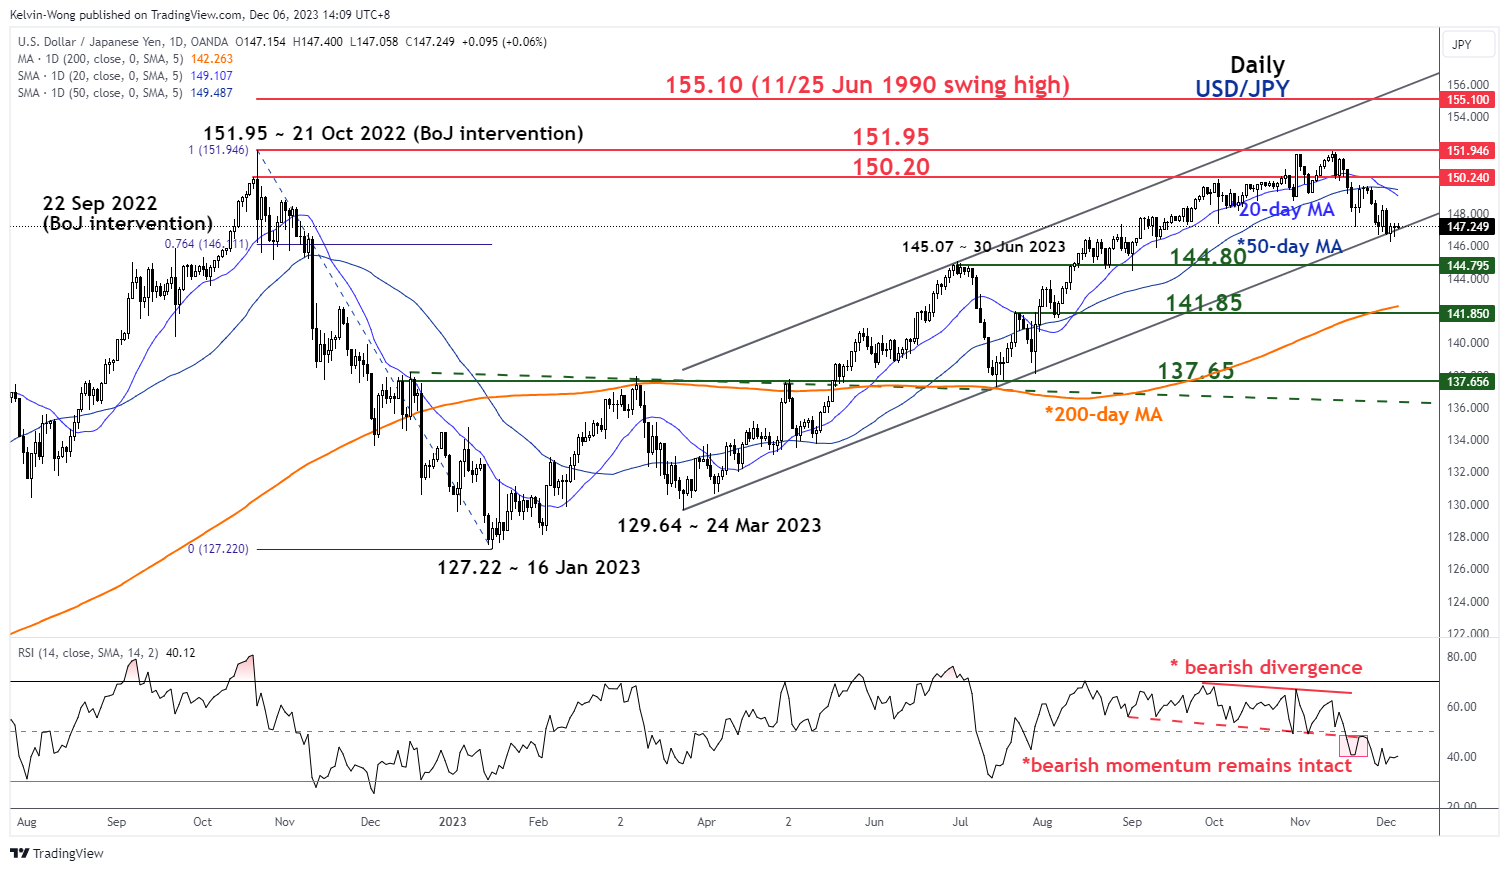
Fig 2: USD/JPY medium-term trend as of 6 Dec 2023 (Source: TradingView, click to enlarge chart)
The current four-week decline seen in the price actions of the USD/JPY since a test on its major resistance level of 151.95 on 13 November 2023 has reached the lower boundary of a medium-term ascending channel in place since 24 March 2023 low, now acting as a near-term support at 146.20.
The medium-term momentum indicator as represented by the daily RSI is still showing a bearish momentum condition (has not reached its oversold region of below 30 & continued to flash out lower lows since its bearish breakdown below the 50 level).
Hence, the ascending channel support at 146.20 may not be impregnable.
Watch the 148.40 key short-term resistance
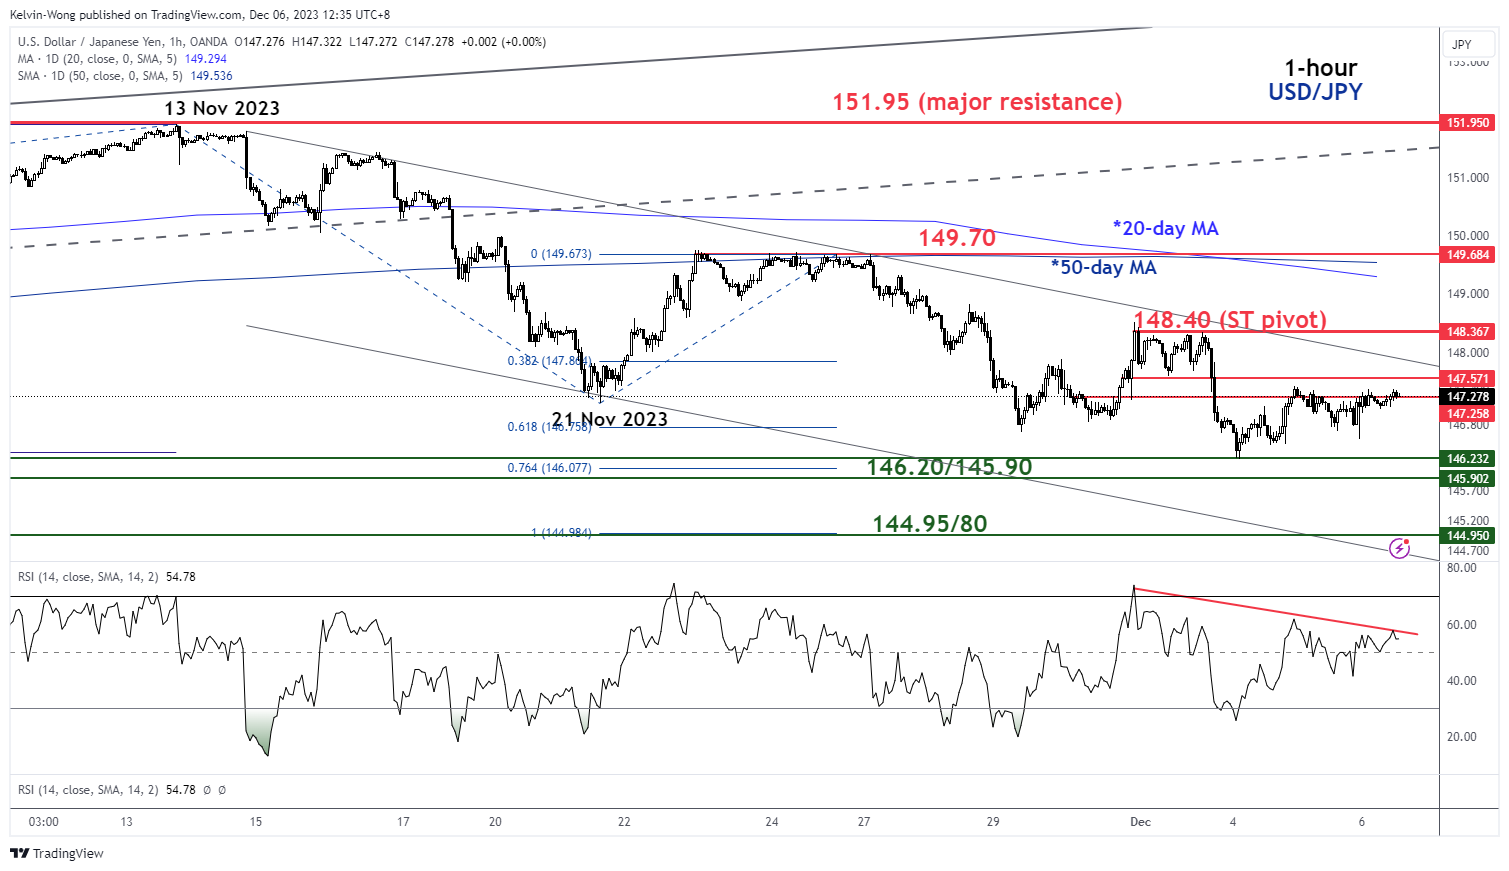
Fig 3: USD/JPY minor short-term trend as of 6 Dec 2023 (Source: TradingView, click to enlarge chart)
The short-term downtrend phase of the USD/JPY remains intact as price actions continue to oscillate within a minor descending channel in place since the 13 November 2023 high.
The recent retest near the upper boundary of the minor descending channel on last Friday, 1 December has led to a bearish reaction in price actions that has been accompanied by a short-term bearish momentum reading seen in the hourly RSI momentum indicator (capped by a parallel descending resistance after it hit overbought reading on last Thursday, 30 November).
Watch the 148.40 short-term pivotal resistance and a break below 145.90 may trigger a medium-term downtrend phase towards the next intermediate support at 144.95/80 in the first step.
On the other hand, a clearance above 148.40 negates the short-term bearish tone to see the medium-term resistance coming in at 149.70 (also the downward sloping 20 and 50-day moving averages).
Gold Price Retreats From Highs and Crude Oil Price Dives
Gold price is correcting gains below the $2,050 support. Crude oil prices declined steadily below the $75.90 support and moved into a bearish zone.
Important Takeaways for Gold and Oil Prices Analysis Today
- Gold price rallied to new highs above $2,120 before it corrected lower against the US Dollar.
- A key bearish trend line is forming with resistance near $2,025 on the hourly chart of gold at FXOpen.
- Crude oil prices extended downsides below the $75 support zone.
- A major bearish trend line is forming with resistance near $73.35 on the hourly chart of XTI/USD at FXOpen.
Gold Price Technical Analysis
On the hourly chart of Gold at FXOpen, the price rallied heavily above the $2,000 resistance. The price even traded to a new high at $2,135 before there was a downside correction.
There was a move below the $2,072 support level. The bears even pushed the price below the $2,050 support and the 50-hour simple moving average. It tested the $2,010 zone. A low is formed near $2,009.78 and the price is now attempting a fresh increase.
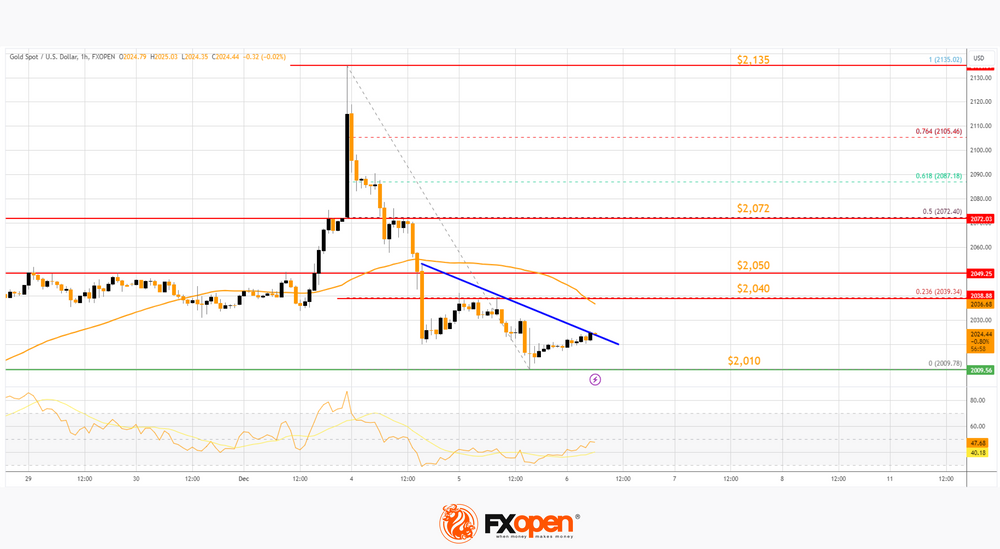
It is now facing resistance near a key bearish trend line at $2,025. The next major resistance is near the 23.6% Fib retracement level of the downward move from the $2,135 swing high to the $2,009 low at $2,040.
The main resistance could be $2,050, above which the price could test the $2,072 resistance. The next major resistance is $2,135. An upside break above the $2,135 resistance could send Gold price toward $2,220. Any more gains may perhaps set the pace for an increase toward the $2,350 level.
Initial support on the downside is near the $2,010 level. The first major support is near the $2,000 level. If there is a downside break below the $2,000 support, the price might decline further. In the stated case, the price might drop toward the $1,965 support.
Oil Price Technical Analysis
On the hourly chart of WTI Crude Oil at FXOpen, the price struggled to continue higher above $80.00 against the US Dollar. The price formed a short-term top and started a fresh decline below $78.00.
There was a steady decline below the $75.90 pivot level. The bears even pushed the price below $73.90 and the 50-hour simple moving average. Finally, the price tested the $72.15 zone. A low was formed near $72.14, and the price is now consolidating losses.
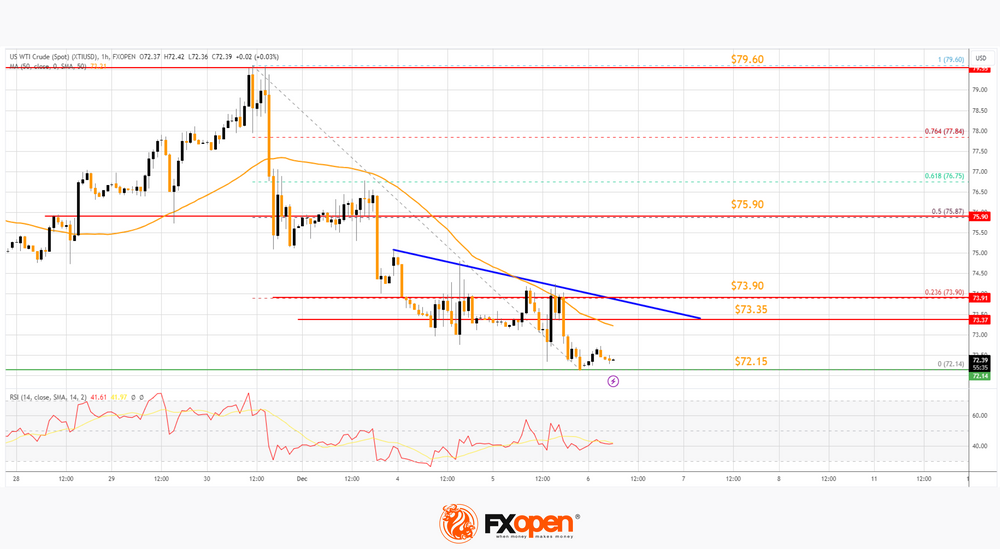
Immediate support is near the $72.15 level. The next major support on the WTI crude oil chart is near $71.50. If there is a downside break, the price might decline toward $70.00. Any more losses may perhaps open the doors for a move toward the $68.00 support zone.
On the upside, immediate resistance is near a major bearish trend line at $73.35. The next resistance is near the 23.6% Fib retracement level of the downward move from the $79.60 swing high to the $72.14 low at $73.90.
A clear move above the trend line resistance and $73.90 could send the price toward $75.90. It coincides with the 50% Fib retracement level of the downward move from the $79.60 swing high to the $72.14 low.
The next key resistance is near $79.60. If the price climbs further higher, it could face resistance near $80.00. Any more gains might send the price toward the $82.00 level.
Start trading commodities with tight spreads. Open your trading account now or learn more about trading commodity CFDs with FXOpen.
This article represents the opinion of the Companies operating under the FXOpen brand only. It is not to be construed as an offer, solicitation, or recommendation with respect to products and services provided by the Companies operating under the FXOpen brand, nor is it to be considered financial advice.