Sample Category Title
GBPUSD Ends 2023 in Bullish Area
- GBPUSD finds strong resistance near 200-week EMA
- Technical signals are negative
- Will 2024 be a negative year for the pair?
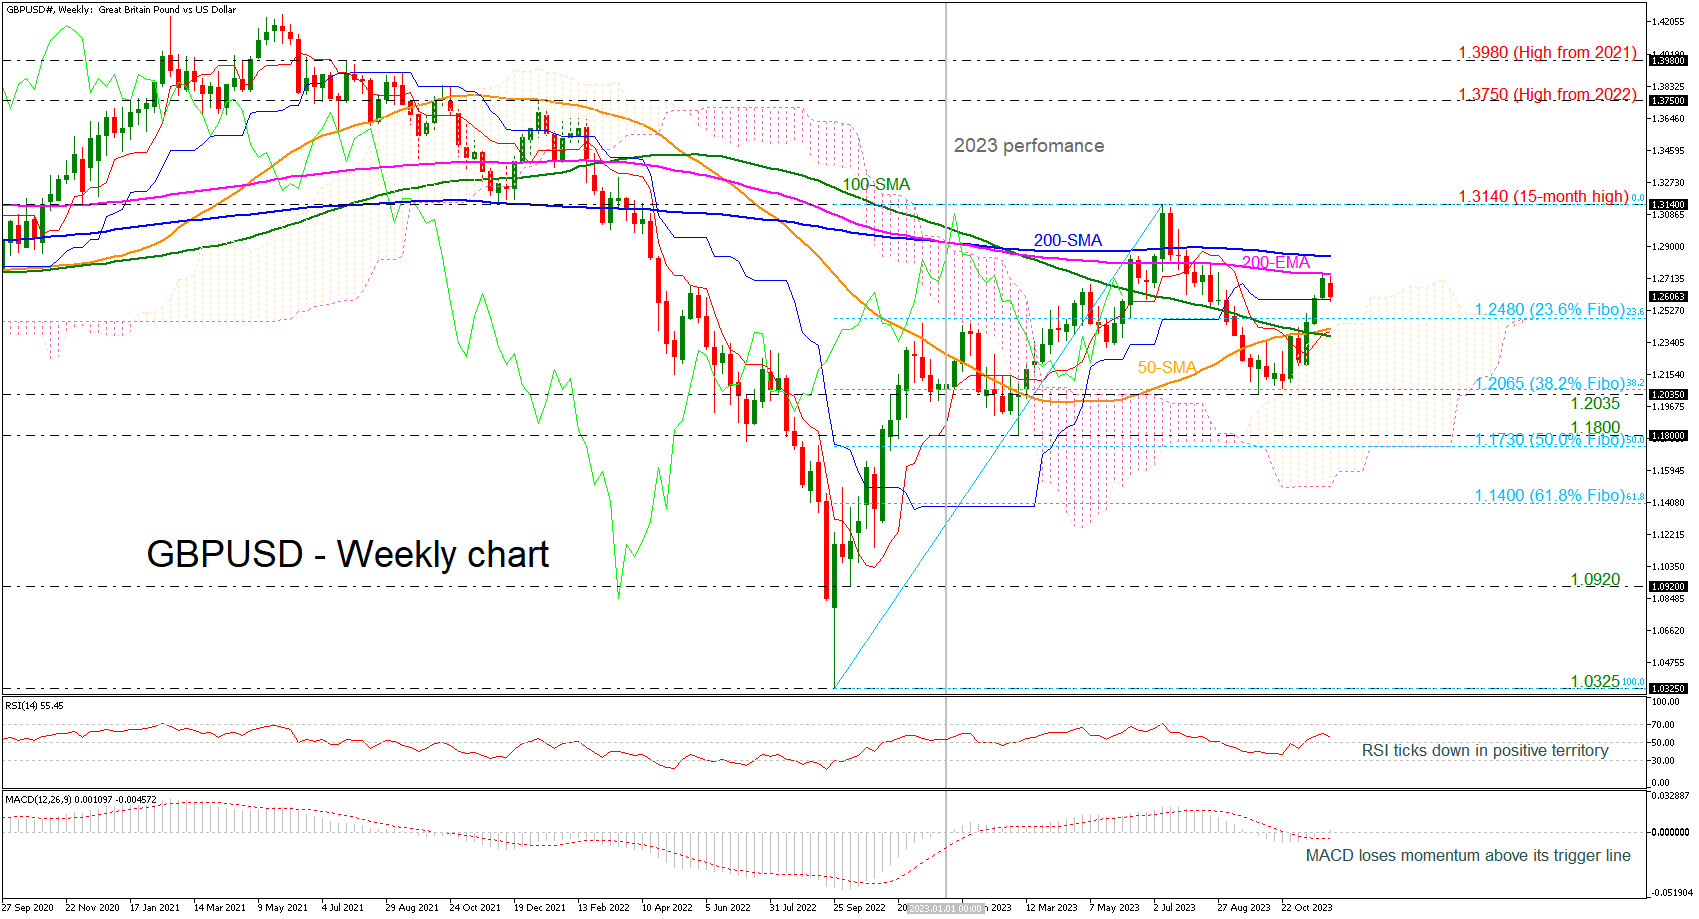
With the year 2023 drawing to a close, GBPUSD could not carry the impressive rally of the last three weeks above the bullish crossover within the 50- and the 100-week simple moving averages (SMAs) and the 23.6% Fibonacci retracement level of the upward wave from 1.0325 to 1.3140 at 1.2480. Also, the pair found strong resistance near the 200-week exponential moving average (EMA), sending prices lower this week so far.
Currently, the market price is holding above the opening price from last January. However, the technical oscillators are suggesting a weakening momentum. Specifically, the RSI is pointing south in the bullish region, while the MACD is flattening above its trigger line and near the zero level.
The market structure is positive in the long-term picture as the pair keeps fluctuating within a bullish territory. Hence, even if downside pressures resume, the pair will remain attractive unless it exits the bullish formation below the 38.2% Fibonacci of 1.2065. If that bearish scenario unveils, selling forces could intensify towards the 1.1800 mark and the 50.0% Fibonacci of 1.1730. Then, additional losses from there could test the 61.8% Fibonacci of 1.1400.
In the event the price stays resilient above the 200-week EMA and the 200-week SMA, the bulls might push for a close above the 15-month high of 1.3140. Therefore, a successful move higher could immediately shift the attention to the 1.3750 barricade, registered in 2022.
In a nutshell, GBPUSD may remain supported in the coming sessions, especially if it jumps beyond the immediate moving averages. However, a bearish round cannot be excluded from the table as the oscillators suggest a bearish structure in the near future.
USDCAD Slows Down Before BoC Rate Decision
- USDCAD halts near last week's limits
- Bias remains skewed to the downside
- BoC policy announcement awaited
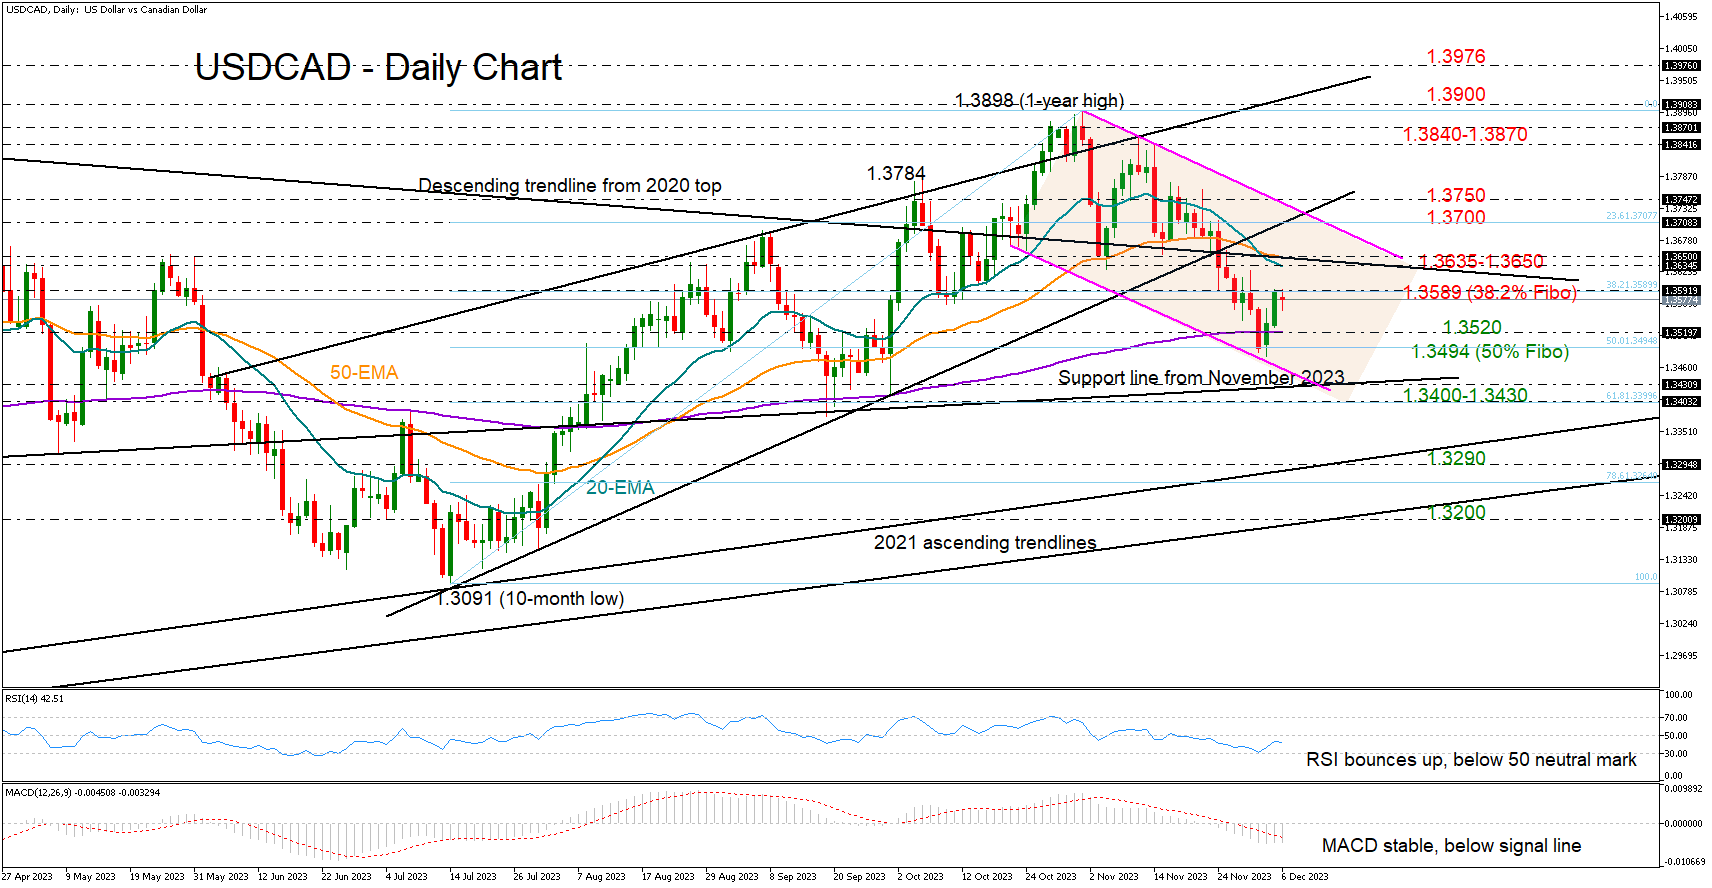
USDCAD opened with mild losses on Wednesday after Tuesday’s remarkable rally stalled near last week’s resistance of 1.3593. Traders were also in a wait-and-see mode ahead of the Bank of Canada’s rate decision at 15:00 GMT.
The 1.3593 bar overlaps with the 38.2% Fibonacci retracement of the July-October uptrend, making a pullback likely. Yet, the RSI has yet to crawl above its 50 neutral mark despite bouncing off oversold levels and the MACD is still flattening below its red signal line, suggesting that the latest rebound has not boosted buying confidence yet.
The 20- and 50-day simple moving averages (SMAs) and the descending trendline from the 2020 top could also cap any potential increases around 1.3650. If the bulls manage to breach that border, the 23.6% Fibonacci of 1.3700 and the 1.3750 restrictive region could create new risks, delaying a forceful rally to 1.3840-1.3870.
A bearish correction could initially stabilize somewhere between the 200-day SMA and the 50% Fibonacci mark of 1.3494. Should sellers dominate there, the price could slide towards the constraining line from November seen at 1.3425 or lower around the 61.8% Fibonacci of 1.3400. Additional losses could persist until the 2021 ascending trendline comes under examination within the 1.3290-1.3300 area.
In brief, USDCAD has not escaped downside risks despite regaining some ground this week. A durable recovery above 1.3700-1.3750 might be necessary for an upward outlook revision.
Germany 30 Technical: New Intraday Record High, Short-Term Bullish Trend Intact
- Cleared above 16,300 major range resistance in place since November 2021.
- Watch the 16,440 key short-term support.
The price actions of the Germany 30 Index (a proxy for the DAX futures) have continued to surge upward since our last analysis and cleared above the 16,200 short-term resistance as highlighted in our prior report.
Yesterday, 5 December it managed to have a daily close (closed at 16,534) above the 16,300 major range resistance in place since November 2021 that was tested in July 2023 where it printed an all-time high of 16,530 before it staged a decline of -11.8% in the next three months to print a low of 14,585 on October 2023.
Breakout above major range resistance
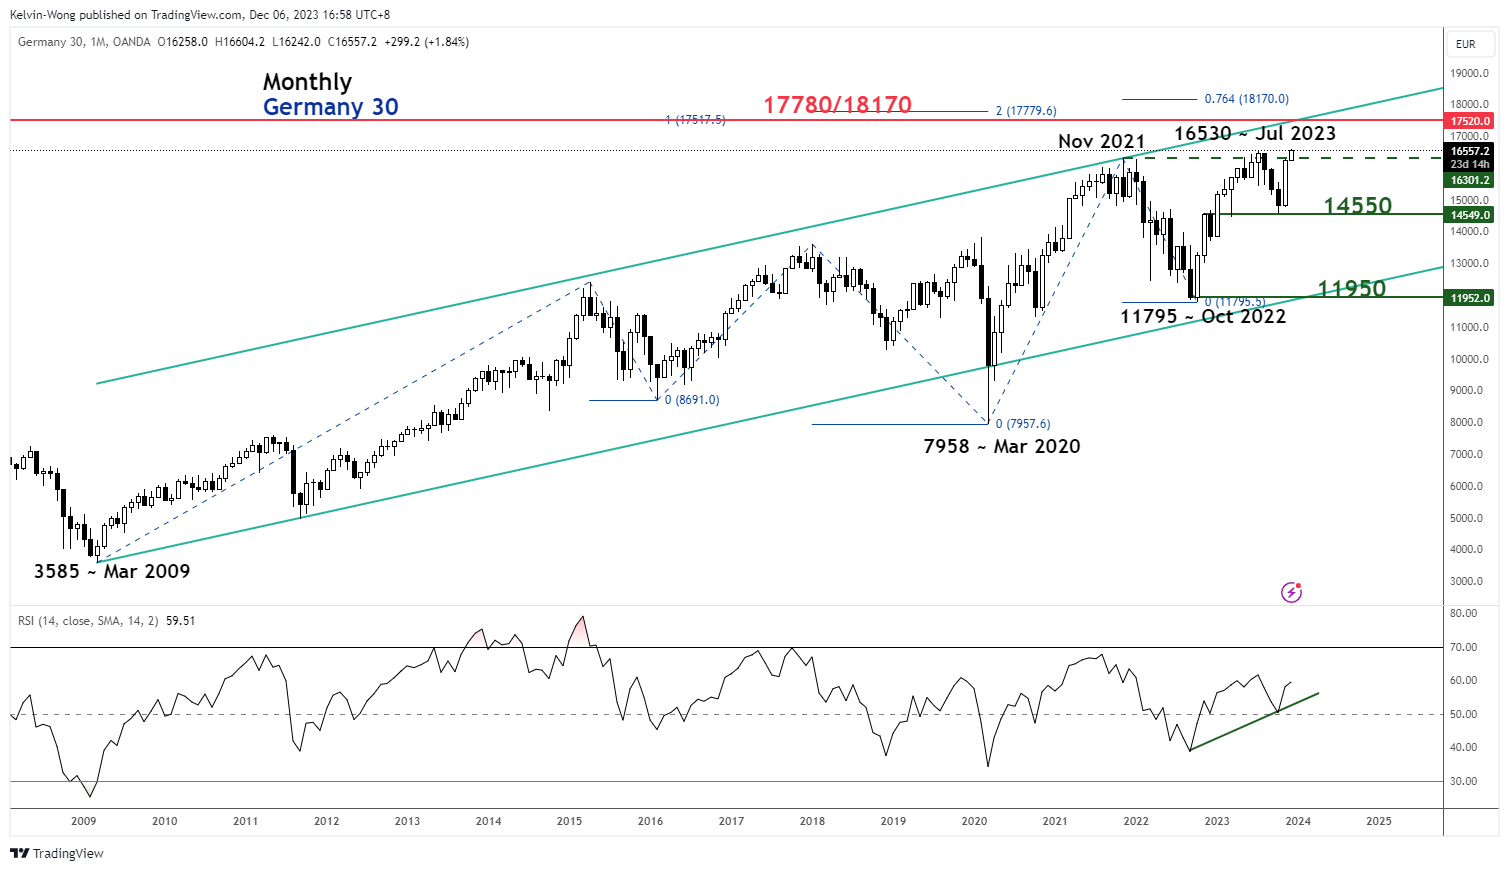
Fig 1: Germany 30 long-term secular trend as of 6 Dec 2023 (Source: TradingView, click to enlarge chart)
The risk of a failure bullish breakout above 16,300 has a lower odd this time round because the long-term monthly RSI momentum indicator has exhibited a bullish momentum reading as it shaped a higher low right at the 50 level and still has further room to manoeuvre to the upside before it reaches its overbought region (above 70 level).
All in all, the Germany 30 Index may be undergoing a major impulsive upmove sequence in place since the October 2022 low of 11,795 within its long-term secular uptrend trend phase from March 2009 low of 3,585. The intermediate major resistance zone stands at 17,780/18,170 (upper boundary of the long-term secular ascending channel & Fibonacci extension cluster).
Watch the 16,440 key short-term support
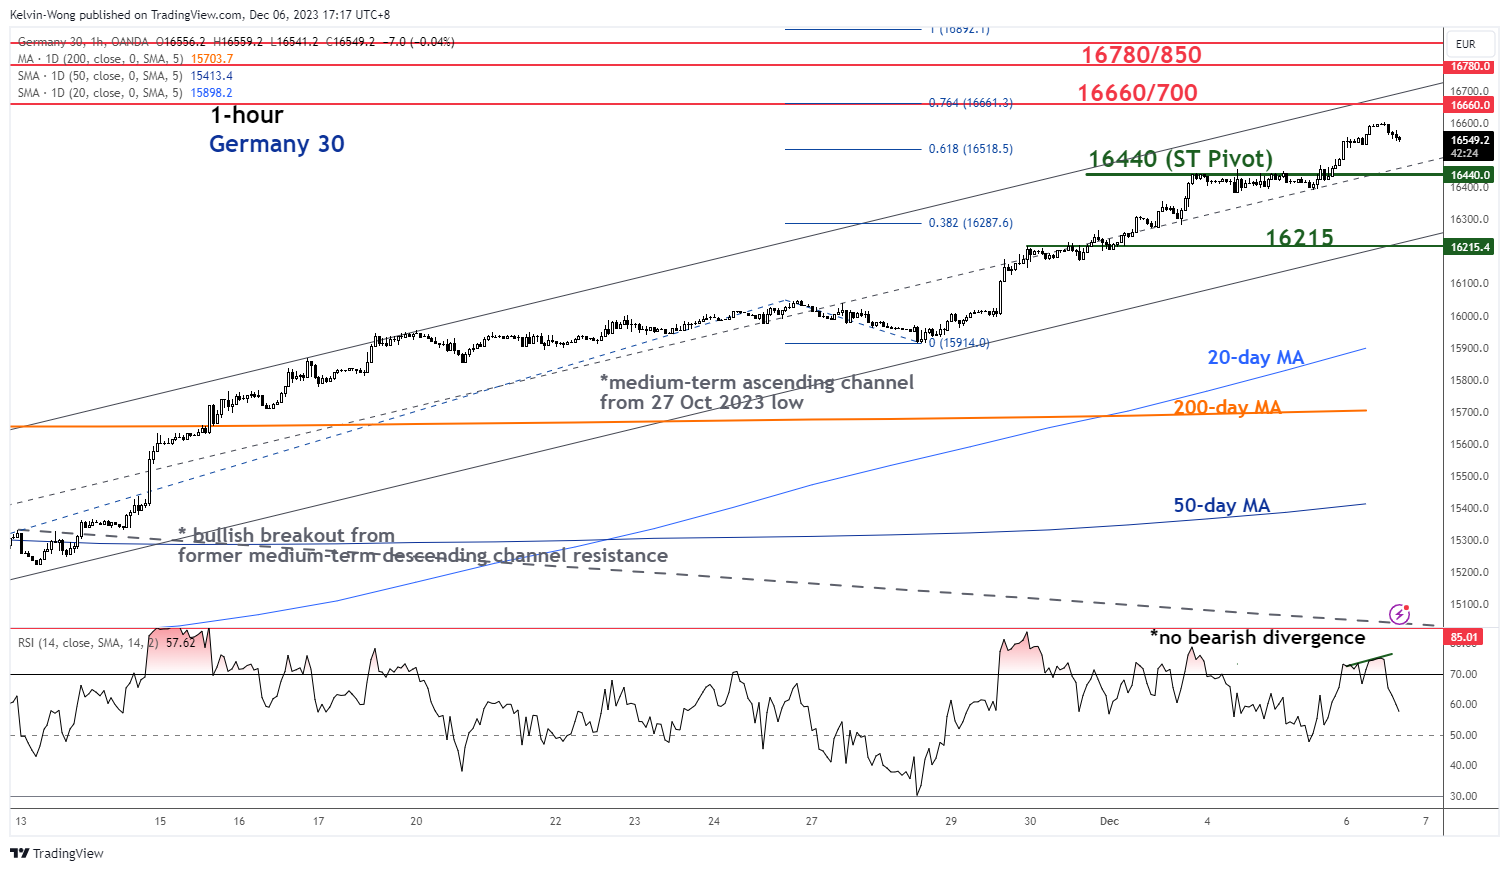
Fig 2: Germany 30 minor short-term trend as of 6 Dec 2023 (Source: TradingView, click to enlarge chart)
Based on the shorter-term hourly chart, the Germany 30 Index has continued to oscillate within the upper half of a medium-term ascending channel in place since the 27 October 2023 low, and today’s price action has ticked higher to print a fresh intraday all-time high of 16,597 at this time of the writing.
The recent exit from its overbought region as depicted by the hourly RSI momentum indicator has not flashed out a prior bearish divergence condition that highlights a higher probability of a minor pull-back in price actions rather than a steeper bearish reversal.
If the 16,440 key short-term pivotal support (also the median line of the medium-term ascending channel) manages to hold, the short-term bullish tone is likely to remain intact with the next intermediate resistances coming in at 16,660/700 and 16,780/850.
However, a breakdown below 16,440 negates the bullish tone to expose the next intermediate support at 16,215 (the lower boundary of the medium-term ascending channel).
Australian Dollar Rebounds Despite Soft GDP
- Australian GDP falls to 0.2%
- AUD/USD rebounds after two-day losing streak
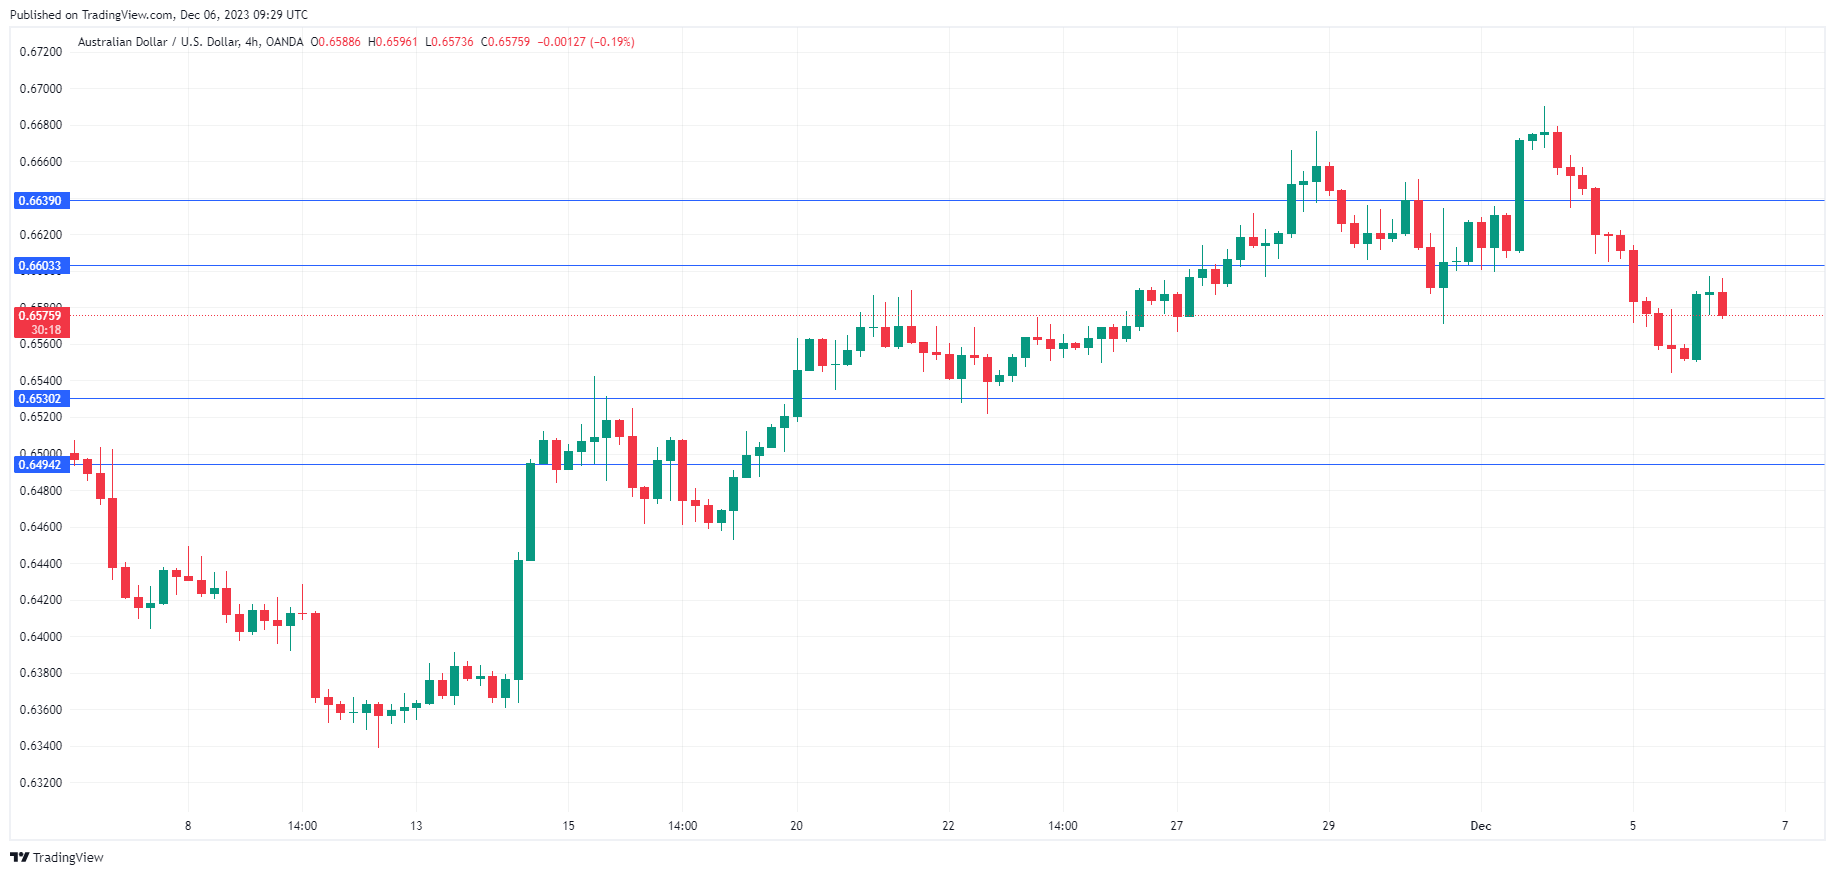
The Australian dollar has bounced back on Wednesday and snapped a two-day losing streak. In the European session, AUD/USD is trading at 0.6574, up 0.34%.
Australian GDP eases to 0.2%
Australia’s GDP rose 0.2% q/q in the third quarter, below the consensus estimate of 0.4% and the second quarter print of 0.4%. This was the weakest rate of expansion since Q3 2022, as household consumption showed no growth and exports dropped for the first time since Q1 2022. Despite the weak release, the Australian dollar is higher today.
The soft GDP report points to weak consumer spending, as consumers are being squeezed by elevated borrowing costs and high inflation. In October, headline inflation eased to 4.9% y/y, down sharply from 5.6% in September. The trimmed mean, a key core inflation indicator, ticked lower to 5.3%, down from 5.4% in September. Inflation has been heading in the right direction but consumers are still seeing pricing rising, albeit at a slower pace.
The drop in exports is a worrisome event and is largely due to the slowdown in China, which is Australia’s largest export market. China’s growth has been slowing, debt is rising and the property sector is in crisis with some of the largest construction companies facing bankruptcy. On Tuesday, Moody’s rating agency cut its credit outlook for China from stable to negative. Moody’s maintained China’s credit rating at A1, but the credit outlook downgrade reflects deep concern about the state of China’s economy.
On Tuesday, China’s Caixin Services PMI improved in November to 51.5, up from 50.4 in October. This indicates weak growth, with the 50 line separating contraction from expansion. The manufacturing sector has been a drag on the economy, with manufacturing PMIs indicating contraction in eight of the past nine months.
AUD/USD Technical
- There is support at 0.6530 and 0.6494
- 0.6603 and 0.6639 are the next resistance lines
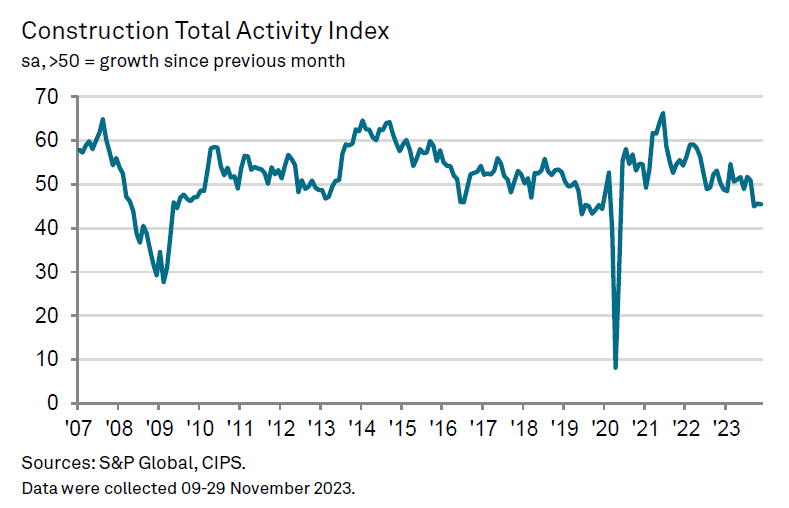
UK PMI construction fell to 45.5, ongoing sectoral downturn
UK PMI Construction ticked down from 45.6 to 45.5 in November, remaining below the neutral 50 mark and underperforming against the expected 47.1. This level indicates continued contraction in the construction sector for the third month, marking it as the second-lowest reading since May 2020.
Tim Moore of S&P Global Market Intelligence highlighted the sector's issues, stating, "A slump in house building has cast a long shadow over the UK construction sector." He pointed out that the downturn in residential construction has persisted for the past 12 months, with recent reductions among the steepest since 2009.
Elevated mortgage costs and adverse market conditions were cited as key reasons for the decline in housing projects. Additionally, rising interest rates and economic uncertainty are adversely affecting commercial construction, while civil engineering activity saw its sharpest drop since July 2022.
Moore also noted a significant decrease in overall input prices for the second consecutive month, marking the fastest rate of decline since July 2009. Despite this decrease in costs, the sector continues to face substantial challenges.
Bitcoin and Ether Reach New Heights. Where is the Stopping Point?
Market picture
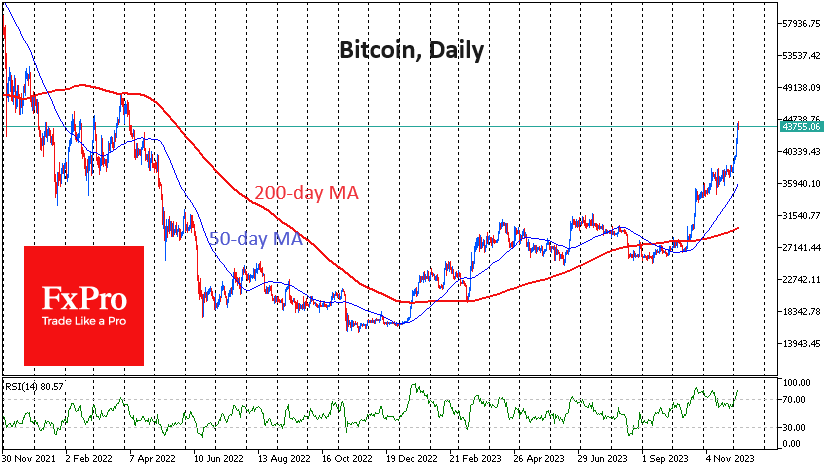
The crypto market made another leap forward on Tuesday afternoon after spending less than 24 hours in consolidation mode. In the last day, the total crypto cap reached $1.6 trillion, up 3.9% in a day, 11% in a week and 20% in 30 days. The acceleration in recent days is evident, which may reflect both speculators hastily closing short positions and increasing FOMO.
Bitcoin is adding over 5% in 24 hours, trading near $43.7K at the time of writing and touching $44.5K at the start of the day. Previously, we have repeatedly noted “thin air territory” in the $40-46K range. The market did not linger here in previous times, and we should look for hints of turning points not earlier than the $46-47K area, where there was a reversal in March last year and temporary support in 2021.
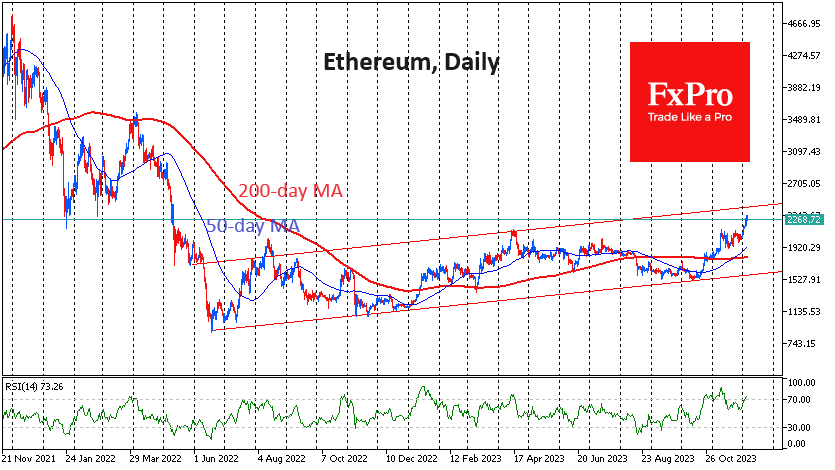
Ethereum tested $2300 but has so far quickly retreated to $2260. In the dynamics of ETH since the middle of last year, a broad upward channel can be identified, the upper boundary of which now passes through $2430. It is worth being prepared for the bulls to pull the price closer to these levels before deciding to take profits.
News background
According to unconfirmed rumours, Qatar’s sovereign wealth fund is preparing to enter the crypto market with huge investments and invest up to $500 billion in VTS, said Max Kaiser, advisor to the president of El Salvador. In his opinion, VTS may soon overcome the $150K mark and go further.
Bloomberg Intelligence strategist Mike McGlone believes Bitcoin is now showing much more strength than gold, which hit record highs earlier in the week but then collapsed 5%.
Brazil’s largest bank, Itau Unibanco, has launched a Bitcoin and Ethereum trading service for clients of its investment platform, confirming its willingness to become a full participant in the country’s growing cryptocurrency market.
Tether’s unrealised profits from Bitcoin investments reached $1.1 billion. According to EmberCN, Tether holds 57,576 BTC with a purchase price of $22,480 per coin.
Cryptocurrencies have spent a record $19 million on lobbying in the US this year. The leader in spending on defending its interests was cryptocurrency exchange Coinbase, which this year allocated $2.16 million for lobbying.
Can NZDUSD Bulls Keep the Rally Alive?
- NZDUSD in the green today but sentiment mixed
- Key market events increase possibility of stronger moves
- Momentum indicators on the brink of giving bearish signals
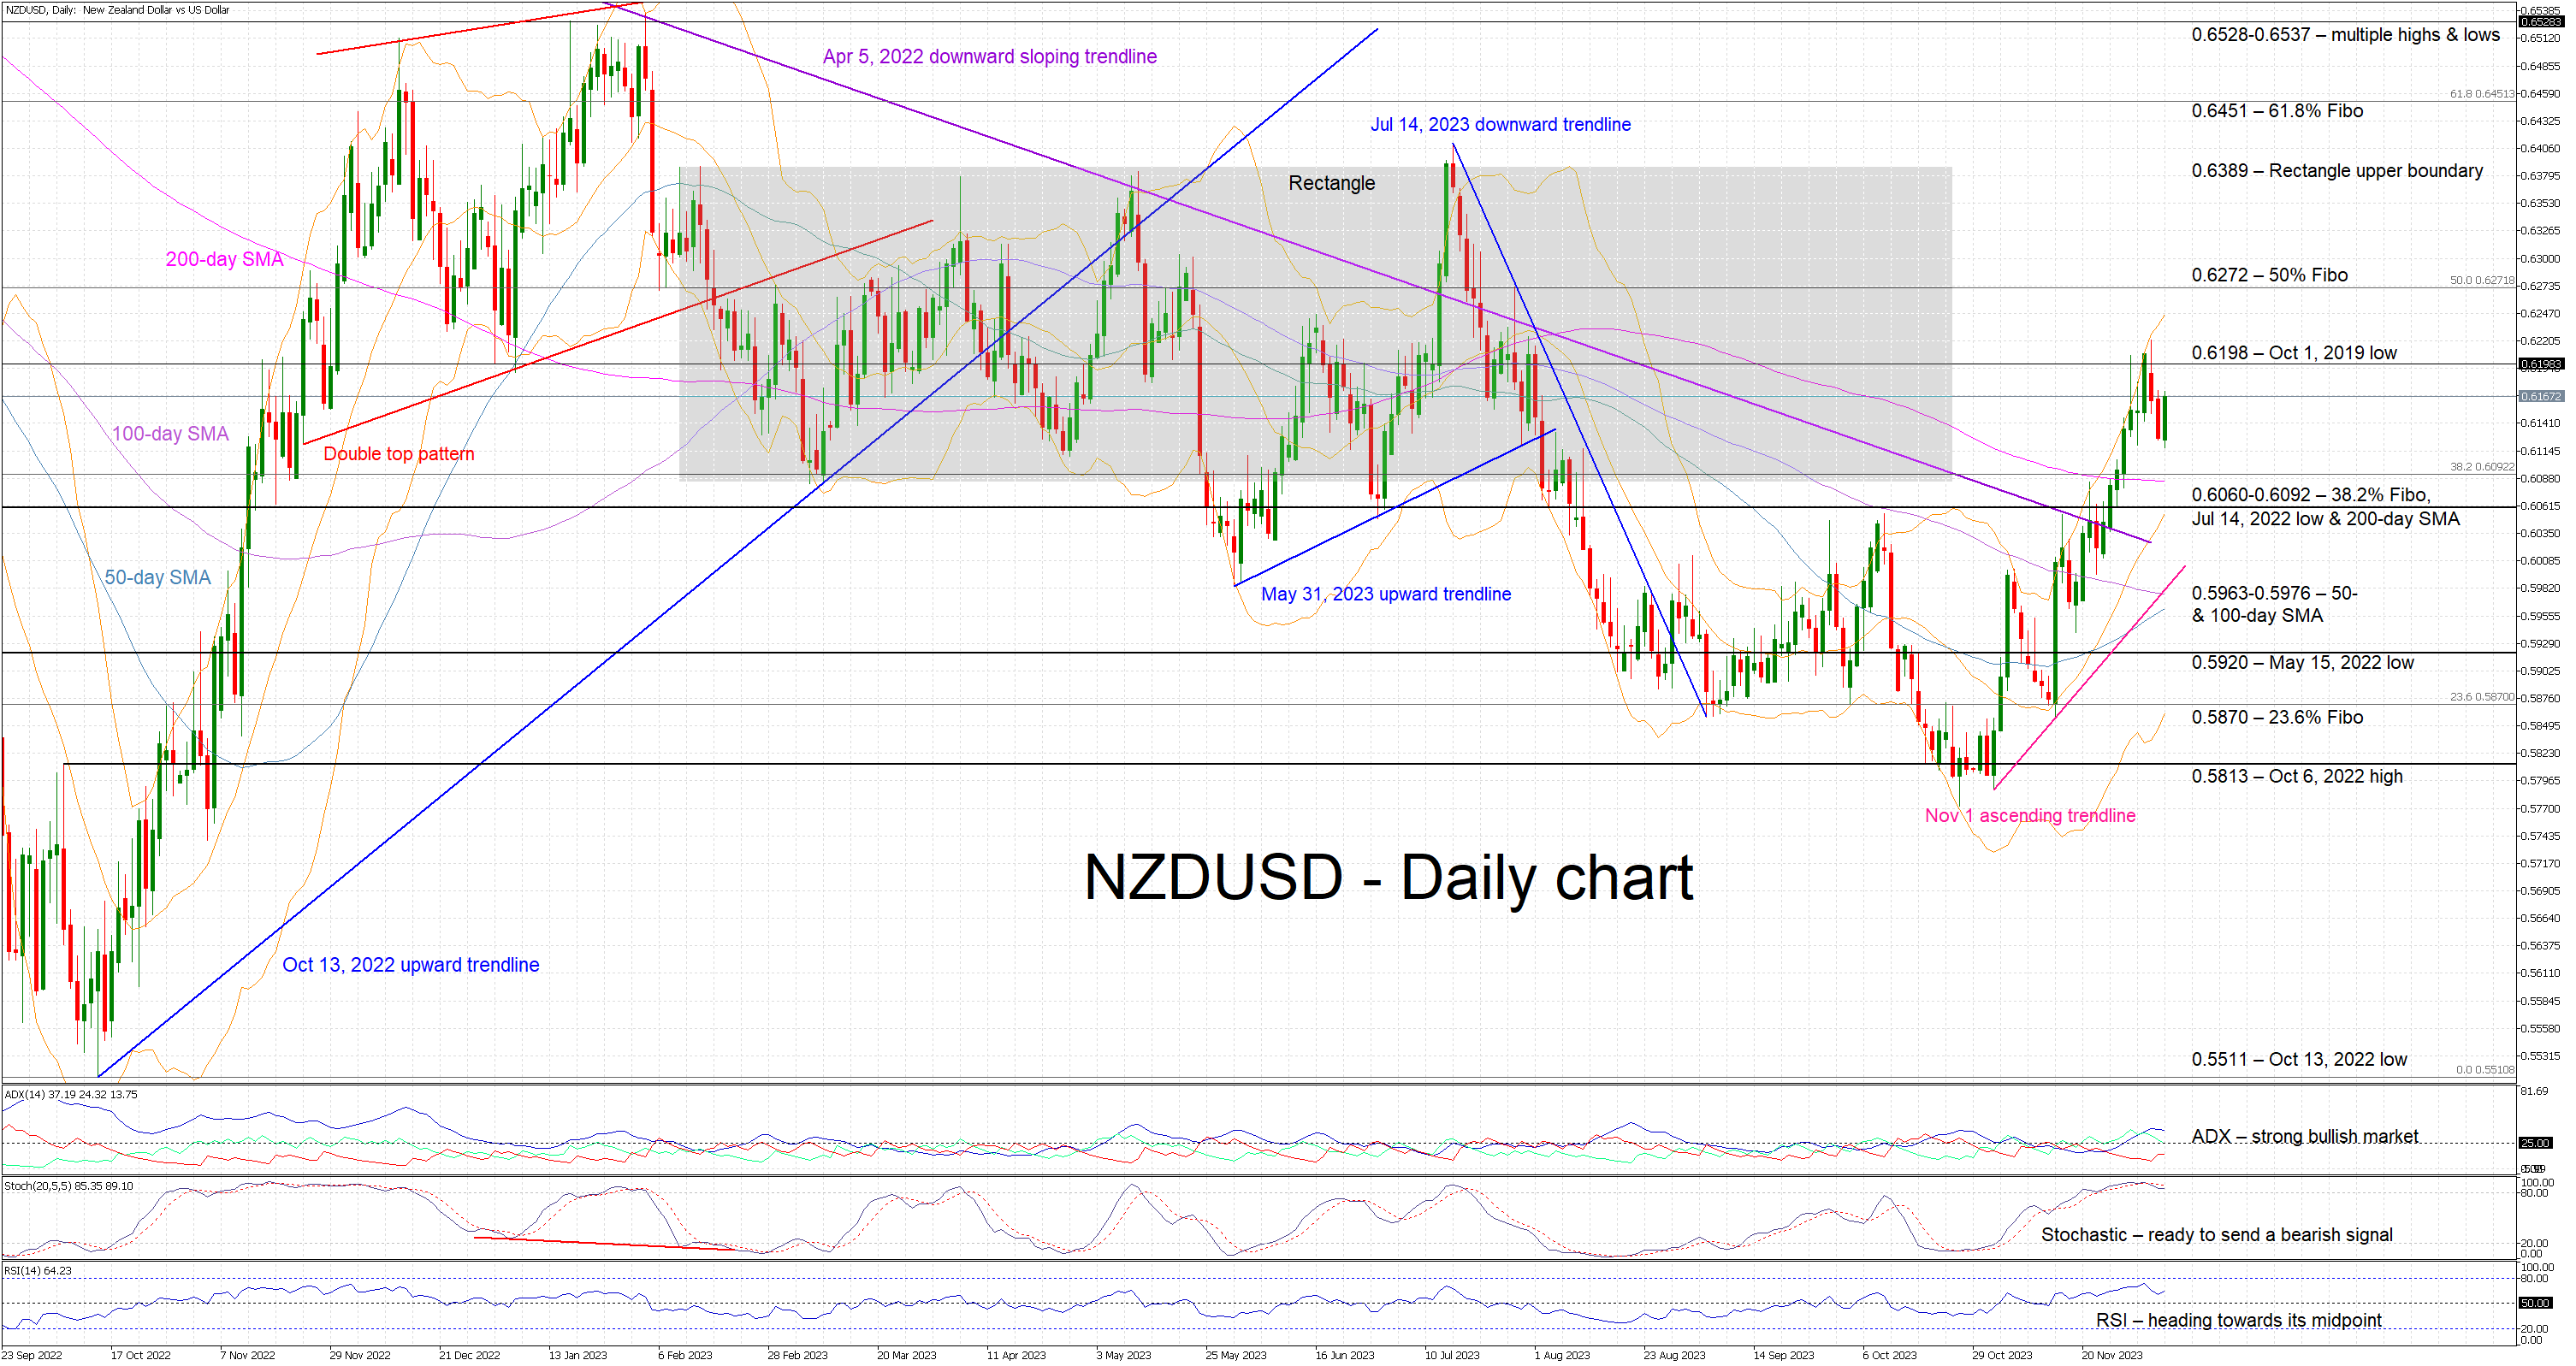
NZDUSD is edging higher today, reacting to the previous two sizeable red candles. It has been an aggressive rally from the November 1 low of 0.5788 as NZDUSD bulls took advantage of the widespread USD weakness and the relative hawkishness of the RBNZ to record a 3-month high of 0.6222. In the meantime, the convergence of the 50- and 100-day simple moving averages (SMA) means that volatility could remain high this week.
Amidst these developments, the focus has turned to the momentum indicators. More specifically, the Average Directional Movement Index (ADX) is above its threshold, but it is now trading sideways and thus casting a shadow over the current upleg. Similarly, the RSI is edging slightly higher but remains below its recent peak. More importantly, the stochastic oscillator has broken below its moving average and prepares to exit the overbought area. Should such a move take place, it could be seen as a first strong bearish step.
If the bulls are keen to record a higher high, they could try to push NZDUSD above the October 1, 2019 low at 0.6198 and then potentially set their eyes on the 0.6272 level. This is defined by the 50% Fibonacci retracement of the April 5, 2022 – October 13, 2022 downtrend, and, if broken, it could open the door for a more protracted rally towards the 0.6389 level.
On the flip side, the bears are trying to regain market control. They could try to push NZDUSD towards the busy 0.6060-0.6092 region, which is populated by the 38.2% Fibonacci retracement, the July 14, 2022 low and the 200-day SMA. Even lower, the path looks clear until the 0.5963-0.5976 region that is set by the 50- and 100-day SMAs.
To sum up, NZDUSD bulls have managed to record a 3-month high, but their aim for a higher high appears to be more difficult now since the momentum indicators are preparing to turn bearish.
EUR/CHF Daily Outlook
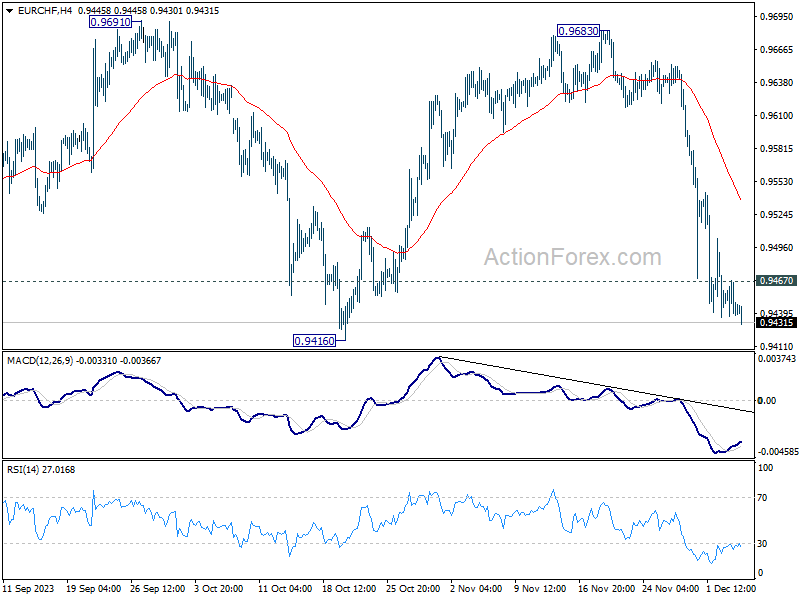
Daily Pivots: (S1) 0.9435; (P) 0.9452; (R1) 0.9465; More...
Intraday bias in EUR/CHF remains on the downside despite some loss of downside momentum. Retest of 0.9407/16 support zone should be seen. Decisive break there will resume larger down trend. On the upside, above 0.9467 minor resistance will delay the bearish case and turn intraday bias neutral for consolidation first.
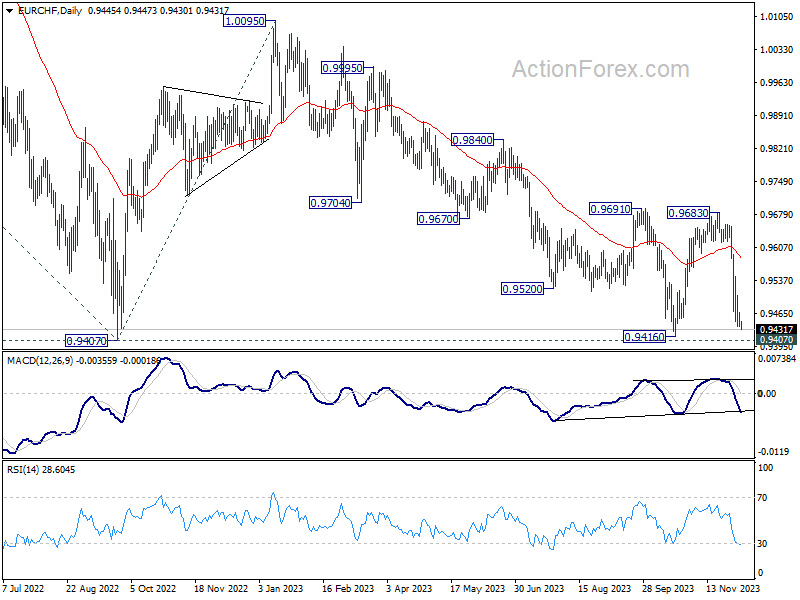
In the bigger picture, medium term outlook remains bearish as long as 0.9683 resistance holds. Firm break of 0.9407 (2022 low) will resume long term down trend. Next target will be 61.8% projection of 1.1149 to 0.9407 from 1.0095 at 0.9018.
GBP/JPY Daily Outlook
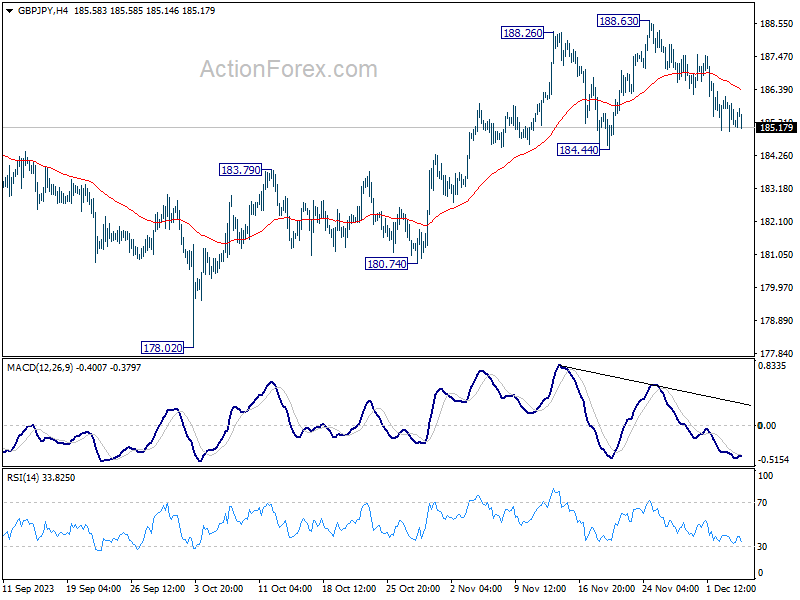
Daily Pivots: (S1) 184.88; (P) 185.54; (R1) 186.01; More...
GBP/JPY is still staying in range of 184.44/188.63 and intraday bias remains neutral first. As long as 184.44 support holds, further rally is expected. Decisive break of 188.63 will resume larger up trend. However, firm break of 184.44 will turn bias to the downside for deeper correction back to 178.02 support instead.
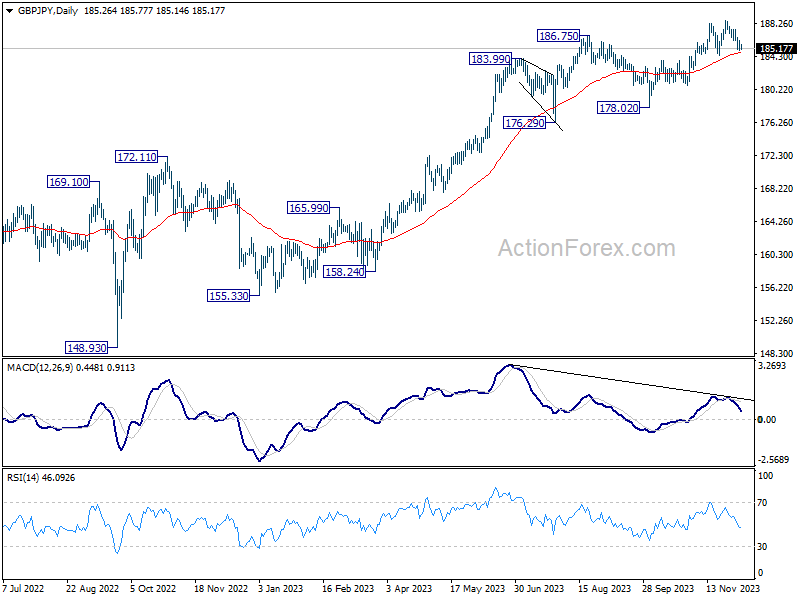
In the bigger picture, as long as 184.44 support holds, larger up trend from 123.94 (202 low) should still be in progress, next target is 195.86 (2015 high). However, firm break of 184.44 will now argue that a medium term top is formed, possibly in bearish divergence condition in D MACD, and bring deeper fall back to 178.02 support.
EUR/JPY Daily Outlook
Daily Pivots: (S1) 158.41; (P) 159.07; (R1) 159.55; More..
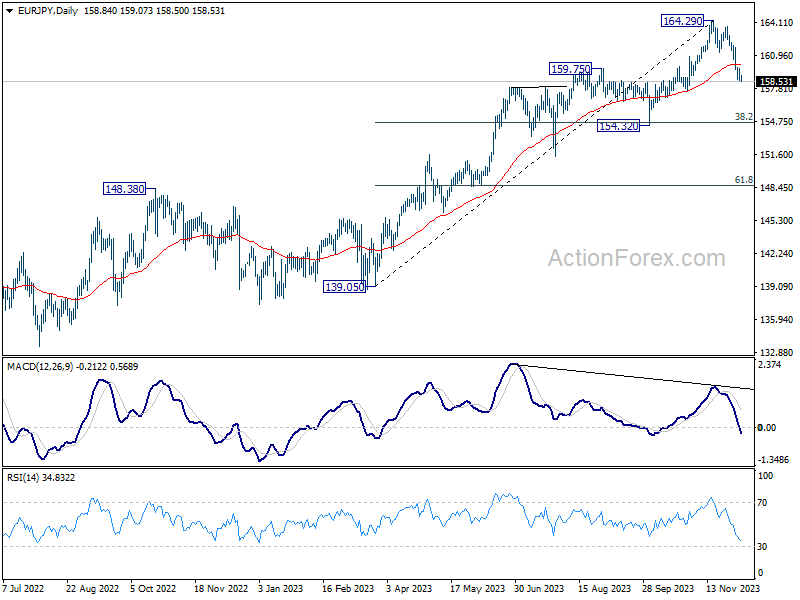
Intraday bias in EUR/JPY remains on the downside at this point. Current fall from 164.29 should target 154.32 cluster support (38.2% retracement of 139.05 to 164.29 at 154.64). On the upside, above 159.70 minor resistance will turn intraday bias neutral and bring consolidations first, before staging another decline.
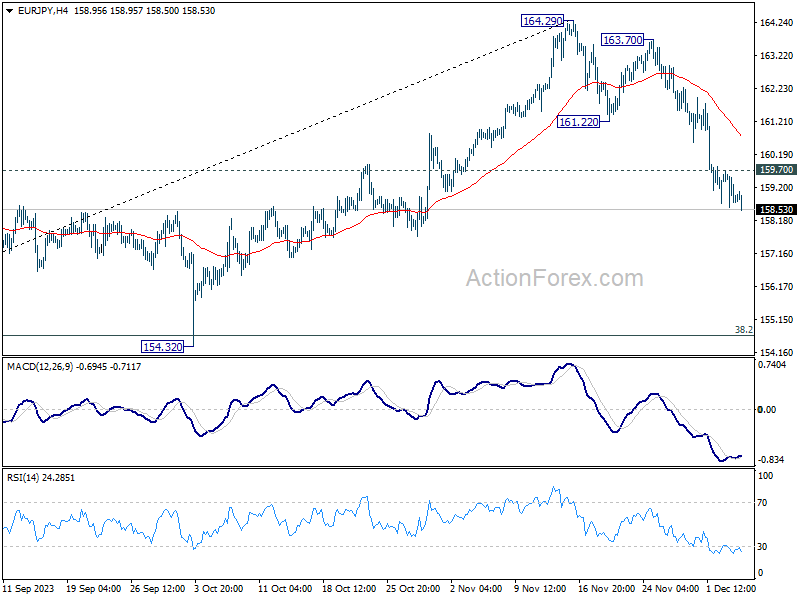
In the bigger picture, bearish divergence condition in 55 D EMA indicates that a medium term top could be formed at 164.29 already, after hitting rising channel resistance. But price actions from there are tentatively seen as a correction only. There is no clear sign that the up trend from 144.42 (2020 low) has completed yet. As long as 55 W EMA (now at 152.12) holds, another rally through 164.29 is still in favor as a later stage.