Sample Category Title
Japanese Yen Improves to Six-Week High
- Japanese yen posts sharp gains on Monday
The Japanese yen is up for a third straight day on Monday and has climbed 2% against the US dollar in the current rally. In the European session, USD/JPY is trading at 148.40, down 0.84%.
Yen rebounds as US/Japan rate differential narrows
After falling to a one-year low last week, the yen has rebounded and is trading at a six-week high. The swing in favour of the yen has been driven by expectations that Fed policy will be less restrictive in the first half of 2024. According to the CME’s FedWatch tool, there is a 100% likelihood of a pause in December, with a 30% chance of a rate cut in March 2024, followed by a 64% chance in May.
The yen has received a boost as the US/Japan rate differential has decreased. Just a month ago, 10-year US Treasuries were trading at 4.98%, but have fallen to 4.44% at present. The lower yields have made US Treasuries less attractive to investors and the yen has capitalized on this sentiment. The FOMC minutes will be released on Wednesday and could provide some insights into the Fed’s future rate path.
The recent strength of the yen has tempered talk of intervention by Japan’s Ministry of Finance, which threatened to step in after the USD/JPY fell close to 152 last week. The yen has been showing sharp swings of late, raising the question of whether the yen’s recent upswing is sustainable.
Investors are also looking for hints from the Bank of Japan about tightening policy. The central bank has tried to dampen expectations for a shift in monetary policy, but there have been some subtle signals that the BoJ will exit negative rates in 2024.
USD/JPY Technical
- USD/JPY has pushed below support at 149.29 and is testing support at 148.54
- There is resistance at 150.22 and 151.25
EURUSD Halfway to July’s Top; Tests 1.0940 Level
- EURUSD stretches to fresh highs ahead of important PMI data
- Overbought signals strengthen near August’s hurdles
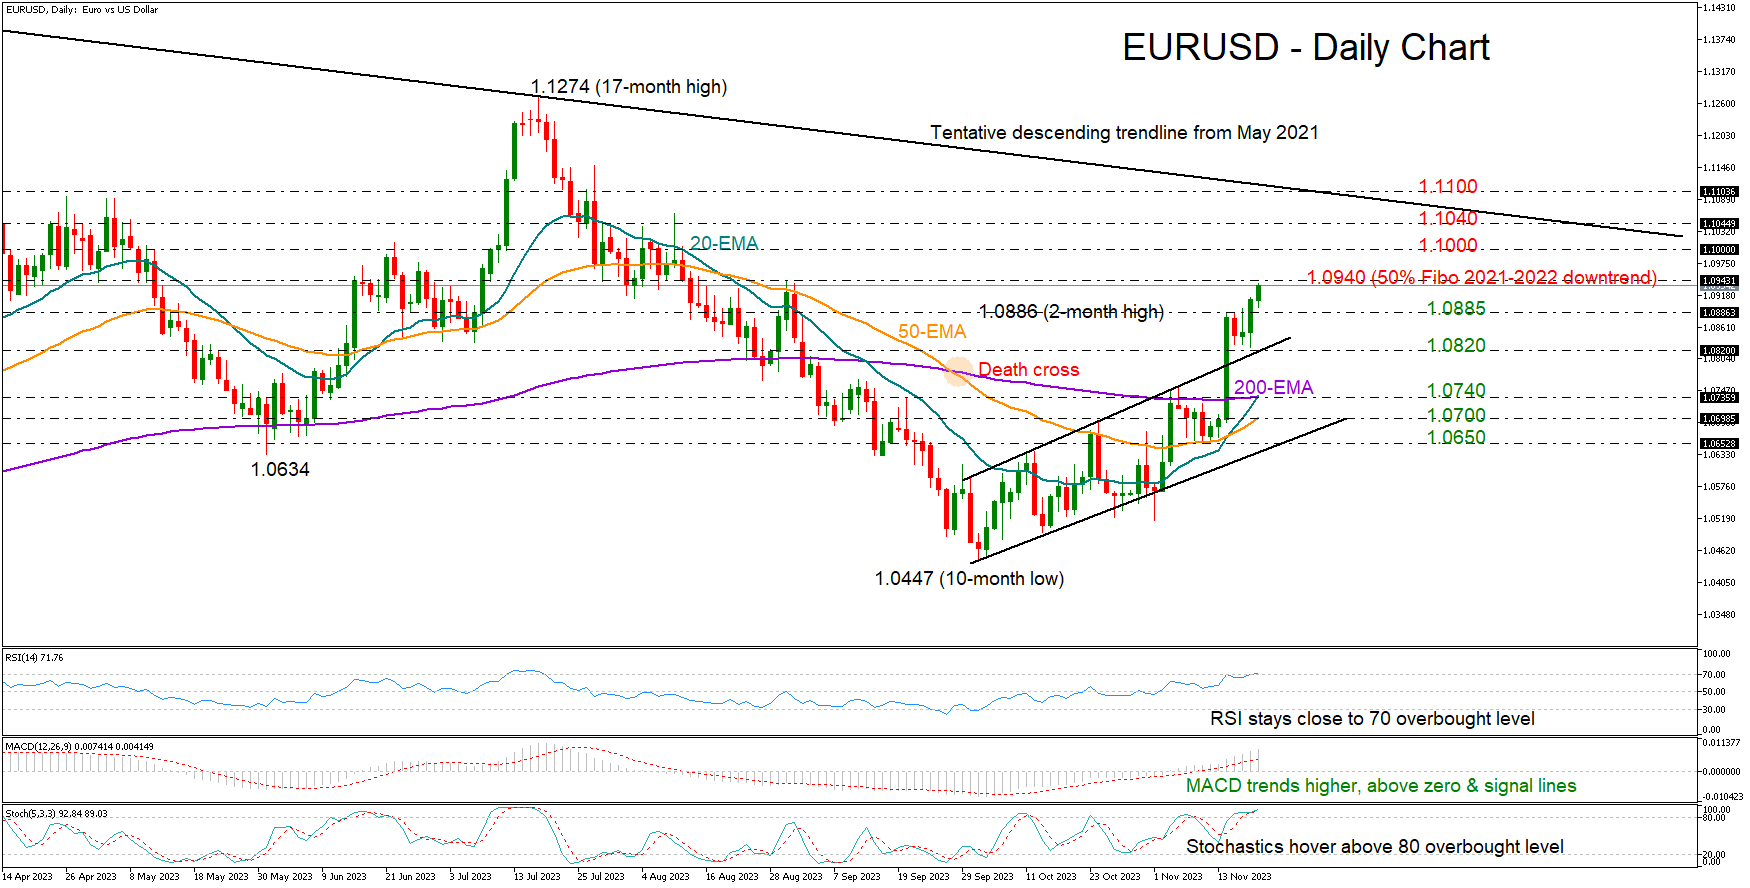
EURUSD stepped into the 1.0900 zone after an exponential rally last week, marking a new 2½-month high of 1.0934 during Monday’s early European trading hours.
The pair has passed the halfway mark to July's peak from the October low and some profit-taking would not be a big surprise as the RSI and the stochastic oscillator are hinting at overbought conditions while the price is testing its August’s resistance levels.
Encouragingly though, the 20-day exponential moving average (EMA) has crossed above the 50-day EMA and is preparing for another intersection with the 200-day EMA, indicating the possibility of the positive trend continuing. Meanwhile, it would be also interesting to see if the 50- and 200-day EMAs will manage to reverse the death cross registered at the end of September.
The 1.0940 caution area, which overlaps with the 50% Fibonacci retracement of the 2021-2022 downtrend, is under examination. Breaking the wall could propel the bulls into an uptrend towards the 1.1000 psychological level. The former resistance at 1.1040 and the 1.1100 number could attract attention, especially the latter, as the tentative descending trendline from May 2021 happens to be there too.
Alternatively, a backward flip beneath 1.0885 might seek support around the upper band of the broken bullish channel at 1.0820. Should sellers dominate there, the decline could worsen towards the 20- and 200-day EMAs at 1.0740. The 50-day EMA might also be on guard near 1.0700. If the latter proves fragile, the next stop could be at the channel’s lower band seen at 1.0650.
All in all, EURUSD retains a positive monthly picture, with the bulls looking for a close above 1.0940 to run higher ahead of Eurozone’s flash business PMI figures due on Thursday. Given the overbought signals though, additional gains could come with some delay.
US 500 Index Reclaims 4,500, Threatening September Highs
- US 500 stock index posts fresh 2½ -month high
- But advance seems to be taking a breather
- Momentum indicators approach their overbought zones
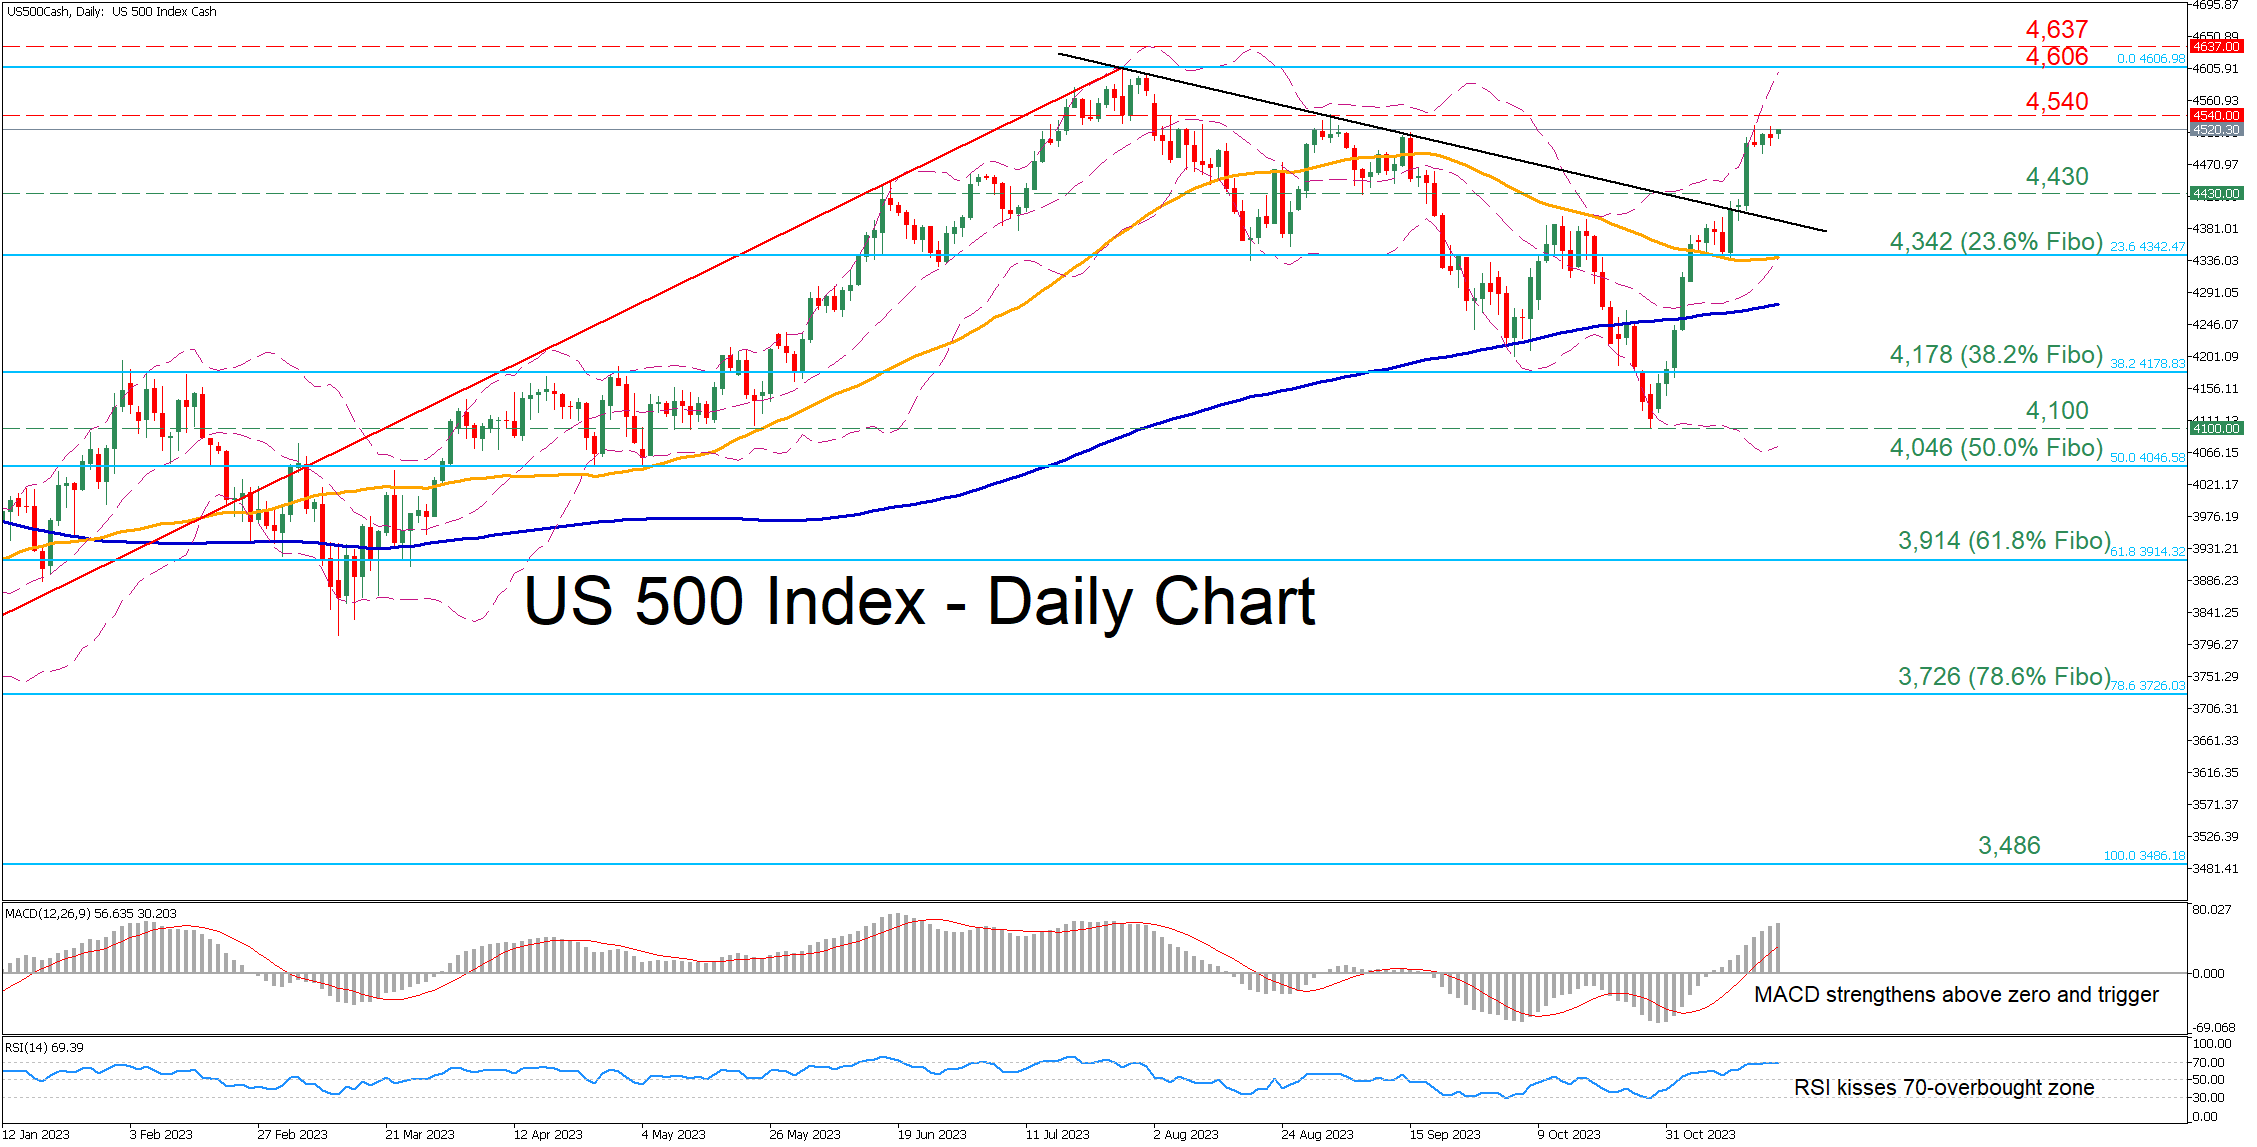
The US 500 stock index (cash) has been staging an aggressive rally since it bottomed out in late October, piercing through the descending trendline that connects its recent lower highs. However, the uptrend appears to be on hold in the last few sessions as the short-term oscillators have approached overbought levels.
Should buyers attempt to push the price higher, immediate resistance could be found at the September peak of 4,540. Surpassing that zone, the index could ascend towards the 2023 high of 4,606. A break above that territory could open the door for the March 2022 high of 4,637.
On the flipside, if the price experiences a pullback, the September support of 4,430 could act as the first line of defence. Should that barricade fail, the bears could attack 4,342, which is the 23.6% Fibonacci retracement of the 3,486-4,606 upleg. Failing to halt there, the price may then challenge the 38.2% Fibo of 4,178.
Overall, the US 500 index has been facing strong upside pressures in the past three weeks, while the widening Bollinger bands are hinting at increased volatility. However, the price could enter a consolidation phase as the momentum indicators currently suggest that the advance is overdone.
NIKKEI Analysis: High of 33 Years
The Japanese stock market index, made up of shares of 225 companies, is showing high volatility today, attempting to break through the September high. Reuters wrote that the index had reached its highest level since 1990. The record is due to low rates from the Bank of Japan, which are helping the country's export-oriented industry (in particular, the automobile industry) and financial sector to grow.
At the same time, in various financial markets, Nikkei-related instruments may not have recorded a maximum in 33 years — the reason is liquidity and what appears to be the top of the market:
→ there was a massive liquidation of short positions;
→ major market participants recorded profits.
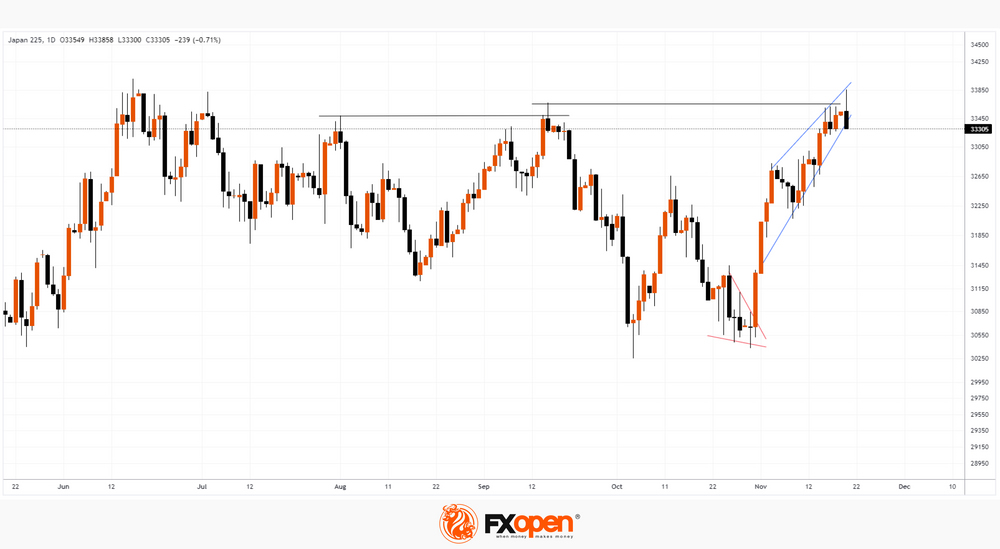
Therefore, the daily candlestick on European Monday morning has a long upper shadow. Note that today's high could be a false breakout of the September top, which in turn is a false breakout of the August top.
The chart shows that the price of NIKKEI is forming a tapering wedge pattern (shown with blue lines) pointing upward. A bearish breakout of this pattern could lead to the development of a downtrend.
Something similar (but in a mirror image) was recorded at the end of October, when a downward wedge formed on the chart (shown by red lines, more clearly visible on the 4-hour chart). The breakout of this wedge led to a rally of over 9%.
If the NIKKEI enters a downtrend, it could be fueled by rumors of an end to the low rate policy. Experts in the media are increasingly predicting this move by the Bank of Japan.
This article represents the opinion of the Companies operating under the FXOpen brand only. It is not to be construed as an offer, solicitation, or recommendation with respect to products and services provided by the Companies operating under the FXOpen brand, nor is it to be considered financial advice.
ECB’s Wunsch: Early rate cut bets may trigger opposite action
ECB Governing Council member Pierre Wunsch today expressed skepticism regarding market expectations of an early easing of monetary policy. His comments highlight a crucial divergence between market forecasts and ECB's potential policy path in the face of ongoing inflationary pressures.
Wunsch described the market's anticipation of a reduction in ECB's deposit rate from the current 4% by April as "optimistic." He pointed out the necessity for ECB to either continue with the current rate or possibly increase it, contrary to market expectations.
He raised concerns about the implications of market bet on rate cuts. "Is it a problem if everybody believes we're going to cut?" he questioned. This could lead to "less restrictive monetary policy" which may then be insufficient, and eventually, "it increases the risk that you have to correct in the other direction."
Wunsch emphasized the ECB's readiness to adapt its strategy based on inflation trends. "If we arrive at the conclusion that inflation is not going down fast enough, we'll communicate it through our projection and through our communication," he stated.
Gold Lacks Bullish Momentum
Gold (XAU) declined on Friday, losing initial gains XAUUSD got on the back of the weakening U.S. dollar.
Possible effects for traders
Economic data indicating a slowing U.S. economy brought the U.S. dollar to its lowest point in nearly a month as the chances of additional rate hikes by the Federal Reserve decreased. 'Data indicating some weakness in labour markets helped drive market expectations around the Fed and thus drove gold higher today. This comes after a retrenchment in some of the risk-off flows that have occurred as concerns about a broader Middle East conflict have ebbed,' said Christopher Louney, a commodities strategist at RBC Capital Markets.
Today, XAUUSD decreased in the Asian trading session but rose in the early hours of the European session. The People's Bank of China maintained its one and five-year loan prime rates unchanged at 3.45% and 4.2%, aligning with market forecasts. 'Spot gold looks neutral in a range of $1,976–1,990 per ounce, and an escape could suggest a direction,' said Reuters analyst Wang Tao.
Japanese Yen Benefited from U.S. Dollar Weakness
The Japanese yen rose over 149.000, reaching its highest level in over five weeks, driven by overall weakness in the U.S. dollar. Now, the market doesn't expect rate hikes from the Federal Reserve. Expectations shifted towards a more dovish policy by the regulator, so investors believe rate cuts will come in May 2024.
Possible effects for traders
Recent data revealed that Japan's economy shrunk more rapidly than anticipated in Q3 as the global demand declined and domestic inflation increased. The Bank of Japan (BOJ) repeated its dedication to continuing its current loose monetary policy, implementing only minor modifications to its yield curve control measures. The BOJ adjusted its approach to the 10-year Japanese government bonds, designating 1% as a flexible 'upper bound' instead of a strict limit. The regulator also said it wouldn't defend this level via unlimited bond purchases.
USDJPY declined during the Asian trading session but grew in the early European trading hours. Today, the formal macroeconomic calendar is uneventful for the pair. This week, investors will focus on upcoming preliminary manufacturing and services PMI figures and inflation data from Japan, which will provide insights into the country's economic state and possible changes in the monetary policy.
GBP/USD Regains Strength While USD/CAD Weakens
GBP/USD started a fresh increase above the 1.2370 zone. USD/CAD is declining and trading below the 1.3730 support.
Important Takeaways for GBP/USD and USD/CAD Analysis Today
- The British Pound is eyeing a fresh increase above the 1.2500 resistance.
- There was a break above a key bearish trend line with resistance near 1.2430 on the hourly chart of GBP/USD at FXOpen.
- USD/CAD started a fresh decline after it broke the 1.3840 resistance.
- There was a break below a major bullish trend line with support near 1.3730 on the hourly chart at FXOpen.
GBP/USD Technical Analysis
On the hourly chart of GBP/USD at FXOpen, the pair formed a base above the 1.2185 level. The British Pound started a decent increase above the 1.2250 resistance zone against the US Dollar.
The pair gained strength above the 1.2300 level. The bulls even pushed the pair above the 1.2370 level and the 50-hour simple moving average and 1.2120. The pair cleared the 50% Fib retracement level of the downward move from the 1.2505 swing high to the 1.2373 low.
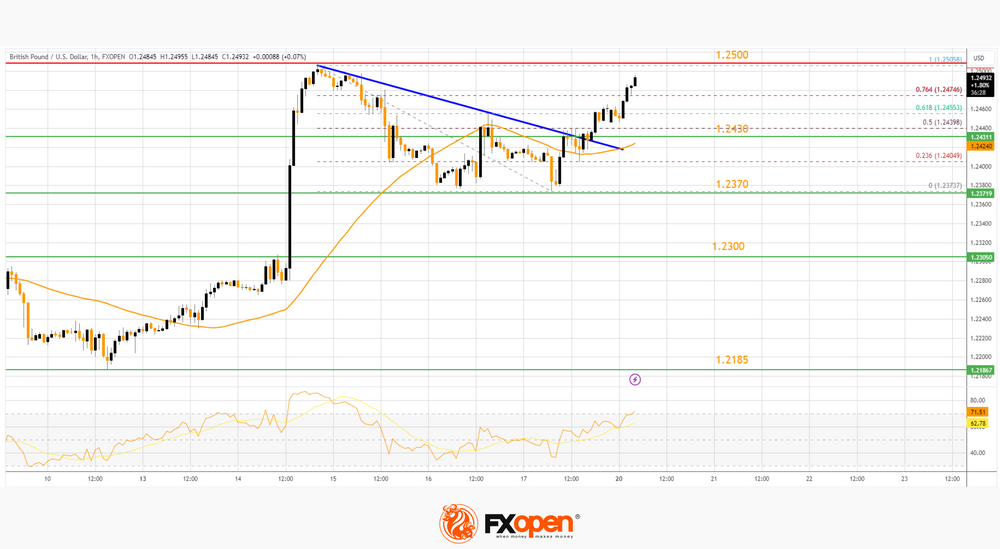
There was a break above a key bearish trend line with resistance near 1.2430. It is now trading above the 76.4% Fib retracement level of the downward move from the 1.2505 swing high to the 1.2373 low.
The RSI moved above the 65 level on the GBP/USD chart and the pair is now approaching a major hurdle at 1.2500. An upside break above the 1.2500 zone could send the pair toward 1.2550. Any more gains might open the doors for a test of 1.2620.
On the downside, the pair might find support near the 50-hour simple moving average at 1.2430. The next major support is 1.2370.
If there is a break below 1.2370, the pair could extend the decline. The next key support is near the 1.2300 level. Any more losses might call for a test of the 1.2185 support.
USD/CAD Technical Analysis
On the hourly chart of USD/CAD at FXOpen, the pair climbed toward the 1.3775 resistance zone before the bears appeared. The US Dollar formed a high near 1.3776 and recently declined below the 1.3730 support against the Canadian Dollar.
There was a break below a major bullish trend line with support near 1.3730. The pair declined below the 61.8% Fib retracement level of the upward move from the 1.3654 swing low to the 1.3775 high.
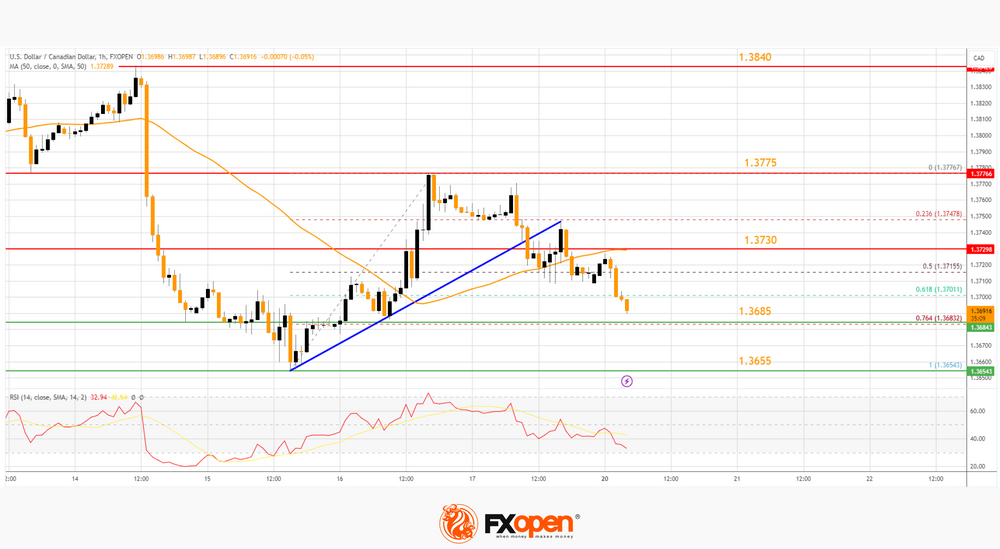
There was also a close below the 50-hour simple moving average and 1.3700. Immediate support is near the 76.4% Fib retracement level of the upward move from the 1.3654 swing low to the 1.3775 high at 1.3685.
The first major support is near 1.3665. A close below the 1.3665 level might trigger a strong decline. In the stated case, USD/CAD might test 1.3620. Any more losses may possibly open the doors for a drop toward the 1.3550 support.
If there is a fresh increase, the pair could face resistance near the 50-hour simple moving average at 1.3730. The next key resistance on the USD/CAD chart is 1.3775. If there is an upside break above 1.3775, the pair could rise toward the 1.3840 resistance.
The next major resistance is near the 1.3880 level, above which it could rise steadily toward the 1.3950 resistance zone.
This article represents the opinion of the Companies operating under the FXOpen brand only. It is not to be construed as an offer, solicitation, or recommendation with respect to products and services provided by the Companies operating under the FXOpen brand, nor is it to be considered financial advice.
GBP/JPY Daily Outlook
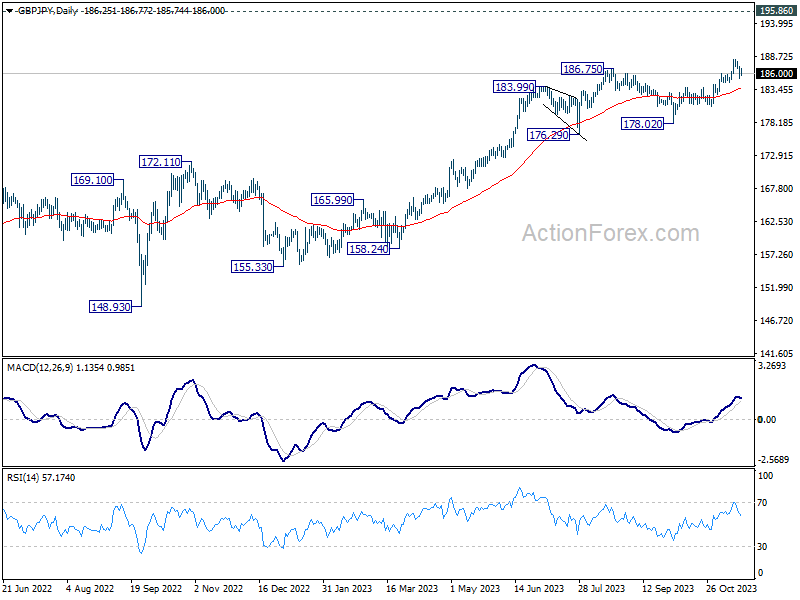
Daily Pivots: (S1) 185.38; (P) 186.32; (R1) 187.31; More...
Intraday bias in GBP/JPY stays neutral at this point, and more consolidations would be seen below 188.26. Another rally will remain in favor as long as 183.79 support turned resistance holds. Break of 188.26 will resume larger up trend.
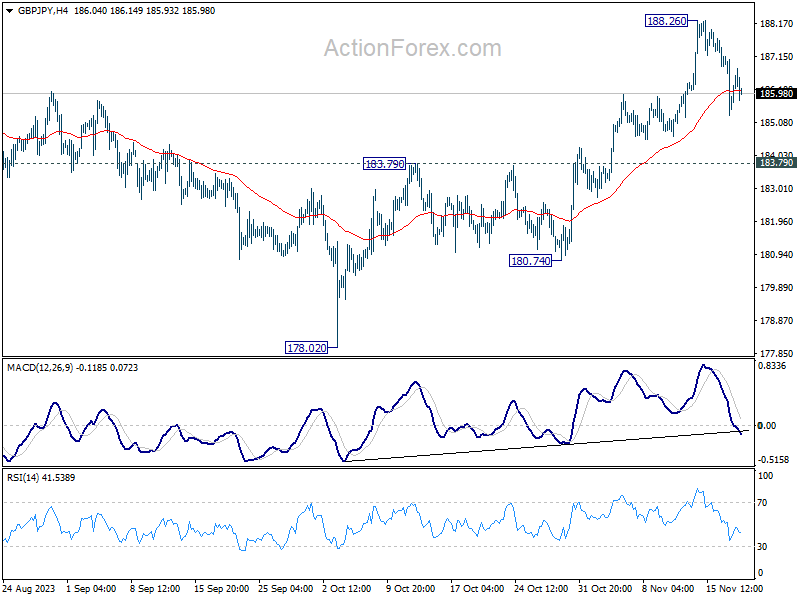
In the bigger picture, as long as 180.74 support holds, larger up trend from 123.94 (202 low) should still be in progress, next target is 195.86 (2015 high). However, firm break of 180.74 will now argue that a medium term top is formed, possibly in bearish divergence condition in D MACD, and bring deeper fall back to 178.02 support.
EUR/JPY Daily Outlook
Daily Pivots: (S1) 162.42; (P) 163.03; (R1) 163.89; More....
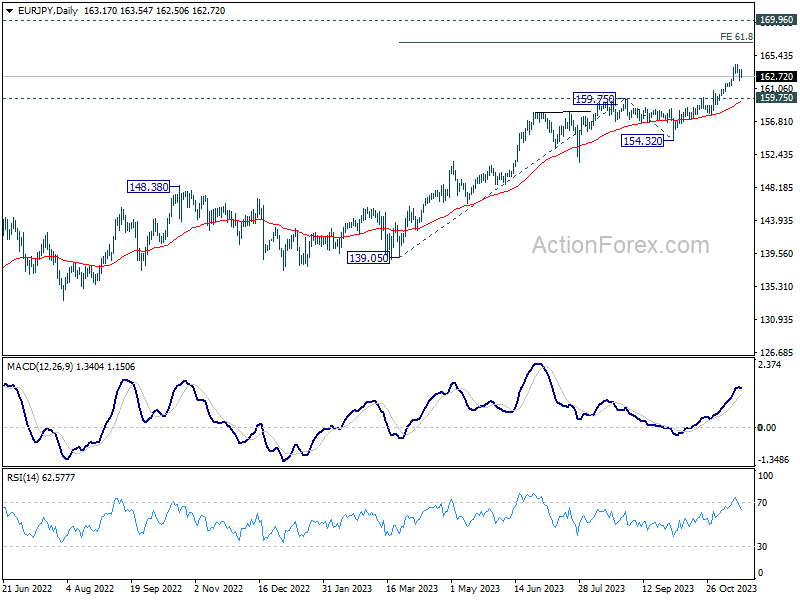
Intraday bias in EUR/JPY remains neutral as consolidation from 164.29 is extending. Downside of retreat should be contained well above 159.75 resistance turned support to bring another rally. On the upside, break of 164.29 will resume larger up trend to 61.8% projection of 139.05 to 159.75 from 154.32 at 167.11.
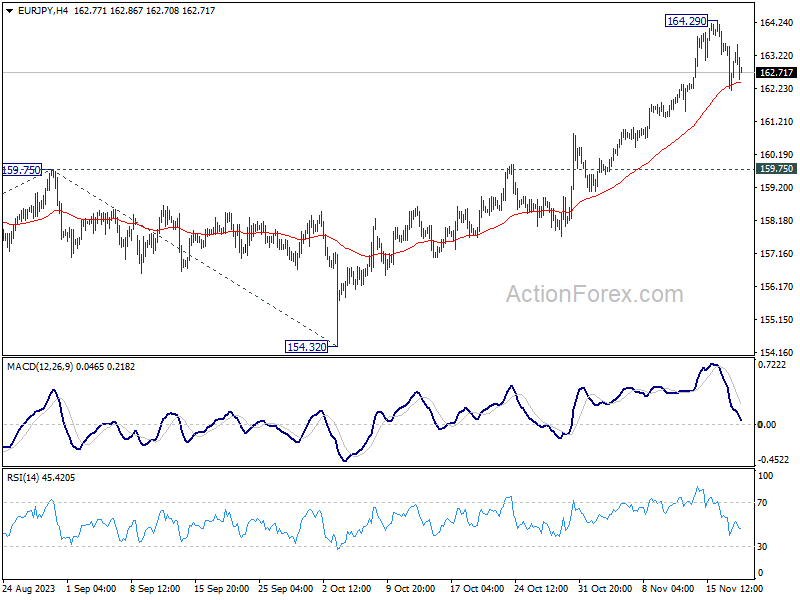
In the bigger picture, rise from 114.42 (2020 low) is in progress. Next target is 169.96 (2008 high). On the downside, break of 159.75 resistance turned support is needed to be the first sign of medium term topping. Otherwise, outlook will remain bullish even in case of deep pullback.