Sample Category Title
Fed Minutes in the Spotlight as Dollar Skids on Growing Rate Cut Bets
- FOMC minutes likely to be seen as out-of-date following recent soft data
- But hawkish surprise can still jolt markets as Fed rate cut bets seem overdone
- Can the minutes due Tuesday (19:00 GMT) offer the bruised dollar some support?
Fed on pause
When the Fed decided to keep interest rates unchanged at its October 31-November 1 meeting, it came closer than it has done during this tightening cycle to signalling that it is done hiking. Although the decision came hot on the heels of the Q3 GDP report that showed the US economy grew by a staggering 4.9% annualized pace, Chair Jerome Powell pointed to the recent tightening of financial conditions as cause for caution.
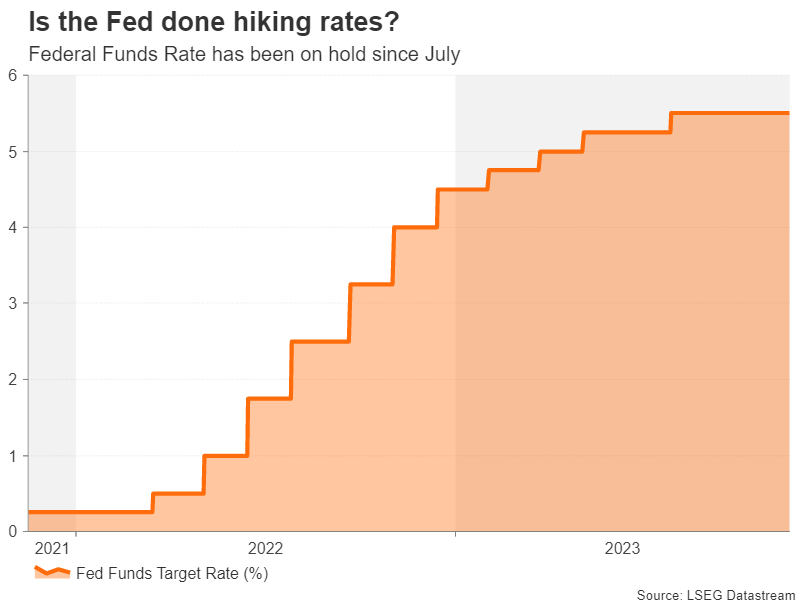
The data since that meeting has gone somewhat south, including inflation, further corroborating the view that no more tightening is needed. So, is there any reason to believe that the minutes will dash hopes of a Fed pivot? The answer is, probably not. But the minutes may nevertheless rein in expectations of how soon or how aggressively the Fed will slash rates in 2024.
The elusive pivot
The problem for the markets is that they’ve been wrongly pricing in a dovish pivot over the past year and each time the Fed has had to double down on its higher for longer stance, triggering a massive rebound in the US dollar and panic selling on Wall Street. This time, the markets may be right, as even the most hawkish FOMC members are questioning whether additional tightening will be required.
The danger is that investors are interpreting the message of peak rates not simply as the end of rate hikes but also the start of a rate cutting cycle. It can be argued that markets are somewhat less optimistic about the growth outlook than the Fed is. Although the strong gains in the stock market this year and particularly since the November meeting would suggest otherwise, it’s worth noting here that when excluding the Magnificent 7 from the equation, Wall Street’s performance hasn’t been that impressive.
Inflation is falling, but for how long?
But what about the data? The latest inflation figures have been encouraging. Headline CPI fell for the first time in four months in October, hitting 3.2%, and core CPI eased too. The Fed’s preferred core PCE measure has also continued to come down. With oil prices taking a tumble lately, there’s not a significant risk of energy costs driving up inflation again over the coming months. But the progress in bringing down inflation is slowing and may even stall before the 2% target is met. One worry is that services inflation may become sticky.
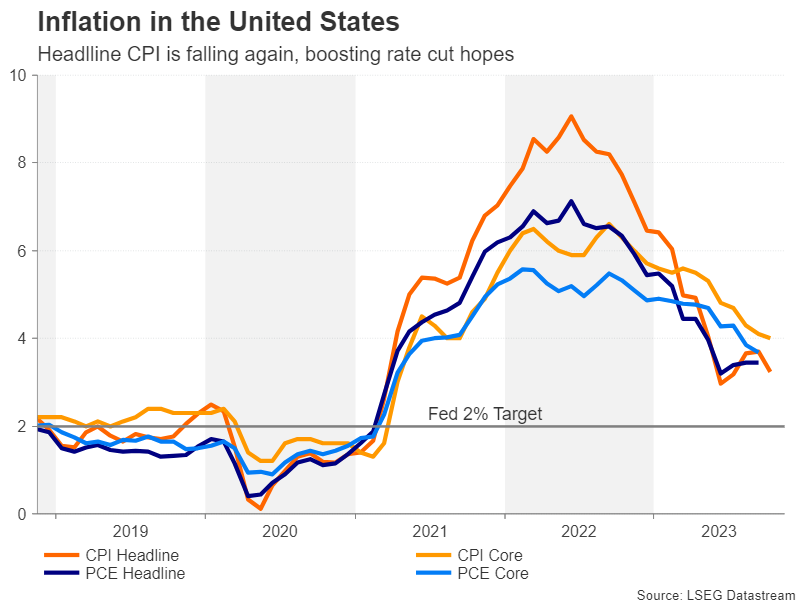
Looking at other indicators such as the weakness in global manufacturing and growing evidence that the US labour market is finally cooling, the risks to inflation seem tilted to the downside. Jobless claims have been steadily rising over the last few weeks and wage pressures are moderating too.
Markets think the Fed will cut rates by 100bps in 2024
All this has prompted investors to price in almost one full percentage point of rate cuts next year, sending Treasury yields sharply lower. The 10-year yield has plummeted from a high of 5.02% in October to around 4.45% currently. The more than 50-basis-points drop in a single month weakens the argument that tighter financial conditions are doing the job of additional rate hikes by the Fed and the minutes may well stress that point.
If policymakers talk up the economy in the minutes and remain unconvinced about inflation returning to the 2% target within a reasonable timeframe, investors may pare back some of their rate cut bets, especially in the absence of any top tier data during what is expected to be a quieter trading period due to the Thanksgiving break on Thursday.
Dollar could get volatile during holiday week
In such a scenario, the dollar may reverse higher, reclaiming its 50-day moving average against the yen in the 149.50 region and attempt to surpass November’s one-year peak of 151.92.
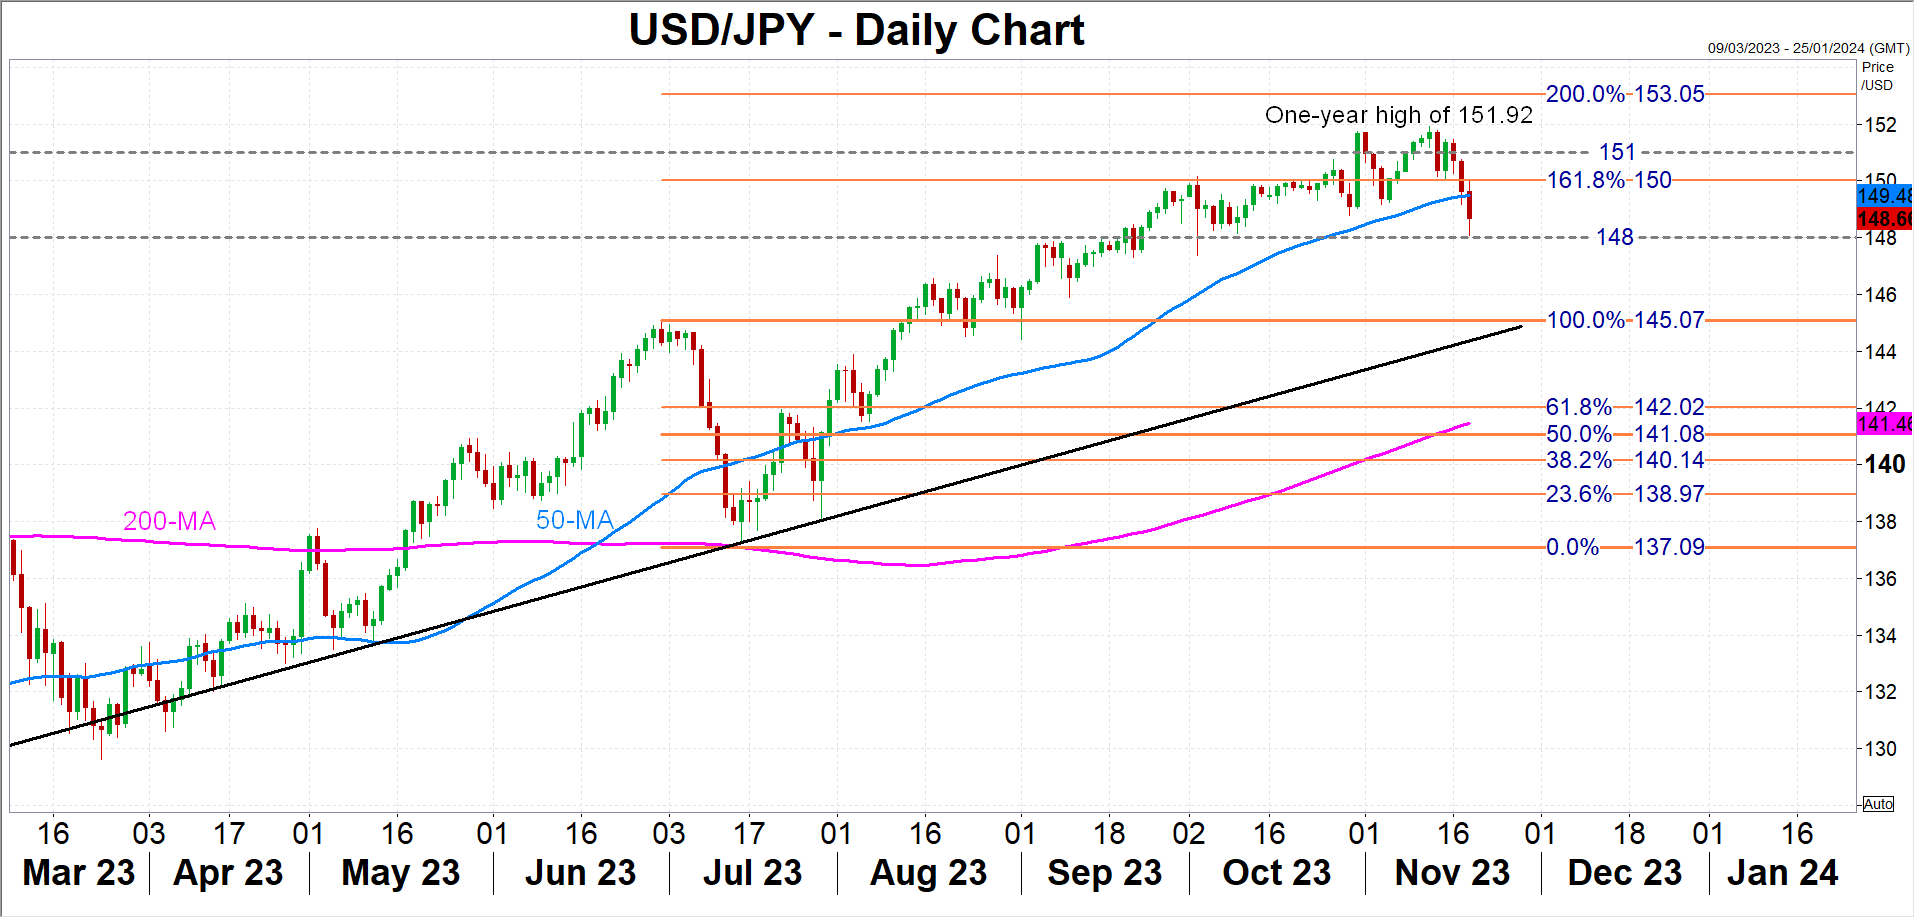
However, if the minutes strike a neutral tone, this would be seen as endorsing the market pricing for rate cuts, potentially pulling the dollar below the 148.00 yen level and towards the June top near 145.00.
On the data front, traders will be keeping an eye on October durable goods orders as well as the latest weekly jobless claims on Wednesday, while on Friday, attention will turn to S&P Global’s flash PMI estimates for November.
WTI Wave Analysis
- WTI reversed from pivotal support level 74.00
- Likely to rise to resistance level 80.00
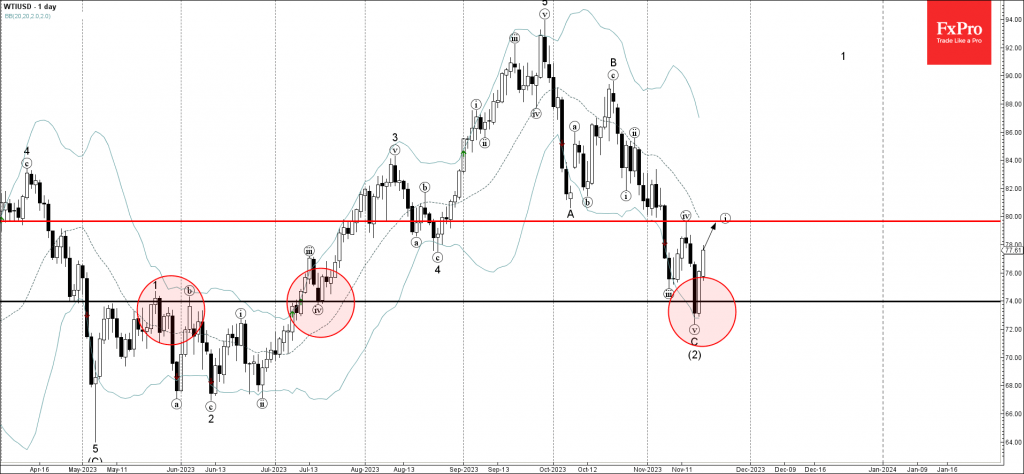
WTI crude oil recently reversed up from pivotal support level 74.00 (former resistance from May and June) intersecting with the lower daily Bollinger Band.
The upward reversal from the support level 74.00 created the daily Japanese candlesticks reversal pattern Piercing Line, which stopped the previous medium-term ABC correction (2).
Given the strength of the support level 74.00, WTI crude oil can be expected to rise toward the next resistance level 80.00 , the target for the completion of the active impulse wave i, top of the previous correction iv.
CADJPY Wave Analysis
- CADJPY reversed from the long-term resistance level 110.30
- Likely to fall to support level 107.50
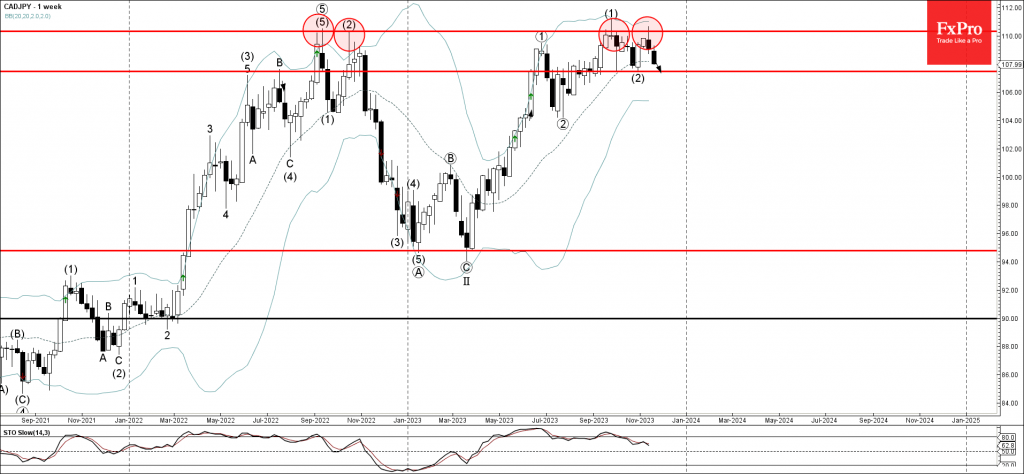
CADJPY currency pair recently reversed down from the long-term resistance level 110.30 (former yearly high, Double Top from last year) strengthened by the upper weekly Bollinger Band.
The downward reversal from the resistance level 110.30 stopped the previous medium-term impulse wave (3).
Given the strength of the resistance level 110.30 and the strongly bearish CAD sentiment seen across the FX markets today, CADJPY currency pair can be expected to fall toward the next support level 107.50 (low of the previous correction (2)).
CHFJPY Retreats After Hitting New Record High
- CHFJPY climbed to new record highs last week
- But got rejected and has retreated a little since
- Overall trend remains overwhelmingly positive
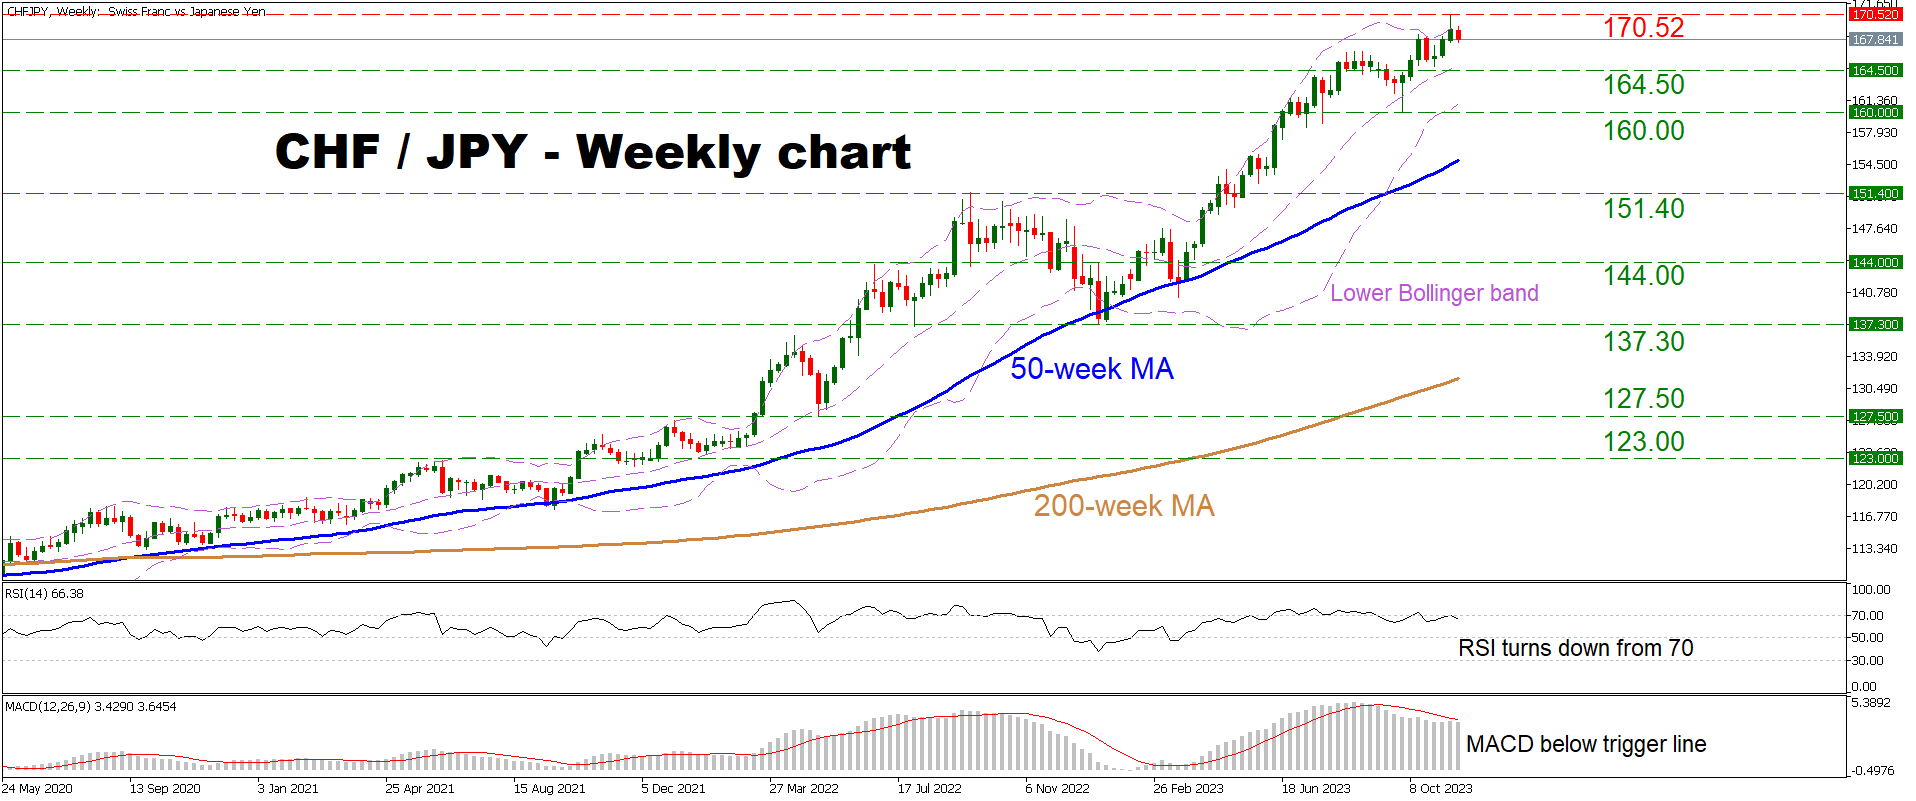
CHFJPY rose to its highest levels in at least four decades last week, since official records began. The price hit a new record peak of 170.52 and subsequently retreated, but not dramatically. Overall, the long term structure of higher highs and higher lows remains intact, keeping the pair in a clear uptrend.
Weekly oscillators suggest that upside momentum is losing steam, reflecting the latest pullback in the market. The RSI has turned down after it reached its overbought levels near 70, while the MACD has flattened below its red trigger line.
In case buyers take back control and pierce above the record high of 170.52, that would take the price into uncharted territory and turn the focus to round psychological numbers where traders might place their stops, providing resistance to advances. In this sense, the levels to watch would be 175.00 initially, and beyond that, the 180.00 region.
Now should sellers stay in charge, the first obstacle to the downside might be the 164.50 zone, which has acted both as support and resistance in recent months. If violated, the spotlight would then shift to the 160.00 area, which halted the retreat in early October.
Summarizing, the long term outlook remains clearly positive. A decisive break below 160.00 is needed to bring that into doubt, although a trend reversal would require much heavier declines than that.
GER 40 Index Shows Signs of Exhaustion
- German 40 index takes a breather after dynamic rally
- Selling pressures expected to intensify below 15,800
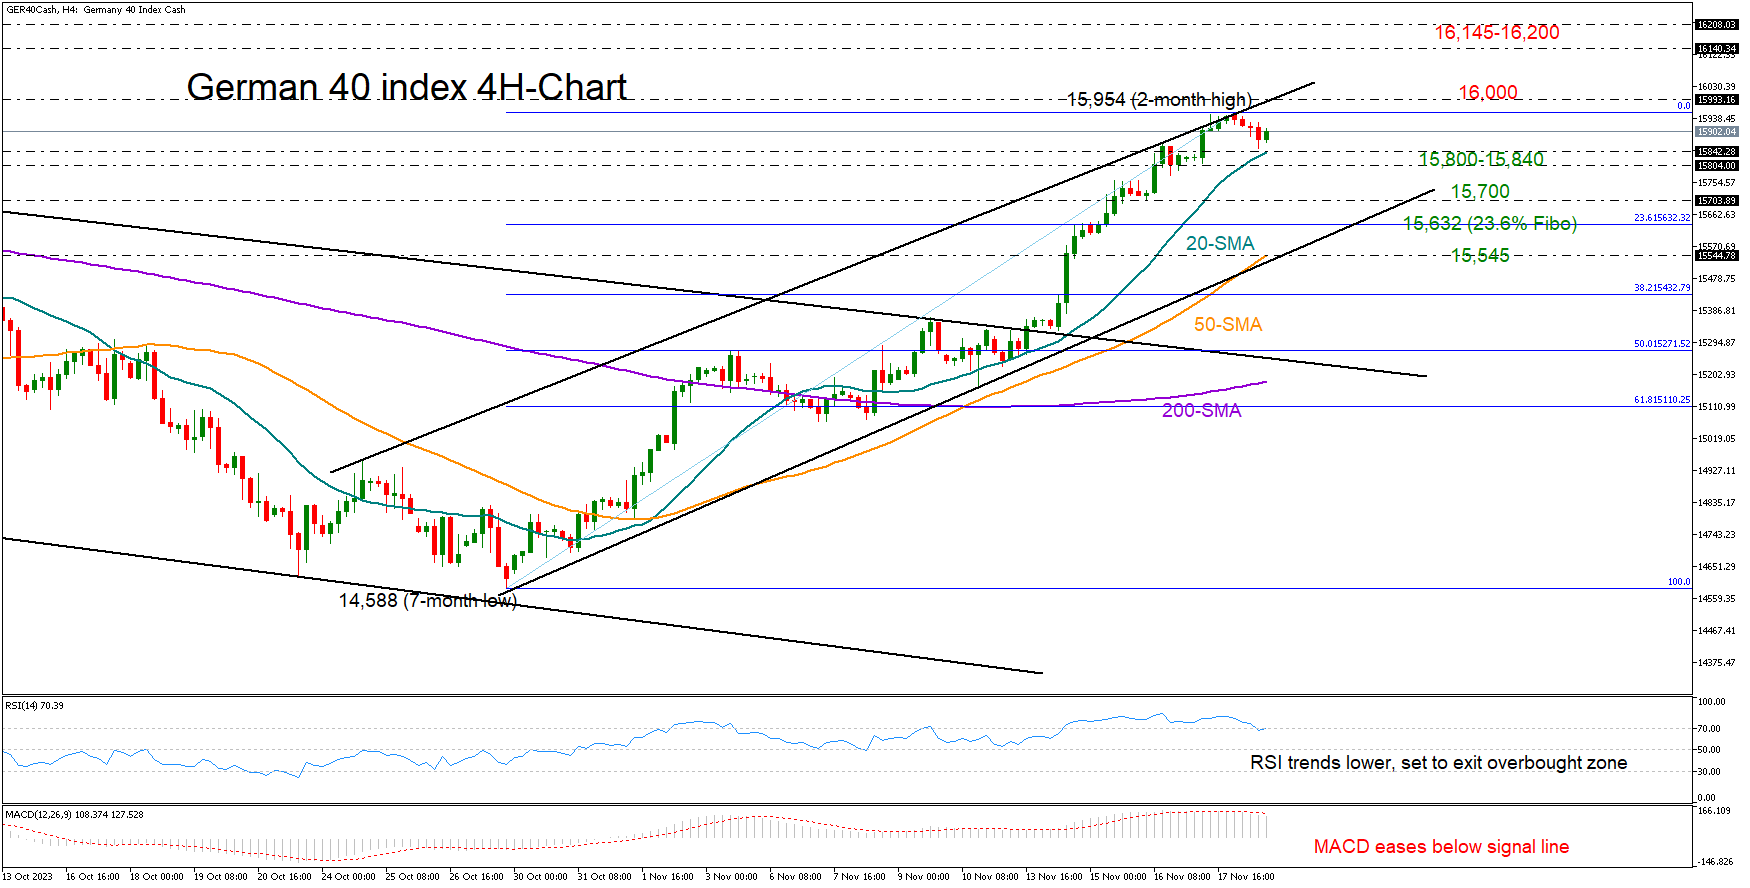
The German 40 index (cash) marked a three-week bullish streak, running from seven-month lows to a two-month high of 15,954.
The index has recouped more than half of the August-October downtrend, but the falling RSI, which seems to have topped in the overbought region in the four-chart, is warning that the latest downturn might be at an early stage. Note that the price could not overcome the 16,000 bar, which has been repeatedly blocking the way higher throughout the year.
Whether the bears will retake control might depend on the 15,800-15,840 region, which includes the 20-period simple moving average (SMA). If that floor cracks, the index could slide immediately towards the 15,700 constraining zone, while slightly lower, the 23.6% Fibonacci retracement of the latest upleg could halt steeper declines at 15,632. A break below the 50-period SMA and the tentative support trendline drawn from October’s low could be a bigger threat at 15,545.
In the opposite case, where the price successfully pierces through the former bar of 16,000 and exits the bullish channel on the upside, it may head towards the 16,145-16,200 restricted area. There might be another hurdle within the 16,280-16,335 territory, where the market peaked several times from November 2021 onwards.
To sum up, the latest downside correction in the German 40 index could face some continuity, as the latest bullish action seems overdone. The confirmation signal is expected to come below 15,800.
Sunset Market Commentary
Markets
In a calm day for markets, UK prime minister Rishi Sunak’s speech (see below) stood out. In no way it resembles anything like his predecessors Truss and Chancellor Kwarteng announced in their September 2022 mini-budget but it did trigger some minor, temporary underperformance of UK gilts shortly after. Yields in the country in the meantime add between 0.9 and 2.8 bps, in line with the 1.2-3.6 bps in Germany and 1.2-2.3 bps in the US. Both try to build on an intraday U-turn that happened during Friday’s dealings and which was supported by an unexpected pickup in housing starts and building permits. Either way, it doesn’t change market pricing about the timing for a first, full 25 bps rate cut for all three major central banks. Such market enthusiasm makes the likes of ECB Wunsch uncomfortable. In a Bloomberg interview, he said that rates should stay unchanged at the December and January meeting because of favourable developments in inflation. But to completely rule out further hikes is a too optimistic view. He added that betting on rate cuts turns policy not as restrictive as the ECB aims it to be, increasing the risk that “you have to correct in the other direction”. In the European periphery, bonds are rallying but with no particular outperformance of Italian BTPs following Moody’s decision to leave the rating at Baa3 and even lifting the outlook to stable from negative. Italian as well as Greek spreads decline by 4 bps. Portugal also sheds 4 bps. Moody’s here raised the rating two notches from Baa2 to A3.
The dollar extends a recent slide in currency markets. The trade-weighted index has tested the 50% retracement on the rally (103.46) since this summer but prevents a break for now. EUR/USD (1.0926) rose towards the 1.0945-1.096 resistance area but here too there’s not enough momentum to force something. USD/JPY dropped further south of 150 (148.54) in what is probably a bit of relief for BoJ and MinFin officials in Japan. EUR/GBP in the Asian open this morning briefly rose to a new correction high before the failed break triggered a kneejerk reaction to an intraday low of 0.874. The pair is currently holding back north of 0.876 though, extending its journey above 0.8735 support (50% recovery on the Feb-Aug decline). The Norwegian krone is performing strong (EUR/NOK 11.73) as oil prices rebound >2%, extending Friday’s short covering triggered by an article ran by the Financial Times. The British newspaper citing sources familiar with the matter reported that Saudi Arabia is planning to extend its 1mln voluntary output curb at least until the spring. Brent is trading around $82.37/b.
News & Views
German Vice-Chancellor and economy minister Habeck warned that last week’s constitutional court ruling is a major economic blow with households and companies at risk of ending up with higher power costs. The German court ruled that is was illegal to transfer untapped funds initially earmarked for the fallout of the Covid-19 pandemic in 2021. The money (€60bn) was wired to an off-budget Climate and Transformation Fund with a big part of it already allocated to specific investments. As the government’s debt brake kicked back in last year (excluding €100bn defense budget), Germany is only allowed to issue 0.35% of GDP of new net debt leaving the government with a significant budget hole to cover and opening a rift within the government coalition about installing a new debt brake suspension. Especially since the fallout of last week’s ruling could become even bigger as similar constructions have been used in the past for other off-budget funds as well.
UK PM Sunak paved the way for some fiscal giveaways when Chancellor Hunt delivers the UK government’s Autumn Statement on Wednesday. With inflation halved compared to the start of the week, Sunak said that the government can begin the next phase by turning attention to cutting taxes. Any reductions will be made carefully and sustainably within the framework that debt to GDP will fall in the fifth year of the forecast (key fiscal rule). The PM said that Tories will take five long-term decisions to build the economy: reducing debt, cutting tax and rewarding hard work by reforming welfare, building domestic sustainable energy, backing UK British business and delivering working class education.
Will Eurozone’s PMI Data Be Good News for Euro?
- Eurozone flash business PMI data due on Thursday 09:00 GMT
- The data might provide some relief, calm recession worries
EZ flash business PMIs to tick higher
A couple of dim US data was the key catalyst behind the euro’s 2.0% rally against the greenback last week. The common currency experienced one of its most constructive sessions so far this year, drifting as high as $1.0939, but domestic tailwinds remain absent in the euro area, making investors wonder whether the bullish trend reversal in the pair is underpinned by transitory factors.
Eurozone’s flash business PMI figures could provide fresh insight on the state of the economy on Thursday. According to the survey, business sentiment both in the manufacturing and services sectors has been in a gloom-mode since May, with the composite PMI index further easing in the contraction area to 46.5 in October.
While the previous release painted a blurry picture for Q4 after a marginal GDP contraction in Q3, analysts are now projecting that November’s readings could show some recovery. Specifically, expectations are for the manufacturing PMI index to climb moderately to 43.4 from 43.1 previously, and the services PMI index to tick up to 48.1 from 47.8 last month. Regional PMI data from Germany and France, which are the worst performing economies in the bloc, might also reveal a slight rebound when they are released ahead of the Eurozone-wide numbers.
There are some signs of business stability
Such a negligible increase would not be a game changer for the euro, but something is better than nothing. Besides, there is some evidence of economic optimism that could lead to a positive data surprise. The ZEW economic sentiment index, which tracks experts’ Eurozone outlook over the next six months, surged exponentially from 2.3 to 13.8 in November. The German index experienced a similar acceleration, turning positive for the first time since April. Although the current conditions index remained well dipped in the negative region, and a dynamic GDP growth rebound is definitely not in sight, the improvement in expectations indicates that investors are hopeful that conditions may not deteriorate further.
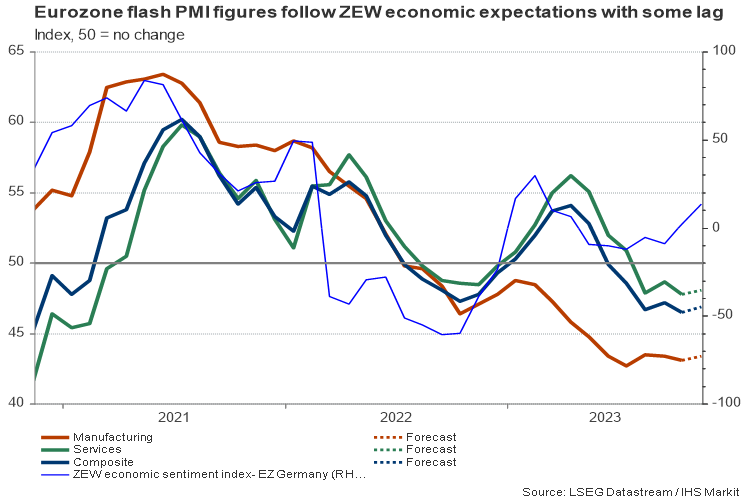
With inflation moving in the right direction in major economies, and therefore pushing additional rate increases out of the conversation, investors' morale might brighten. This is also reflected in the rocket rally the German DAX 30 index, as well as other global stock indices, staged last week.
Rate cut projections
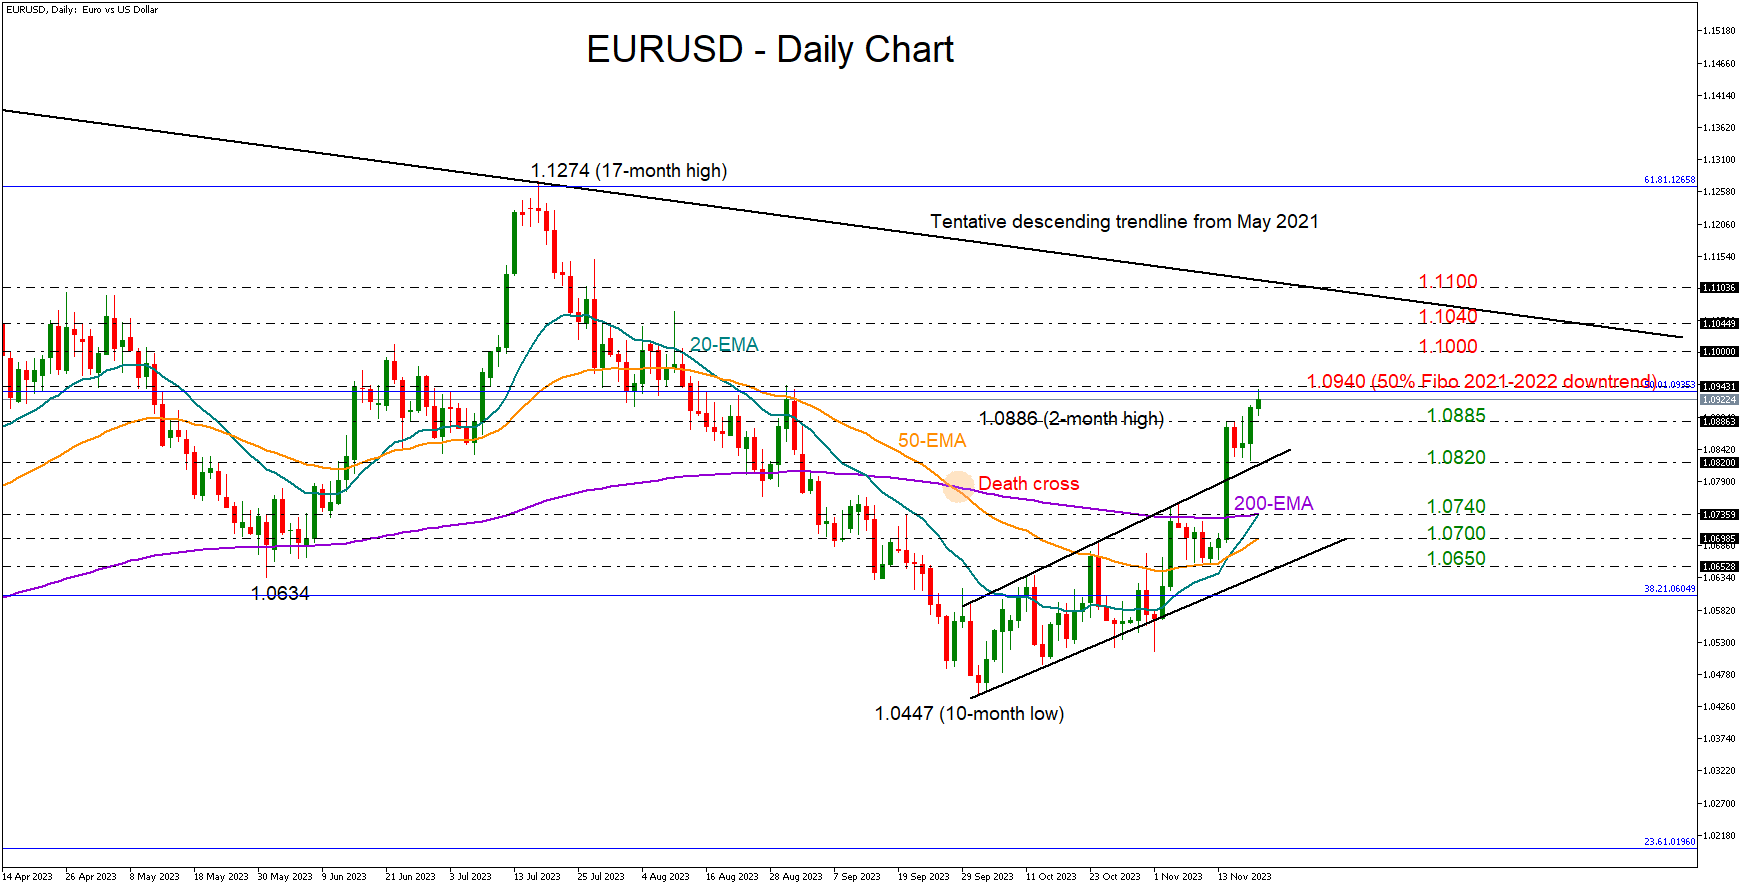
As regards the persisting rate cut projections for 2024, futures markets are pricing in 95bps of policy easing by the end of 2024 for the ECB, but a stronger-than-expected rebound in business PMI figures could create some doubts about whether such a heavy rate reduction is necessary. If that turns out to be the case, EURUSD could attract fresh buying interest. Technically, the pair needs to overcome the 1.0940 resistance to access the 1.1000-1.1040 caution zone.
If the PMI data miss expectations and the details present a continuous decline in employment demand and new orders, EURUSD could drift lower in fears the recession risks could prompt rate cuts in 2024. Sellers might wait for a close below the 1.0820 floor before pressing the price towards the 200-day exponential moving average (SMA) at 1.0740.
Nikkei225 Retreats After Touching the Peak
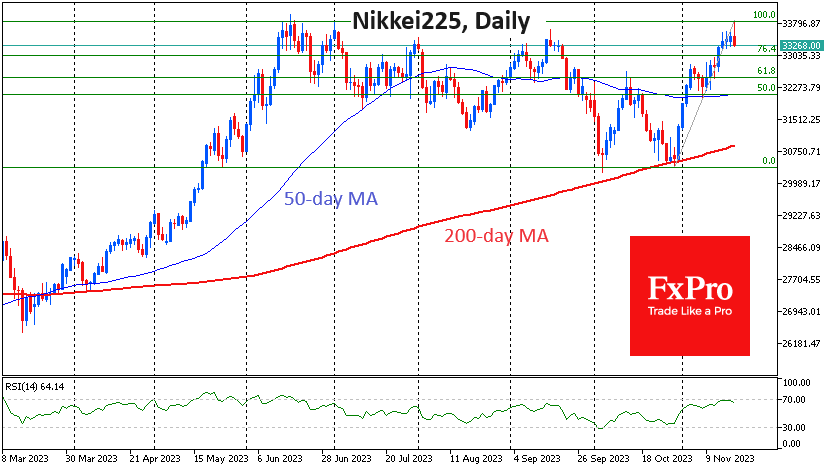
There are significant moves in the Japanese markets today. The Japanese stock market started the day with a rise of over 1%, taking the Nikkei225 to 33850. It was the second brief climb to this height since June, last seen 33 years ago. Touching the highs triggered a sharp sell-off, and the index is now down 0.6% from the day’s open, which could be the start of a broader correction or a prolonged pullback.
The Nikkei225 is behaving classically according to the laws of technical analysis on a daily timeframe. In October, the index rallied after several days of testing support at the 200-day average. The divergence between the RSI and the price also favoured the bulls.
A solid buying base was supported by a weakening Yen, which has lost 4% against the Euro and Pound since 30th October. However, while the Yen has failed to see a meaningful change in the Bank of Japan’s course, USDJPY seems to have fallen under its weight since the end of last week, and its appreciation has prompted equity traders to switch to profit-taking.
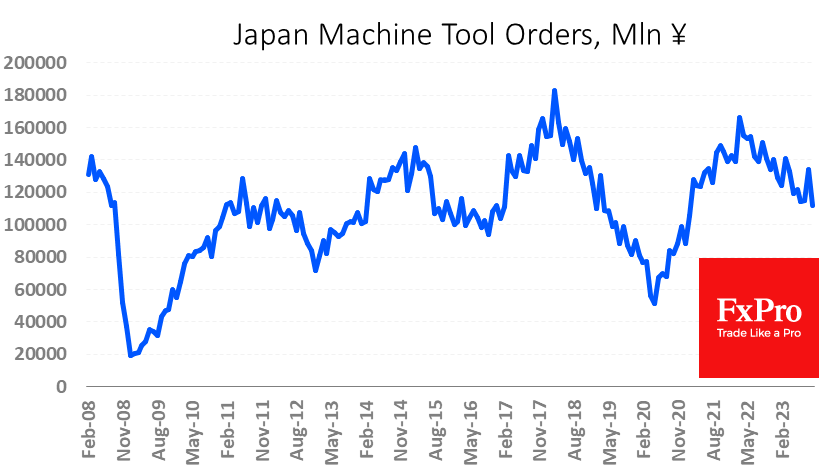
It’s also possible that, despite the yen’s previous weakness, the caution in Japan has come on the back of weak macroeconomic data. Last week, it was reported that Machine Tool Orders fell 20% y/y in October, following a 5.5% y/y decline a year earlier. The weak yen also appears to be hurting the broader economy, as GDP contracted by 0.5% in the third quarter. The economy fails to benefit from a weaker yen while facing rising import costs.
The technical reason for the sell-off in equities was the fresh wave of Yen strength since the morning. The USDJPY shows signs of breaking out of its uptrend as it dips below its 50-day moving average.
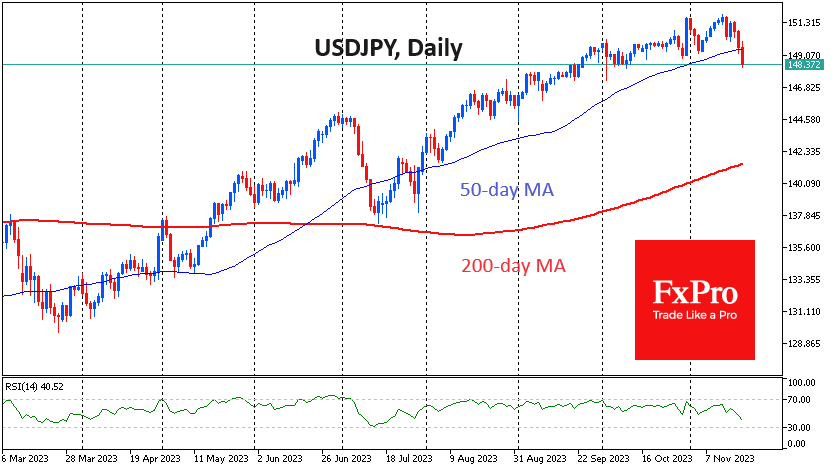
The Nikkei 225 has seen a sharp reversal of 1.6% from its intraday high as it hit overbought levels on the RSI. If the stock market declines continue, our attention will turn to the momentum around the 33000 and 32500 levels, which are the 76.4% and 61.8% Fibonacci retracement lines of the 76.4% and 61.8% rally from late October, respectively.
If the Japanese market’s decline does not stop there, the bulls’ last hope is at 32000 (50-day average) and 31000 (200-day average). Failure to break below these will mean a transition to a downtrend.
EUR/USD Mid-Day Outlook
Daily Pivots: (S1) 1.0855; (P) 1.0884; (R1) 1.0944; More...
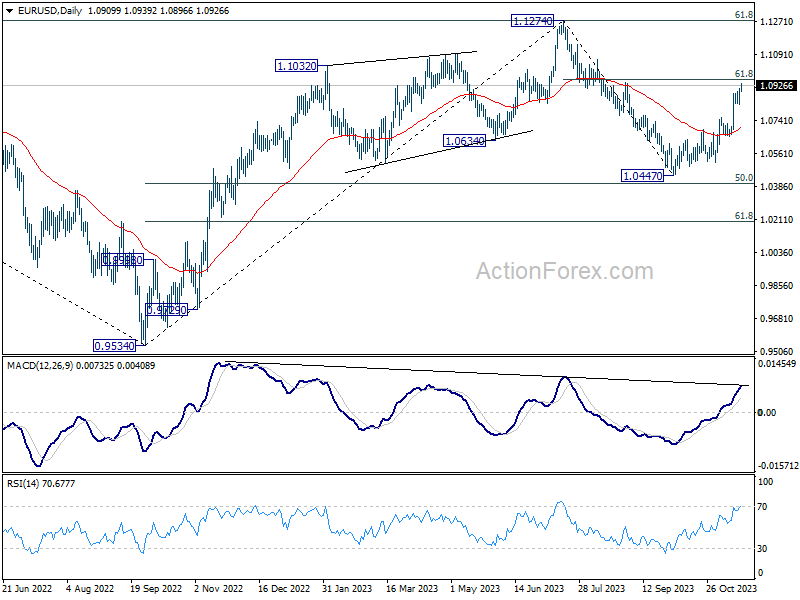
Intraday bias in EUR/USD remains on the upside for the moment. Current rally from 1.0447 is in progress for 61.8% retracement of 1.1274 to 1.0447 at 1.0958. Sustained break there will pave the way to retest 1.1274 high. On the downside, below 1.0823 minor support will turn intraday bias neutral and bring consolidations first.
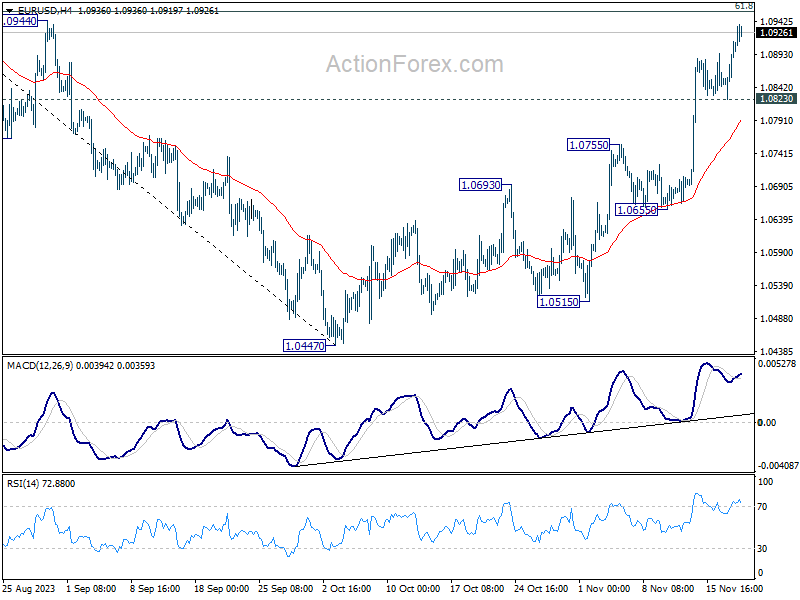
In the bigger picture, price actions from 1.1274 are viewed as a corrective pattern to rise from 0.9534 (2022 low). Rise from 1.0447 is tentatively seen as the second leg. Hence while further rally could be seen, upside should be limited by 1.1274 to bring the third leg of the pattern.