Sample Category Title
Forex and Cryptocurrencies Forecast
EUR/USD: November 14 - a Dark Day for the Dollar
In the previous review, the overwhelming majority of experts expressed opinions favouring further weakening of the American currency. This prediction came to fruition. The Consumer Inflation report in the United States, published on Tuesday, November 14, toppled the Dollar Index (DXY) from 105.75 to 103.84. According to Bank of America, this marked the most significant dollar sell-off since the beginning of the year. Naturally, this had an impact, including on the dynamics of EUR/USD, which marked this day with an impressive bullish candle, rising nearly 200 points.
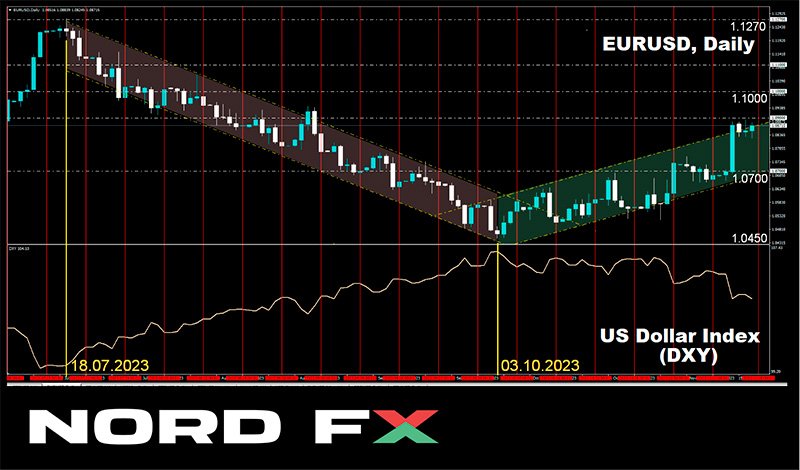
It is noteworthy that exactly a year ago, after the release of data on October inflation, U.S. bond yields plummeted, stock indices soared, and the dollar significantly declined against major world currencies. And history repeated itself. This time, the Consumer Price Index (CPI) in the U.S. for October decreased from 0.4% to 0% (m/m), and on an annual basis, it dropped from 3.7% to 3.2%. The Core CPI for the same period decreased from 4.1% to 4.0%: the lowest level since September 2021.
In reality, a 0.1% drop in inflation is not that significant. However, the market's strong reaction demonstrated how overbought the dollar was. As analysts at ING (Internationale Nederlanden Groep) write, a powerful bullish trend in Q3 this year led to a 4.9% increase in the dollar. Keeping the dollar strong was easy due to the high interest rates and increased yields of U.S. Treasury bonds.
But everything comes to an end at some point. The data released on November 14 confirmed the weakening of inflationary pressure and convinced the market that the Federal Reserve (FRS) would no longer raise the key interest rate. Moreover, market participants now do not rule out that the regulator may shift to easing its monetary policy not in the middle of next summer but as early as the spring of the following year. ING economists believe that the onset of a recession in the U.S. will compel the FRS to cut the rate by 150 basis points in Q2 2024. According to MUFG Bank, the probability of a rate cut in May 2024 is now 80%, in March – 30%. Such a reduction will halt the dollar's bullish rally, support so-called commodity currencies, and, as MUFG believes, EUR/USD could reach the height of 1.1500 over the next year.
As for the near-term outlook, according to Societe Generale economists, regardless of the outcomes of the Federal Reserve meeting on December 13 and the ECB on December 14, seasonal trends for the euro in the last month of 2023 are bullish. However, the dollar may be supported by weak growth rates in the Eurozone. Germany's economy is in a state of stagnation, preliminary GDP data for the Eurozone showed a decline of -0.1% in Q3, and the European Commission lowered the economic growth forecast for 2023 from 0.8% to 0.6%. Therefore, the euro may also come under pressure from speculation about a cut in the ECB interest rate.
EUR/USD finished the past week at the level of 1.0913. Currently, experts' opinions on its immediate future are divided as follows: 60% voted for the strengthening of the dollar, 25% sided with the euro, and 15% remained neutral. As for technical analysis, 100% of trend indicators and oscillators on D1 are coloured green, but 25% of the latter are in overbought territory. The nearest support for the pair is located around 1.0830, then 1.0740, 1.0620-1.0640, 1.0480-1.0520, 1.0450, 1.0375, 1.0200-1.0255, 1.0130, 1.0000. Bulls will encounter resistance in the area, then 1.0945-1.0975 and 1.1065-1.1090, 1.1150, 1.1260-1.1275.
Next week, on Wednesday, November 22, the minutes of the last meeting of the Federal Open Market Committee (FOMC) will be published. On Thursday, November 23, preliminary data on business activity (PMI) in Germany and the Eurozone will be released, and the following day will bring similar indicators from the U.S. Additionally, traders should take into account that on Friday in the United States, markets will close early as the country observes Thanksgiving Day.
GBP/USD: Surprise from UK CPI
The strengthening of the pound on U.S. inflation data turned out to be even greater than that of the euro. On November 14, GBP/USD rose by 240 points, from 1.2265 to 1.2505. This is good news for the British currency. However, there is also bad news: inflation in the United Kingdom is on the decline.
The Consumer Price Index (CPI) in October decreased from 0.5% to 0% (m/m) and fell from 6.7% to 4.6% on an annual basis. The Core CPI for the same period decreased from 6.1% to 5.7%. All these figures turned out to be below expectations and were a surprise not only for the market but also for British officials.
Megan Greene, a member of the Bank of England's Monetary Policy Committee, stated in an interview with Bloomberg TV on November 16 that despite the current decline in inflation, wage growth in the UK remains incredibly high, and labour productivity is low. These two factors complicate the movement toward the target CPI level of 2.0% and make one wonder whether the Bank of England's policy is restrictive enough. According to Megan Greene, BoE might have to stick to a restrictive policy longer than anticipated.
If inflation does not bring new surprises, it is unlikely that the Bank of England will continue to raise interest rates in the coming months. But even if it continues to keep it at the current level of 5.25%, while the Federal Reserve starts lowering rates, it will benefit the pound. However, at the moment, making any forecasts is quite challenging.
"We remain cautious for now," write economists at German Commerzbank. "One surprise does not mean everything is settled. And given the remarkable instability of inflation in the UK, there is a risk that the return to the target inflation level will be uneven. Wage data released on Tuesday also confirms this view. At the moment, the Bank of England can breathe a sigh of relief, but caution is still necessary."
GBP/USD ended the past week at the level of 1.2462. As for the median forecast of analysts for the near future, here their voices were divided equally: a third of them pointed north, a third to the south, and a third to the east. For D1 trend indicators, 90% point north, 10% to the south. All 100% of oscillators are looking up, with 15% of them signalling overbought conditions. In the event of the pair moving south, it will encounter support levels and zones at 1.2390-1.2420, 1.2330, 1.2210, 1.2040-1.2085, 1.1960, and 1.1800-1.1840, 1.1720, 1.1595-1.1625, 1.1450-1.1475. In the case of the pair rising, it will face resistance at levels 1.2500-1.2510, then 1.2545-1.2575, 1.2690-1.2710, 1.2785-1.2820, 1.2940, and 1.3140.
Events of the upcoming week in the calendar include a speech by Bank of England Governor Andrew Bailey on Tuesday, November 21. The following day will see the release of the Inflation Report and discussion of the country's budget, and on Thursday, November 23, preliminary data on business activity (PMI) in various sectors of the UK economy will be released.
USD/JPY: U.S. Treasuries Expected to Rescue the Yen
On November 13, USD/JPY reached a height of 151.90, updating a multi-month high and returning to where it traded in October 2022. However, on U.S. inflation data, the yen staged a comeback.
Unlike the U.S. CPI, macro statistics from Japan had minimal impact on the yen, though there were notable points to consider. For instance, the country's GDP in the third quarter showed a decline of -0.5% after a 1.2% growth in the previous period and a forecast of -0.1%. Against this backdrop, the head of the Bank of Japan (BoJ), Kadsuo Ueda, made a surprising statement on Friday, November 17, stating that the country's economy is recovering and is likely to continue doing so, albeit at a moderate pace.
Ueda is not certain that the weak yen negatively affects the Japanese economy. On the contrary, this weakness has a positive impact on exports and the profits of Japanese companies operating in the global market. Therefore, the head of the regulator is unsure about the order and extent to which the Bank of Japan will change its monetary policy. "We will consider ending the YCC policy and negative rates if we can expect our inflation target to be reached on a stable and sustainable basis," vaguely stated Kadsuo Ueda.
Meanwhile, Japan's Finance Minister, Sin'iti Sudzuki, stated that he is ready to take necessary measures in case of increased speculative pressure on the national currency. Deputy Minister Ryosei Akazawa supported his chief and reiterated that the government would intervene in the foreign exchange market to curb excessive volatility. The words of both officials somewhat strengthened the national currency, and on Friday, November 17, it found a local bottom at the level of 149.19. The final chord sounded slightly higher – at 149.56.
Hopes that the BoJ will eventually tighten its monetary policy continue to linger among market participants. Strategists at Danske Bank, for example, predict a decline in USD/JPY below the 140.00 mark within 6-12 months. In their view, this is primarily due to the fact that the yield of long-term U.S. bonds has peaked. "We expect that in the coming year, the yield differential will contribute to the strengthening of the Japanese yen," they write. "In addition, historical data suggest that global conditions characterized by slowing growth and inflation favor the strengthening of the Japanese yen."
Speaking of the near-term prospects for the pair, 65% of analysts expect further strengthening of the yen, while 35% anticipate a new advance of the dollar. As for the technical analysis on D1, the forecast here is maximally neutral. Both among trend indicators and oscillators, the ratio between red and green is 50-50. The nearest support level is in the zone of 149.20, then 148.40-148.70, 146.85-147.30, 145.90-146.10, 145.30, 144.45, 143.75-144.05, 142.20. The nearest resistance is 150.00-150.15, then 151.70-151.90 (October 2022 maximum), further 152.80-153.15, and 156.25.
There is no planned release of any other significant statistics regarding the state of the Japanese economy in the upcoming week.
CRYPTOCURRENCIES: When Will You Become a Bitcoin Millionaire?
According to the Wayback Machine web archive, the surge in the value of the main cryptocurrency has led to a threefold increase in bitcoin millionaires since the beginning of the year. As of November 12, their count reached 88,628, a significant jump from the 28,084 recorded on January 5. Notably, bitcoin's price rose from $16,500 to $37,000 during this period.
Now, envision the potential scenario envisioned by Galaxy Digital CEO Mike Novogratz, where digital gold could soar to $500,000 within the next five years. Could the number of millionaires surpass a million? Moreover, when the BTC rate exceeds $1 million, as forecasted by ARK Investment CEO Catherine Wood, could we also join the ranks of those possessing this coveted wealth? It's highly desired that these aspirations materialize. Now, let's delve into why they could become reality and why they might crumble into fragments.
The experts at Matrixport have identified six drivers that, in their opinion, will contribute to the emergence of a BullRally in the coming months. These are: 1) SEC approval of spot bitcoin ETFs with trading expected to commence in February-March 2024; 2) the IPO of Circle, the issuer of USDC; 3) court approval for the relaunch of the FTX exchange in December 2023, with actual resumption of operations in May-June; 4) the bitcoin network halving; 5) the implementation of EIP-4844 following the Dencun hard fork in the Ethereum blockchain in Q1 2024; 6) the potential onset of easing in the monetary policy of the US Federal Reserve by mid-2024.
Diving deeper into two of these factors, the first and the fourth: they currently play a crucial role in accelerating the accumulation of BTC by hodlers, surpassing the issuance of new coins by 2.2 times. Notably, over 57% of coins from the circulating supply have been dormant in wallets for over two years. Simultaneously, the supply from short-term holders and speculators is sharply decreasing. This dynamic creates a significant deficit in the digital gold market, propelling prices upward. Many experts anticipate that this trend will intensify significantly after the approval of spot ETFs and the 2024 halving.
According to the analytics agency Glassnode, since mid-2022, due to the decline in crypto asset prices, miners have been compelled to sell nearly all the coins they mined to cover operational expenses and payments on debts, amounting to approximately $1 billion per month. After the halving and a 50% reduction in rewards, this volume is expected to decrease to $0.5 billion. Some companies may struggle to sustain mining operations altogether. The influx of new coins is projected to drop from 81,000 to 40,500 per quarter, further amplifying the supply shortage and driving prices upward. Historical data indicates that, in the year following halvings, BTC prices surged by 460% to 7745%.
Regarding the potential influx of institutional capital upon approval of a Bitcoin spot ETF by the U.S. Securities and Exchange Commission (SEC), much has already been discussed. Let's delve into a few more forecasts. According to analysts at CryptoQuant, the overall cryptocurrency market capitalization would rapidly increase by $1 trillion in this scenario. Approximately ~1% of assets under management (AUM) from managing companies would enter the bitcoin market, potentially raising the market capitalization of digital gold by $450-900 billion. In terms of price, this suggests a short-term increase for the BTC/USD pair to $50,000-73,000.
Analysts from Bernstein predict that, in the event of bitcoin ETF approval, the asset's price could reach $150,000 by 2025. Meanwhile, their counterparts at LookIntoBitcoin advise profit-taking when the coin appreciates to at least $110,000. To determine the peak height to which BTC will rise, LookIntoBitcoin specialists calculated the so-called Terminal Price. This is computed considering various factors, including the time between bitcoin mining and spending, as well as the quantity of coins in circulation. Calculations indicate that bitcoin will reach the Terminal Price during the next bull rally, expected to conclude by the end of 2025. Looking at a longer horizon, one can explore the forecasts of Mike Novogratz and Catherine Wood for the next five to seven years (see above).
And now, a bucket of cold water poured on the hot heads of crypto optimists by analysts at JPMorgan, one of the world's largest banks. They recently released a sceptical report that scrutinizes investor expectations. The main theses are as follows: 1) The introduction of spot ETFs will only lead to a capital shift from existing investment products (such as Grayscale Bitcoin Trust) but will not generate new demand; 2) Lost SEC cases [against Ripple and Grayscale] will not increase loyalty in crypto regulation, and as the regulatory framework takes shape, the situation will only become more stringent; 3) The impact of the halving is unpredictable, as the reward reduction is already factored into the price.
So, what awaits the leading cryptocurrency? This is the question posed by Peter Schiff, the president of Euro Pacific Capital, known as the "gold bug" and a fervent critic of bitcoin. This billionaire conducted a poll on X (formerly Twitter) on the topic of when the crash of the leading cryptocurrency will occur. The majority of respondents (68.1%) believe that the asset should be bought and held. 23% of those surveyed predicted the coin's crash after the launch of spot bitcoin ETFs. Only 8.9% voted for the crash to happen before the launch of these exchange-traded funds.
Now about the current situation. Bitfinex exchange analysts warn that the price of bitcoin has reached a local maximum and may correct in the near future. According to their report, the average purchase price of BTC by short-term holders (Short-Term Holder Realized Price – STH RP) is currently at $30,380, and the difference between this figure and the current price of the asset is the highest since April 2022. Historically, this indicates that the coin's price has reached a local maximum and may correct to the STH RP level, dropping to the $30,000–$31,000 range.
Doctor Profit, an analyst, also anticipates a correction and believes that the next correction following the positive trend will bring BTC back to around $34,000. "The market is overheated right now. Correction is a matter of time," he wrote on his microblog.
On the contrary, Matrixport analysts believe that a confident breakthrough above $36,000 will push the price of the leading cryptocurrency towards the $40,000 resistance. After that, it may open the way to the $45,000 height, which could be reached by the end of 2023. "Considering the steady growth in the number of buyers during US trading hours, we can see price growth by the end of the month (and year). Santa Claus rally can start at any moment," emphasized the specialists.
Many members of the crypto community supported Matrixport's positive forecast. Analyst CrediBULL Crypto believes that BTC will soon realize an impulse that will send the coin to $40,000. Trader CryptoCon also joined the optimists. According to his calculations, BTC has room to reach $47,000. However, he believes that this level may only be reached in the summer of 2024, after which a correction to around $31,000 is possible. The active growth phase due to the halving, according to CryptoCon, is expected by the end of 2024 – the beginning of 2025.
As of the writing of this review on Friday, November 17, BTC/USD is trading at $36,380. The total market capitalization of the crypto market is $1.38 trillion ($1.42 trillion a week ago). The Crypto Fear and Greed Index has dropped from 70 to 63 points but still remains in the Greed zone.
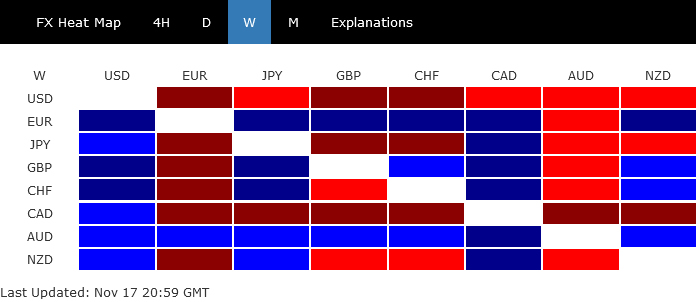
Dollar’s Descent to Intensify Amid Sustained Global Risk Appetite, Yen Reversal to Exacerbate Pressure
Dollar notably emerged as the weakest performer among global currencies last week. This decline was primarily driven by robust risk-on sentiment pervading global markets and noticeable dip in treasury yields, not just in the US but globally. A key factor influencing this trend is the growing belief among investors that most major central banks, including Fed, have already concluded their interest rate hiking cycles. Moreover, there is an increasing inclination among traders to place bets on rate cuts for the next year.
Canadian Dollar and Japanese Yen also experienced weakness, closing as the second and third worst performer. On the other end of the spectrum, Australian Dollar and Euro stood out as the top performers, closely followed by Sterling. Swiss Franc and New Zealand Dollar, meanwhile, demonstrated mixed results amid these market shifts.
A particularly intriguing aspect of last week's market activity was Japanese Yen's late surge, which coincided with a decline in global benchmark yields. This movement has sparked interest among us, particularly due to the parallel trends observed between Yen and Chinese Yuan. Should this synchronized trend continue, it could hint at a bearish turn for USD/JPY, possibly catalyzing further declines in Dollar and impacting broader market trends.
Global markets embrace optimism as interest rates seen peaked
The global financial markets last week experienced a palpable shift towards risk-on sentiment, buoyed by the growing conviction among investors that most major central banks, particularly Fed, have already reached the peak of their interest rate hiking cycles. This optimism followed the release of US CPI data, which came in below market expectations.
Despite cautionary remarks from Federal Reserve officials emphasizing the ongoing inflation fight, the central bank appears to be in a strong position to continue its pause, closely monitoring incoming data to confirm the trajectory of disinflation.
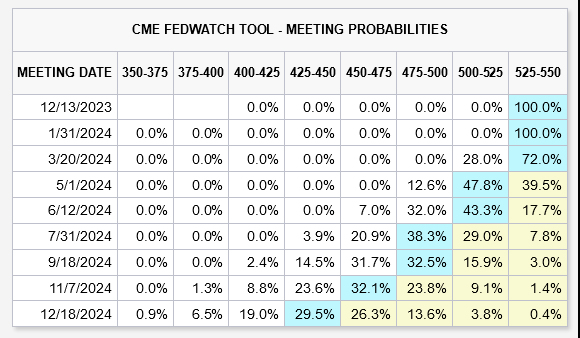
The market's interpretation of CPI data has led to a recalibration of expectations. Fed funds futures market now almost entirely rule out the possibility of even one more rate hike by Fed. In fact, traders are increasingly betting on rate cuts, with a 60% probability of the first rate cut by May and over an 80% chance by June.
However, these market expectations may be somewhat premature, considering the "last mile" in the battle against inflation, typically the most challenging phase. Core inflation rates remain stubbornly high across major economies – 4% in the US, 4.2% in Eurozone, and 5.7% in UK, indicating that inflationary pressures are still too significant to ignore.
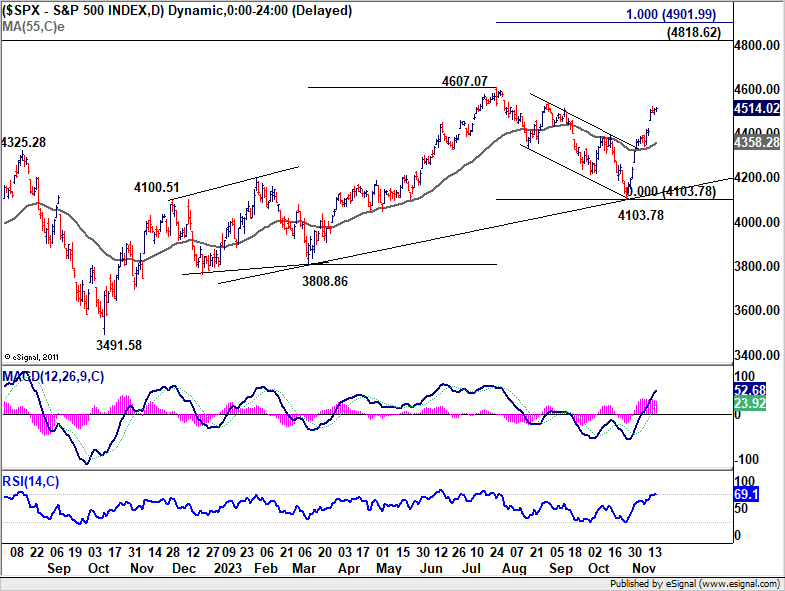
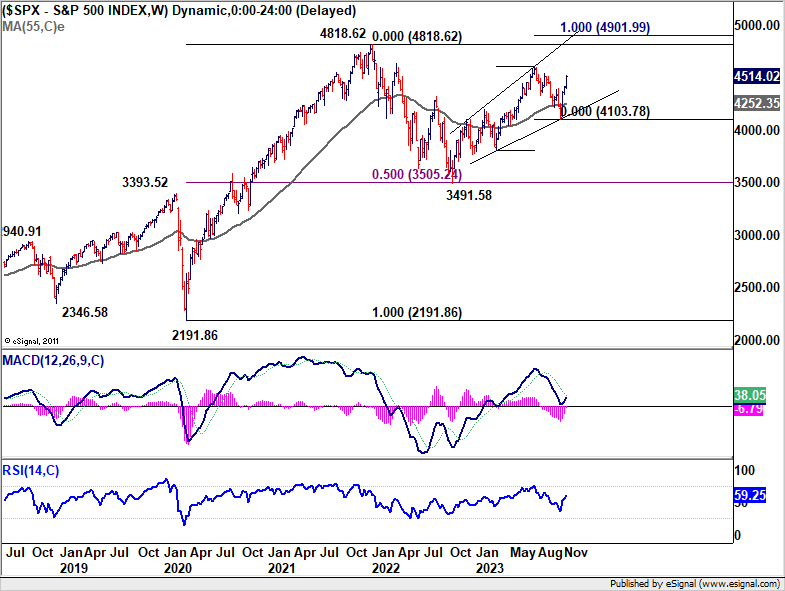
In the US, major stock indexes recorded impressive gains. S&P 500's rally from 4103.78 extended to close at 4514.02. The development affirms the case the correction from 4607.07 has completed at 4103.78 already. Retest of 4607.07 should be seen next. Decisive break there will resume the whole rise from 3491.58 to retest 4818.62 high next. This will remain the favored case as long as 55 D EMA (now at 4358.28) holds.
The critical factor going forward will be market's reaction to the resistance zone between 4818.62 and 100% projection of 3808.86 to 4607.07 from 4103.78 at 4901.99. This response will depend on various factors, including the pace of disinflation, the extent of economic deceleration, and Fed's monetary path.
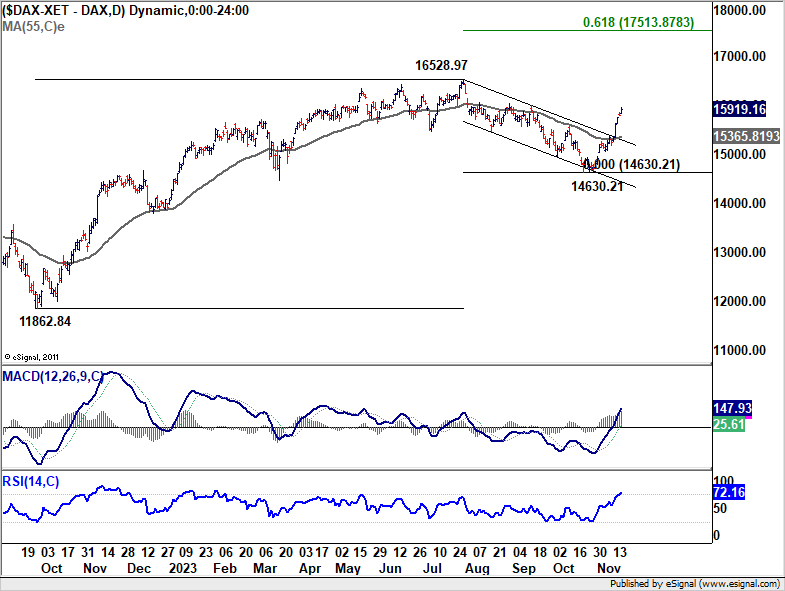
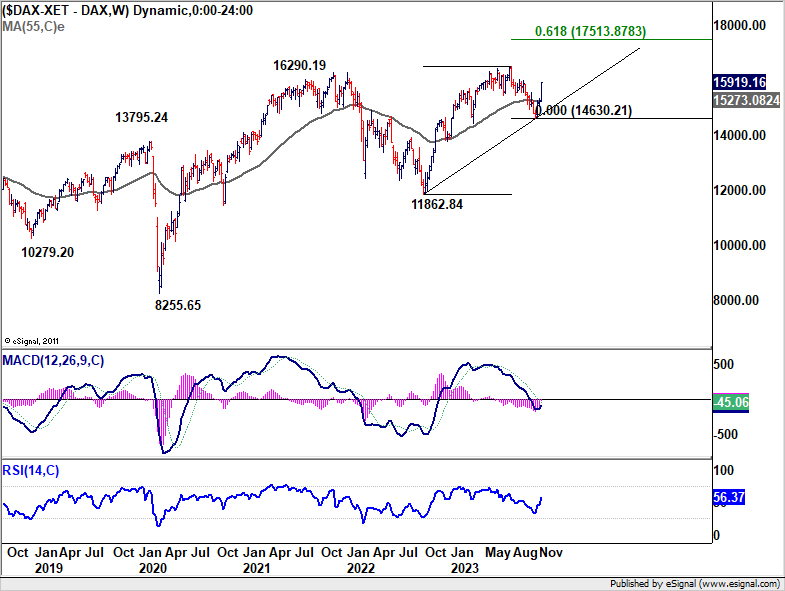
In Europe, Germany's DAX index mirrored the upbeat mood. Current development suggests that the correction from 16528.97 has completed at 14630.21 already. Near term outlook will stay bullish as long as 55 D EMA (now at 15365.81) holds. Further rise should be seen to retest 16528.97 high next. Decisive break there will resume larger up trend to 61.8% projection of 11862.84 to 16528.97 from 14630.21 at 17513.87 next.
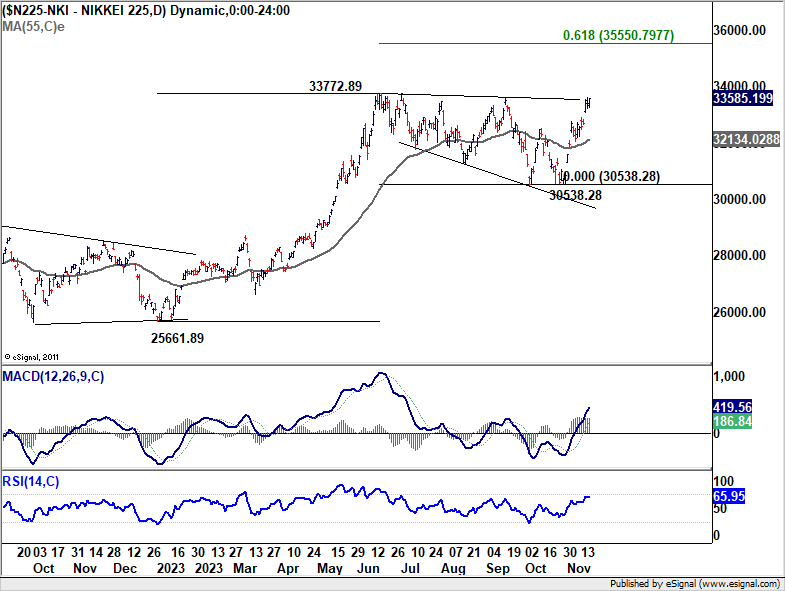
In Asia, Japan's Nikkei index closed the week on a strong note at 33585.19, inching closer to the critical 33772.89 resistance level. Decisive break there will resume the long term up trend, and pave the way to 61.8% projection of 25661.89 to 33772.89 from 30538.28 at 35550.79. In any case, near term outlook will stay bullish as long as 55 D EMA (now at 32134.02) holds.
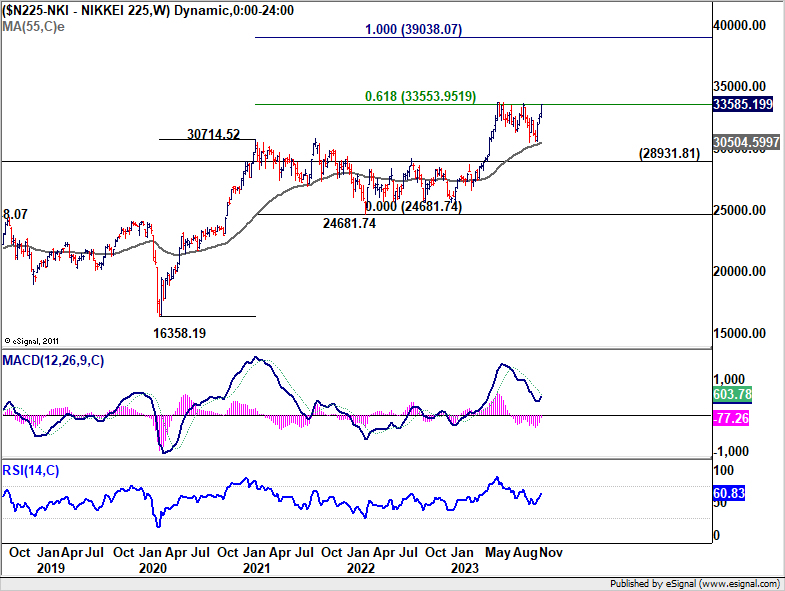
The pivotal question for Nikkei is whether it can sustain the necessary momentum to target 100% projection of 16358.19 to 30714.52 from 24681.74 at 39038.07 in the medium term, a level that is in proximity to the index's record high at 39260 made in 1990
Dollar's slide deepens amid global risk appetite and Fed expectations weigh in
US Dollar emerged as the weakest performer among major currencies, primarily influenced by the surge in risk-on sentiment, changing market expectations regarding Fed's policy path, and the notable decline in Treasury yields. These interconnected factors have collectively exerted downward pressure on the greenback.
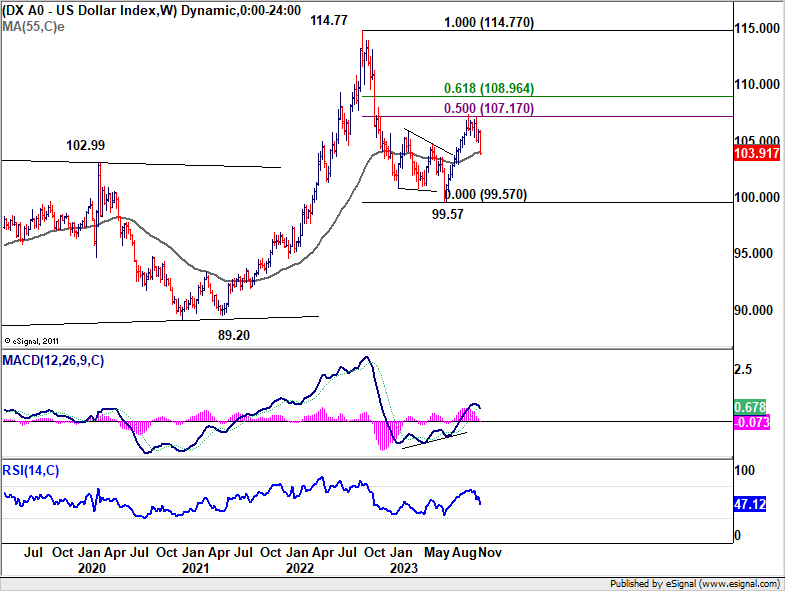
Dollar Index's fall from 107.34 extended lower to close at 103.91. Near term outlook will now stay bearish as long as 55 D EMA (now at 105.29) holds. Next target is 61.8% retracement of 99.57 to 107.34 at 102.53.Strong support could emerge from there to bring rebound.
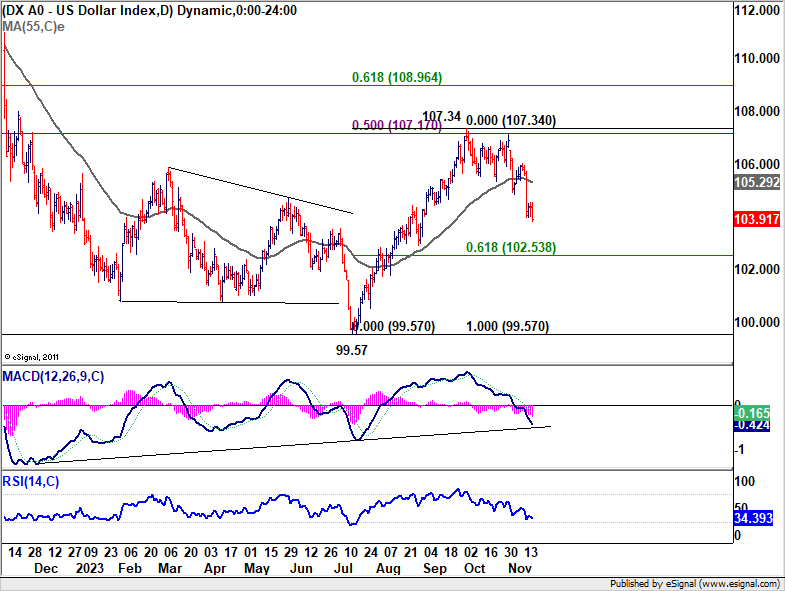
As DXY looks set to extend the near term fall even below 55 W EMA (now at 103.96), medium term outlook is turned mixed. It's uncertain for now whether fall from 107.34 is a correction to rise from 99.57, the second leg of a range pattern above 99.57, or resuming the whole down trend from 114.77 (2022 high).
Technically, firm break of above mentioned 102.53 fibonacci level could tile the favor to the latter two bearish scenarios. That would also depend heavily on largely on how global risk sentiment plays out, including S&P 500's reaction to the resistance between 4800/4900 as mentioned above.
Tracing the parallel paths of USD/CNH and USD/JPY
While Japanese Yen position in the weekly performance table isn't impressive, it's late rebound , particularly against Dollar, is an interesting development to note. The move aligned with the extended decline in global benchmark yields, including US and German 10-year treasury yields, which have reached their lowest levels in more than two months.
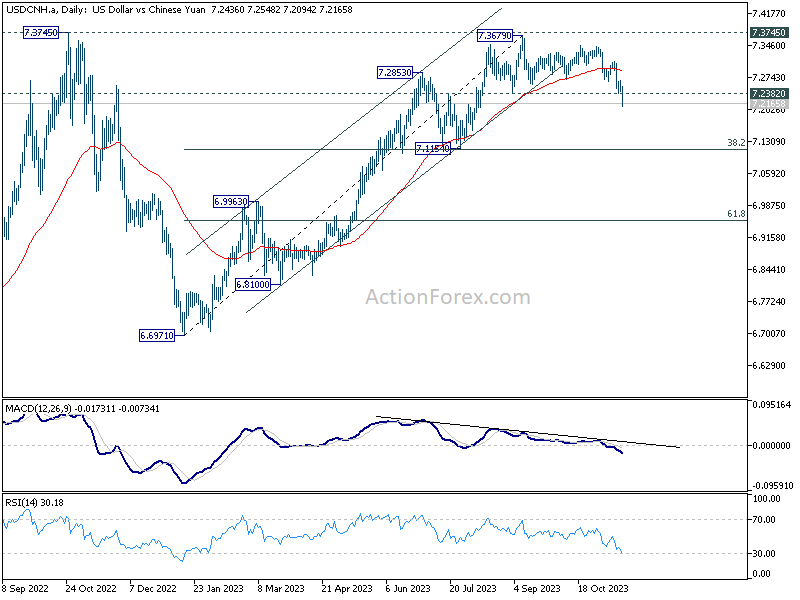
A comparative analysis of USD/JPY and USD/CNH reveals a striking parallel in their recent market behavior. Both currency pairs exhibited similar trends, peaking in October 2022, hitting a low in January 2023, and then showing a gradual recovery.
USD/CNH appears to have peaked already in September, after failing to break through 2022 high at 7.3745. Last week's break of 7.2382 support should have confirmed medium term topping at 7.3679, on bearish divergence condition in D MACD. Deeper fall is now expected to 7.1154 cluster support (38.2% retracement of 6.6971 to 7.3679 at 7.1117).
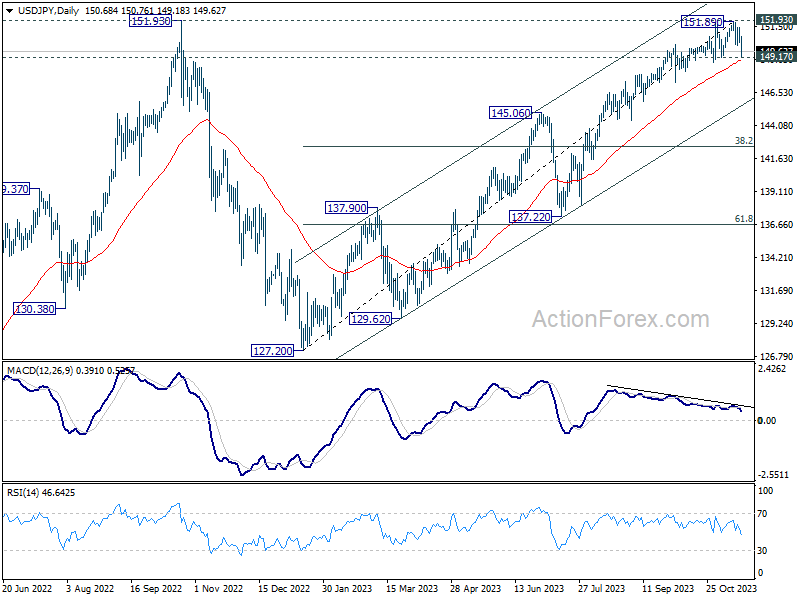
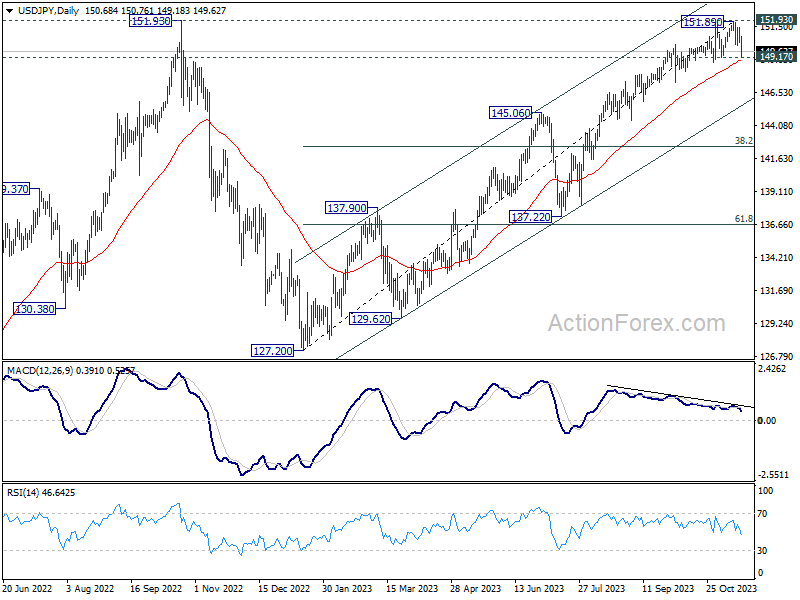
If these two Asian currencies continue to mirror each other's movements, it is plausible that USD/JPY will follow suit, breaking through the near-term support at 149.17 soon. Such a move would confirm topping at 151.89, following rejection at the crucial 151.93 resistance. The ensuing decline would then extend to 145.06 resistance-turned-support or even deeper to 38.2% retracement of 127.20 to 151.89 at 142.45.
Should this bearish scenario for USD/JPY unfold, it could exert additional downward pressure on the Dollar index, potentially accelerating its decline.
EUR/USD Weekly Outlook
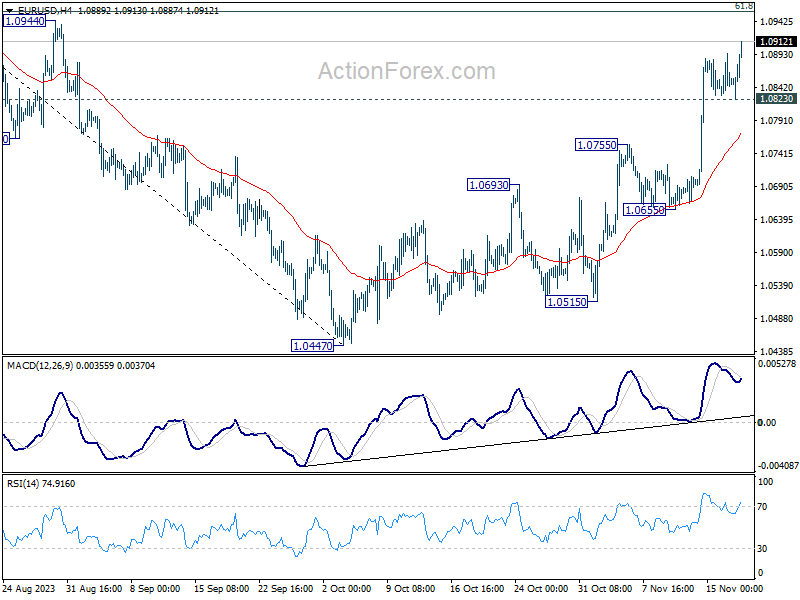
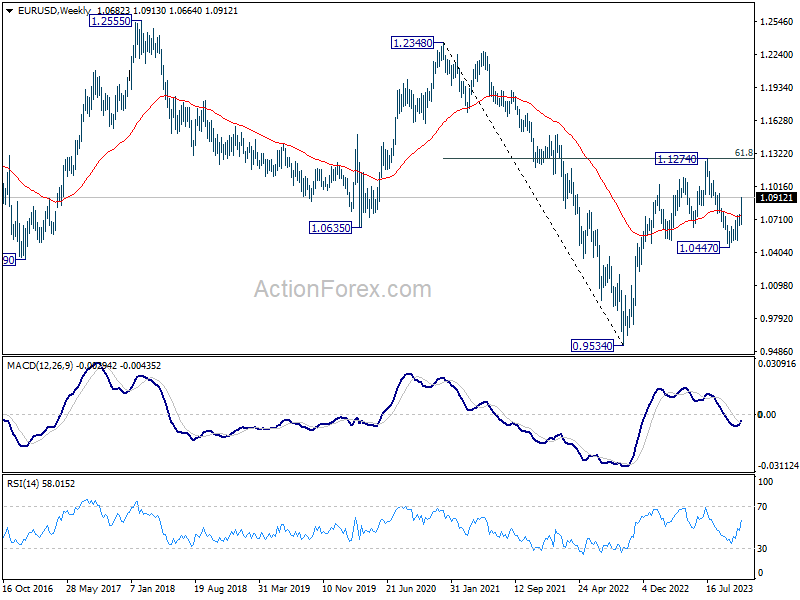
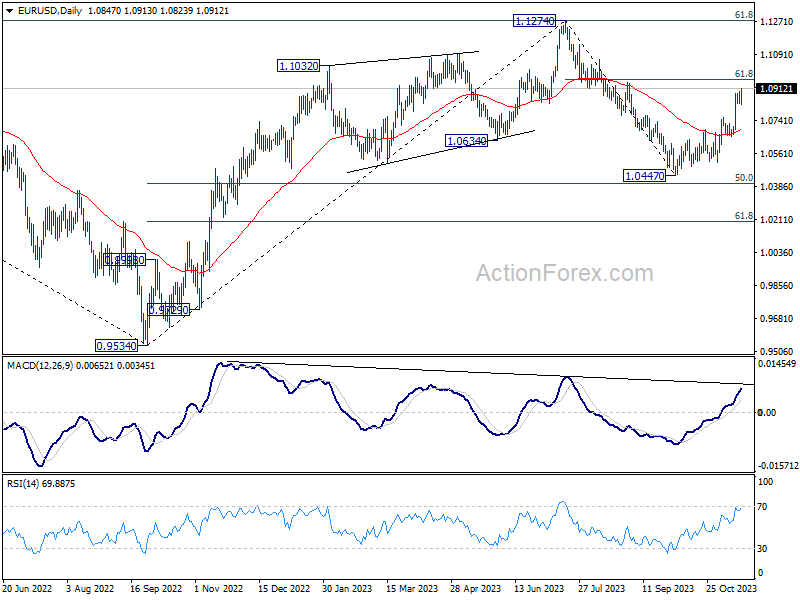
EUR/USD's rise from 1.0447 resumed last week and hit as high as 1.0913 despite interim setback. Initial bias is now on the upside this week for 61.8% retracement of 1.1274 to 1.0447 at 1.0958 next. Firm break there will pave the way to retest 1.1274 high next. On the downside, below 1.0823 minor support will turn intraday bias neutral and bring consolidations first.
In the bigger picture, price actions from 1.1274 are viewed as a corrective pattern to rise from 0.9534 (2022 low). Rise from 1.0447 is tentatively seen as the second leg. Hence while further rally could be seen, upside should be limited by 1.1274 to bring the third leg of the pattern.
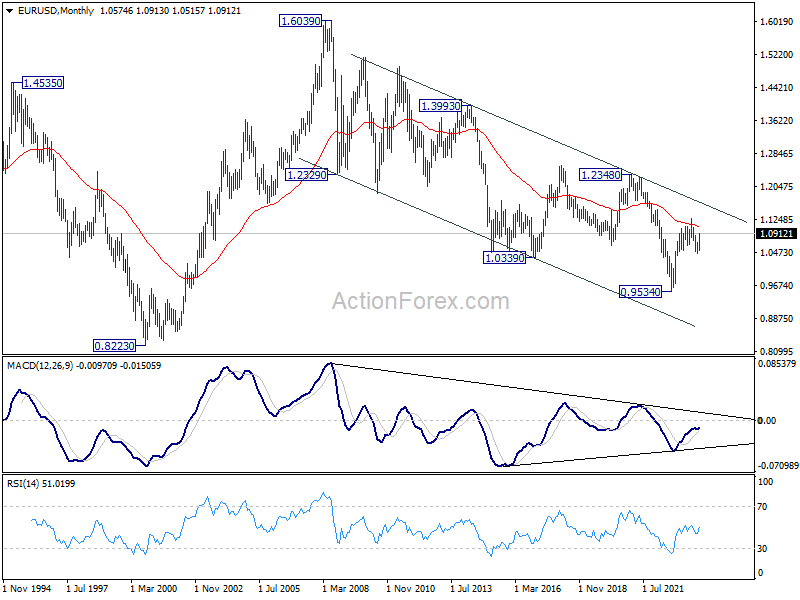
In the long term picture, a long term bottom is in place at 0.9534 on bullish convergence condition in M MACD. it still early to call for bullish trend reversal is still staying inside falling channel. Nevertheless, sustained trading above 55 M EMA (now at 1.1081) and break of 1.1274 resistance will raise the chance of reversal and target 1.2348 resistance for confirmation.
EUR/USD Weekly Outlook
EUR/USD's rise from 1.0447 resumed last week and hit as high as 1.0913 despite interim setback. Initial bias is now on the upside this week for 61.8% retracement of 1.1274 to 1.0447 at 1.0958 next. Firm break there will pave the way to retest 1.1274 high next. On the downside, below 1.0823 minor support will turn intraday bias neutral and bring consolidations first.
In the bigger picture, price actions from 1.1274 are viewed as a corrective pattern to rise from 0.9534 (2022 low). Rise from 1.0447 is tentatively seen as the second leg. Hence while further rally could be seen, upside should be limited by 1.1274 to bring the third leg of the pattern.
In the long term picture, a long term bottom is in place at 0.9534 on bullish convergence condition in M MACD. it still early to call for bullish trend reversal is still staying inside falling channel. Nevertheless, sustained trading above 55 M EMA (now at 1.1081) and break of 1.1274 resistance will raise the chance of reversal and target 1.2348 resistance for confirmation.
USD/JPY Weekly Outlook
USD/JPY failed to break through 151.93 key resistance last week, and fell sharply since then. But downside is contained by 149.17 support so far. Initial bias remains neutral this week first. On the downside, firm break of 149.17 will be a sign of bearish reversal and bring deeper fall to 147.28 support first. Nevertheless, strong bounce from current level will retain near term bullishness. Firm break of 151.93 will resume larger up trend.
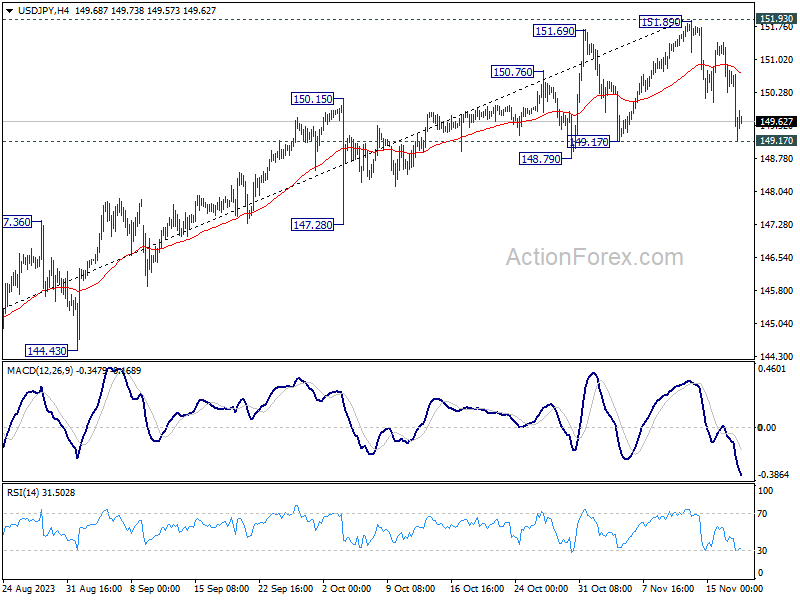
In the bigger picture, focus stays on 151.93 resistance (2022 high). Rejection by 151.93, followed by sustained break of 145.06 resistance turned support will argue that rise from 127.20 has completed, and turn outlook bearish for 137.22 support and below. However, sustained break of 151.93 will confirm resumption of long term up trend.
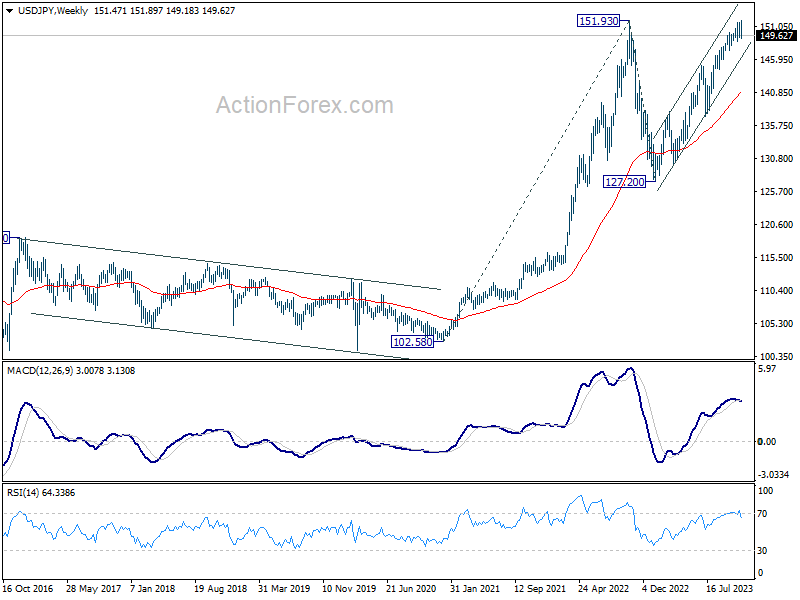
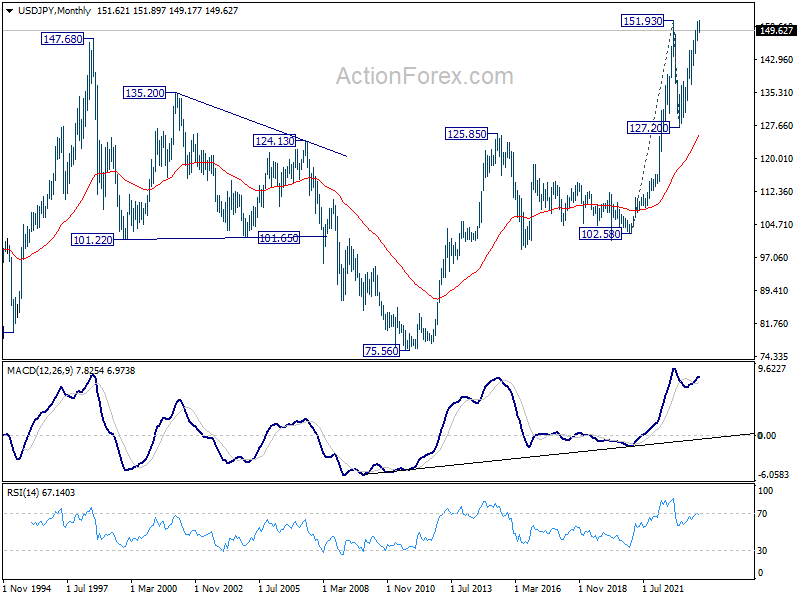
In the long term picture, up trend from 75.56 (2011 low) is still in progress. Next target will be 61.8% projection of 102.58 to 151.93 from 127.20 at 157.69. This will remain the favored case as long as 127.20 support holds.
GBP/USD Weekly Outlook
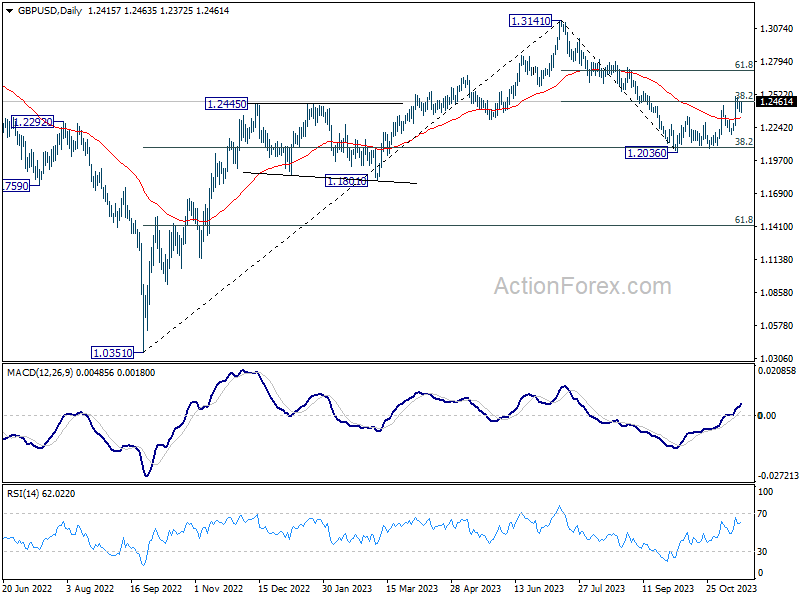
GBP/USD's rebound from 1.2036 resumed last week and hit 1.2504. But subsequent retreat suggests that a temporary was formed. Initial bias remains neutral this week for more consolidations. Deeper retreat cannot be ruled out but downside should be contained by 55 4H EMA (now at 1.2345) to bring rebound. On the upside, break of 1.2504 will resume the whole rebound from 1.2036. Sustained trading above 38.2% retracement of 1.3141 to 1.2036 at 1.2458 will pave the way to 61.8% retracement at 1.2716.
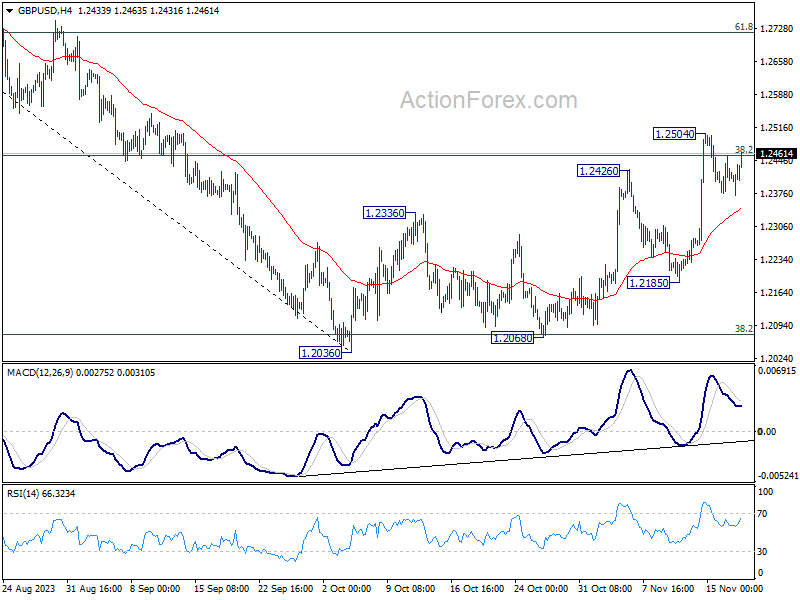
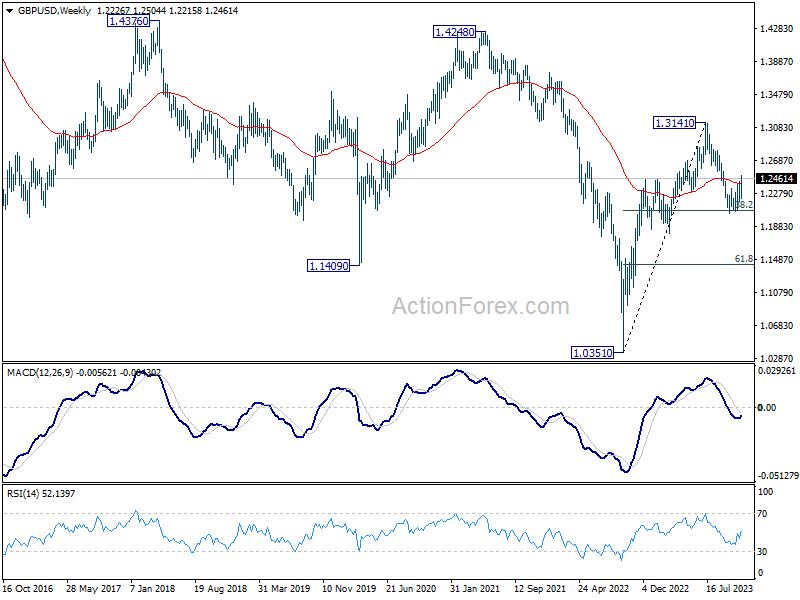
In the bigger picture, price actions from 1.3141 are seen as a corrective pattern to rise from 1.0351 (2022 low). Strong rebound from 38.2% retracement of 1.0351 (2022 low) to 1.3141 at 1.2075 will argue that current rise from 1.2036 is already the second leg. However, while further rally could be seen, upside should be limited by 1.3141 to bring the third leg of the pattern.
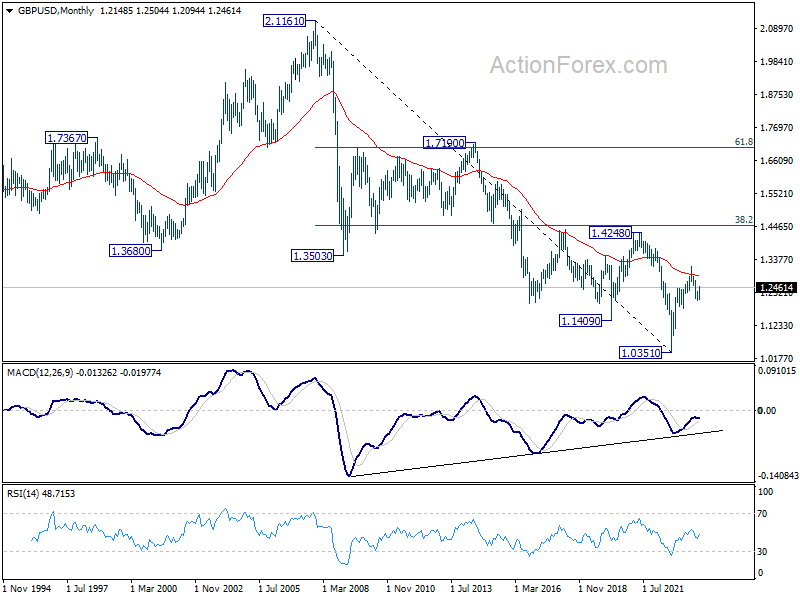
In the long term picture, a long term bottom should be in place at 1.0351 on bullish convergence condition in M MACD. But momentum of the rebound from 1.3051 argues GBP/USD is merely in consolidation, rather than trend reversal. Range trading is likely between 1.0351/4248 for some more time.
USD/CHF Weekly Outlook
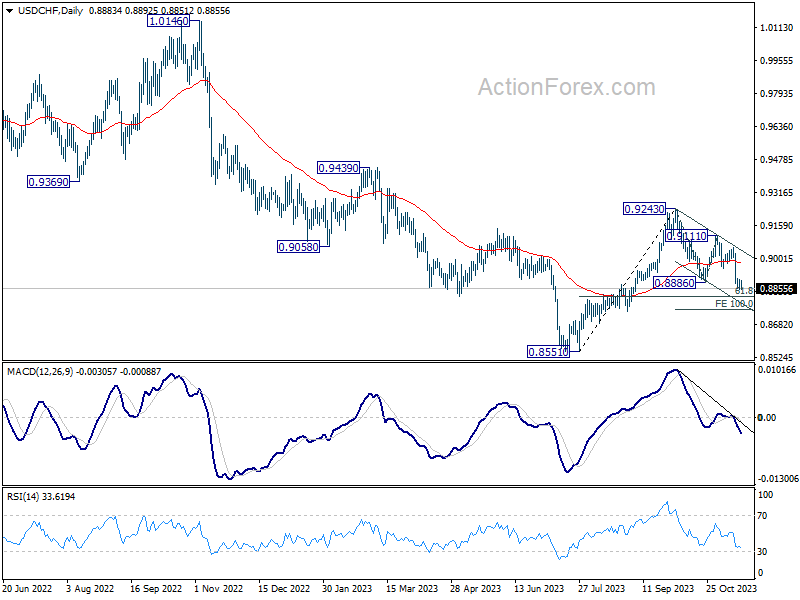
USD/CHF's fall from 0.9243 resumed by breaking through 0.8886 last week. But as a temporary low was formed at 0.8853, initial bias stays neutral this week for consolidations. Another recovery cannot be ruled out but upside should be limited by 0.8952 support turned resistance. On the downside, break of 0.8853 will resume the decline to 100% projection of 0.9243 to 0.8886 from 0.9111 at 0.8754.
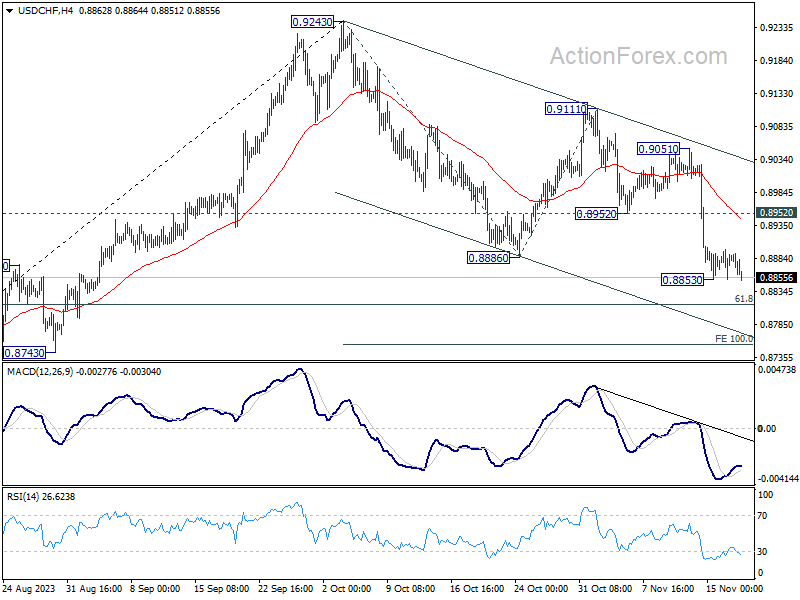
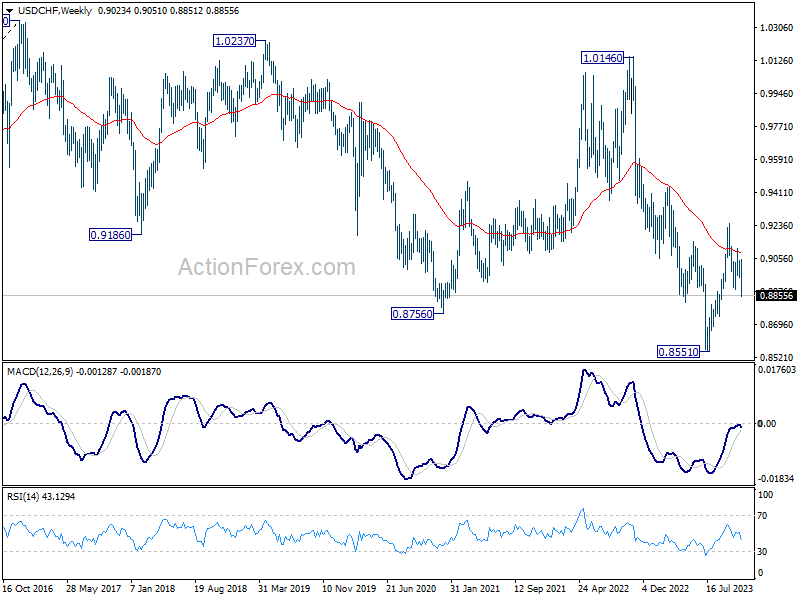
In the bigger picture, price actions from 0.8551 are currently seen as part of a corrective pattern to the decline from 1.0146 (2022 high). Fall from 0.9243 is seen as the second leg for now. Deeper fall would be seen to 61.8% retracement of 0.8551 to 0.9243 at 0.8815. Sustained break there will bring retest of 0.8551 low. For now, this will remain the favored case as long as 0.9111 resistance holds.
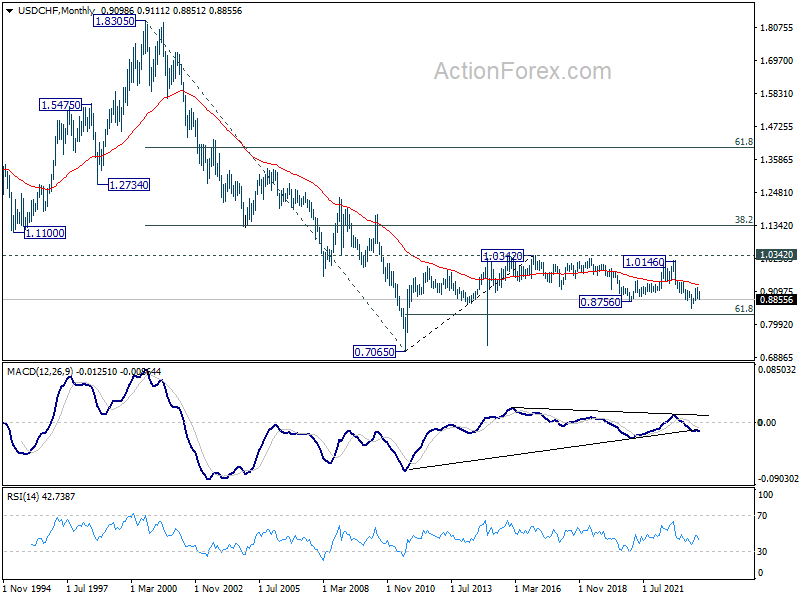
In the long term picture, there is no clear sign that down trend from 1.8305 (2000 high) has completed. With 38.2% retracement of 1.8305 to 0.7065 at 1.1359 intact, outlook is neutral at best.
AUD/USD Weekly Report
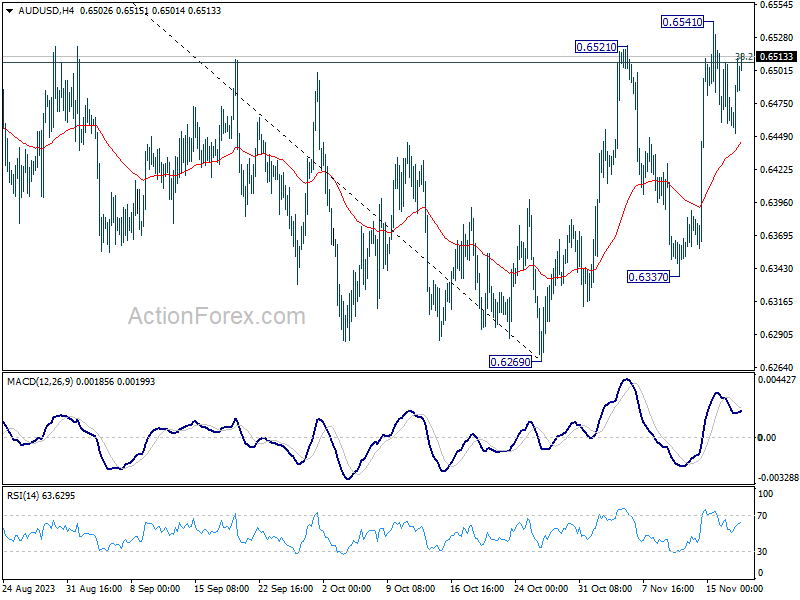
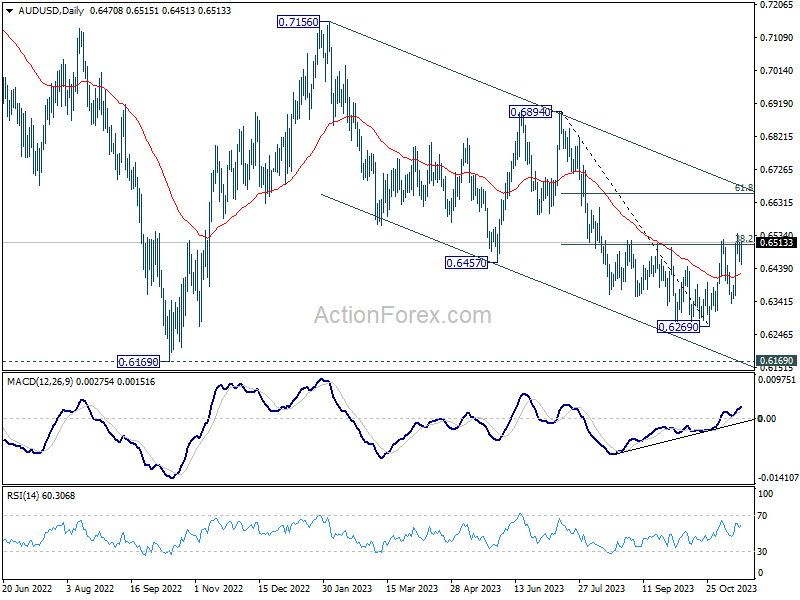
AUD/USD's rebound from 0.6269 resumed last week and hit 0.6541. But subsequent retreat suggested that a temporary top was formed. Initial bias stays neutral this week for more consolidations. On the upside, break of 0.6541, and sustained trading above 38.2% retracement of 0.6894 to 0.6269 at 0.6508, will argue that whole corrective fall from 0.7156 has completed with three waves down to 0.6269. Stronger rally should seen to falling channel resistance (now at 0.6676) next.
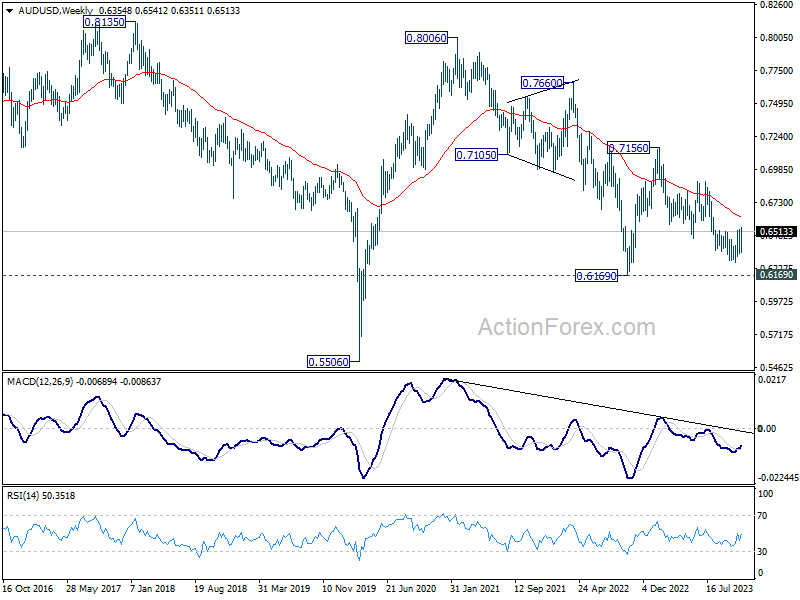
In the bigger picture, there is no confirmation that down trend from 0.8006 (2021 high) has completed. While current rebound from 0.6269 might extend higher, it could be the third leg of the corrective pattern from 0.6169 (2022 low) only. For now, medium term bearishness will remain as long as 0.6894 resistance holds.
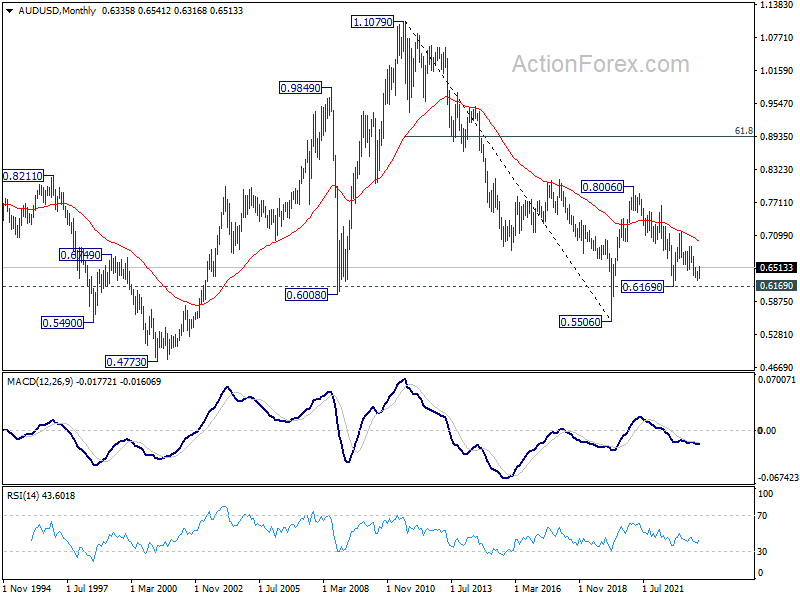
In the long term picture, the down trend from 1.1079 (2011 high) should have completed at 0.5506(2020 low) already. It's unsure yet whether price actions from 0.5506 are developing into a corrective pattern, or trend reversal. But in either case, fall from 0.8006 is seen the second leg of the pattern. Hence, in case of deeper decline, downside strong support should emerge above 0.5506 to bring reversal.
USD/CAD Weekly Outlook
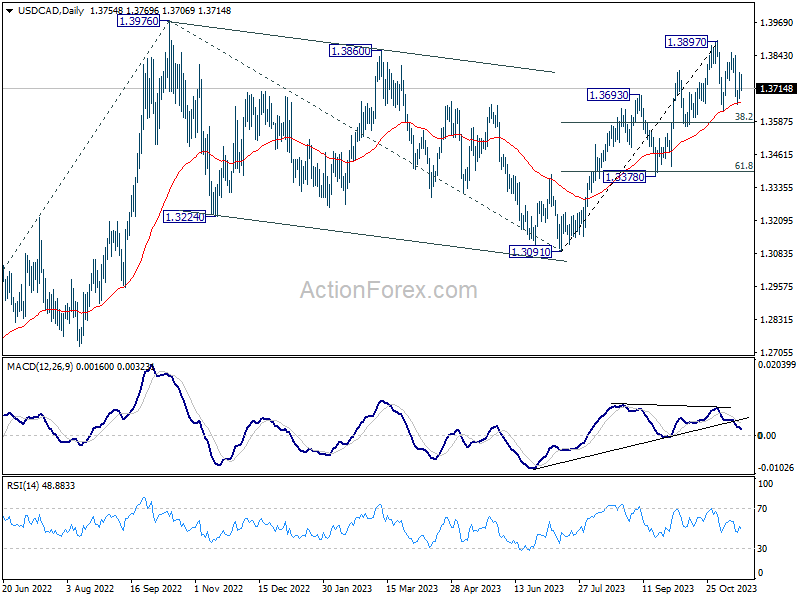
USD/CAD continued to engage in sideway trading last week and outlook is unchanged. Initial bias remains neutral this week first. While another fall cannot be ruled out, downside should be contained by 38.2% retracement of 1.3091 to 1.3897 at 1.3589 to bring rebound. Break of 1.3897 is expected at a later stage to resume larger rally.
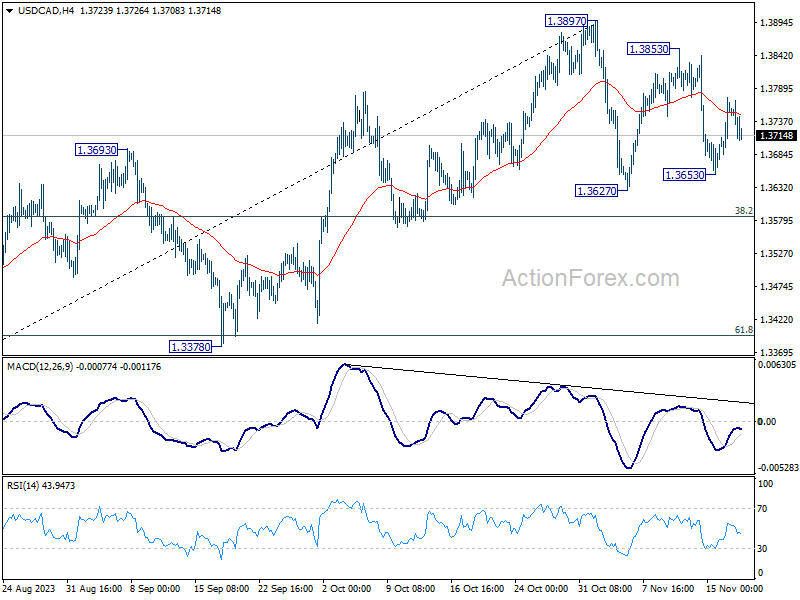
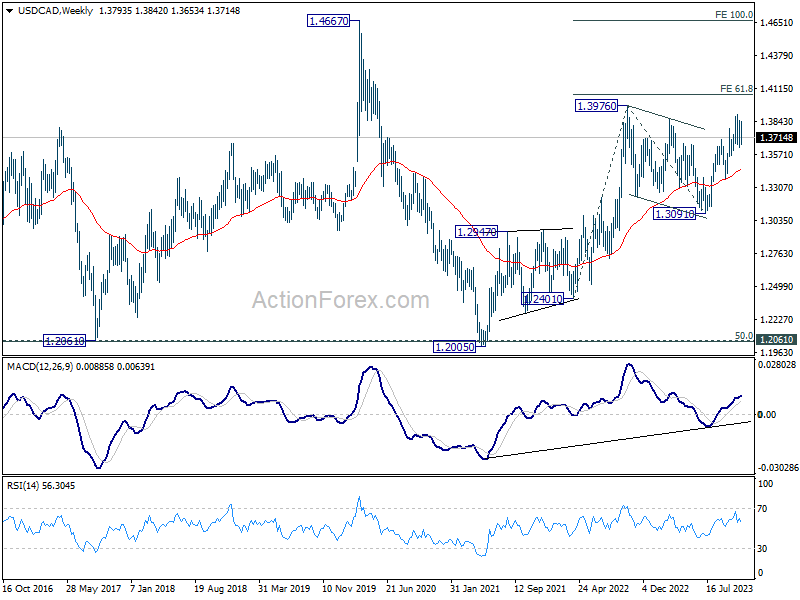
In the bigger picture, corrective pattern from 1.3976 (2022 high) should have completed with three waves down to 1.3091. Decisive break of 1.3976 high will confirm resumption of up trend from 1.2005 (2021 low). Next target is 61.8% projection of 1.2401 to 1.3976 from 1.3091 at 1.4064. This will remain the favored case as long as 1.3378 support holds.
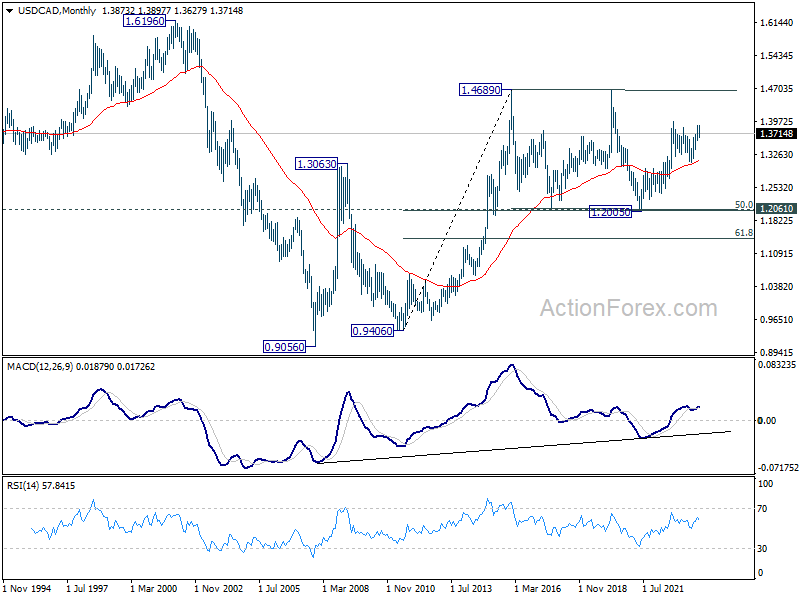
In the longer term picture, price actions from 1.4689 (2016 high) are seen as a consolidation pattern only, which might have completed at 1.2005. That is, up trend from 0.9506 (2007 low) is expected to resume at a later stage. This will remain the favored case as 55 M EMA (now at 1.3132) holds.
GBP/JPY Weekly Outlook
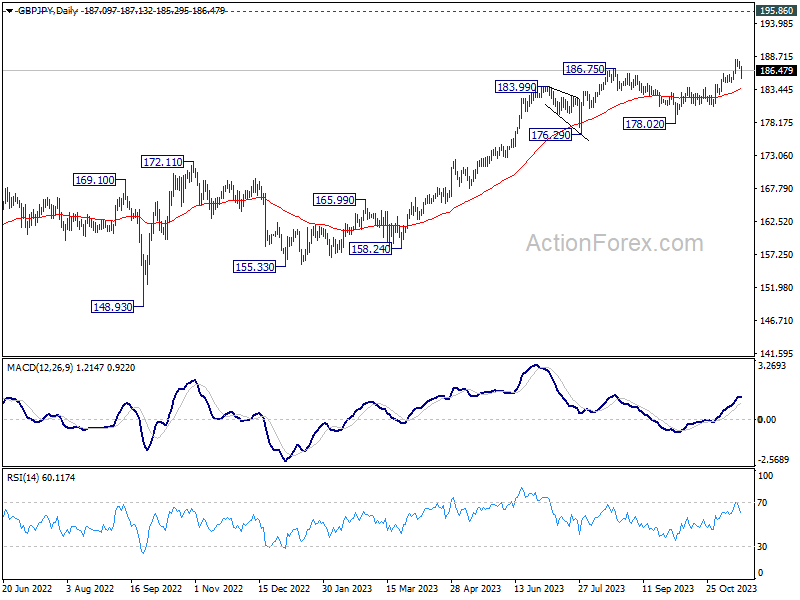
GBP/JPY's rally resumed last week and hit as high as 188.26, before retreating. Initial bias is now neutral this week for consolidations first. Another rally will remain in favor as long as 183.79 support turned resistance holds. Break of 188.26 will resume larger up trend.
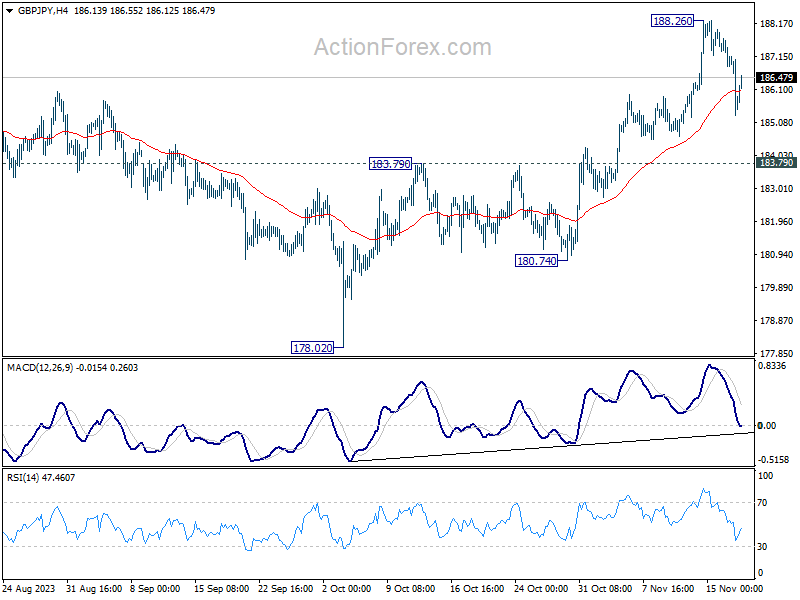
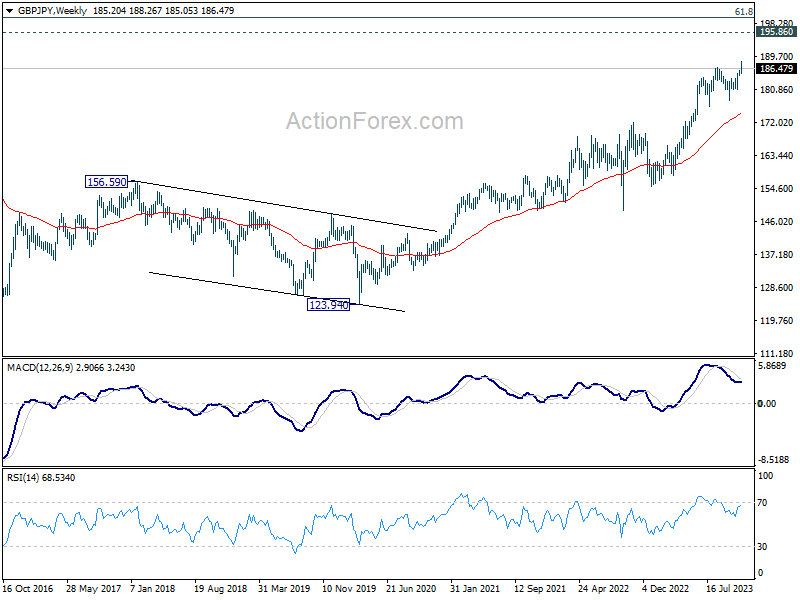
In the bigger picture, as long as 180.74 support holds, larger up trend from 123.94 (202 low) should still be in progress, next target is 195.86 (2015 high). However, firm break of 180.74 will now argue that a medium term top is formed, possibly in bearish divergence condition in D MACD, and bring deeper fall back to 178.02 support.
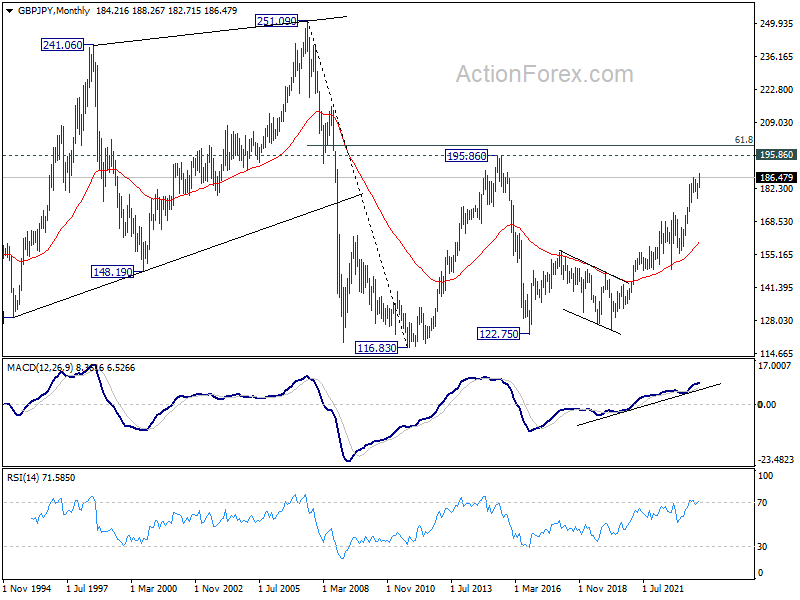
In the longer term picture, rise from 122.75 (2016 low) in still in progress but started losing upside momentum as seen in W MACD. Further rise will remain in favor, though, as long as 177.02 support holds, to retest 195.86 (2015 high).
EUR/JPY Weekly Outlook
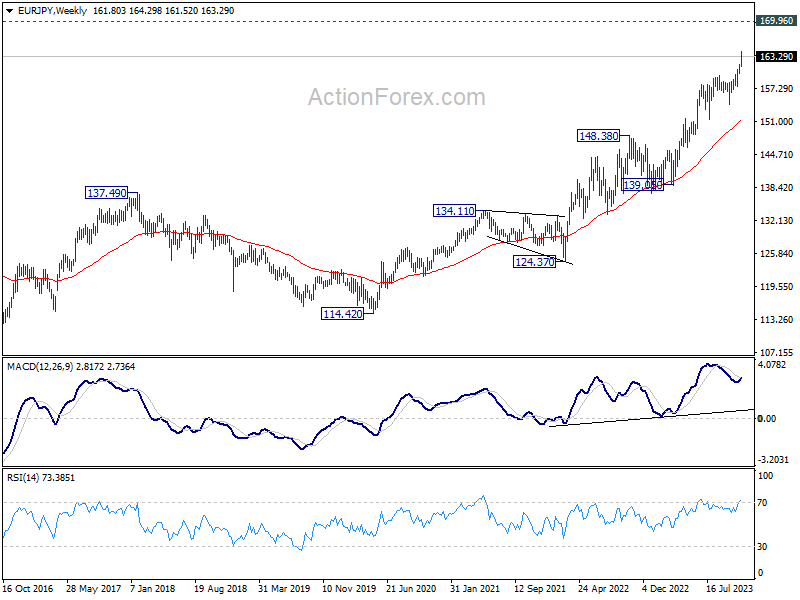
EUR/JPY's up trend continued to as high as 164.29 last week but retreated since then. Initial bias stays neutral this week first, and some more consolidations could be seen. Downside of retreat should be contained well above 159.75 resistance turned support to bring another rally. On the upside, break of 164.29 will resume larger up trend to 61.8% projection of 139.05 to 159.75 from 154.32 at 167.11.
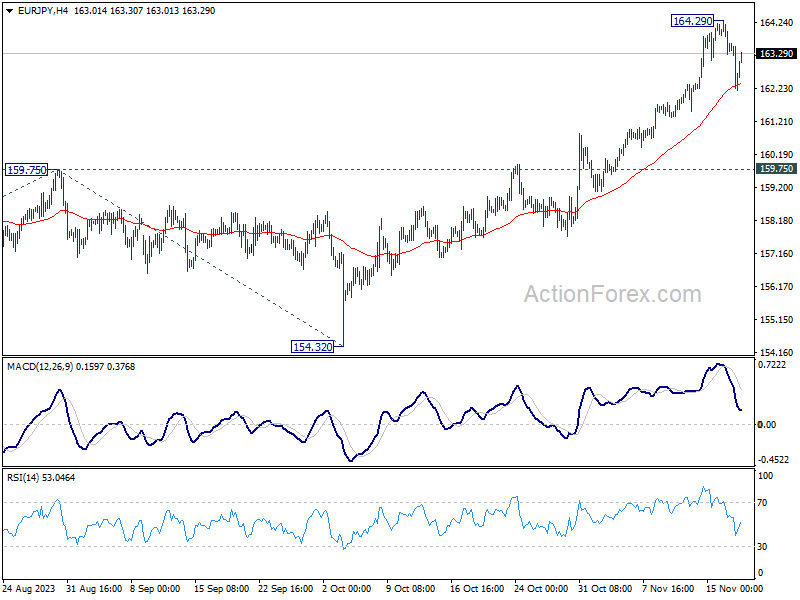
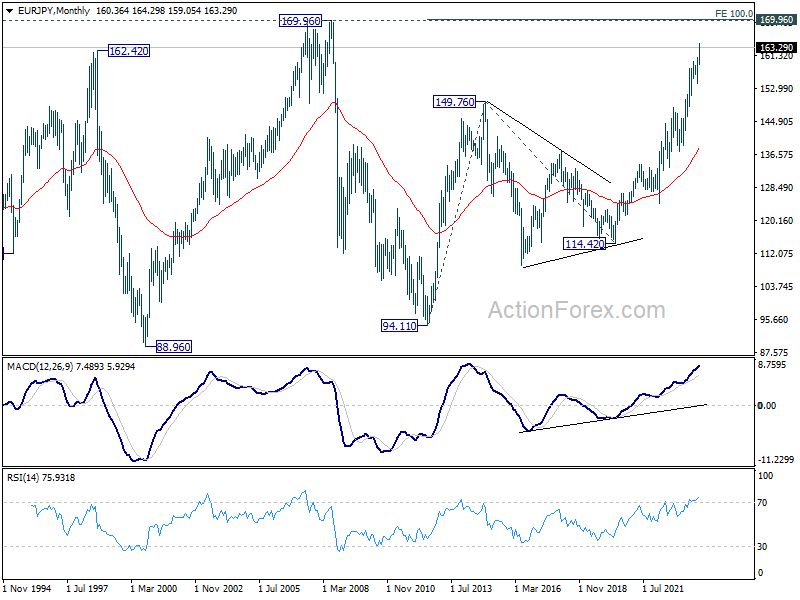
In the bigger picture, rise from 114.42 (2020 low) is in progress. Next target is 169.96 (2008 high). On the downside, break of 159.75 resistance turned support is needed to be the first sign of medium term topping. Otherwise, outlook will remain bullish even in case of deep pullback.
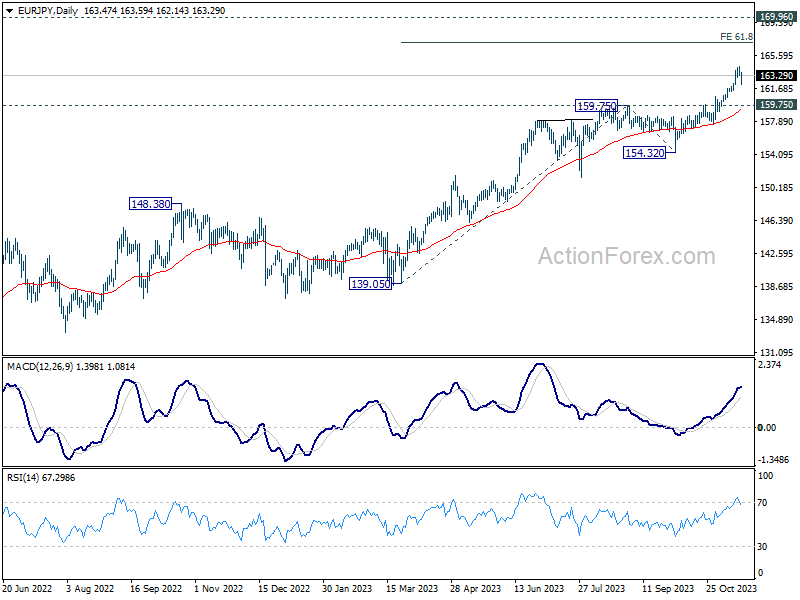
In the long term picture, rise from 109.03 (2016 low) is seen as the third leg of the whole up trend from 94.11 (2012 low). Next target is 100% projection of 94.11 to 149.76 from 114.42 at 170.07 which is close to 169.96 (2008 high).