Sample Category Title
What To Expect from Gold In the upcoming week
Gold prices (XAU/USD) surged more than 1.0% on Thursday of this week, rebounding from a lackluster performance in the previous trading session. This upward momentum was driven by a notable retreat in U.S. Treasury yields, spurred by disappointing labor market data released earlier in the day. Key catalysts include higher-than-expected applications for unemployment benefits, recording 231,000 for the week ending November 11 against a forecast of 220,000. Continuing jobless claims also surpassed expectations, reaching 1,865,000, the highest in almost two years, indicating growing challenges in American employment. The combination of lackluster economic indicators and positive October CPI and PPI figures supports the perception that the Federal Reserve's tightening cycle is concluding, fostering expectations of future rate cuts, which has contributed to gold's upward trajectory amid a more dovish FOMC monetary policy outlook. But is this all there is to Gold? Read on to find out.
XAUUSD - W1 Timeframe
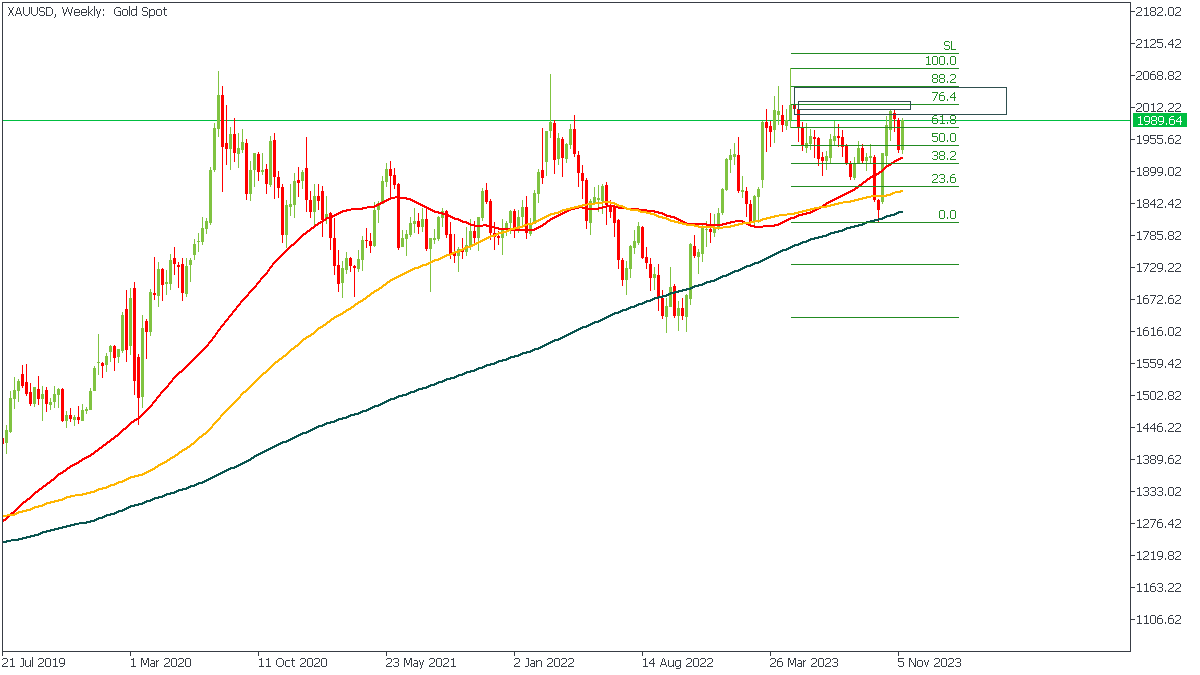
The weekly timeframe of XAUUSD shows price currently retesting a supply zone that is in very close proximity to the 76% of the Fibonacci zone. This on its own signifies that the upward rally has likely come to an end, and we may begin to see a reversal. We are not done yet though, so let’s see what the Daily timeframe indicates.
XAUUSD - D1 Timeframe
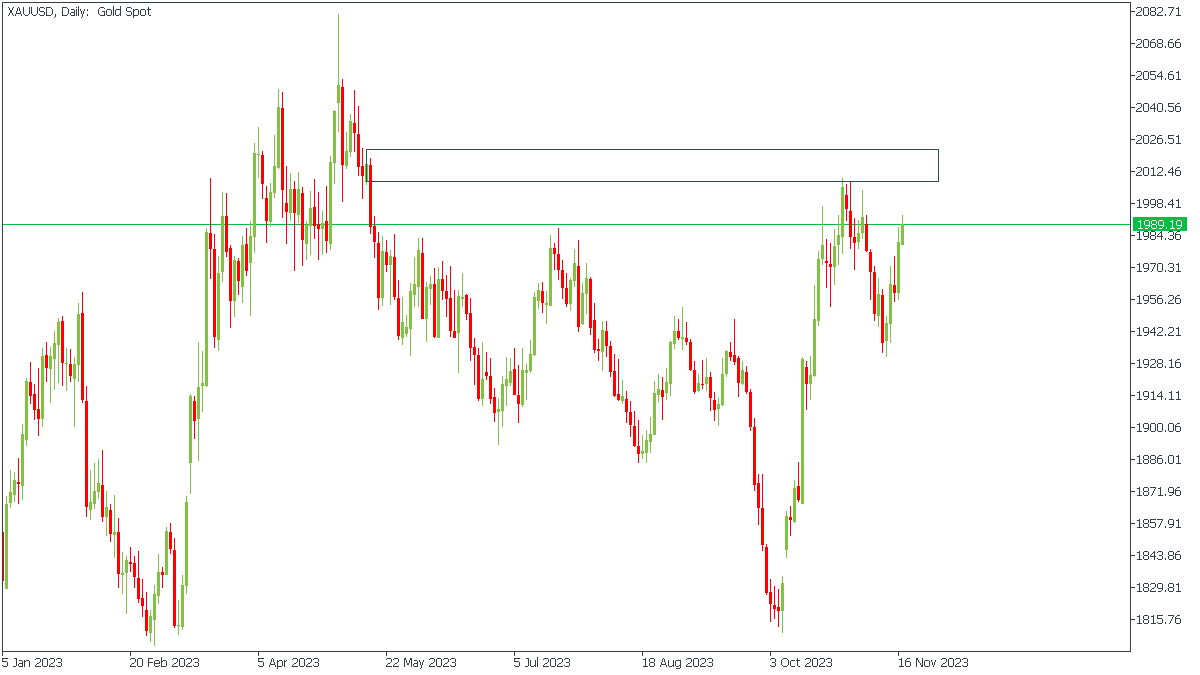
On the Daily timeframe of XAUUSD, we see that price has been rejected initially from the supply zone and seems to simply be heading back up in search of a supply zone from which its bearish momentum can be easily recovered.
XAUUSD - H4 Timeframe
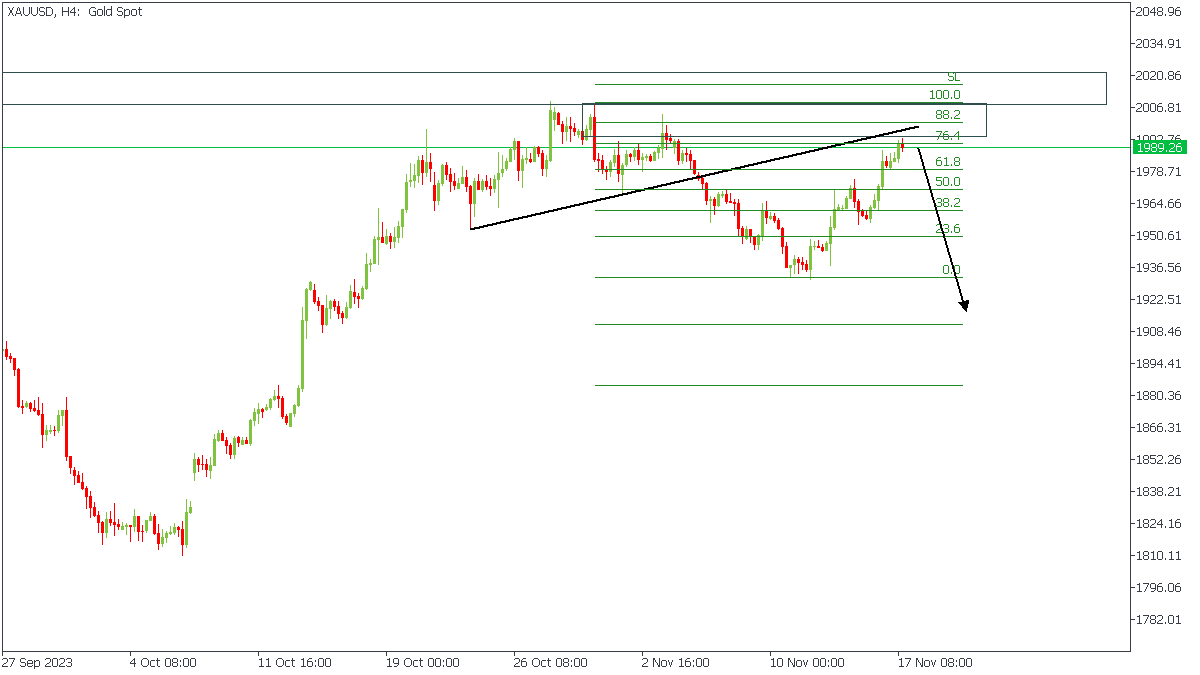
This 4-Hour chart clarifies the entire prospects for Gold. Here, we can see price currently trading around the 76% level of the Fibonacci, and the supply zone. There is also a notable trendline resistance which serves as an additional confluence for a bearish sentiment.
Analyst’s Expectations:
- Direction: Bearish
- Target: 1952.00
- Invalidation: 2010.00
CONCLUSION
The trading of CFDs comes at a risk. To succeed, you have to manage risks properly. To avoid costly mistakes while you look to trade these opportunities, be sure to do your due diligence and manage your risk appropriately.
Sunset Market Commentary
Markets
Until about a month ago, market momentum for yields was to drift higher ‘by default’ at days with no market relevant news. A series of softer (or softly perceived) data since then triggered a 180-degree turn in market momentum. Central bankers’ ‘higher for longer mantra’ has been put aside. Key question for markets now is not if, but when the likes of the Fed, the ECB and even the Bank of England will start reversing part of the 2022/2023 hiking cycle even as inflation stays some distance away from (sustainably) reaching the 2.0% target. Markets now discount the ECB, the Fed and the ECB all cutting their policy rates by at least 25 bps at the June meetings at the latest. Central bankers’ comments pushing back against current market positioning (e.g. ECB Holzmann today) are simply ignored. German yields at some point this morning dropped another 7 bps (10-y), but momentum dwindled going into US trading. German yields currently are ceding between 1 bps (2-5y) and 3.5 bps (30-y). After a first attempt last week, German 2-y yield (2.94%) again holds below 3.0%. Near 2.55/58%, the 10-y yield is testing the lowest levels since mid-September. The jury is still out but question is how far long term yields still can decline from current levels, even if one subscribes current money market positioning on 2024 rate cuts. Easing global market conditions support some further intra-EMU spreads’ narrowing. The 10-y Italian spread versus German declines an additional 1-2 bps to 1.75% to be compared with levels of 2.0%+ last month. After the close of European markets, Moody’s will provide a review on Italy’s credit rating. The agency has the lowest score among major rating agencies (Baa3 with negative outlook), only one level above junk status. Looking at recent prices developments, markets don’t expected Moody’s to pull the trigger even as the Italian government scaled back its trajectory for fiscal consolidation. US yields reversed earlier intraday declines to currently trade between +3.5 bp (2-y) and minus 3.0 bps (30-y). Equities remain well bid. The EuroStoxx 50 gains + 0.85%. S&P opens little changed, but as such maintains a 2.0% weekly gain. Oil ($ 79 p/b) tries to regain some ground after yesterday’s tumbling.
On FX markets, the dollar remains in the defensive, even as recent lows in most cross rates were not extended. DXY (104.2 from 104.40) struggles not to fall below the 104 big figure. EUR/USD also gains modestly (1.087), but stays below the 1.0896 week top. The yen outperforms. The unwinding of standing yen short-positions is probably reinforcing some kind of self-feeding stops loss dynamics with USD/JPY (currently 149.7) testing the 149.20 area, compared to yesterday’s close at 150.73 and a YTD peak of 151.91 touched earlier this week. An unexpected decline in UK October retail sales (-0.3% M/M vs +0.4% expected) for sure won’t pass unnoticed at the BoE. Gilts outperform Bunds and Treasuries with yields ceding up to 6 bps (10-y). However, a constructive risk sentiment from now apparently prevents EUR/GBP forcing a sustained break beyond the 0.8755 area (for now?).
News & Views
ECB President Lagarde proposed to extend the powers of the European Securities & Markets Authority so that it more resembles the US’ Securities and Exchanges Commission. She noted that supervision of capital markets is largely a national competence with the ESMA not having broad enforcement powers similar to the ECB’s bank supervision arm. Yet, the bloc needs investor capital flows to finance an economic overhaul aimed to address challenges coming from deglobalization, demographics and decarbonization. In the eurozone and unlike in the US, banks play a more significant financing role compared to capital markets. But according to Lagarde, the upcoming financing needs outstrip banks’ lending capacity.
The Swedish Riksbank started selling foreign currency from its reserves on September 25 to hedge against currency risk. The plan is to sell $8bn and €2bn for Swedish krones within four to six months. With each selling operation, the Riksbank enters into FX swaps in order to maintain the size of its FX reserves. In the week starting October 30, the central bank sold $690 million dollar and no euros. This brings the running total amount to $3.4bn and €309 million. In other news, the central bank meets next week (Nov 23). Analysts polled by Bloomberg are split in a 6-5 vote in favour for a 25 bps hike to 4.25%. Money markets are betting that the Riksbank’s tightening cycle is over.
AUD/USD and NZD/USD Dips Could Be Attractive
AUD/USD is correcting gains from the 0.6540 zone. NZD/USD is also moving lower and might attempt a fresh increase from 0.5920.
Important Takeaways for AUD USD and NZD USD Analysis Today
- The Aussie Dollar started a downside correction from 0.6540 against the US Dollar.
- There is a key declining channel forming with resistance at 0.6480 on the hourly chart of AUD/USD at FXOpen.
- NZD/USD is also moving lower below the 0.5980 support zone.
- There is a major declining channel forming with resistance near 0.5975 on the hourly chart of NZD/USD at FXOpen.
AUD/USD Technical Analysis
On the hourly chart of AUD/USD at FXOpen, the pair started a fresh increase from the 0.6340 support. The Aussie Dollar was able to clear the 0.6450 resistance to move into a positive zone against the US Dollar.
There was a close above the 0.6500 resistance and the 50-hour simple moving average. Finally, the pair tested the 0.6540 zone. A high is formed near 0.6542 and the pair is now correcting gains.
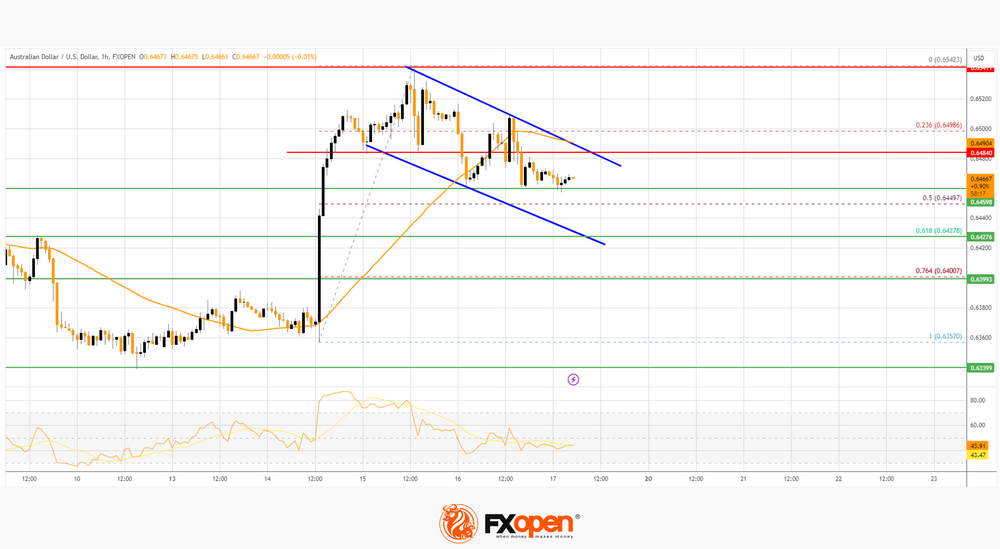
There was a move below the 0.6500 level. The pair declined below the 23.6% Fib retracement level of the upward move from the 0.6357 swing low to the 0.6542 high. There is also a key declining channel forming with resistance at 0.6480.
On the downside, initial support is near the 50% Fib retracement level of the upward move from the 0.6357 swing low to the 0.6542 high at 0.6450.
The next support could be 0.6420. If there is a downside break below the 0.6420 support, the pair could extend its decline toward the 0.6400 level. Any more losses might signal a move toward 0.6340. On the upside, the AUD/USD chart indicates that the pair is now facing resistance near 0.6480.
The first major resistance might be 0.6500. An upside break above the 0.6500 resistance might send the pair further higher. The next major resistance is near the 0.6540 level. Any more gains could clear the path for a move toward the 0.6600 resistance zone.
NZD/USD Technical Analysis
On the hourly chart of NZD/USD on FXOpen, the pair started a steady increase from the 0.5860 level. The New Zealand Dollar broke the 0.5950 resistance to start the recent increase against the US Dollar.
The pair settled above 0.6000 and the 50-hour simple moving average. It tested the 0.6050 zone and is currently correcting gains. The pair corrected lower below the 0.6000 level. The pair also spiked below the 50% Fib retracement level of the upward wave from the 0.5863 swing low to the 0.6054 high.
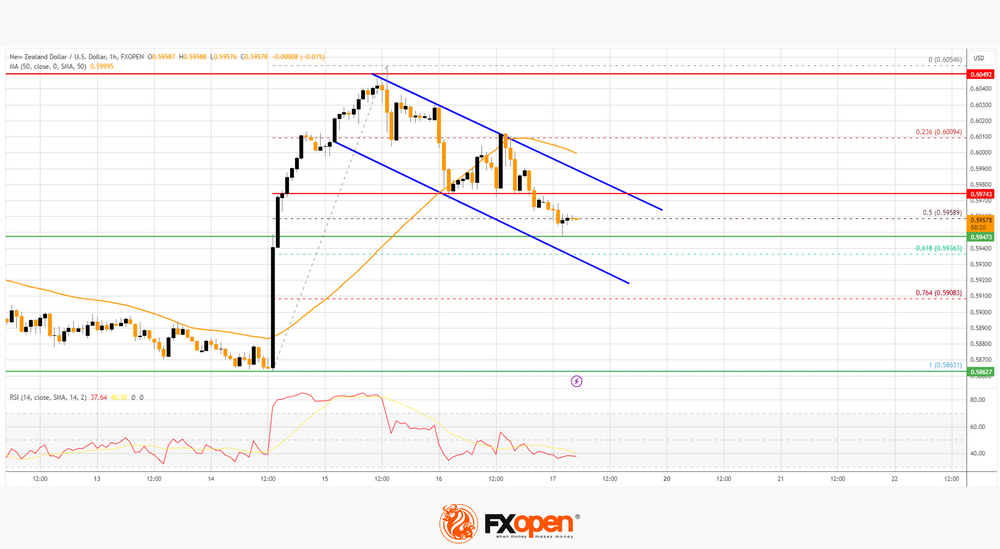
The NZD/USD chart suggests that the RSI is still below 50 and signaling more downsides. There is also a major declining channel forming with resistance near 0.5975.
On the downside, there is major support forming near 0.5945. The next major support is near the 61.8% Fib retracement level of the upward wave from the 0.5863 swing low to the 0.6054 high at 0.5935.
If there is a downside break below the 0.5935 support, the pair might slide toward the 0.5880 support. Any more losses could lead NZD/USD in a bearish zone to 0.5860.
On the upside, the pair might struggle near 0.5975. The next major resistance is near the 0.6000 level. A clear move above the 0.6000 level might even push the pair toward the 0.6050 level. Any more gains might clear the path for a move toward the 0.6120 resistance zone in the coming days.
Trade global forex with the Innovative Broker of 2022*. Choose from 50+ forex markets 24/5. Open your FXOpen account now or learn more about trading forex with FXOpen.
* FXOpen International, Innovative Broker of 2022, according to the IAFT
This article represents the opinion of the Companies operating under the FXOpen brand only. It is not to be construed as an offer, solicitation, or recommendation with respect to products and services provided by the Companies operating under the FXOpen brand, nor is it to be considered financial advice.
Bitcoin’s Volatility Within An Uptrend
Market picture
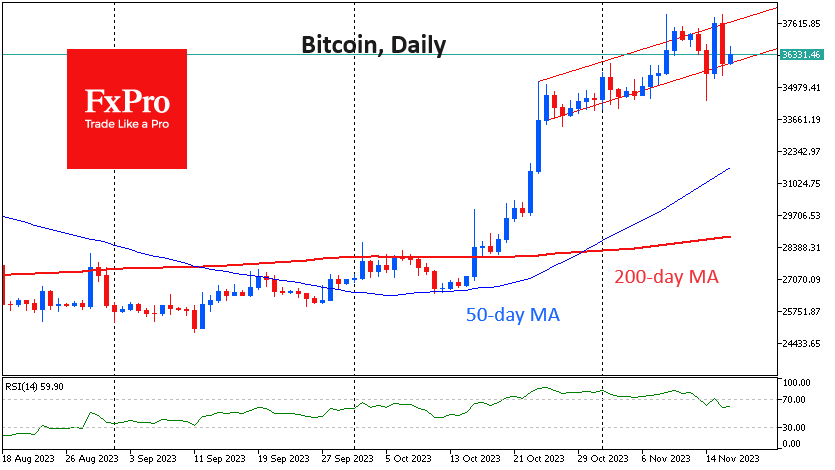
The crypto market has lost 1.5% over the past 24 hours, to $1.39 trillion. The sustained pressure has been in place since the start of the day on Thursday and looks like profit-taking from the impressive rally since the middle of last month. The correction is not as deep as it could have been, as it is primarily offset by demand for risk assets.
Tactically, we focus on the increased volatility of Bitcoin, which has fallen below 34500 since the beginning of the week, then rebounded sharply to 38000 and is trading near the midpoint of that range at 36500 at midday on Friday. Despite the volatility, bitcoin has remained in an uptrend since late October, while the volatility is clearing overbought conditions and making room for further gains.
News background
The SEC delayed a decision on Hashdex’s application to launch a spot ETF based on digital gold until 1 January 2024. At the same time, the SEC also postponed a decision on Grayscale’s application to launch an ETF based on Ethereum futures.
According to Bloomberg Intelligence, Grayscale’s application to launch ETFs based on Ethereum ETH futures is needed to advance the decision to launch spot funds on the second cryptocurrency.
SkyBridge Capital CEO Anthony Scaramucci said the Fed’s rate cut early next year will lead to another bull cycle in the cryptocurrency and equity markets. In addition, approving spot Bitcoin ETFs and halving BTC will create a “huge demand” for Bitcoin.
Tether, which issues the most popular stablecoin USDT, plans to invest $500 million in bitcoin mining over the next six months.
US presidential candidate Vivek Ramaswamy pledged to support bitcoin, cryptocurrencies, and decentralised finance (DeFi) in every way possible if he wins the presidential election.
USD/JPY Mid-Day Outlook
Daily Pivots: (S1) 150.20; (P) 150.82; (R1) 151.34; More...
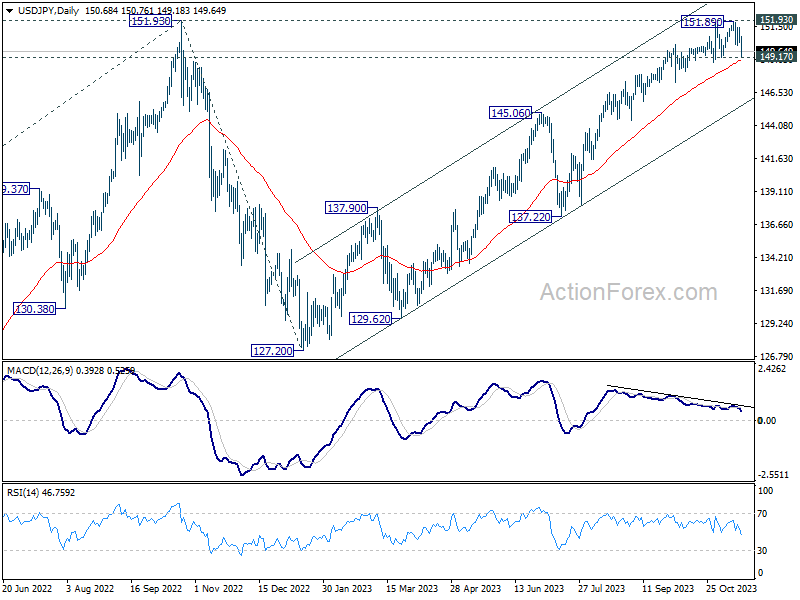
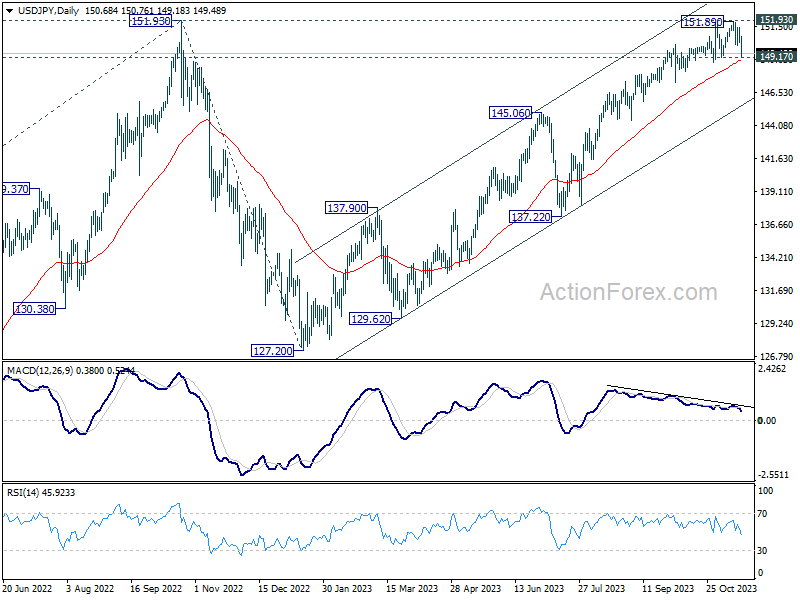
While USD/JPY falls steeply today, it's still holding above 149.17 support. Intraday bias remains neutral for the moment. On the upside, decisive break of 151.93 resistance will confirm resumption of long term up trend. However, firm break of 149.17 will be a sign of bearish reversal and bring deeper fall to 147.28 support first.
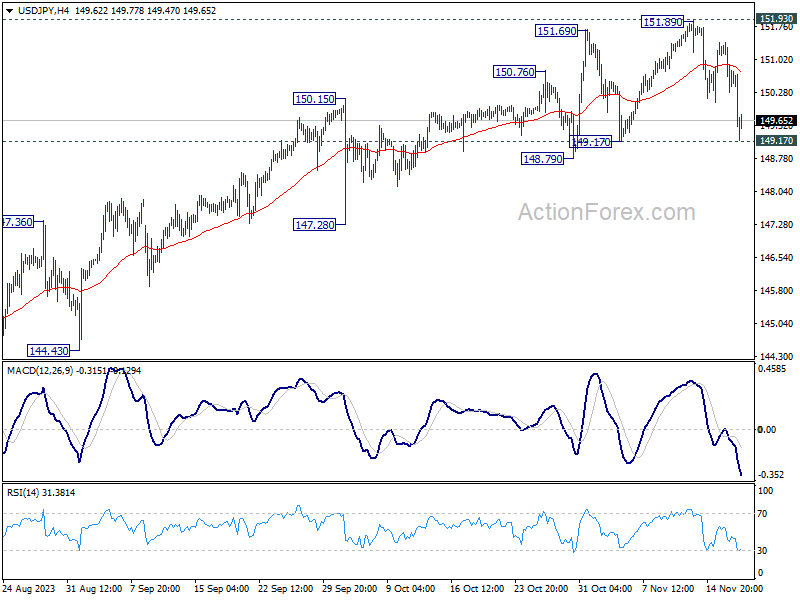
In the bigger picture, immediate focus is now on 151.93 resistance (2022 high). Rejection by 151.93, followed by sustained break of 145.06 resistance turned support will argue that rise from 127.20 has completed, and turn outlook bearish for 137.22 support and below. However, sustained break of 151.93 will confirm resumption of long term up trend. Next target will be 61.8% projection of 102.58 (2021 low) to 151.93 from 127.20 at 157.69.
USD/CHF Mid-Day Outlook
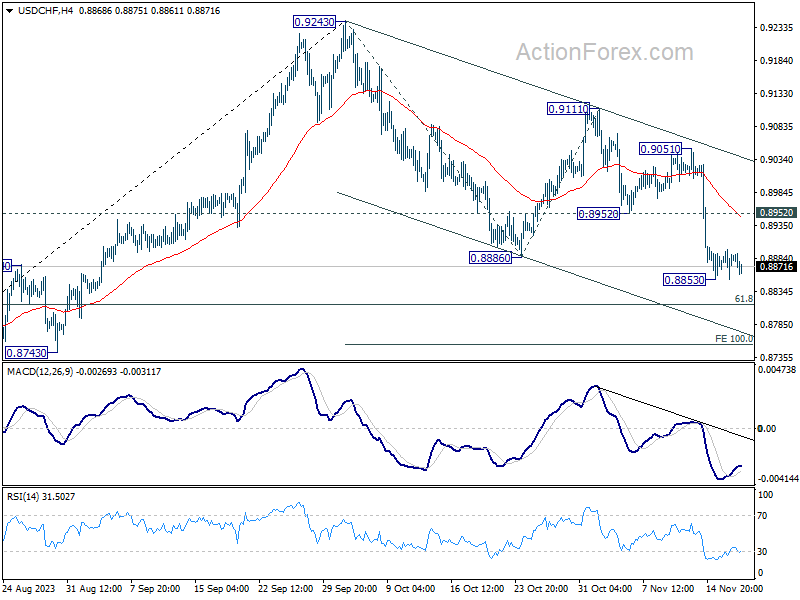
Daily Pivots: (S1) 0.8837; (P) 0.8933; (R1) 0.8988; More....
Intraday bias in USD/CHF remains neutral for consolidation above 0.8853 temporary low. Stronger recovery cannot be ruled out. But upside should be limited by 0.8952 support turn resistance to bring another fall. Break of 0.8852 will resume the decline from 0.9243 to 100% projection of 0.9243 to 0.8886 from 0.9111 at 0.8754.
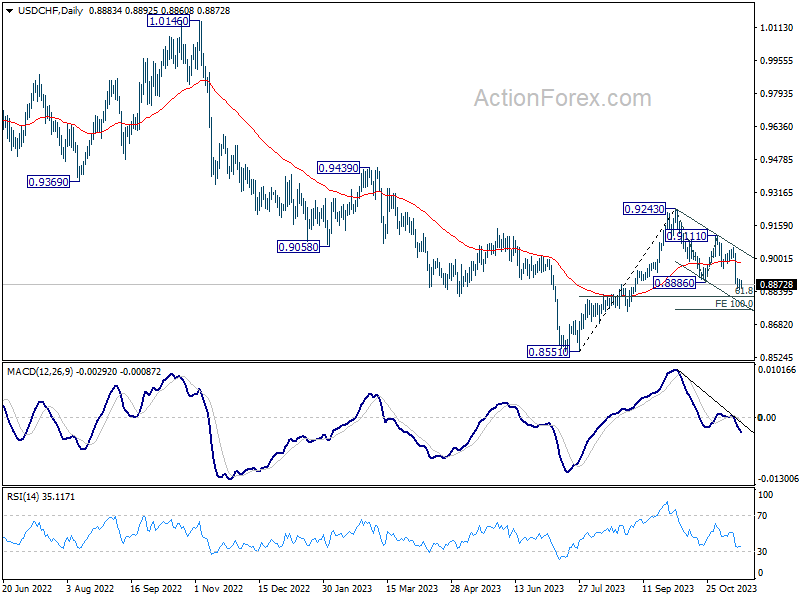
In the bigger picture, price actions from 0.8551 are currently seen as a correction to the decline from 1.0146. Fall from 0.9243 is seen as the second leg for now. Deeper fall would be seen to 61.8% retracement of 0.8551 to 0.9243 at 0.8815. Sustained break there will bring retest of 0.8551 low. For now, this will remain the favored case as long as 0.9111 resistance holds.
GBP/USD Mid-Day Outlook
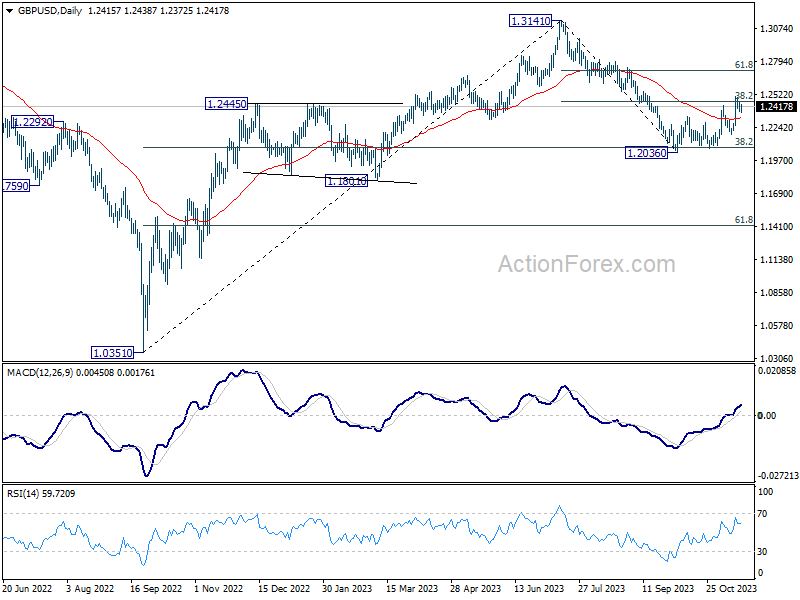
Daily Pivots: (S1) 1.2375; (P) 1.2416; (R1) 1.2454; More...
GBP/USD is still extending the consolidation from 1.2504 and intraday bias stays neutral at this point. Deeper retreat could be seen, but downside should be contained by 55 4H EMA (now at 1.2341) to bring another rally. On the upside, break of 1.2504 will resume the whole rebound from 1.2036. Sustained trading above 38.2% retracement of 1.3141 to 1.2036 at 1.2458 will pave the way to 61.8% retracement at 1.2716.
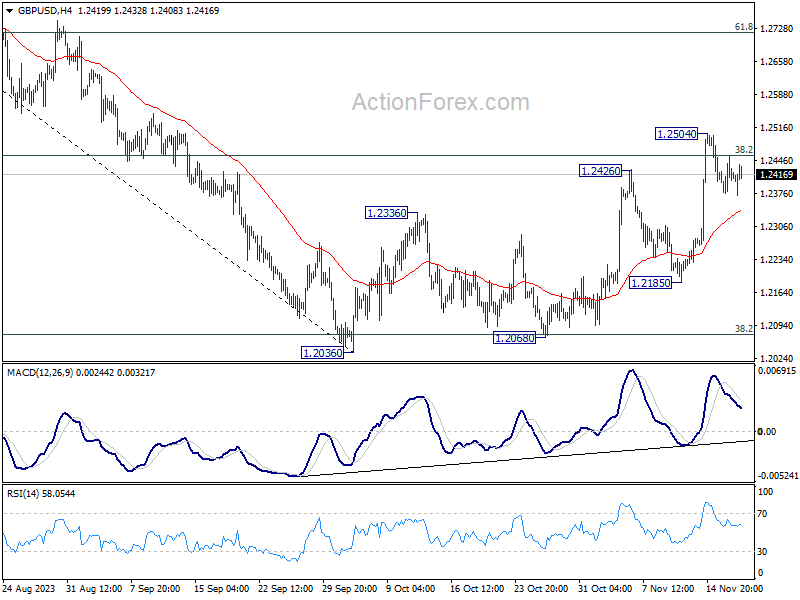
In the bigger picture, price actions from 1.3141 are seen as a corrective pattern to rise from 1.0351 (2022 low). Strong rebound from 38.2% retracement of 1.0351 (2022 low) to 1.3141 at 1.2075 will argue that current rise from 1.2036 is already the second leg. However, while further rally could be seen, upside should be limited by 1.3141 to bring the third leg of the pattern.
EUR/USD Mid-Day Outlook
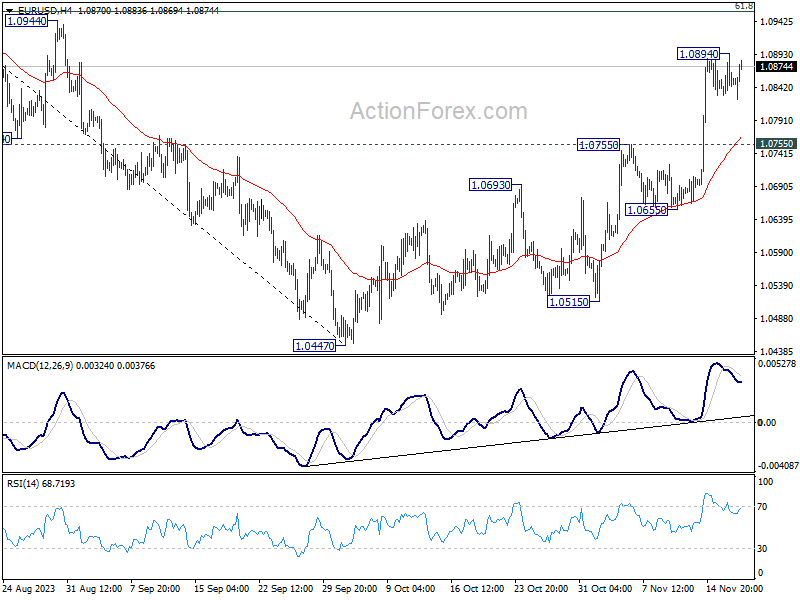
Daily Pivots: (S1) 1.0823; (P) 1.0860; (R1) 1.0889; More...
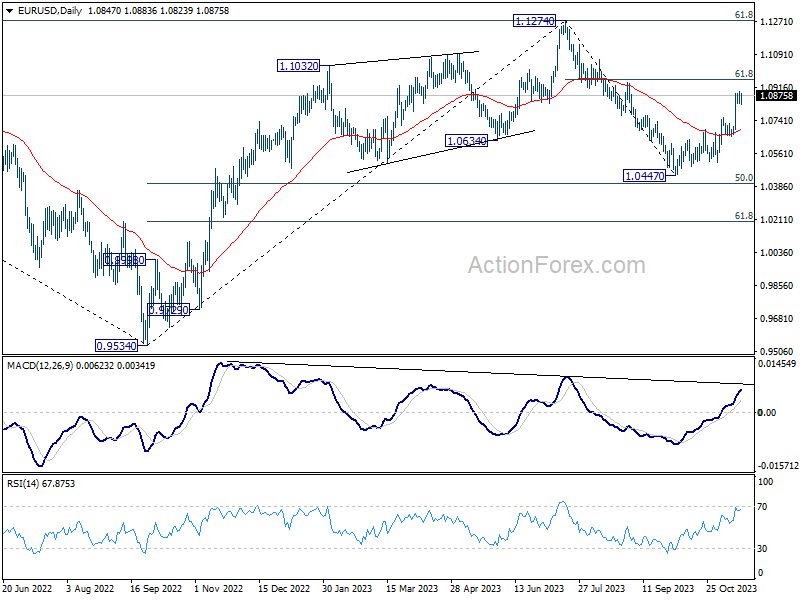
Intraday bias in EUR/USD stays neutral at this point, as consolidation continues below 1.0984. In case of deeper retreat, downside should be contained by 1.0755 resistance turned support to bring another rally. On the upside, above 1.0894 will resume the rebound from 1.0447 to 61.8% retracement of 1.1274 to 1.0447 at 1.0958 next.
In the bigger picture, price actions from 1.1274 are viewed as a corrective pattern to rise from 0.9534 (2022 low). Rise from 1.0447 is tentatively seen as the second leg. Hence while further rally could be seen, upside should be limited by 1.1274 to bring the third leg of the pattern. However, break of 1.0447 will resume the fall to 61.8% retracement of 0.9543 to 1.1274 at 1.0199.
Yen’s Sharp Rebound Amid Global Yield Dip: Central Bank Rate Cut Bets in Focus
Japanese Yen surged sharply in European session, bolstered by significant dips in Germany's 10-year government bond yield, which reached its lowest level since early September. Concurrently, US 10-year yield also briefly fell below 4.4% mark.
This movement in the bond markets reflects an aggressive stance by traders betting on rate cuts by major central banks in the upcoming year. Traders had been speculating about a full percentage point cut in interest rates by both ECB and Fed by the end of 2024. However, as the market regained its composure and yields recovered, Yen's rally also lost some of its initial momentum.
Despite the market's anticipatory stance, it seems premature to heavily bet on rate cuts just yet. Central bankers are still leaving the door open for further rate hikes. For instance, Bundesbank President Joachim Nagel stated today, "Are we there yet? Have we seen the peak in interest rates? That is not clear yet." Similarly, ECB Governing Council member Robert Holzmann suggested that it might be "somewhat early" for a rate cut in the second quarter .
In the broader forex markets, most major pairs and crosses are trading within the ranges set yesterday. Dollar is showing some softness alongside Sterling and New Zealand Dollar. Australian Dollar and Canadian Dollar are faring better, though Yen currently overshadows them.
From a technical standpoint, USD/JPY is now pressing 149.17 support with today's steep fall. Firm break there should confirm rejection by 151.93 key resistance, and bring deeper decline towards medium term channel support (now at around 145.71). As the week draws to a close, it remains to be seen whether Yen can achieve this significant breakthrough.
In Europe, at the time of writing, FTSE is up 1.00%. DAX is up 0.86%. CAC is up 0.92%. Germany 10-year yield is down -0.015 at 2.583. Earlier in Asia, Nikkei rose 0.48%. Hong Kong HSI dropped -2.12%. China Shanghai SSE rose 0.11%. Singapore Strait Times dropped -0.27%. Japan 10-year JGB yield dropped -0.043 to 0.748.
Eurozone CPI finalized at 2.9% yoy in Oct, core at 4.2% yoy
Eurozone CPI was finalized at 2.9% yoy in October, down from September's 4.3% yoy. CPI core (excluding energy, food, alcohol & tobacco) was finalized at 4.2% yoy, down from previous reading of 4.5% yoy. The highest contribution came from services (+1.97%), followed by food, alcohol & tobacco (+1.48%), non-energy industrial goods (+0.90%) and energy (-1.45%).
EU CPI was finalized at 3.6% yoy, down from prior month's 4.9% yoy. The lowest annual rates were registered in Belgium (-1.7%), the Netherlands (-1.0%) and Denmark (-0.4%). The highest annual rates were recorded in Hungary (9.6%), Czechia (9.5%) and Romania (8.3%). Compared with September, annual inflation fell in twenty-two Member States and rose in five.
UK retail sales volume down -0.3% mom in Sep, sales value down up 0.1% mom
UK retail sales volume fell -0.3% mom in September, much worse than expectation of 0.3 mom rise. Ex-automotive fuel sales volume fell -0.1% mom. Looking broader, sales volumes (include and excluding fuel) fell by -1.1% in the three months to October 2023 when compared with the previous three months.
In value term, retail sales rose 0.1% mom while ex-fuel sales was flat 0.0% mom.
BoJ's Ueda reiterates patience in maintaining ultra-loose policy
BoJ Governor Kazuo Ueda has once again underscored the central bank's commitment to maintaining its ultra-loose monetary policy, emphasizing the need for patience in the face of uncertain inflation dynamics.
Speaking to the parliament, Ueda noted, "Trend inflation is likely to gradually accelerate toward our 2% inflation target through fiscal 2025. But this needs to be accompanied by a positive wage-inflation cycle."
"Uncertainty on whether Japan will see such a positive wage-inflation cycle is high," he added.
Addressing the behavior of 10-year JGB yields, Ueda expressed that he does not foresee a sharp rise above the 1% reference level, even under upward pressure.
Looking ahead, Ueda clarified the bank's position on potentially ending its Yield Curve Control and negative interest rate policies, stating, "We will consider ending YCC, negative rate if we can expect inflation to stably, and sustainably hit the price target."
He added that the order of adjustments to the policy would be contingent on various factors, including economic conditions, price movements, and market developments.
EUR/USD Mid-Day Outlook
Daily Pivots: (S1) 1.0823; (P) 1.0860; (R1) 1.0889; More...
Intraday bias in EUR/USD stays neutral at this point, as consolidation continues below 1.0984. In case of deeper retreat, downside should be contained by 1.0755 resistance turned support to bring another rally. On the upside, above 1.0894 will resume the rebound from 1.0447 to 61.8% retracement of 1.1274 to 1.0447 at 1.0958 next.
In the bigger picture, price actions from 1.1274 are viewed as a corrective pattern to rise from 0.9534 (2022 low). Rise from 1.0447 is tentatively seen as the second leg. Hence while further rally could be seen, upside should be limited by 1.1274 to bring the third leg of the pattern. However, break of 1.0447 will resume the fall to 61.8% retracement of 0.9543 to 1.1274 at 1.0199.
Economic Indicators Update
| GMT | Ccy | Events | Actual | Forecast | Previous | Revised |
|---|---|---|---|---|---|---|
| 21:45 | NZD | PPI Input Q/Q Q3 | 1.20% | 0.20% | -0.20% | |
| 21:45 | NZD | PPI Output Q/Q Q3 | 0.80% | 0.40% | 0.20% | |
| 07:00 | GBP | Retail Sales M/M Oct | -0.30% | 0.30% | -0.90% | -1.10% |
| 09:00 | EUR | Eurozone Current Account (EUR) Sep | 31.2B | 20.3B | 27.7B | 30.8B |
| 10:00 | EUR | Eurozone CPI Y/Y Oct F | 2.90% | 2.90% | 2.90% | |
| 10:00 | EUR | Eurozone CPI Core Y/Y Oct F | 4.20% | 4.20% | 4.20% | |
| 13:30 | CAD | Industrial Product Price M/M Oct | -1.00% | 0.20% | 0.40% | |
| 13:30 | CAD | Raw Material Price Index Oct | -2.50% | -2.00% | 3.50% | 3.90% |
| 13:30 | USD | Building Permits Oct | 1.49M | 1.45M | 1.47M | |
| 13:30 | USD | Housing Starts Oct | 1.37M | 1.36M | 1.36M |
Euro Drifting as Eurozone Inflation Falls to 2.9%
- Eurozone inflation confirmed at 2.9%
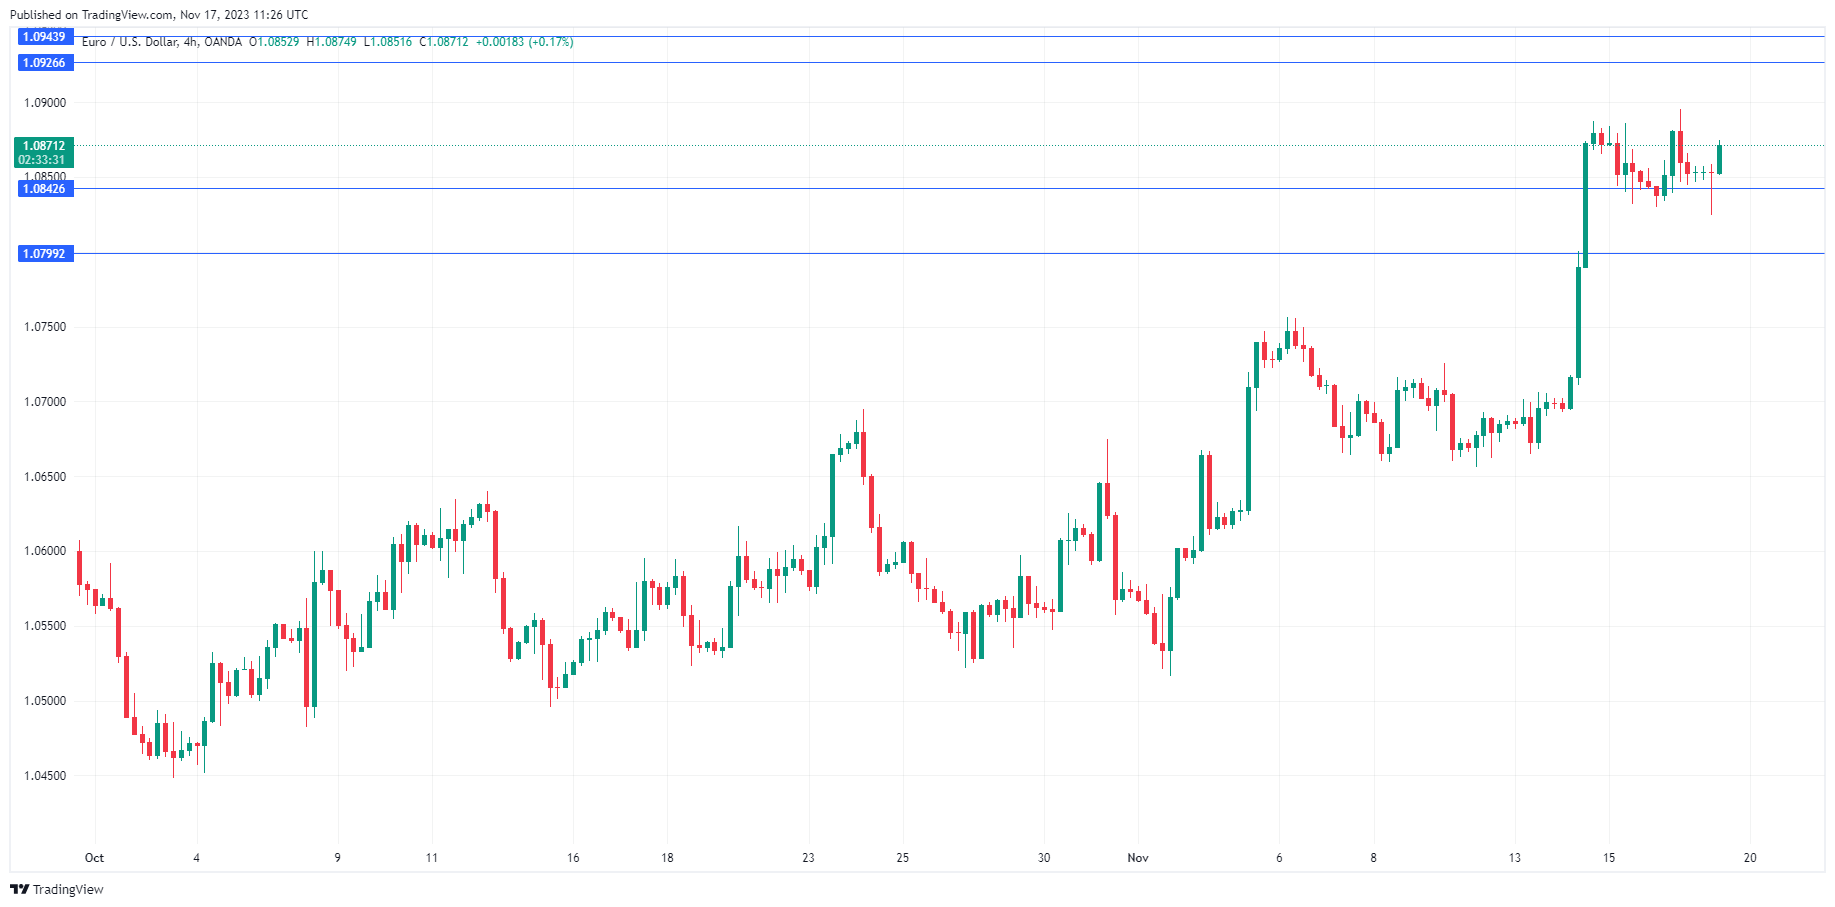
The euro is trading quietly on Friday. In the European session, EUR/USD is trading at 1.0870, up 0.17%. The US dollar sustained sharp losses after a soft inflation report on Tuesday, and the euro took advantage with a massive gain of 1.68% the same day. Since then, the euro has been relatively calm.
Eurozone inflation confirmed at 2.9%
Eurozone inflation came in at 2.9% y/y in October, confirming the initial report. This was down sharply from 4.3% in September and matched the consensus estimate. The print was the lowest since July 2021 and was driven by a decline in energy and food prices. Monthly, inflation eased to 0.1%, down from 0.3% in September and matching the consensus estimate. The core rate, which remains well above the headline figure, showed a modest decrease, dropping from 4.5% to 4.2%, matching the consensus estimate.
The ECB held rates at 4.0% in October after 10 successive rate hikes and with inflation continuing to fall, expectations are that the central bank will prolong its hold on rates, barring an unexpected upswing in inflation. The economic picture is not pretty, as the eurozone economy is stagnating and Germany, once a global powerhouse, has become a deadweight on the eurozone with its weak economy. Lagarde said last week that the ECB will not be trimming rates in the “next couple of quarters” while acknowledging that “inflation has come down massively” and hinting that rates may have peaked.
In the US, there were further signs this week that the economy is losing steam. Inflation was lower than expected at 3.2% and retail sales surprised to the downside with a 0.1% decline. As well, unemployment claims hit a three-month high at 231,000. US Treasury yields fell on Thursday to 4.45%, down from 4.53%, as speculation continues to rise that the Fed has ended or is very close to ending the current rate-tightening cycle. The markets widely expect a pause at the final rate meeting of the year in December and have priced in a rate cut as early as May 2024.
EUR/USD Technical
- There is resistance at 1.0926 and close by at 1.0943
- EUR/USD tested support at 1.0842 earlier. Below, there is support at 1.0799