

Sample Category Title
Yen Tops G10 Scoreboard in Quiet Asian Trading
Markets
The US yield curve hit a weekly low yesterday with declines ranging between 7.4 and 10.3 bps. Wednesday’s unconvincing rebound was indeed a head fake and got fully erased a day later on a set of sub-consensus economic data. These included jobless claims, industrial production and the NAHB housing market index. They pointed at a decelerating economy and, importantly, job market. German yields followed the US trend and slipped 4.4 to 6.6 bps across the curve. Moves on core bond markets this time however didn’t trigger a risk-on rally similar to what we’ve seen earlier this week. Stocks inched lower in Europe and treaded water in the US. Oil prices tanked 4.6% (Brent $77.42/b) amid demand concerns as well as supply being not as constrained as expected with producers outside OPEC+ swooping in to compensate for the cartel’s (voluntary) output curbs. Gold prices rallied 1%. FX markets favoured the big three: USD, EUR and JPY with the latter outperforming in a daily perspective. USD/JPY eased to 150.73 while EUR/JPY gave back some of the large gains over the past few days. EUR/USD neared 1.09 before settling in the mid 1.08-09 area. EUR/GBP mirrored those moves with an intraday high of 0.87665 only to finish at 0.8742.
The yen continues to top the G10 scoreboard in quiet Asian trading this morning, discarding dovish comments for BoJ governor Ueda. He expects inflation to slow in FY2025, adding that there’s not enough certainty that the central bank will reach its price goal sustainably. US Treasury yields recover 1-3 bps in technically insignificant trading. Today’s economic calendar won’t inspire much. US housing data is worth following up, given that this market is increasingly suffering from rising unaffordability (high mortgage rates and prices due to low supply/availability). If anything, a miss to the downside is more likely to strengthen current market thinking rather than vice versa. Central bank speeches will flood the terminal screens again. Many, if not most of the ones having talked recently show little willingness to play ball with markets. But neutral or even hawkish comments can’t compete with what the data are telling. The correction lower in core bond yields may slow but probably won’t reverse going into the weekend. Support to look for in the US 10-y yield stands at 4.34%. Germany’s 10-y is nearing the upward sloping trendline connecting the 2023 correction lows (but the ones in March). To the extent markets continue to see the Fed as being able to more aggressively cut rates, dollar weakness may prevail. EUR/USD’s downside looks solid. Poor UK retail sales this morning wrapped up this week’s eco update. Sterling slips, pushing EUR/GBP north to 0.8755. A weekly close above 0.871/0.873 (50% recovery on the EUR/GBP 2023 decline) worsens sterling’s technical picture.
News & Views
Activity in the US housing market is declining sharply according to the sentiment index of the US National Association of Home Builders. The NAHB sentiment index tumbled from 40 to 34, the lowest reading YTD. Both the indices for current single family sales and future sales dropped substantially as was the case for prospective buyers traffic. Sentiment also dropped in three of the for regions under survey. However, the comments from NABH chief economist Robert Dietz were slightly more comforting that data of the survey as he was quoted that recent macro-economic data point to improving conditions for home construction in the coming months. ‘Given the lack of existing home inventory, somewhat lower mortgage rates will price-in housing demand and are likely to set the stage for improved further views of market conditions in December’ the NAHB was quoted.
According to comments from the officers of the Budget Committee of the German government, final deliberations on the German 2024 draft budget have been interrupted early in this morning. The halt in the deliberations comes after a ruling of the German constitutional court earlier this week. Due to the ruling, the government is facing a financing hole as the court judged that the government isn’t allowed to transfer €60 bln of funds that were made available during the pandemic to be redirected for initiatives that support the green transition and other industrial projects. Still, the government expects that final budget figures and new debt figures will be made public after a meeting next Thursday, instead of this week as planned earlier.
Oil: Race to the Bottom
This week could hardly be better in terms of economic, political, and geopolitical news. The US inflation slowed more than expected, the US politicians inked a short-term deal to avert a shutdown. On top, the US retail sales fell last month, but fell less than expected, the initial jobless claims rose, and the US unemployment benefits reached the highest level in almost two years, factory production fell more than expected and homebuilder sentiment fell to the lowest level for the year.
The US 2-year yield fell again to test the 4.80% level for the third time since the beginning of this month and the 10-year yield slipped below 4.50%, again. The S&P500 consolidated gains above the 4500 psychological level, and Nasdaq 100 remained bid a few points below the summer peak. Small stocks in the Russell 2000 however fell 1.50% yesterday, and the Chinese stocks couldn’t extend gains after the Biden-Xi summit. Nasdaq’s Golden Dragon China index spent just one day above its 50-DMA -thanks to fresh stimulus measures announced by China earlier in the week, then returned below this level.
Alibaba called off its much-expected cloud division spin off this week because the company serves Chinese tech and AI companies and needs advanced chips – the kind of chips that Nvidia makes – to compete with Amazon Web Services, or Microsoft’s Azure. And with the US chip export ban looming, it’s certainly not the best timing to take on a new challenge. Investors are not ready to go back to Chinese tech names in the middle of a chip war between the US and China.
FX and commodities
The US dollar index held ground at the 100-DMA, but remains offered near the major 38.2% Fibonacci retracement, as the softening Fed expectations increase bets against the greenback. The EURUSD consolidates gains after being propelled into the medium-term bullish consolidation zone. Earlier this week, the EU revised its 2023 growth forecast for Europe down to 0.6%, but it said that it sees growth return to the old continent by next year. Even Germany, which is suffering from a severe economic slowdown, could grow. Recession or not, the European Central Bank (ECB) is not expected to cut its interest rates until, at least, July next year. The ECB’s slight hawkish note could support a further rise to the 1.10 mark. Cable, on the other hand, returned below its 200-DMA after a softer-than-expected inflation report released earlier this week revived the Bank of England (BoE) doves as well.
In commodities, gold surfs on falling yields and high tensions in the Middle East. The yellow metal extended its gains to $1988 yesterday but should see resistance into the $2000 level in the absence of any major news.
American crude sank to $72pb yesterday, after having tested and failed to clear the $78/80 resistance earlier this week. The 3.6-mio-barrel increase in the US inventories last week served as a good excuse to sell the top, along with the rising worries of global slowdown. No one cares about the Middle East carnage or OPEC cuts. At the current levels, oil is oversold, and we could see another correction attempt, but gains will likely remain limited.
Could OPEC do anything about it? Yes, but not now. The market focus has heavily shifted to the weakening demand outlook from tightening supply If Saudi announces further supply cuts, and if the market doesn’t react, its finances will take a bigger hit. As such, the selloff could extend below the $70 mark. Key support stands at $63.50, the May dip.
Oil Trading Heavy
Market movers today
In Sweden, the October LFS labour market report will give some clues about the severity of underlying trends in the labour market. Recent seasonally adjusted data shows a drop in employment, a corresponding rise in unemployed people while at the same time there was a decline in the non-labour force. This suggests that at least partially, a rising number of job seekers may be the reason for the rise in the unemployment rate rather than it being a direct consequence of firms starting to shed work force to protect profits.
In the euro area, we get the final version of the already published October inflation (2.9% y/y for core HICP). There are rarely significant revisions, but we will get more details on the drivers.
ECB President Lagarde will give a keynote speech at the Frankfurt European Banking Congress.
US housing starts and building permits data for October are due. This is interesting to watch for signs that high interest rates are finally dampening housing investment, although that is not the expectation for today.
San Francisco Fed President Daly speaks. She is not a voter on the FOMC currently but will be in 2024.
The 60 second overview
Markets and economic data releases. The amount of market-moving news out yesterday was generally quite limited. Yields fell after the release of higher-than-expected US claims data and worse-than-expected industrial production figures in the afternoon, while the upbeat Philly-Fed for November received less market attention.
Michael Barr, vice chair for supervision at the Fed, in a speech yesterday warned about the basis trade in the treasury market, which has risen substantially in size since the turn of the year. Barr warned about the risks of the treasury market functioning due to the high degree of leverage that hedge funds typically apply in the trade.
In Europe, ECB chief Lagarde expressed some caution on the outlook for financial stability in the Eurozone, as higher funding costs and lower lending volumes are gradually putting more pressure on the banking sector. Additionally, policymakers should pay extra attention to the impact on non-performing loans stemming from the combination of weak growth and higher rates.
Oil. Oil prices dropped yesterday and Brent slipped back below USD 80/bbl. More weak US data put an end to the rebound at the beginning of the week. As we have noted before, we think oil prices could potentially be a bellwether for a deterioration of global aggregate demand. The fact that a weaker USD, geopolitical risk and low OPEC+ production has failed to keep up oil prices supports this view. If the sell-off continues we will keep a watch-out for comments from Saudi Arabia about a further extension of the 1mb/d voluntary output cut, and from the US about resumption of buying of oil for its strategic reserves. Both factors would help floor oil prices.
FI: Global yields drifted gradually lower in yesterday's session, reversing Wednesday's move up. The Bund curve bull-steepened, with the 10Y tenor declined by 6bp throughout the day. The move was quite gradual for most of the day, but the weaker-than-expected US claims data accelerated the move in the afternoon. The 10Y BTP-Bund spread ended down by 3bp at 175bp, the lowest level since the end of August. The 5y5y EUR inflation swap rate continued declining in line with energy prices throughout the day. The current 2.36% is the lowest level seen since the end of March. Long UST yields were down by 8bp throughout the session.
Equities calmed on Thursday. Yields lower was not enough to trigger further buying, but US closed up a mild 0.1% while Europe pulled back -0.7%. We see this breather as good news as volatility comes down. However, pundits may claim that this is the start of weak data no longer being perceived as good news, as it was weakening job data that triggered the rebound lower in yields. The best performers lately retreated, including small caps or regional banks. Quality sectors outperformed, including utilities, tech and communication. Value cyclicals were at the bottom. US futures are unchanged this morning.
FX: Oil and commodity currencies have come under renewed pressure amid the decline in oil and commodity prices broadly. Especially NOK traded heavy in yesterday's session with EUR/NOK back close to the 11.90 mark. EUR/USD ended the session at close to unchanged levels after having surged on weaker US data releases. EUR/GBP hovers around the 0.8750 mark while USD/JPY has fallen back a full figure to 150.50.
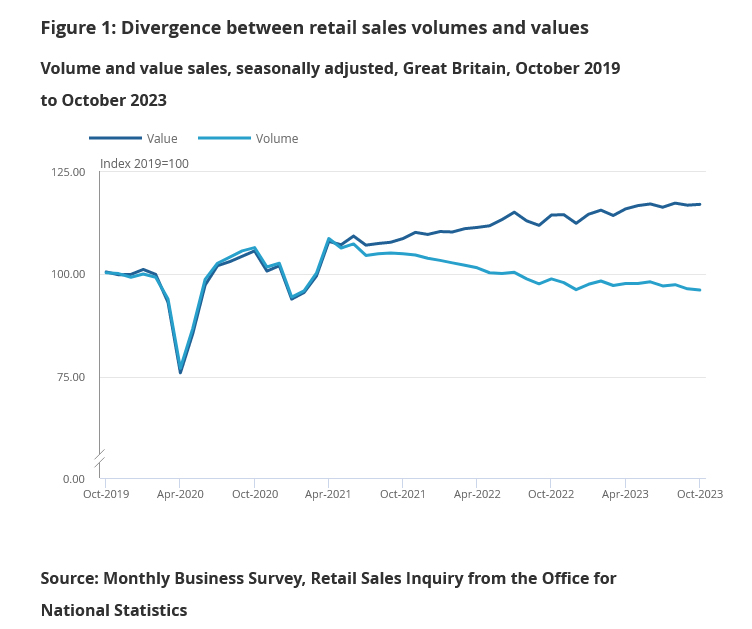
UK retail sales volume down -0.3% mom in Sep, sales value down up 0.1% mom
UK retail sales volume fell -0.3% mom in September, much worse than expectation of 0.3 mom rise. Ex-automotive fuel sales volume fell -0.1% mom.
Looking broader, sales volumes (include and excluding fuel) fell by -1.1% in the three months to October 2023 when compared with the previous three months.
In value term, retail sales rose 0.1% mom while ex-fuel sales was flat 0.0% mom.
USD/CHF Daily Outlook
Daily Pivots: (S1) 0.8837; (P) 0.8933; (R1) 0.8988; More....
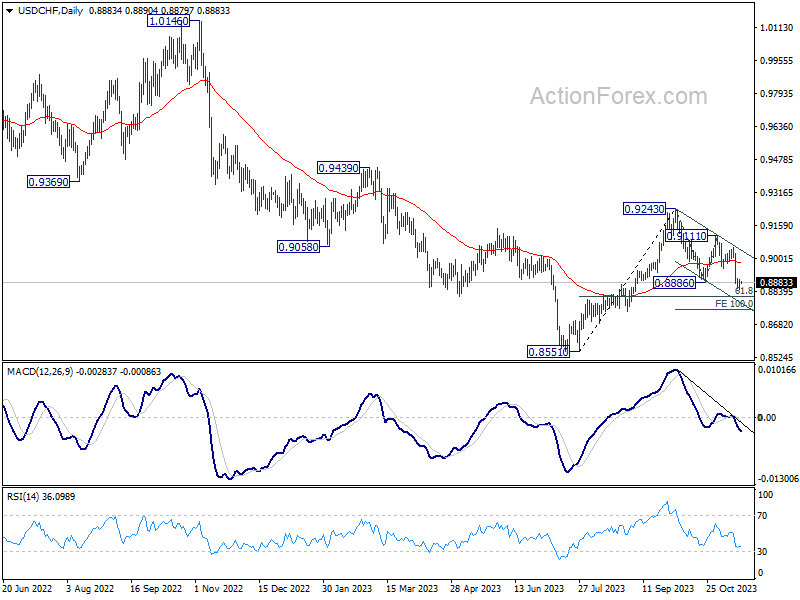
A temporary low is formed at 0.8853 and intraday bias in USD/CHF is turned neutral for consolidations. Stronger recovery cannot be ruled out. But upside should be limited by 0.8952 support turn resistance to bring another fall. Break of 0.8852 will resume the decline from 0.9243 to 100% projection of 0.9243 to 0.8886 from 0.9111 at 0.8754.
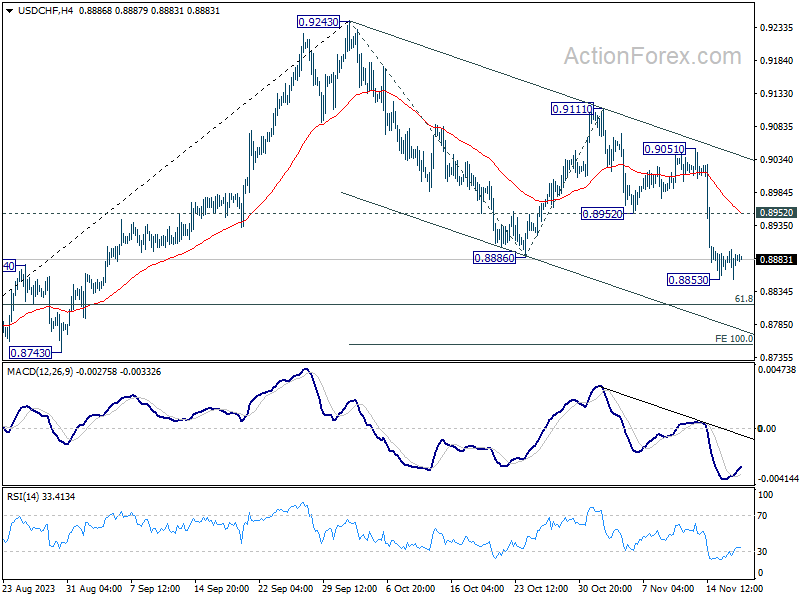
In the bigger picture, price actions from 0.8551 are currently seen as a correction to the decline from 1.0146. Fall from 0.9243 is seen as the second leg for now. Deeper fall would be seen to 61.8% retracement of 0.8551 to 0.9243 at 0.8815. Sustained break there will bring retest of 0.8551 low. For now, this will remain the favored case as long as 0.9111 resistance holds.
Forex Markets in a Lull, Gold Extending Rally, Oil Tumbles
As the trading week draws to a close, the forex markets are experiencing a period of relative calm in today's Asian session. Key developments include Euro's attempted resurgence against Dollar overnight, which, despite initial signs of a rally, lost its momentum and settled back into familiar range. This pattern of indecisiveness is mirrored by Swiss Franc, which, after a period of gains against Dollar, is now in a similar phase of consolidation, aligning with other European majors. Commodity currencies displaying a softer stance overall. However, Australian Dollar stands out for its resilience.
For the week, Dollar remains the weakest performer overall. However, it's noteworthy that Dollar is managing to stay above the previous week's low against most currencies, except for Euro and Swiss Franc. This observation suggests that Dollar is still in the process of digesting its recent losses. Canadian Dollar and Japanese Yen follow as the next weakest, whereas Australian Dollar stands out as the strongest for the week. However, Aussie's position is somewhat precarious, as it hasn't surpassed last week's high against other rivals, indicating a lack of strong buying momentum. Euro and the British Pound are trailing as the next strongest, while Swiss Franc shows mixed performance.
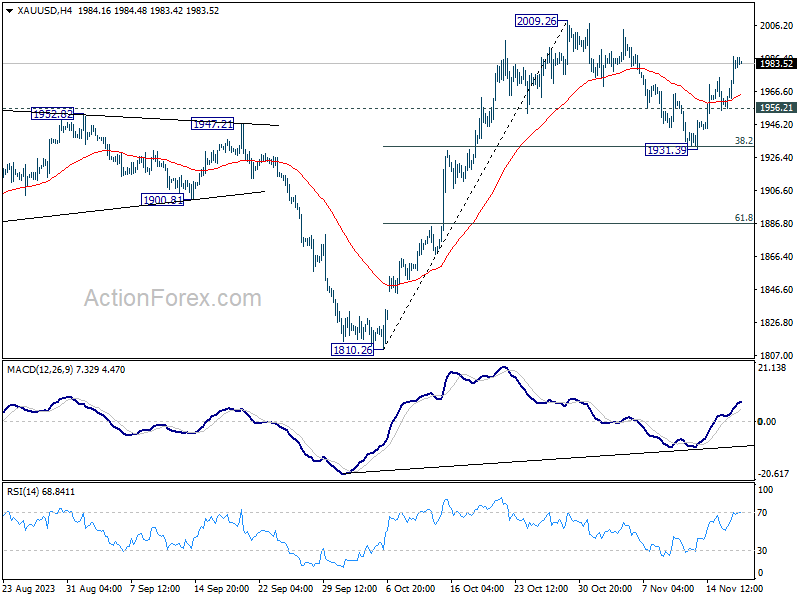
Technically, Gold's rally from 1931.39 is still in progress. Correction from 2009.26 should have completed after drawing support from 38.2% retracement of 1810.26 to 2009.26 at 1933.24. Further rise is expected as long as 1956.21 support holds. Retest of 2009.26 should be seen next. Firm break there will resume whole rally from 1810.26 to key resistance zone at 2062/74.
In Asia, Nikkei closed up 0.48%. Hong Kong HSI is down -1.98%. China Shanghai SSE is down -0.03%. Singapore Strait Times is down -0.39%. Japan 10-year JGB yield is down -0.030 at 0.761. Overnight, DOW dropped -0.13%. S&P 500 rose 0.12%. NASDAQ rose 0.07%. 10-year yield dropped -0.090 to 4.445.
Fed's Cook: Soft landing is possible but not assured
Fed Governor Lisa Cook addressed the delicate balance between sustaining economic growth and managing inflation in her conference remarks overnight. Cook acknowledged the possibility of achieving a "soft landing" for the US. economy, highlighting the ongoing disinflationary trends and robust labor market conditions. However, she was quick to note that such an outcome is not guaranteed.
"A 'soft landing' is possible, with continued disinflation and a strong labor market, but it is not assured," Cook stated. She elaborated on the complexities noting, "I see risks as two-sided, requiring us to balance the risk of not tightening enough against the risk of tightening too much."
She also pointed out the current economic resilience, saying, "The economy is still growing and consumers are still spending," which could potentially maintain demand-driven pressures in the market. Such momentum, according to Cook, could keep the economy and labor market tight, consequently slowing the disinflation process.
However, Cook also expressed concern over the potential negative impacts of aggressive policy measures, adding, "But I am also attuned to the risk of an unnecessarily sharp decline in economic activity and employment."
Mester's perspective from Fed's crow's nest: Disinflation progress made, yet more evidence needed
In a CNBC interview overnight, Cleveland Fed President Loretta Mester acknowledged, "We're making progress on inflation, discernible progress. We need to see more of that."
But she also highlighted the necessity of observing more concrete data to confirm that inflation is indeed on a timely path back to the desired level.
In her metaphorical reference to the "crow's nest", a vantage point on a ship used for spotting distant objects, Mester likened Fed's current position.
"We're at the crow's nest. What does the crow's nest let you do? It lets you look out on the horizon and see where the data is coming in, where the economy is evolving."
As for her personal stance on the direction of monetary policy, "I haven't assessed that yet. Where I think we are right now is we're basically in a very good spot for policy."
BoE's Ramsden signals extended period of restrictive monetary policy ahead
BoE's Deputy Governor Dave Ramsden emphasized the need for a prolonged phase of restrictive monetary policy to achieve the central bank's inflation target. Speaking on the future direction of the BoE's approach, Ramsden stated, "Monetary policy is likely to need to be restrictive for an extended period of time."
Ramsden further elaborated on the Monetary Policy Committee's stance, noting, "The MPC have communicated that monetary policy will need to be sufficiently restrictive for sufficiently long to return inflation to the 2% target sustainably in the medium term."
Additionally, Ramsden, who oversees BoE's quantitative tightening program, discussed the uncertainty surrounding the optimal size of the central bank's balance sheet. The ongoing assessment of the necessary reserves supply aims to meet both monetary policy objectives and ensure financial stability.
"We continue to work towards assessing what our future steady state reserves supply looks like, both to meet our monetary policy objectives through quantitative tightening, while ensuring our financial stability objective is also supported," he explained.
BoJ's Ueda reiterates patience in maintaining ultra-loose policy
BoJ Governor Kazuo Ueda has once again underscored the central bank's commitment to maintaining its ultra-loose monetary policy, emphasizing the need for patience in the face of uncertain inflation dynamics.
Speaking to the parliament, Ueda noted, "Trend inflation is likely to gradually accelerate toward our 2% inflation target through fiscal 2025. But this needs to be accompanied by a positive wage-inflation cycle."
"Uncertainty on whether Japan will see such a positive wage-inflation cycle is high," he added.
Addressing the behavior of 10-year JGB yields, Ueda expressed that he does not foresee a sharp rise above the 1% reference level, even under upward pressure.
Looking ahead, Ueda clarified the bank's position on potentially ending its Yield Curve Control and negative interest rate policies, stating, "We will consider ending YCC, negative rate if we can expect inflation to stably, and sustainably hit the price target."
He added that the order of adjustments to the policy would be contingent on various factors, including economic conditions, price movements, and market developments.
WTI crude oil nosedives to four-month low, more downside ahead
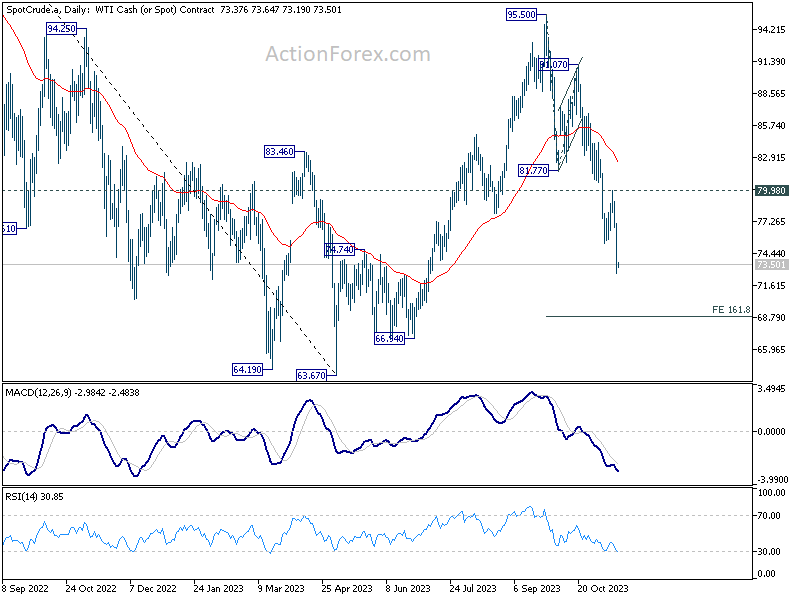
WTI crude oil experienced a significant tumble this week, dropping around -5% yesterday and reaching its lowest point in four months, marking a trajectory for its fourth consecutive week of decline. This marks the commodity's potential fourth consecutive week of decline.
Despite OPEC and IEA's predictions of supply tightness in Q4, a confluence of disappointing global economic data and a surge in US crude inventories, coupled with sustained record-level production, has fueled the sharp selloff.
From a technical analysis perspective, the bearish sentiment was cemented earlier this week when WTI failed to reclaim psychological level. The ongoing decline from 95.50 is now expected to continue to 161.8% projection of 95.50 to 81.77 from 91.07 at 68.85. However, we anticipate significant support emerging in 63.67/66.94 support zone, which to trigger reversal.
Overall, WTI is seen as encapsulated in a long-term range-bound pattern, oscillating between the 63/64 and 95/96 zones.
Looking ahead
UK retail sales is the main highlight in European session, while Eurozone will release CPI final. Later in the day, Canada will release IPPI and RMPI. US will release building permits and housing starts.
USD/CHF Daily Outlook
Daily Pivots: (S1) 0.8837; (P) 0.8933; (R1) 0.8988; More....
A temporary low is formed at 0.8853 and intraday bias in USD/CHF is turned neutral for consolidations. Stronger recovery cannot be ruled out. But upside should be limited by 0.8952 support turn resistance to bring another fall. Break of 0.8852 will resume the decline from 0.9243 to 100% projection of 0.9243 to 0.8886 from 0.9111 at 0.8754.
In the bigger picture, price actions from 0.8551 are currently seen as a correction to the decline from 1.0146. Fall from 0.9243 is seen as the second leg for now. Deeper fall would be seen to 61.8% retracement of 0.8551 to 0.9243 at 0.8815. Sustained break there will bring retest of 0.8551 low. For now, this will remain the favored case as long as 0.9111 resistance holds.
Economic Indicators Update
| GMT | Ccy | Events | Actual | Forecast | Previous | Revised |
|---|---|---|---|---|---|---|
| 21:45 | NZD | PPI Input Q/Q Q3 | 1.20% | 0.20% | -0.20% | |
| 21:45 | NZD | PPI Output Q/Q Q3 | 0.80% | 0.40% | 0.20% | |
| 07:00 | GBP | Retail Sales M/M Oct | 0.30% | -0.90% | ||
| 09:00 | EUR | Eurozone Current Account (EUR) Sep | 20.3B | 27.7B | ||
| 10:00 | EUR | Eurozone CPI Y/Y Oct F | 2.90% | 2.90% | ||
| 10:00 | EUR | Eurozone CPI Core Y/Y Oct F | 4.20% | 4.20% | ||
| 13:30 | CAD | Industrial Product Price M/M Oct | 0.20% | 0.40% | ||
| 13:30 | CAD | Raw Material Price Index Oct | -2.00% | 3.50% | ||
| 13:30 | USD | Building Permits Oct | 1.45M | 1.47M | ||
| 13:30 | USD | Housing Starts Oct | 1.36M | 1.36M |
Technical Outlook and Review
DXY:
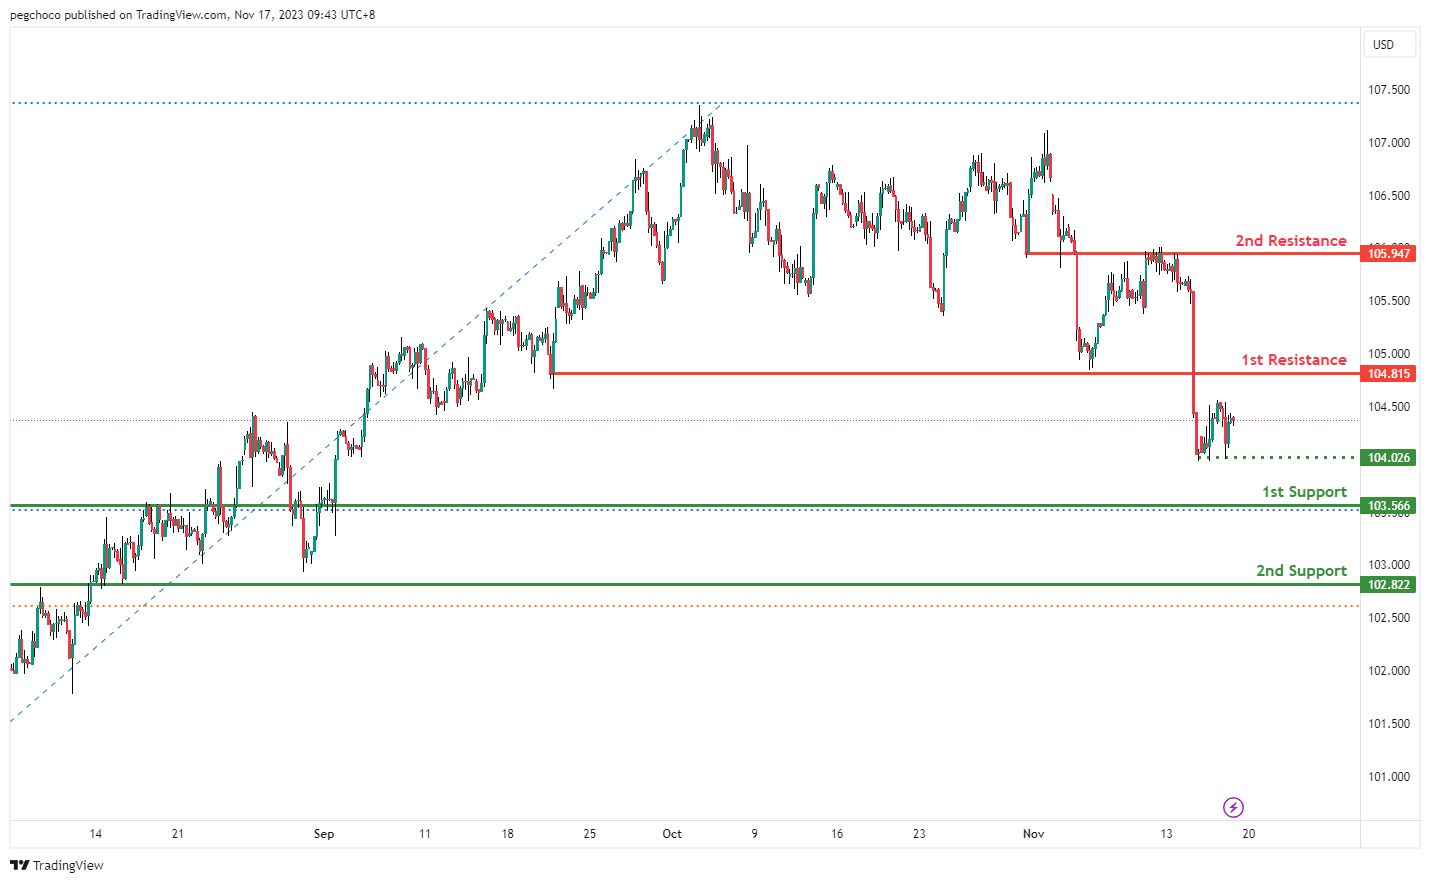
The DXY chart currently has a bearish overall momentum, but there is a potential for a bullish continuation towards the 1st resistance.
The 1st support at 103.56 is identified as an overlap support and also coincides with the 50% Fibonacci retracement level. This level suggests a potential area of support where buyers might step in or where a pause in the bearish movement could occur. The confluence of an overlap support and Fibonacci retracement level makes it a significant support level.
The 2nd support at 102.82 is another overlap support and coincides with the 61.80% Fibonacci retracement level. Similar to the 1st support, this level also indicates potential support and adds to the significance of this price zone.
On the resistance side, the 1st resistance at 104.81 is categorized as a pullback resistance. This level may act as a barrier to further upward movement and is an area where selling interest could potentially emerge.
The 2nd resistance at 105.94 is noted as an overlap resistance, suggesting potential selling pressure in this area.
Intermediate support at 104.02 is a multi-swing low support and could serve as an additional level to watch.
EUR/USD:
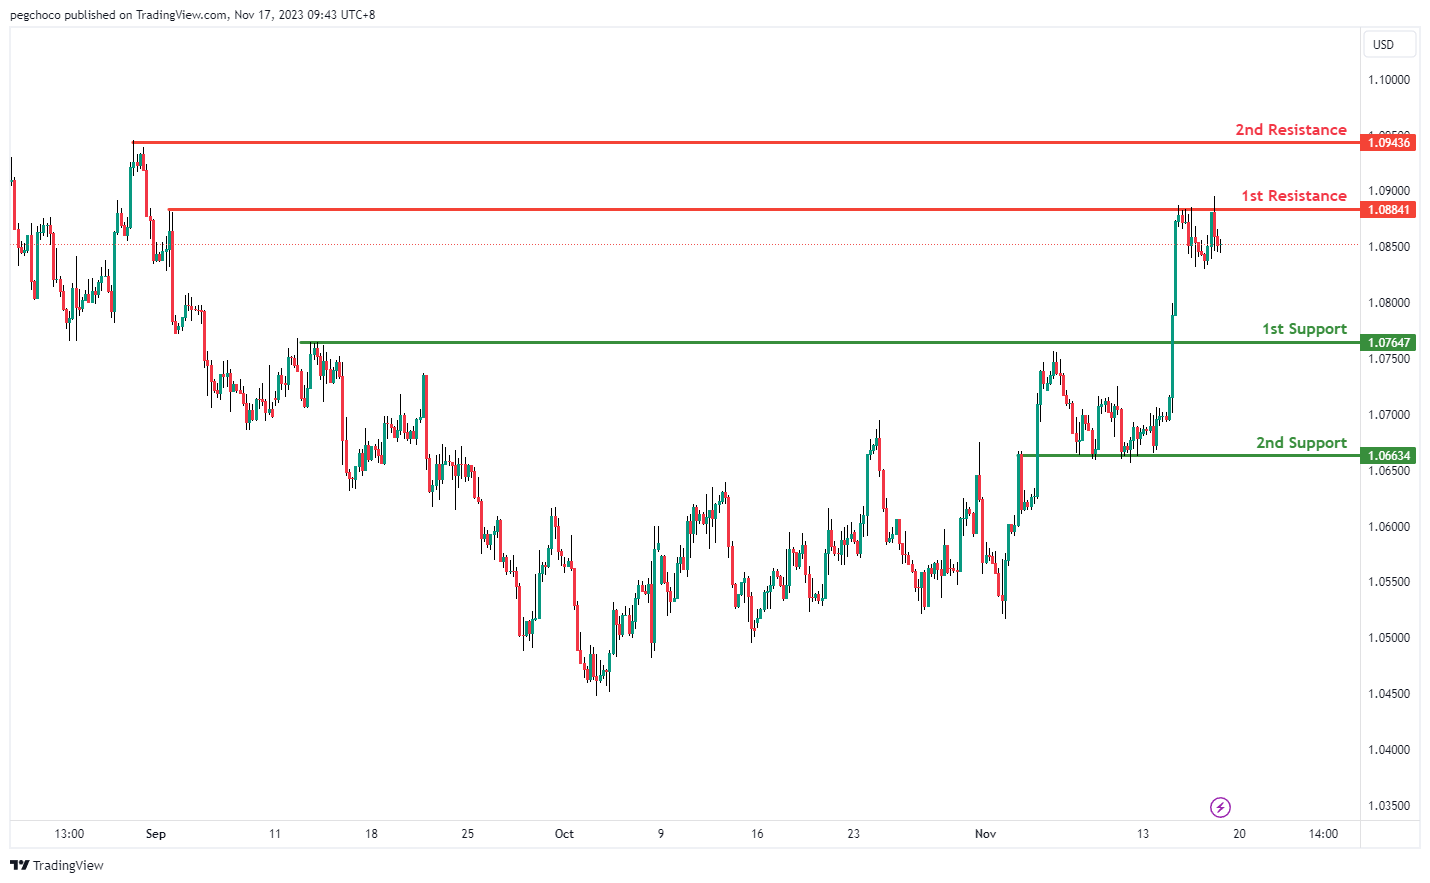
The EUR/USD chart currently has a bearish overall momentum, suggesting the potential for a bearish continuation towards the 1st support.
The 1st support at 1.0764 is identified as a pullback support. This level indicates a potential area where buyers might step in or where the bearish movement could find temporary support.
The 2nd support at 1.0663 is an overlap support. Overlap supports often carry significance as they represent areas where price has previously found support or resistance, making it a relevant support level.
On the resistance side, the 1st resistance at 1.0884 is categorized as a multi-swing high resistance. This level may act as a barrier to further upward movement and could be a point where selling interest emerges.
The 2nd resistance at 1.0943 is noted as a swing high resistance, further reinforcing its potential as a level where the price might encounter selling pressure.
EUR/JPY:
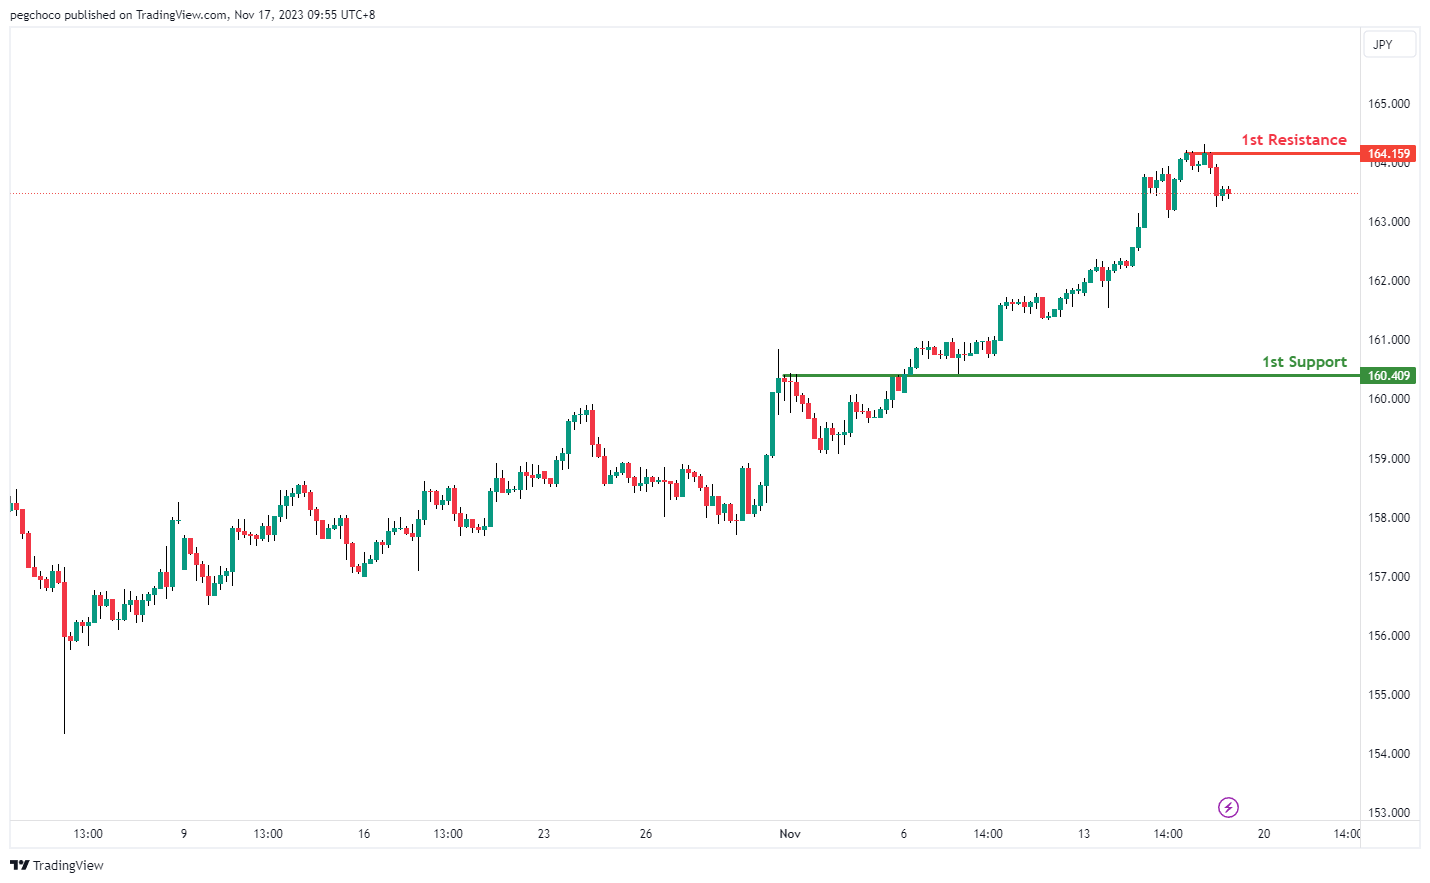
The EUR/JPY chart currently exhibits a bearish overall momentum, suggesting the potential for a bearish reaction off the 1st resistance level, followed by a drop towards the 1st support.
The 1st support at 160.40 is identified as an overlap support. This level may have historical significance as an area where buyers have previously shown interest, making it a relevant support level.
On the resistance side, the 1st resistance at 164.15 is categorized as a multi-swing high resistance. This suggests that it has historically acted as a barrier to further upward movements.
EUR/GBP:
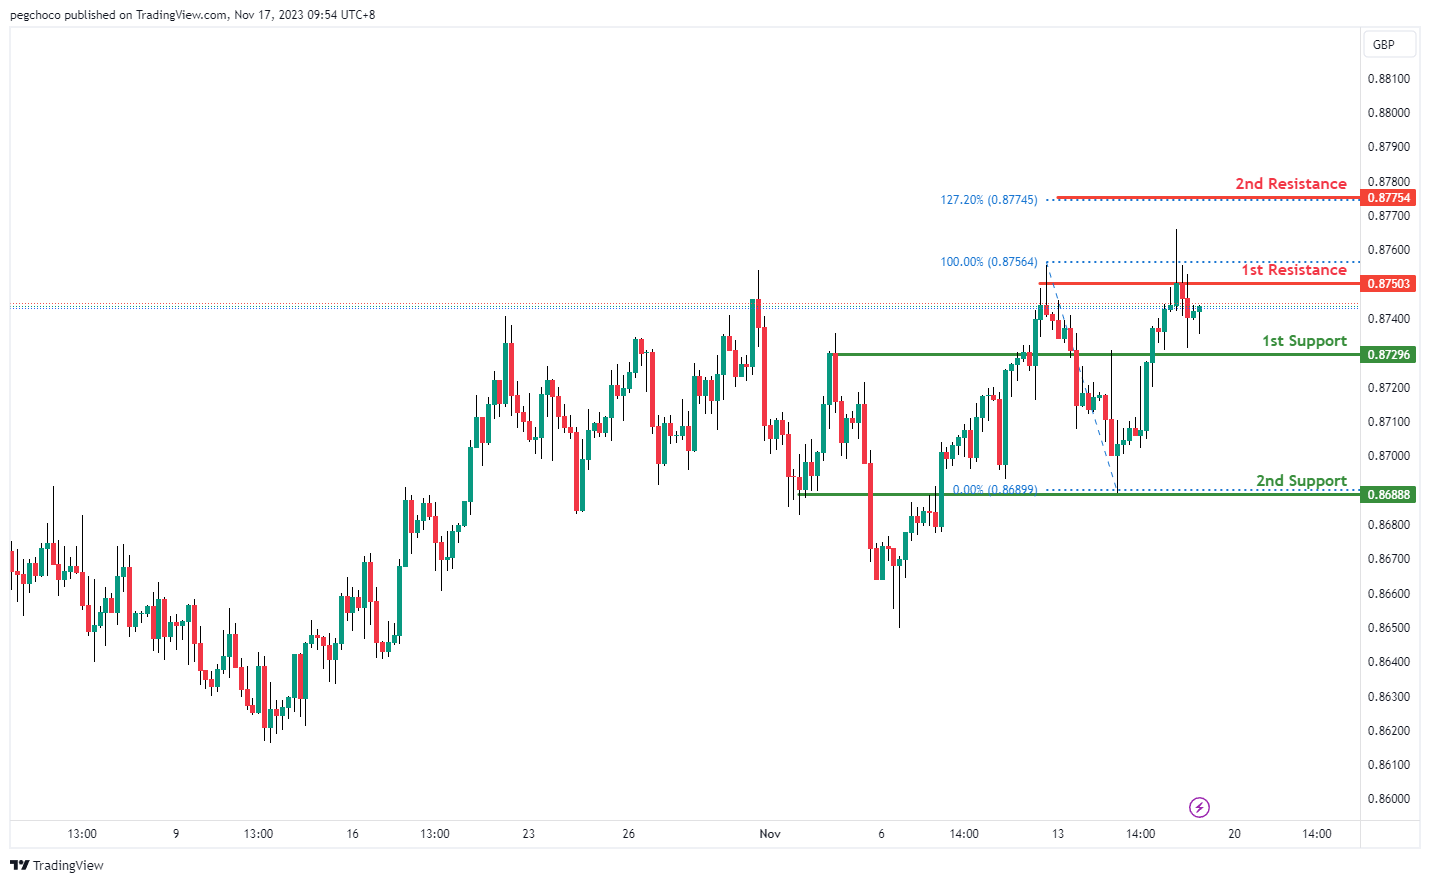
The EUR/GBP chart currently displays a bearish overall momentum, indicating the potential for a bearish reaction off the 1st resistance level, followed by a drop towards the 1st support.
The 1st support at 0.8729 is identified as an overlap support. This level has historical significance as an area where buyers have previously stepped in, making it a relevant support level.
The 2nd support at 0.8688 is another overlap support, reinforcing its potential as a support level. Multiple instances of price reacting at this level in the past suggest its importance.
On the resistance side, the 1st resistance at 0.8750 is categorized as a multi-swing high resistance, indicating that it has historically acted as a barrier to further upward movement.
The 2nd resistance at 0.8775 coincides with the 127.20% Fibonacci Extension level, indicating potential resistance based on Fibonacci analysis. This level adds another layer of significance to the resistance.
GBP/USD:
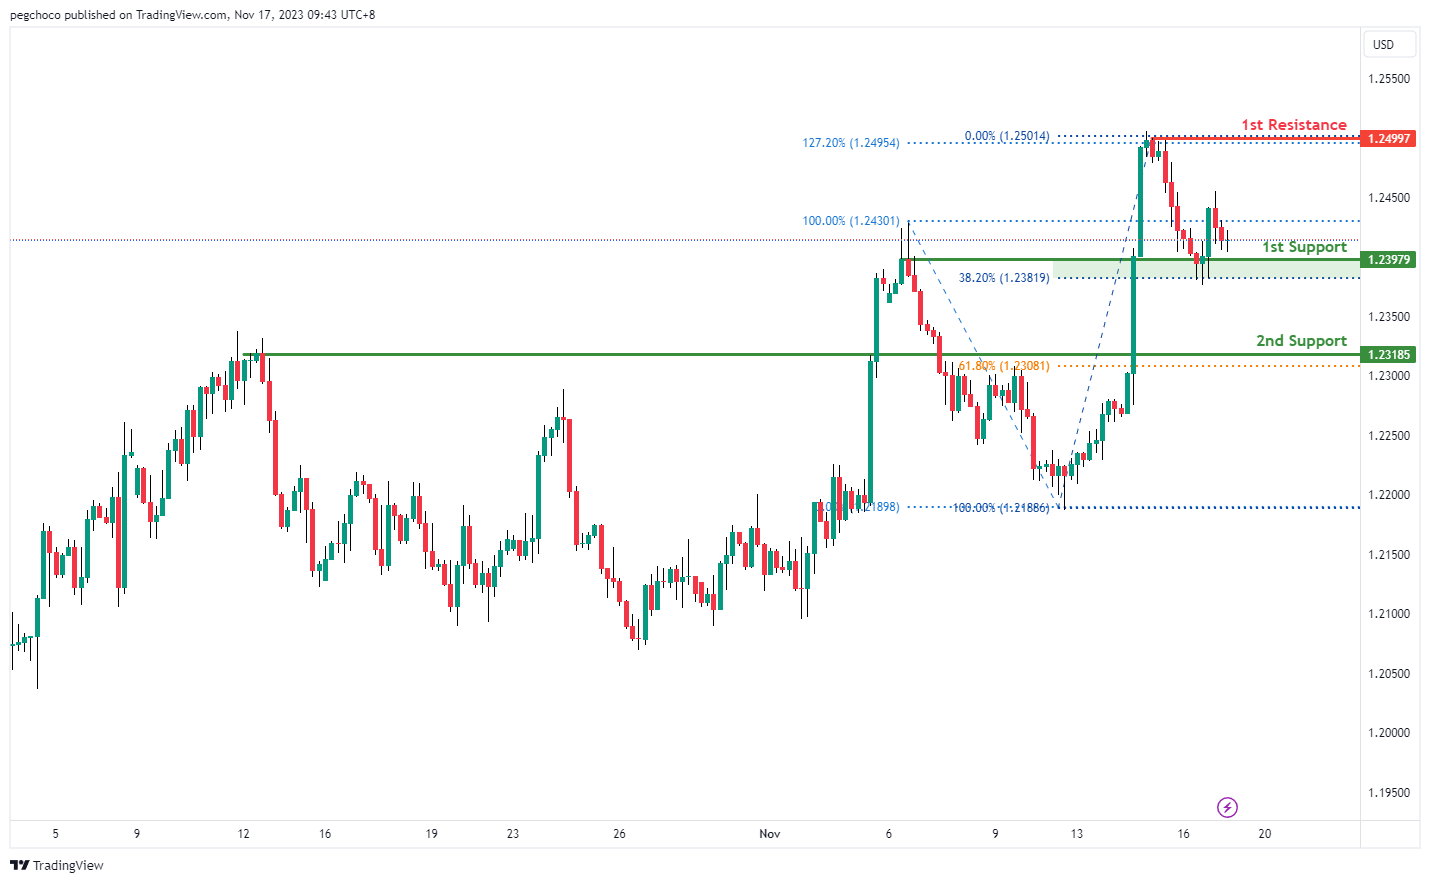
The GBP/USD chart currently has a bullish overall momentum, suggesting the potential for a bullish continuation towards the 1st resistance.
The 1st support at 1.23979 is identified as a pullback support and coincides with the 38.20% Fibonacci Retracement level. This confluence of support factors makes it a significant level where buyers may step in or where the bullish movement could find temporary support.
The 2nd support at 1.23185 is also a pullback support and coincides with the 61.80% Fibonacci Retracement level, adding to its significance as a potential support level.
On the resistance side, the 1st resistance at 1.2499 is categorized as a swing high resistance. This level, along with the 127.20% level, suggests that there could be selling interest in this area, potentially acting as a barrier to further upward movement.
GBP/JPY:
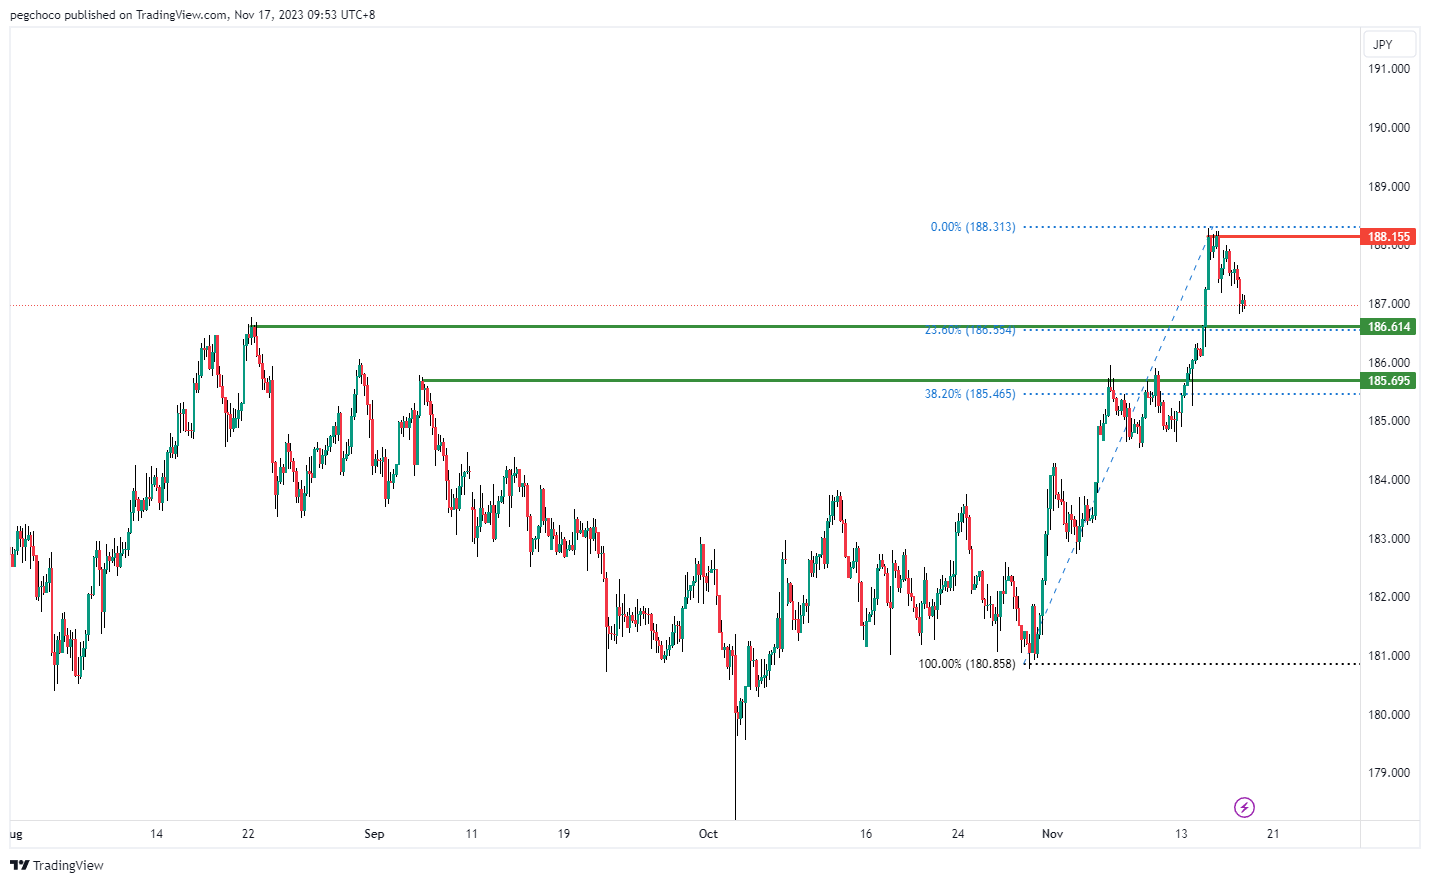
The GBP/JPY chart currently shows a bullish overall momentum, suggesting the potential for a bullish bounce off the 1st support and a move towards the 1st resistance level.
The 1st support at 186.61 is considered a pullback support and coincides with the 23.60% Fibonacci Retracement level. This level indicates a potential area of support where buyers may step in, and it aligns with a Fibonacci level, adding to its significance.
The 2nd support at 185.69 is another pullback support, and it aligns with the 38.20% Fibonacci Retracement level. This further reinforces its potential as a support level and suggests that it could act as a barrier against a significant downside move.
On the resistance side, the 1st resistance at 188.15 is categorized as a multi-swing high resistance, indicating a historical area where selling interest has been observed. Traders may anticipate some selling pressure in this area.
USD/CHF:
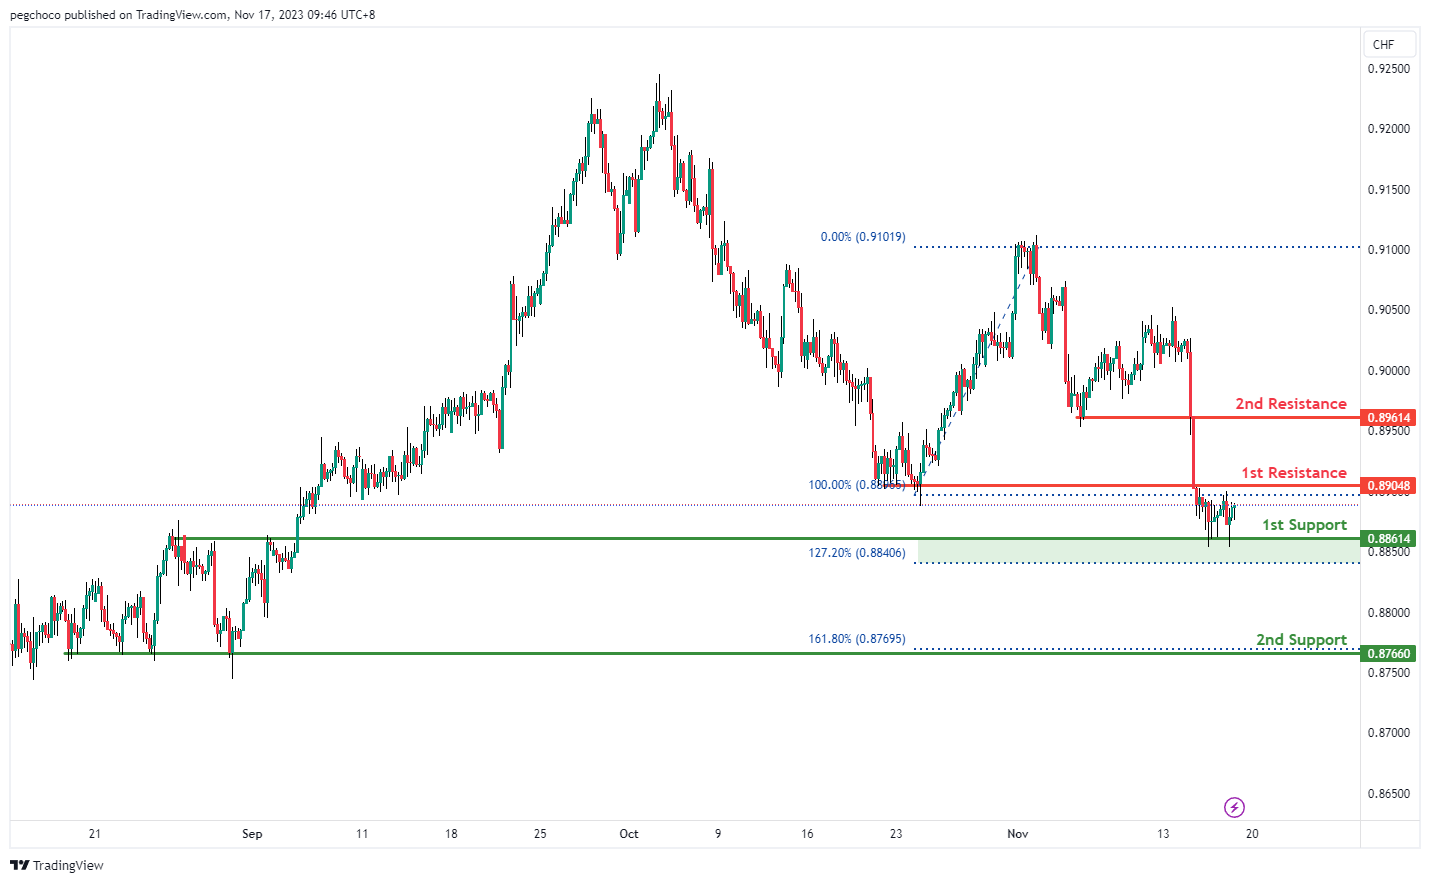
The USD/CHF chart currently exhibits a neutral overall momentum, suggesting potential price fluctuations between the 1st resistance and 1st support levels.
The 1st support level at 0.8861 is identified as a pullback support, and it also coincides with the 127.20% Fibonacci Extension level. This confluence of support factors indicates that there could be a significant level of support in this area, potentially attracting buyers or acting as a barrier to further downward movement.
The 2nd support level at 0.8766 is considered a multi-swing low support, which reinforces its potential as a support level. Multi-swing lows often signify areas where buyers have intervened in the past, making it a relevant support level.
On the resistance side, the 1st resistance at 0.8904 is categorized as a pullback resistance. This level could potentially act as a barrier to upward price movement, where sellers may step in or where the price could find resistance.
The 2nd resistance at 0.8961 is also a pullback resistance, further indicating a potential level of selling pressure in the USD/CHF chart.
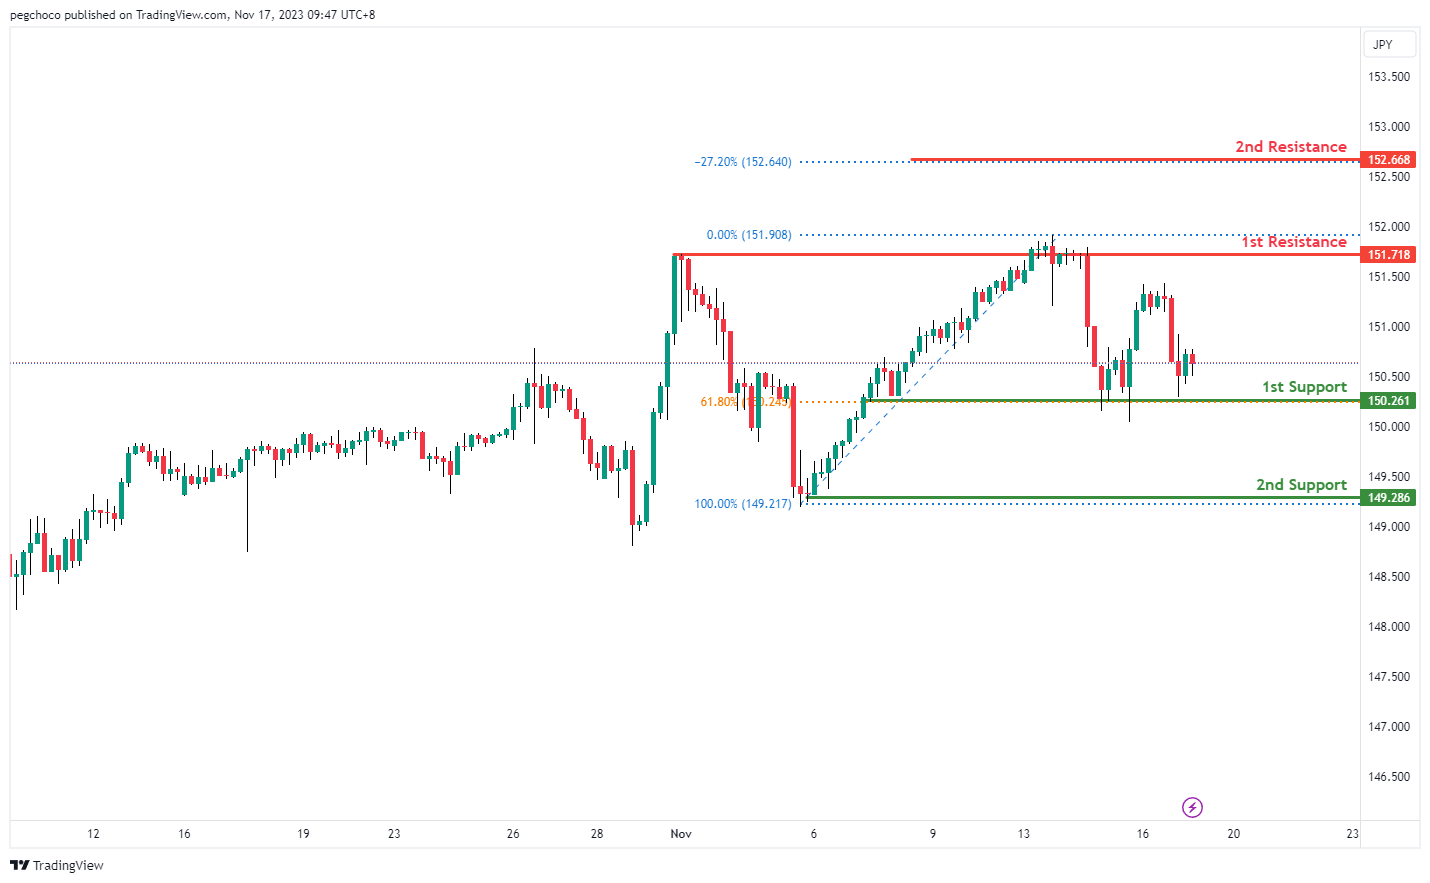
USD/JPY:
The USD/JPY chart currently displays a bullish overall momentum, indicating the potential for a bullish continuation towards the 1st resistance level.
The 1st support at 150.26 is identified as an overlap support, and it also coincides with the 61.80% Fibonacci Retracement level. This confluence of support factors suggests that there could be a significant level of support in this area, potentially attracting buyers or serving as a level where the bearish momentum may pause.
The 2nd support at 149.28 is considered a swing low support, further reinforcing its potential as a support level. Swing lows often represent areas where buyers have previously entered the market, making it a relevant support level.
On the resistance side, the 1st resistance at 151.71 is categorized as a multi-swing high resistance. This level may act as a barrier to upward price movement, where sellers may step in or where the price could encounter resistance.
The 2nd resistance at 152.66 is noted as a -27% Fibonacci Expansion level, which indicates a potential price projection beyond the previous high points. It could serve as an extended target if the bullish momentum continues.
USD/CAD:
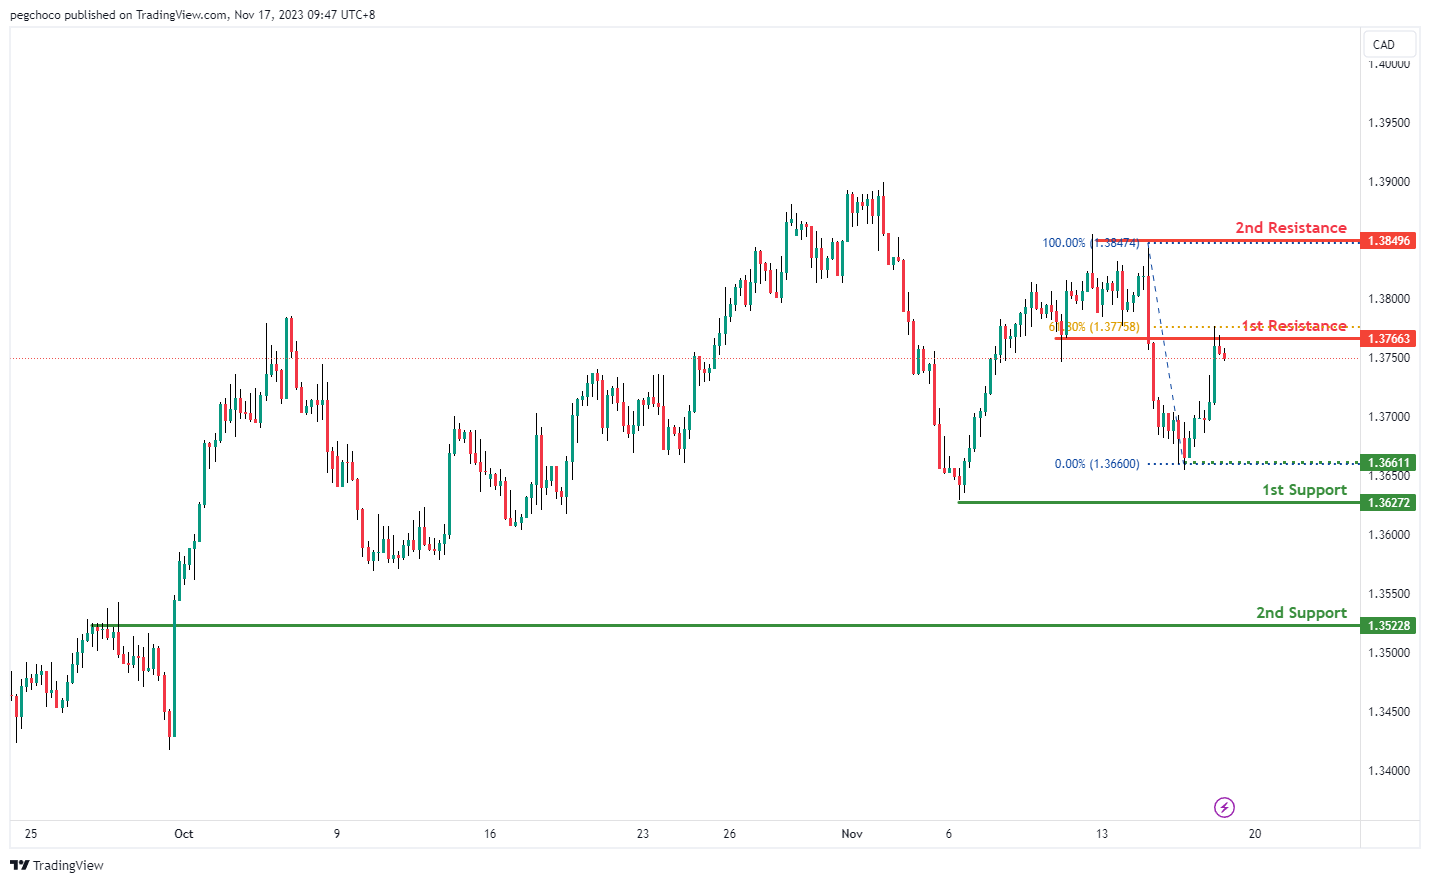
The USD/CAD chart currently exhibits a bearish overall momentum, indicating the potential for a bearish reaction off the 1st resistance level with a subsequent drop towards the 1st support level.
The 1st support at 1.3627 is identified as a swing low support. This level signifies a point where the price has previously found buying interest or reversed its bearish movement. Traders may expect this level to act as a potential area of support.
The 2nd support at 1.3522 is considered a pullback support. Pullback supports often indicate areas where buyers are likely to step in, further reinforcing the potential significance of this level as a support zone.
On the resistance side, the 1st resistance at 1.3766 is categorized as an overlap resistance. This level coincides with the 61.80% Fibonacci Retracement level, suggesting potential selling interest in this area and acting as a barrier to further upward movement.
The 2nd resistance at 1.3849 is noted as a swing high resistance. This level marks a point where the price has previously encountered selling pressure and reversed its direction.
AUD/USD:
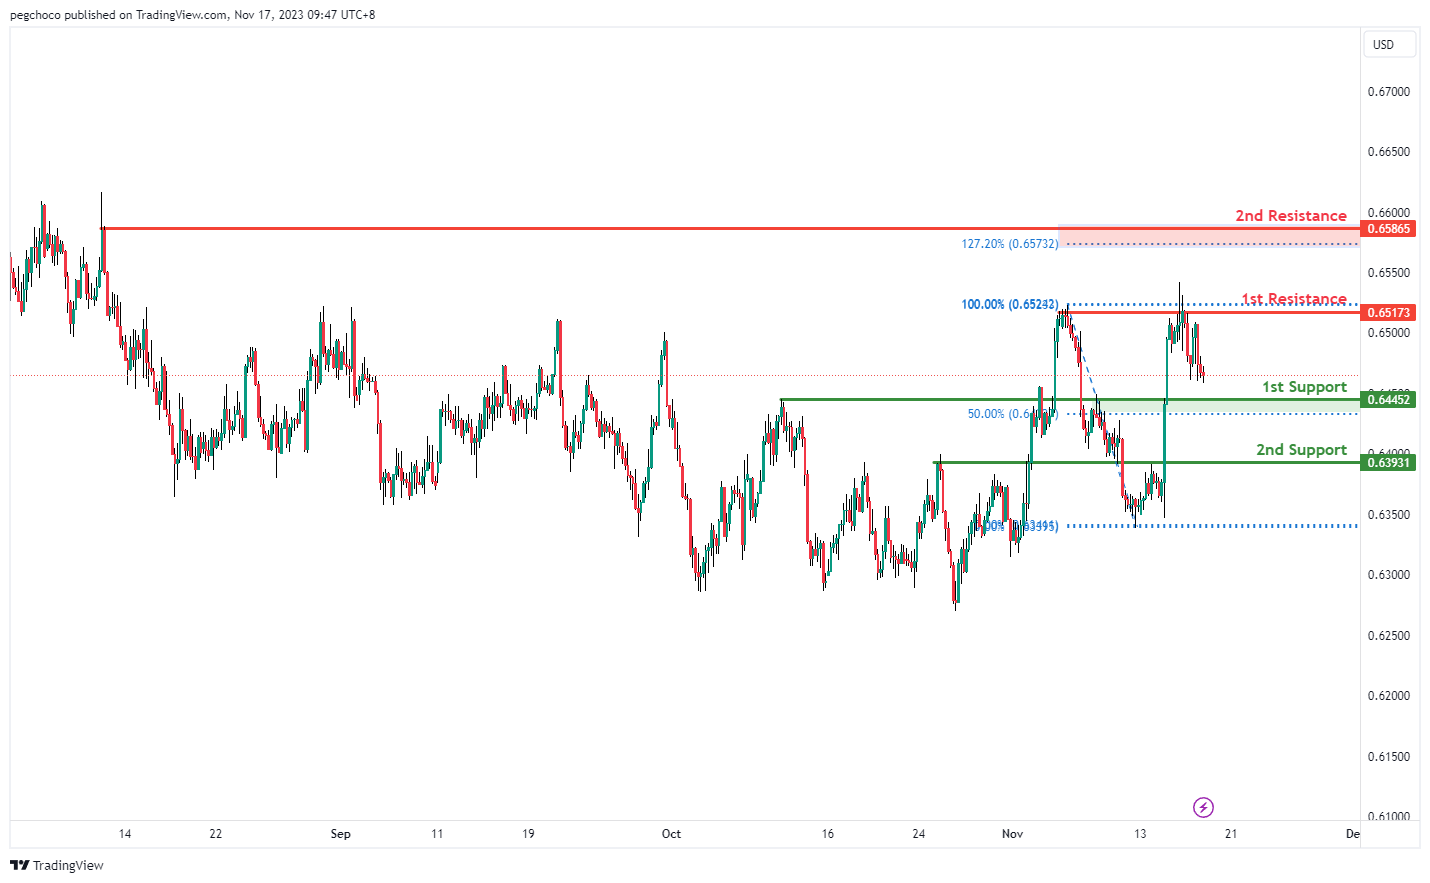
The AUD/USD chart currently shows a bearish overall momentum, suggesting the potential for a bearish continuation towards the 1st support level.
The 1st support at 0.6445 is identified as a pullback support, and it also coincides with the 50% Fibonacci Retracement level. This level indicates that there could be a significant level of support, and traders may expect the price to find buying interest or a pause in the bearish movement around this area.
The 2nd support at 0.6393 is considered a pullback support as well, further reinforcing its potential as a support level. Pullback supports often indicate areas where buyers have stepped in previously, making it a relevant support level.
On the resistance side, the 1st resistance at 0.6517 is categorized as a multi-swing high resistance. This level suggests that there could be selling interest in this area, potentially acting as a barrier to further upward movement.
The 2nd resistance at 0.6585 coincides with the 127.20% Fibonacci Retracement level and is also noted as a swing high resistance. This level further strengthens its significance as a resistance zone.
NZD/USD
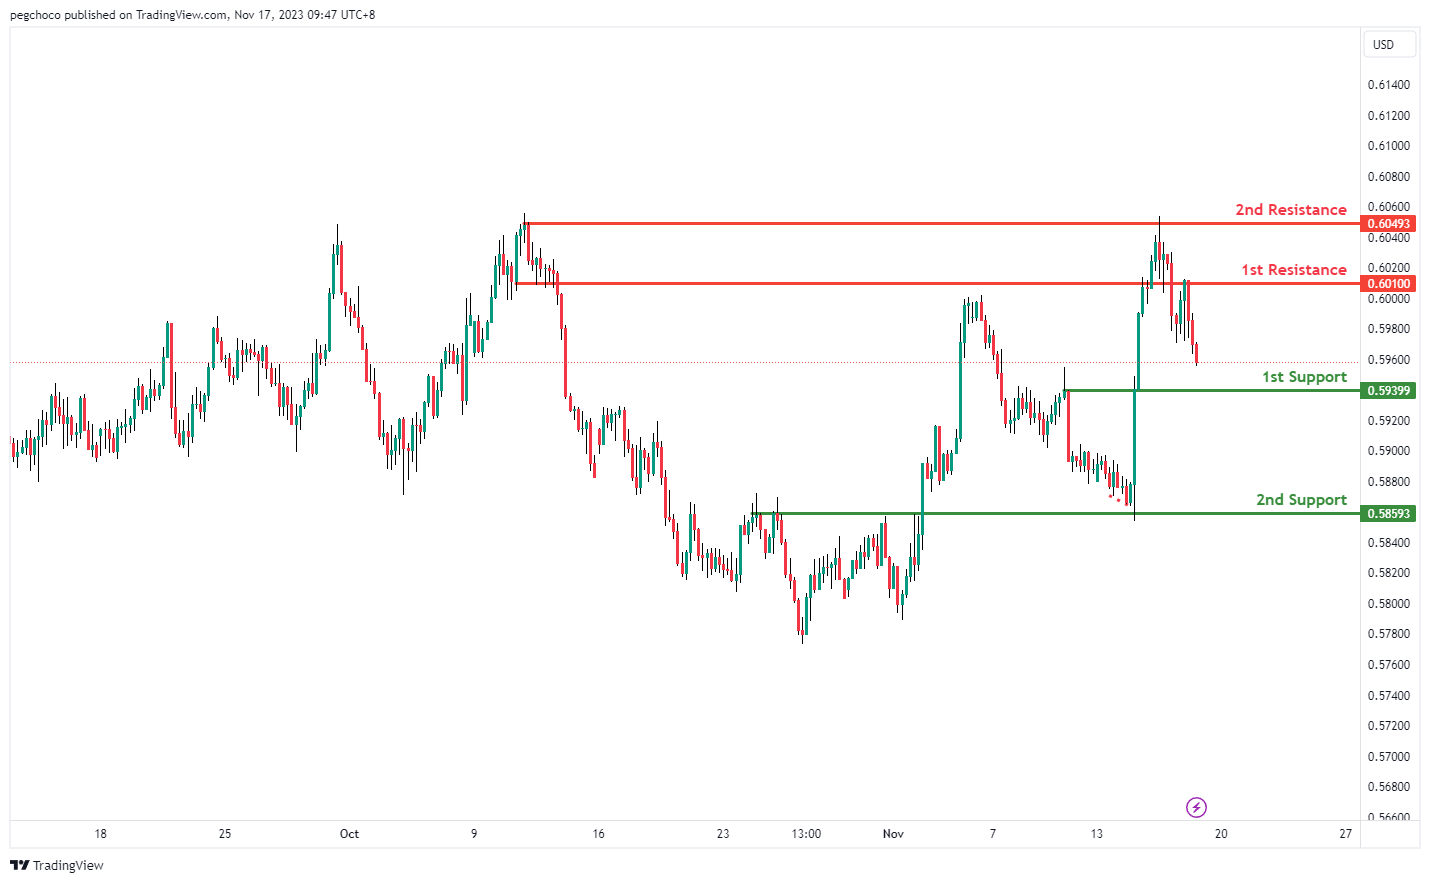
The NZD/USD chart currently exhibits a bearish overall momentum, indicating the potential for a bearish continuation towards the 1st support level.
The 1st support at 0.5939 is identified as a pullback support. This level suggests that there could be a significant level of support, potentially causing the price to find buying interest or experience a pause in its bearish movement around this area.
The 2nd support at 0.5859 is considered an overlap support, further reinforcing its potential as a support level. Overlap supports often indicate areas where buyers have intervened previously, making it a relevant support level.
On the resistance side, the 1st resistance at 0.6010 is categorized as an overlap resistance. This level could act as a barrier to further upward movement due to potential selling interest.
The 2nd resistance at 0.6049 coincides with a swing high resistance, making it another significant resistance zone.
DJ30:
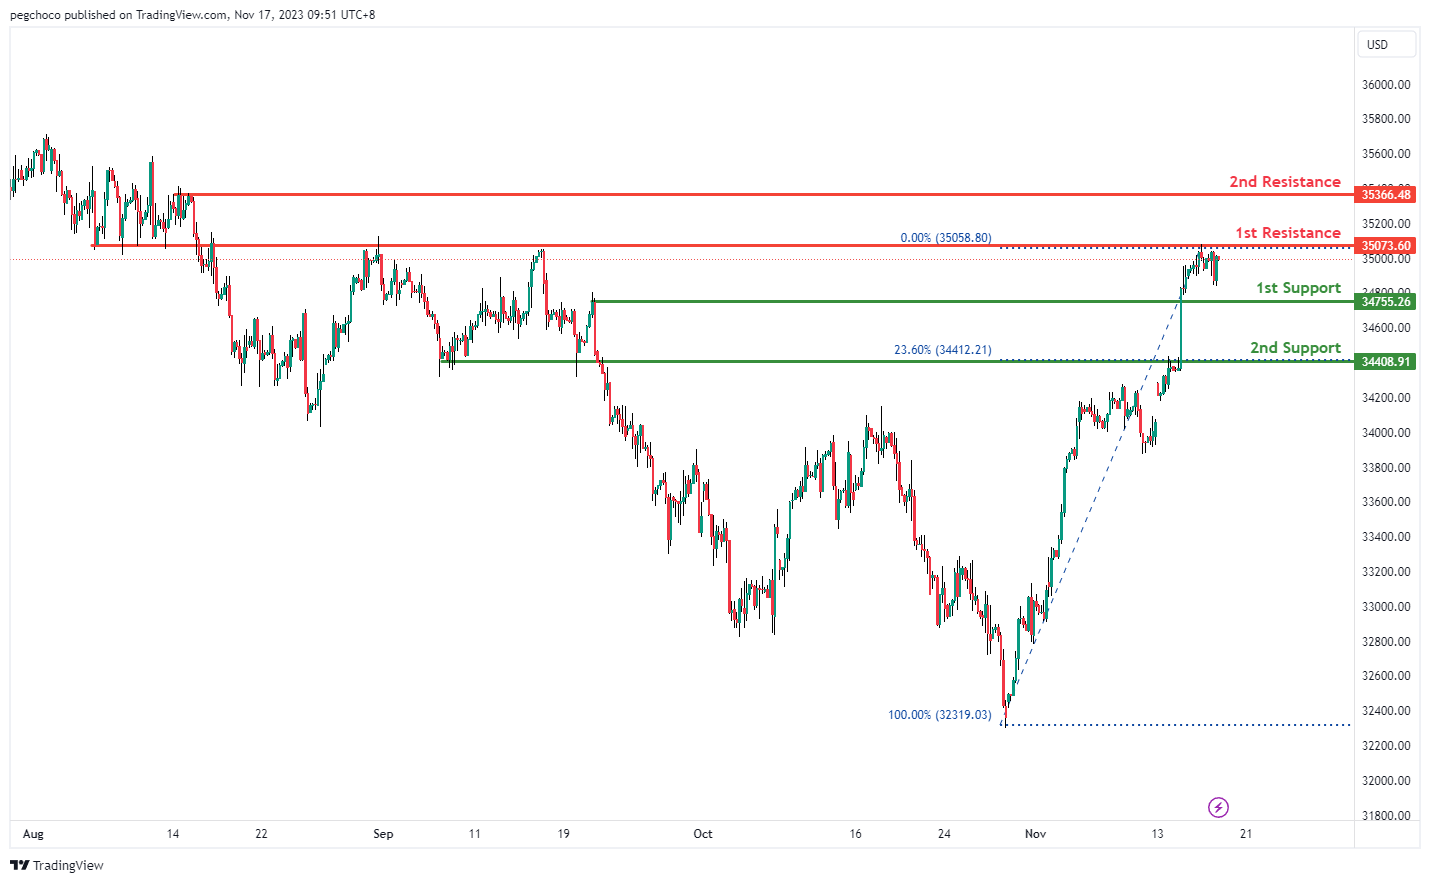
The DJ30 (Dow Jones 30) chart currently exhibits a neutral overall momentum, suggesting the potential for price to fluctuate between the 1st resistance and 1st support levels.
The 1st support at 34,755.26 is identified as a pullback support level, indicating that this area may have historical significance as a support zone.
The 2nd support at 34,408.91 coincides with the 23.60% Fibonacci Retracement level, making it another potential support level. Fibonacci retracement levels often act as relevant price areas.
On the resistance side, the 1st resistance at 35,073.60 is categorized as an overlap resistance, suggesting that there may be selling interest in this area, potentially acting as a barrier to further upward movement.
The 2nd resistance at 35,366.48 is considered a multi-swing high resistance, indicating another potential level where the price may encounter selling pressure.
GER40:
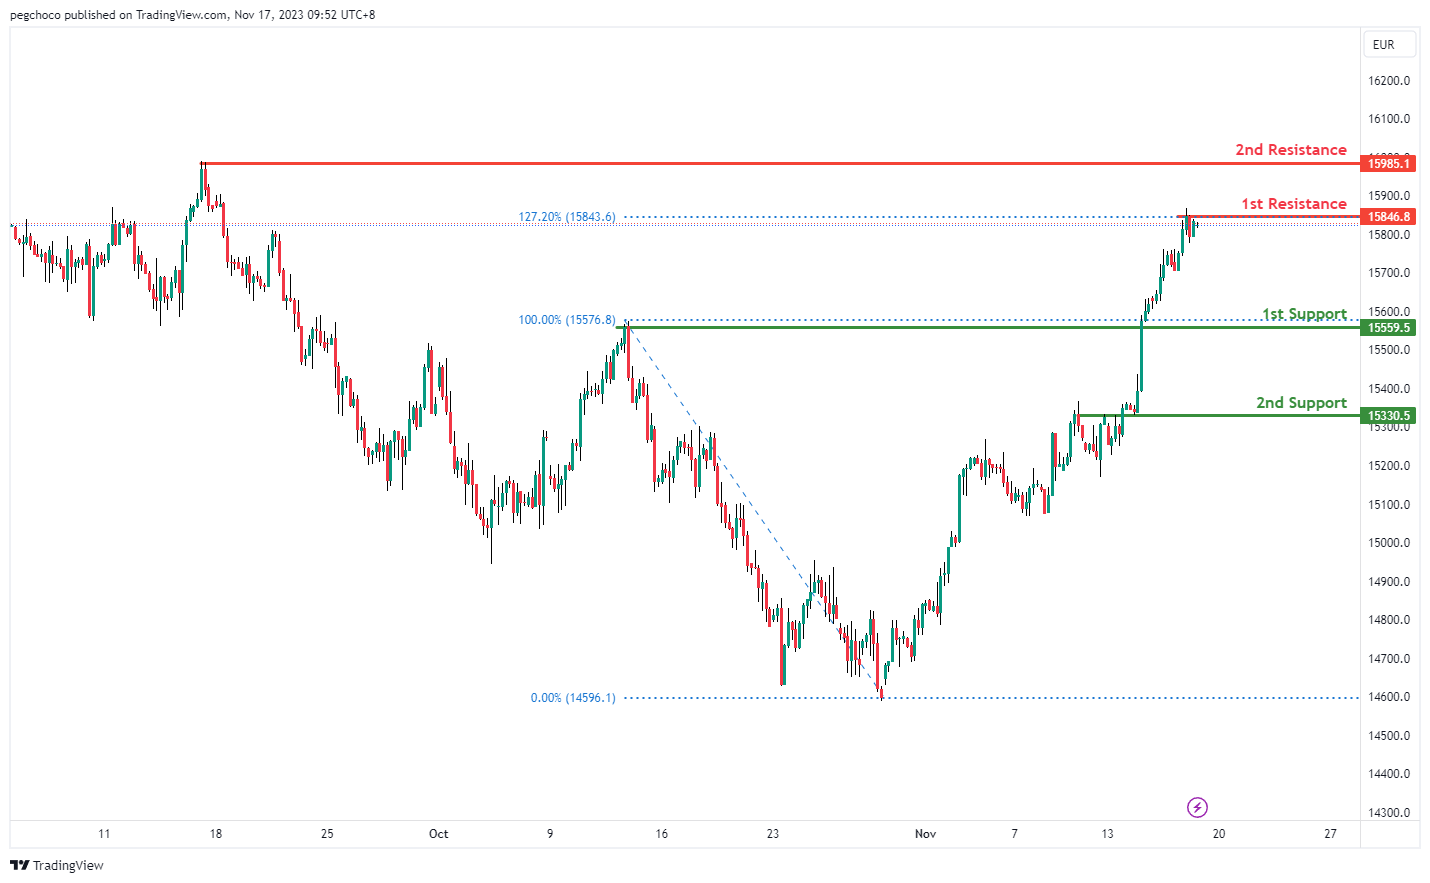
The GER40 chart currently has a bearish overall momentum, suggesting the potential for a bearish reaction off the 1st resistance level followed by a drop towards the 1st support.
The 1st support at 15,559.5 is considered a pullback support level, indicating that this area may have historical significance as a support zone.
The 2nd support at 15,330.5 is an overlap support level, reinforcing its potential as a relevant support level where buyers have previously stepped in.
On the resistance side, the 1st resistance at 15,846.8 is categorized as a swing high resistance, and it also coincides with the 127.20% Fibonacci Extension level. This suggests that there could be significant selling interest in this area, making it a key barrier to further upward movement.
The 2nd resistance at 15,985.1 is another swing high resistance, indicating another potential level where the price may encounter selling pressure.
US500
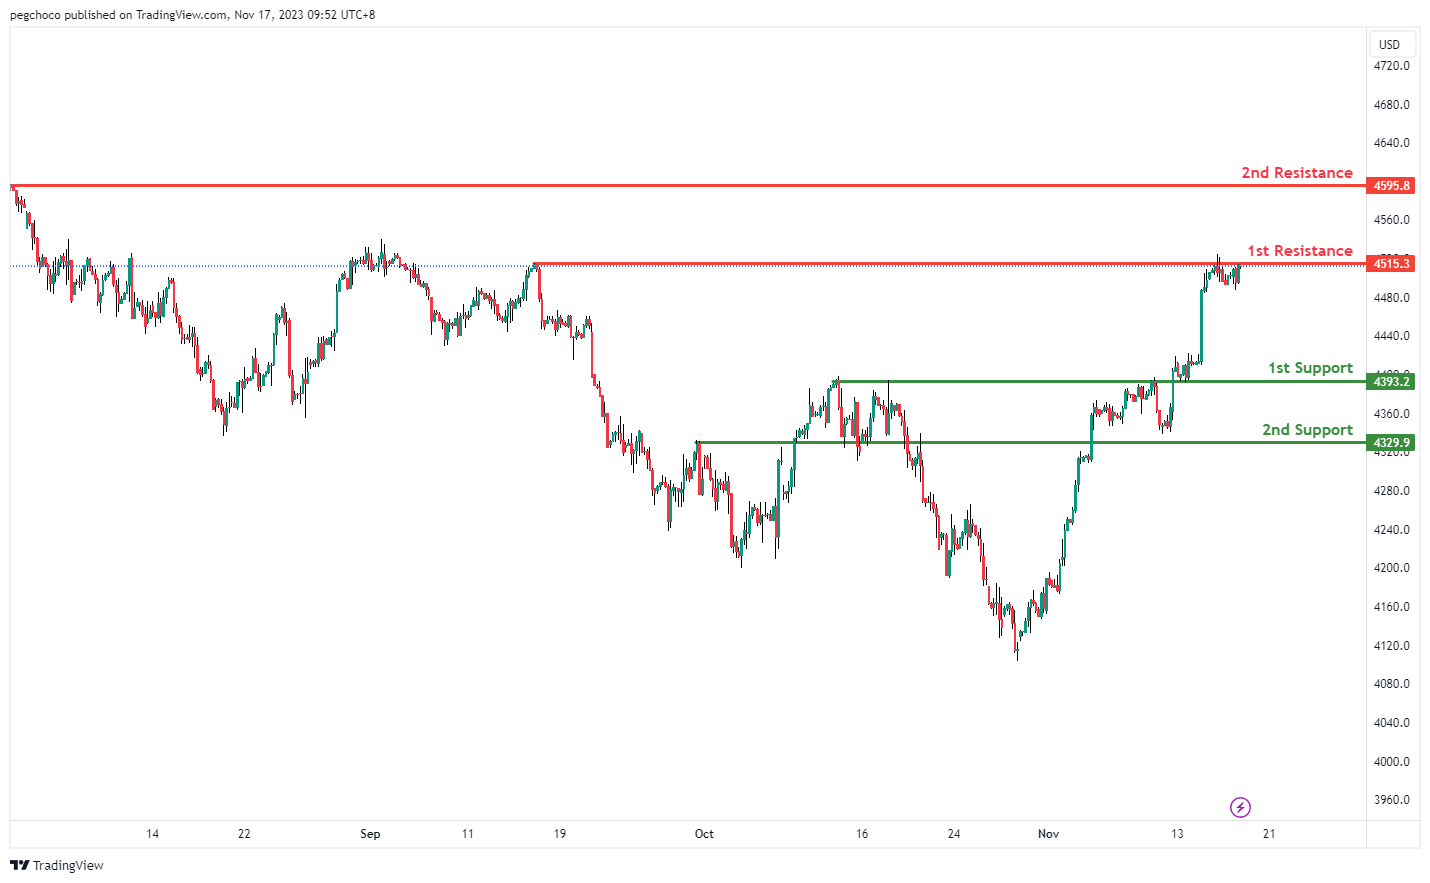
The US500 chart currently exhibits a bearish overall momentum, indicating the potential for a bearish reaction off the 1st resistance level with a subsequent drop towards the 1st support.
The 1st support at 4,393.2 is identified as an overlap support, suggesting that this level may have historical significance as a support zone.
The 2nd support at 4,329.9 is also an overlap support, further reinforcing its potential as a relevant support level.
On the resistance side, the 1st resistance at 4,515.3 is categorized as a multi-swing high resistance, indicating that this level has historically acted as a significant barrier to further upward movement.
The 2nd resistance at 4,595.8 is a swing high resistance, making it another key level where traders may anticipate selling pressure.
BTC/USD:
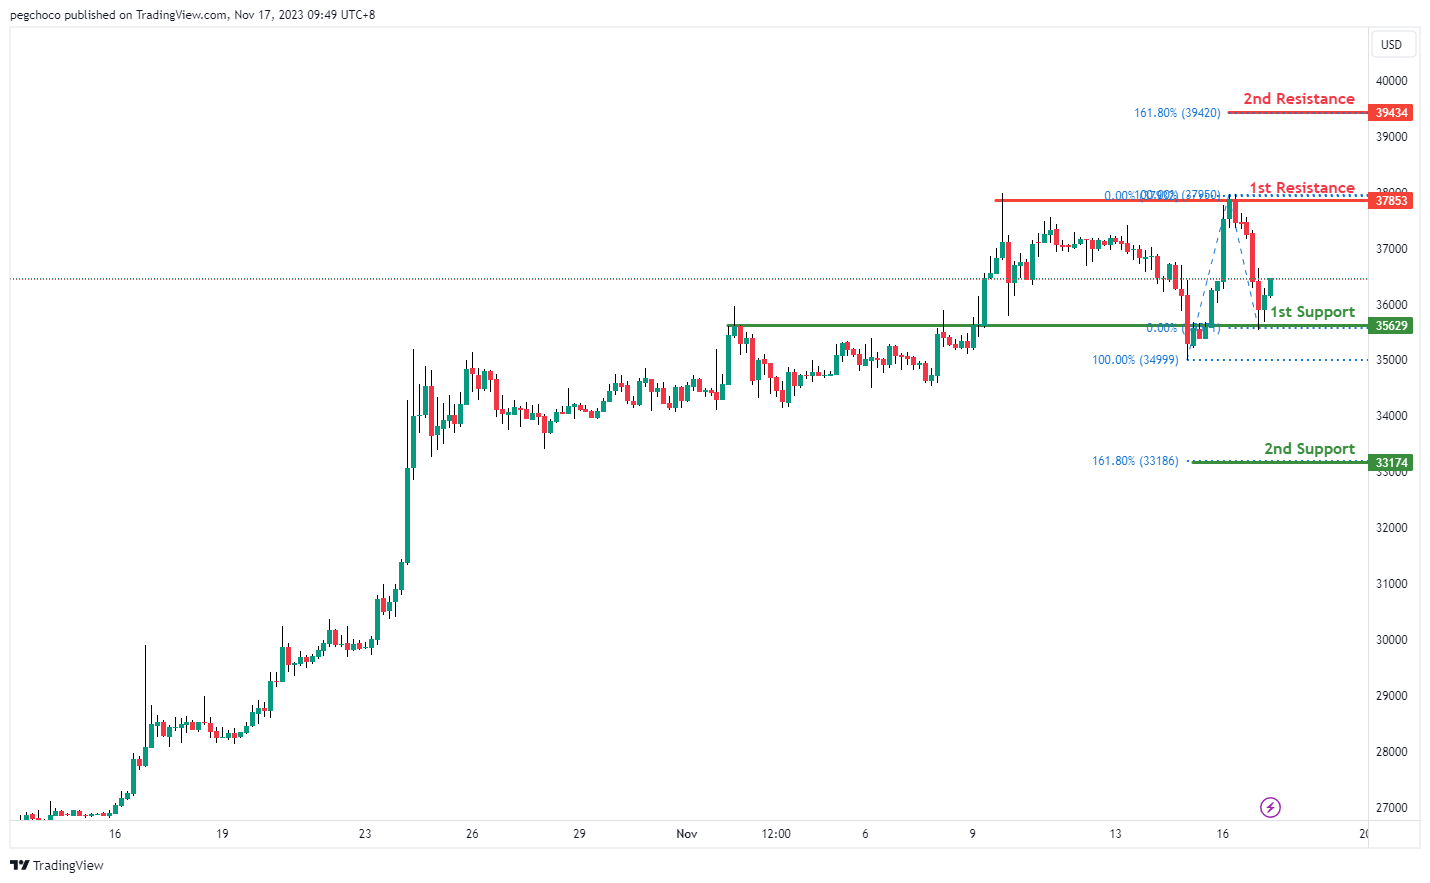
The BTC/USD chart currently shows a bullish overall momentum, indicating the potential for a bullish continuation towards the 1st resistance.
The 1st support at 35,629 is identified as an overlap support, suggesting that this level may provide significant support for the price. Traders may expect buying interest or a pause in the bullish movement around this area.
The 2nd support at 33,174 is considered a pullback support and coincides with the 161.80% Fibonacci Extension level. This level adds to its significance as a potential support level.
On the resistance side, the 1st resistance at 37,853 is categorized as a multi-swing high resistance. This level suggests that there may be selling interest in this area, potentially acting as a barrier to further upward movement.
The 2nd resistance at 39,434 is noted as a significant resistance level, coinciding with the 161.80% Fibonacci Extension. This adds another layer of resistance to the chart.
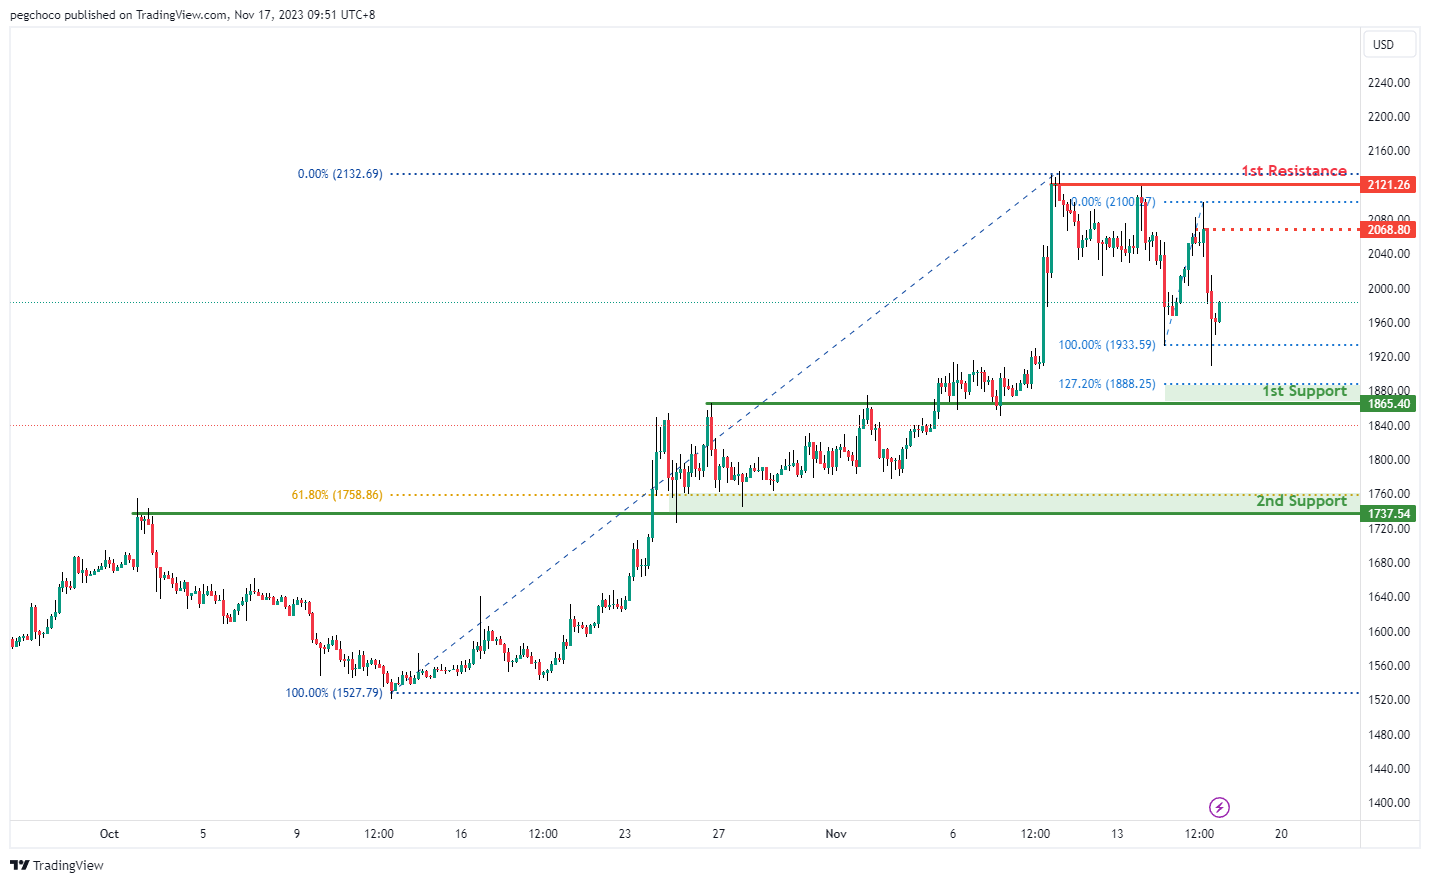
ETH/USD:
The ETH/USD chart currently displays a bearish overall momentum, suggesting the potential for a bearish continuation towards the 1st support.
The 1st support at 1,865.40 is identified as an overlap support and also coincides with the 127.20% Fibonacci Extension level. This confluence of technical factors indicates that this level could provide significant support, and traders may anticipate a potential bounce or a pause in the bearish movement around this area.
The 2nd support at 1,737.54 is considered an overlap support and is further reinforced by the 61.80% Fibonacci Retracement level. This makes it a relevant support level with the potential to halt or slow down the bearish momentum.
On the resistance side, the 1st resistance at 2,121.26 is categorized as a multi-swing high resistance, suggesting that this level may act as a barrier to upward movement.
Intermediate resistance at 2,068.80 is also a significant level, coinciding with a swing high resistance. Traders should pay attention to this level as it may pose resistance during the bearish continuation.
WTI/USD:
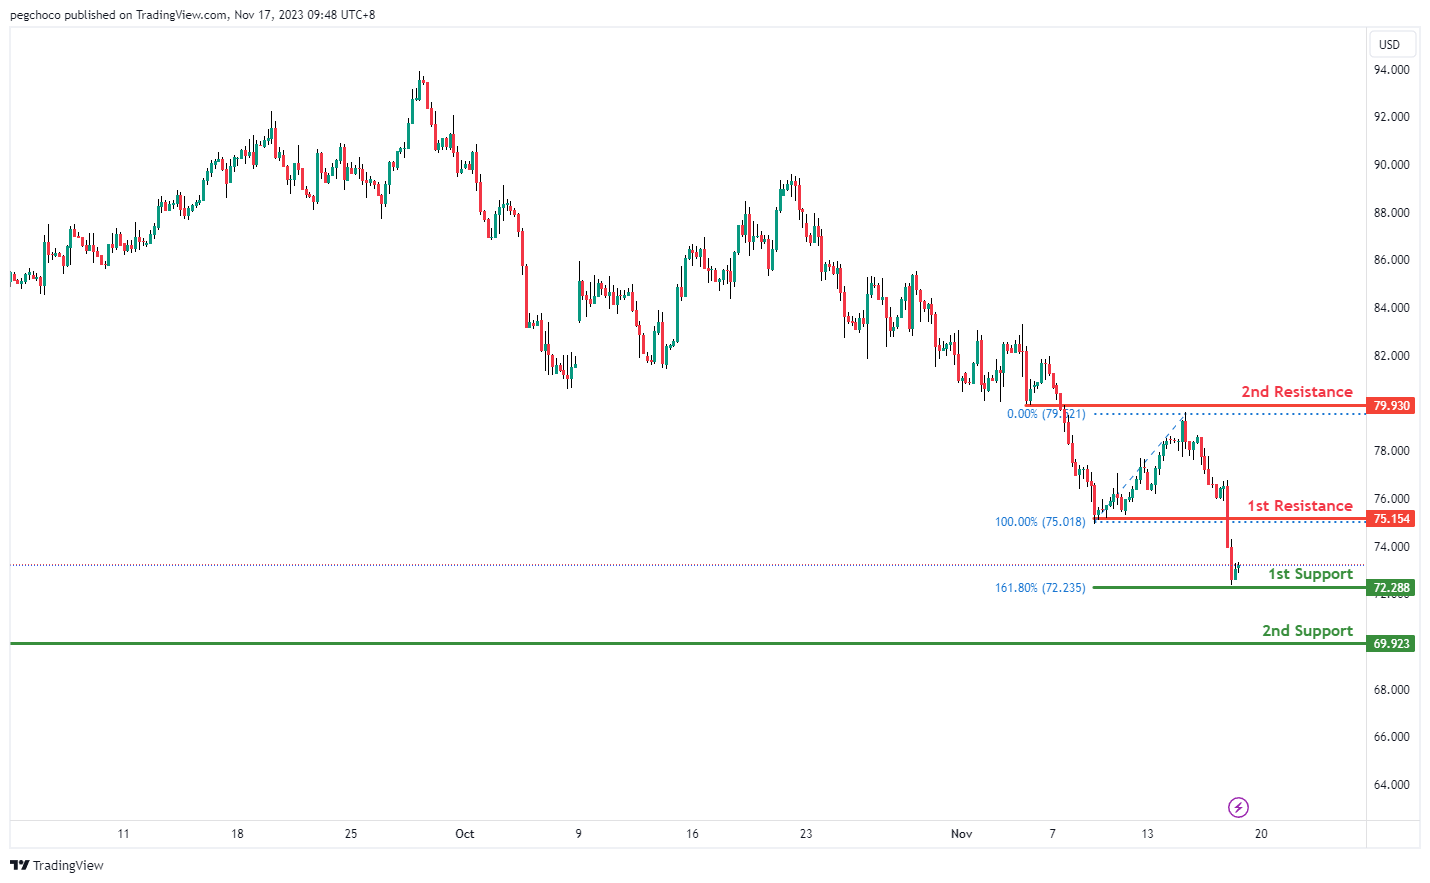
The WTI chart currently exhibits a bullish overall momentum, suggesting the potential for a bullish bounce off the 1st support level with a potential move towards the 1st resistance.
The 1st support at 72.28 is identified as a swing low support and coincides with the 161.80% Fibonacci Extension level. This level indicates strong potential support and may attract buying interest or a reversal of the price’s bullish movement.
The 2nd support at 69.92 is considered an overlap support, further reinforcing its potential as a support level. Overlap supports often indicate areas where buyers have previously intervened, making it a relevant support level.
On the resistance side, the 1st resistance at 75.15 is categorized as a pullback resistance. This level suggests the possibility of selling interest in this area, potentially acting as a barrier to further upward movement.
The 2nd resistance at 79.93 is noted as an overlap resistance, indicating another significant resistance zone.
XAU/USD (GOLD):
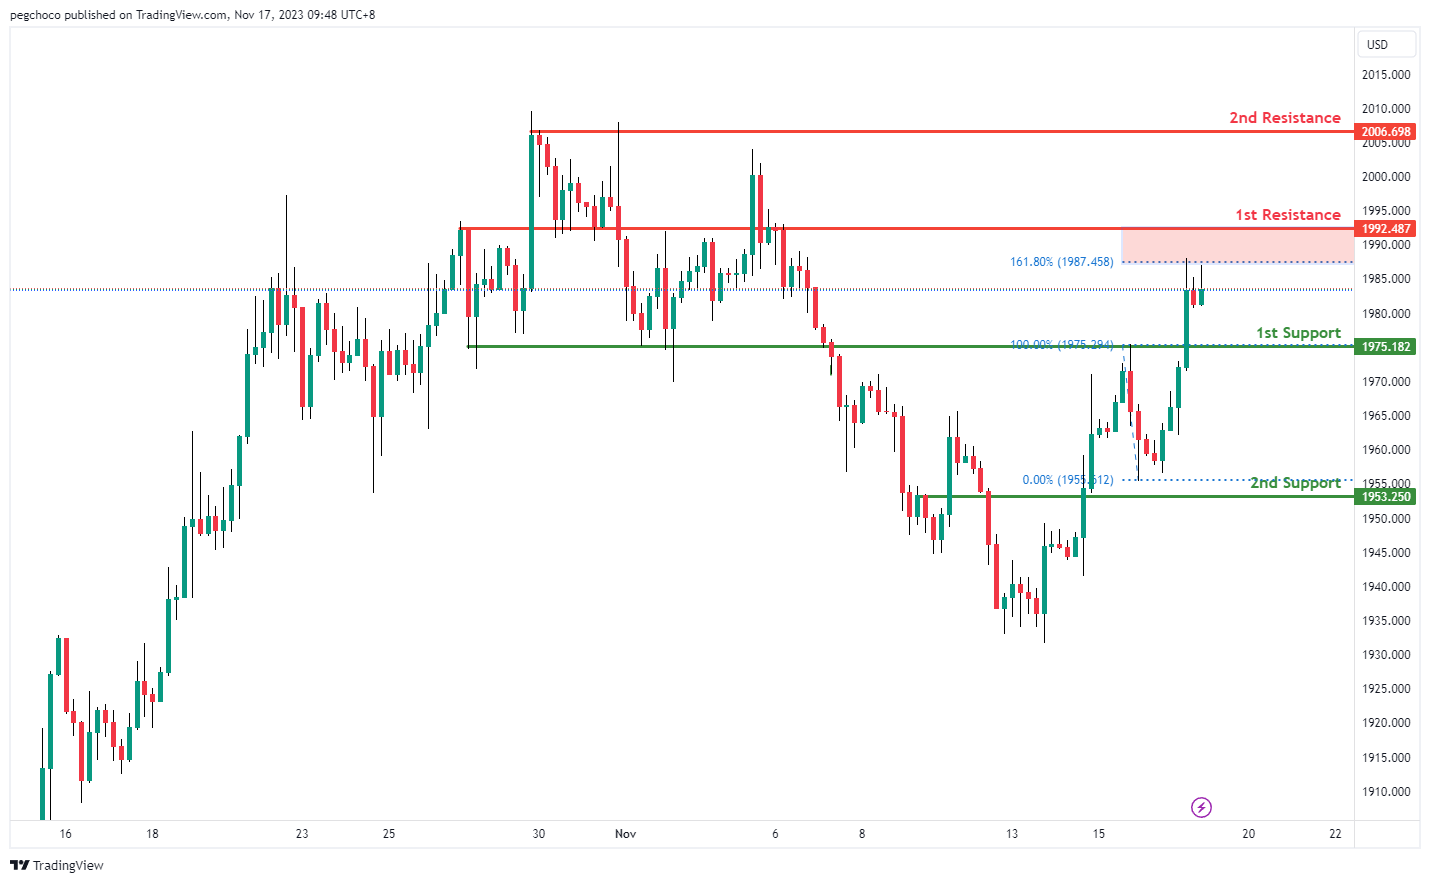
The XAU/USD chart currently exhibits a bearish overall momentum, suggesting the potential for a bearish continuation towards the 1st support level.
The 1st support at 1975.12 is identified as a pullback support level, indicating a point where the price may find buying interest or a pause in its bearish movement. This level is significant as it represents a potential area where buyers could step in.
The 2nd support at 1953.25 is considered an overlap support, further reinforcing its potential as a support level. Overlap supports often indicate areas where price reversals or consolidations have occurred in the past, making it a relevant support level to watch.
On the resistance side, the 1st resistance at 1992.48 is categorized as a pullback resistance. This level may act as a barrier to upward price movement, where sellers may become more active or where the price could encounter resistance.
The 2nd resistance at 2006.69 is noted as a swing high resistance, signifying a point where the price previously encountered selling pressure and reversed its direction.
USD/JPY Remains In Uptrend, Eyes New High
Key Highlights
- USD/JPY remained well-bid above the 150.00 support.
- A major bullish trend line is forming with support near 150.50 on the 4-hour chart.
- EUR/USD might correct lower, and GBP/USD is struggling to stay in a positive zone.
- Oil prices declined further below the $77.50 support.
USD/JPY Technical Analysis
The US Dollar started a fresh increase after it tested the 150.00 support against the Japanese Yen. USD/JPY climbed above the 150.50 level to restart its increase.
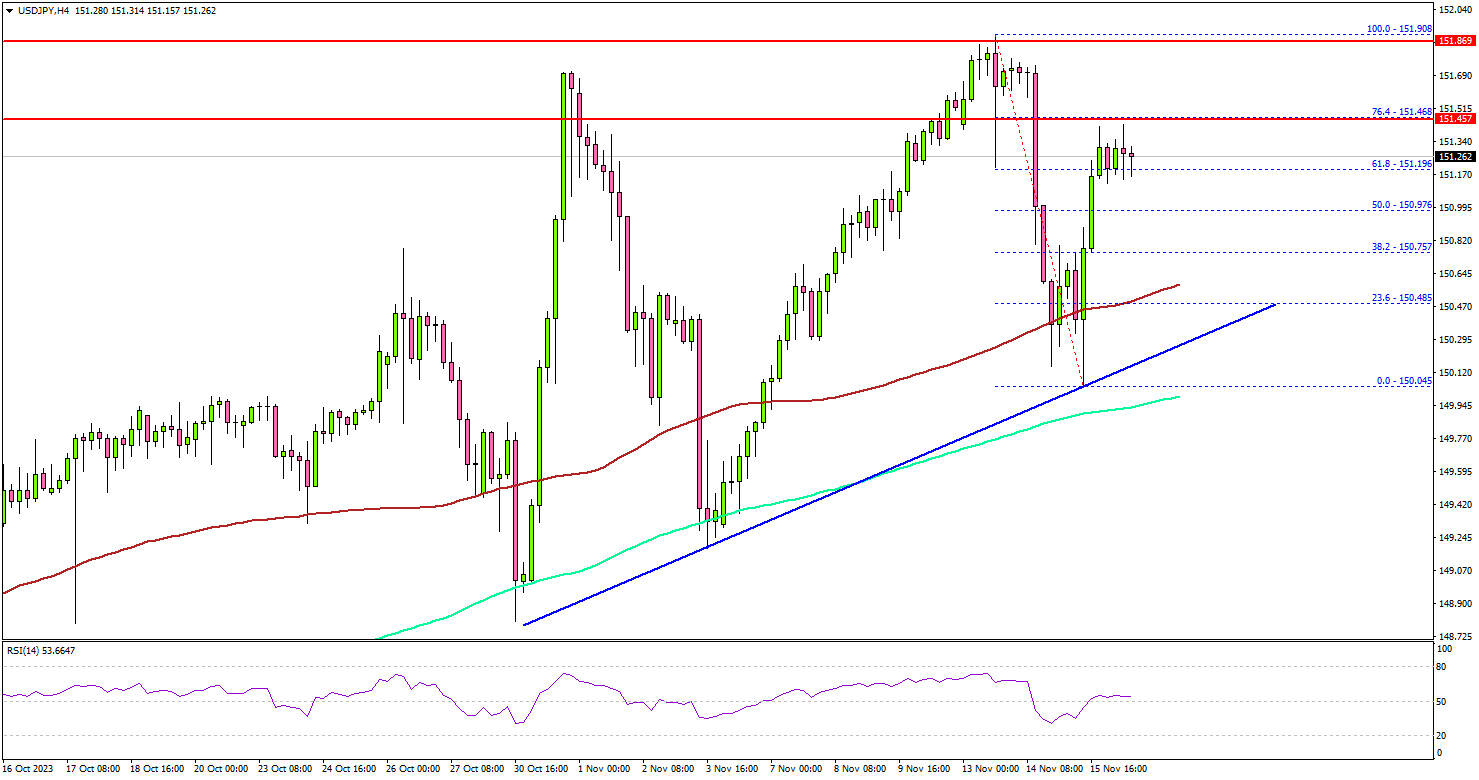
Looking at the 4-hour chart, the pair broke many hurdles and cleared the 50% Fib retracement level of the downside correction from the 151.98 swing high to the 150.04 low. The pair is now showing positive signs above the 100 simple moving average (red, 4 hours) and the 200 simple moving average (green, 4 hours).
On the upside, the pair is facing resistance near the 76.4% Fib retracement level of the downside correction from the 151.98 swing high to the 150.04 low at 151.45.
If there is a fresh increase, the pair could surpass the 151.50 level. The next key resistance is near the 151.80 level. The main resistance is still near the 152.00 level. A close above the 152.00 zone could open the doors for more upsides. The next stop for the bulls might be 153.20.
If not, the pair might start another drop below the 150.80 support. The first major support is now forming near the 150.50 level.
There is also a major bullish trend line forming with support near 150.50 on the same chart, below which the pair could test the 150.00 pivot level in the near term. Any more losses may perhaps open the doors for a move toward the 149.20 level.
Looking at EUR/USD, the pair traded toward the 1.0880 resistance and is currently showing signs of a downside correction.
Economic Releases
- US Housing Starts for Oct 2023 (MoM) – Forecast 1.350M, versus 1.358M previous.
- US Building Permits for Oct 2023 (MoM) – Forecast 1.450M, versus 1.417M previous.
WTI crude oil nosedives to four-month low, more downside ahead
WTI crude oil experienced a significant tumble this week, dropping around -5% yesterday and reaching its lowest point in four months, marking a trajectory for its fourth consecutive week of decline. This marks the commodity's potential fourth consecutive week of decline.
Despite OPEC and IEA's predictions of supply tightness in Q4, a confluence of disappointing global economic data and a surge in US crude inventories, coupled with sustained record-level production, has fueled the sharp selloff.
From a technical analysis perspective, the bearish sentiment was cemented earlier this week when WTI failed to reclaim psychological level. The ongoing decline from 95.50 is now expected to continue to 161.8% projection of 95.50 to 81.77 from 91.07 at 68.85. However, we anticipate significant support emerging in 63.67/66.94 support zone, which to trigger reversal.
Overall, WTI is seen as encapsulated in a long-term range-bound pattern, oscillating between the 63/64 and 95/96 zones.
Preserving the Gains and Timing the Turning Points
Australia appears to be further behind in the inflation and interest rate cycles than many of its peers. The RBA is also choosing a somewhat different strategy in order to preserve the gains made on unemployment since the pandemic. In doing so it is leveraging the fact that the tax system is helping dampen household demand. It is also avoiding the risk involved in a more aggressive tightening, that reversing course too late leads to an unnecessarily sharp downturn and undershoot of the inflation target.
Labour markets in both Australia and the United States have clearly turned. As Westpac colleague Economist Ryan Wells reported yesterday, the unemployment rate ticked back up to 3.7% in October and total hours worked seems to be leveling out. In the United States, the unemployment rate has risen ½ppt since the beginning of the year. While some of this reflects the belated return of US labour supply, jobs growth has also slowed.
These developments have led market participants to focus on the question of when central banks will reverse course and start cutting policy rates. Yet for Australia, the question remains whether the RBA still has further to go with rate increases. We are often asked why Australia seems likely to be later to reach the rate-cutting phase of the cycle than some other advanced countries. Relatedly, we are also often asked why – even if the RBA were to raise rates further – the peak level seems likely to be materially lower than in the United States, New Zealand and several other peer countries.
Part of the reason for the later peak is simply that Australia has been later to the inflation surge and reversal than many other advanced economies. We were later to open up after the pandemic, thanks to the hard lockdowns during the 2021 Delta wave. We were therefore later to see a mismatch emerge between rebounding demand and a supply side that needed to be reconfigured to recover. Given the extraordinary circumstances, it could not be assumed that Australia would follow the path of countries like the United States. Not every economy followed that path as it opened up. Much depended on whether the policy support during the pandemic phase was enough to fill the income hole created by lockdowns and other health-related restrictions on activity. This couldn't be assessed in advance. Japan and many other Asian economies are clear counterexamples to the US case, with domestic inflation not taking hold in the same way. (See Westpac colleague Economist Illiana Jain's note on 8 November.) So it would not have been reasonable to tighten policy in anticipation of an inflation surge that had not yet occurred and was not certain to do so.
Framed in this way, Australia can be viewed as being six or so months behind some other countries in its disinflation journey. Like the United States earlier in the year, Australia is still in the phase of being surprised how slow services inflation declines at first. A further wrinkle here is that the shock to energy prices following Russia's invasion of Ukraine last year only flowed through to domestic retail electricity costs in July this year. In this sense, the dynamics of the inflation cycle can also be a little slower.
The other main driver of the later expected turning point for rates is that the RBA has, for a variety of reasons, seemingly chosen a 'not quite as high for longer' strategy. Foremost among these reasons is the RBA's stated desire to preserve, as much as possible, the recent gains on unemployment. This had been clearly stated by the previous Governor, and Governor Bullock has continued using similar language.
At 3.7% in October, Australia's unemployment rate is around 1½ppts below pre-pandemic levels. The RBA does not want to undo these gains. Other countries' central banks presumably do not feel the same sense of urgency on this, even if they have full employment mandates. The United States, euro area and Canada all achieved multidecade lows for their unemployment rates in the years leading up to the pandemic. So perhaps they are less worried about not being able to do so again.
There is of course a risk involved in the RBA's strategy, in that a longer return to the inflation target raises the chance that inflation expectations will increase, making it harder to get inflation down. That gamble appears to have paid off so far. Measures of medium-term inflation expectations have largely remained in line with target. In addition, wages growth has not taken off in the same way as it did in the United States, Canada and some other countries. The September quarter read for the Wage Price Index was very high because of the flow-through of award wage increases. But as Westpac colleague Senior Economist Justin Smirk reported on Wednesday, outcomes outside the award system suggest that growth has peaked.
This relatively modest response of wages to the tight labour market contrasts with the experience in other countries. It also connects with some of the other reasons the RBA has been able to adopt this more drawn-out strategy.
The first and best-known of these is that, unlike the United States and Canada, most mortgages in Australia are variablerate. Monetary tightening therefore passes through to lending rates faster here and affects the incomes of more households earlier. Even if the endpoint for inflation is the same as elsewhere, the costs are different. It is therefore understandable that the RBA might seek to balance the trade-off differently while still meeting its target.
A less well-known difference is that fiscal policy is working in the same direction as monetary policy here, to a greater extent than elsewhere, especially as it pertains to the household sector. As has been noted in the media recently, Australia is one of the countries that does not routinely index tax brackets for inflation. In the United States and Canada, at least, federal tax brackets are indexed. (State/provincial tax rates are a different story.) A consequence of the arrangements in Australia is that higher tax payments are currently dragging more on household incomes than net interest payments are. The RBA routinely publishes graphs in the Statement on Monetary Policy that show this, so they are surely aware of the issue.
The upshot of both differences is that real household disposable income is contracting at present and is likely to do so for a while, despite strong population growth. The household sector is being squeezed in a way we are not seeing elsewhere. It is therefore understandable that policymakers here would make different choices.
Finally, the Board will be aware that there is not much benefit to a more aggressive path for rates. Documents released under FOI in May showed that RBA staff regularly model the likely outcome of different paths for the cash rate. A note written in January, included in that release, modelled the effects of paths for the cash rate based on the actions of the RBNZ and Bank of Canada. It turns out that in the current situation, where much of the inflation surge reflects supply shocks, a more aggressive path does not buy much in terms of an earlier return of inflation to target. It does, however, involve noticeably higher unemployment.
What that note also showed was that market pricing at the time implied that both the RBNZ and Bank of Canada would be cutting rates by now. Obviously things have changed since then. But it does highlight that the success of an aggressive tightening depends on the policymaker being able to reverse course at the right moment. Otherwise, you would end up keeping policy tight for too long and undershooting the inflation target for no real benefit. If you are sufficiently humble about your ability to forecast, you would not bank on getting the timing right on that turning point. That context lends further weight to a strategy more like the one the RBA has chosen. While the February and subsequent meetings are still live, depending on inflation outcomes, it should be understood that the RBA is not following the template set out by other countries.