Sample Category Title
Australian Dollar Yawns After Strong Employment Gains
- Australia’s employment jumps
The Australian dollar is lower on Thursday. In the European session, AUD/USD is trading at 0.6492, down 0.27%.
Australian employment jumps
Australian employment was hotter than expected in October, as the economy created 55,000 jobs. This blew past the market consensus of 20,000 and was much higher than the modest September gain of 7,800. The unemployment rate rose to 3.7% as expected, up from 3.6%, and the participation rate inched higher to 67%, up from 66.8%.
The employment report was positive but is unlikely to have much impact on the central bank’s rate policy. The sharp gain in jobs was mostly in part-time positions, with the October 14th referendum responsible for many temporary positions. The markets shrugged off the data and the Australian dollar gave up ground before recovering.
The markets have fully priced in a pause at the December meeting after the Reserve Bank of Australia raised rates earlier this month to 4.35%. A rate hike in February 2024 is possible, but that decision will depend on the data, particularly the fourth-quarter inflation report in January.
Australian wage growth climbed 1.3% q/q in the third quarter, matching the consensus estimate and above an upwardly revised 0.9% gain in Q2. This was the highest gain since records started in 1997, but the spike was largely due to an increase in minimum wage and a pay rise for elderly care workers. As with the employment release, the sharp increase in wage growth was largely ignored by the markets and had little impact on the Australian dollar.
In the US, retail sales fell 0.1% in October, better than the market consensus of -0.3% but well below the September revised reading of 0.9%. This snapped a six-month streak of gains and is another sign that elevated rates continue to cool the economy.
AUD/USD Technical
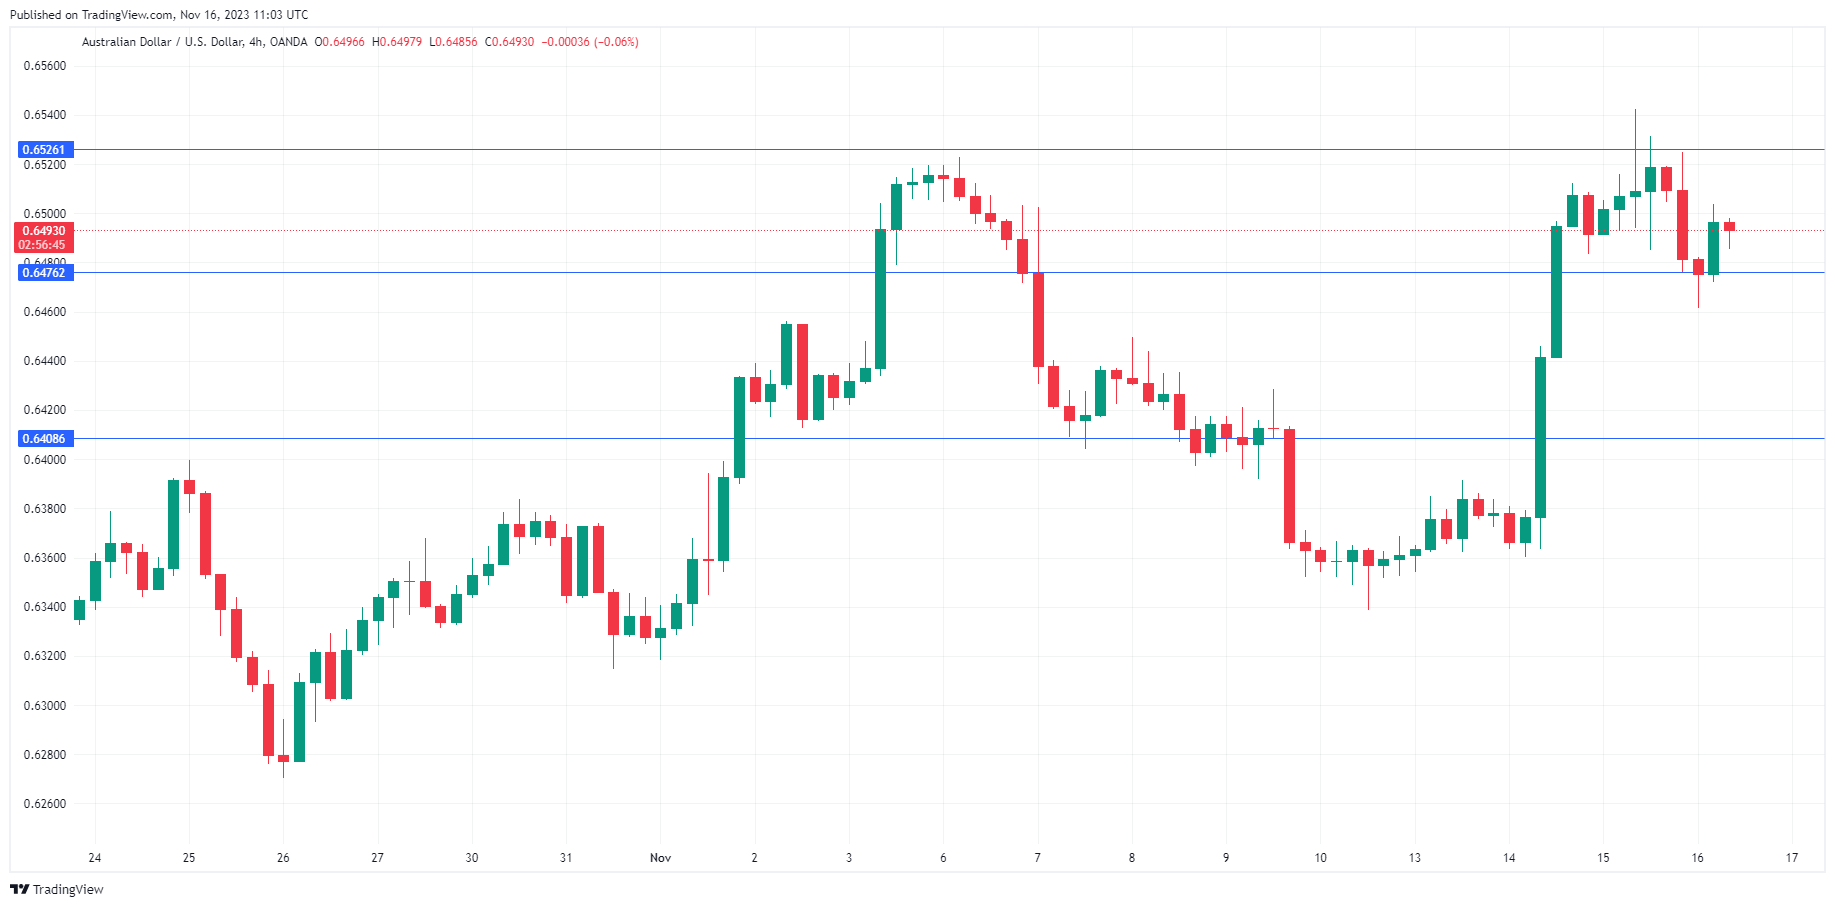
- AUD/USD tested support at 0.6476 earlier. Below, there is support at 0.6408
- 0.6526 and 0.6592 are the next resistance lines
XAU/USD: Gold Remains Constructive Though Still Looking for Clearer Direction Signal
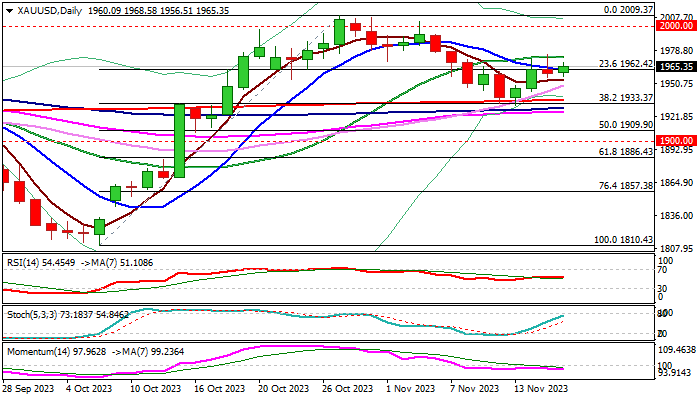
Gold regained traction on Thursday after three-day recovery was strongly rejected on Wednesday, remaining biased higher, although still capped under pivotal barriers at $1970/73 (50% retracement of $2009/$1931/20DMA).
Wednesday’s bearish candle with long upper shadow warns about recovery stall and the downside will remain vulnerable (on threats of bull-trap) as long as $1970/73 resistances cap, as momentum remains negative on daily chart.
Gold benefited from fresh signals that Fed’s tightening cycle is near its end and despite still constructive dollar, however, more work on either side will be required to generate clearer direction signal.
Bullish scenario requires sustained break above $1970/73 pivots to signal an end of $2009/$1931 corrective phase and confirm continuation of recovery from $1931 higher low (underpinned by a bear-trap under 200DMA).
Caution on repeated failure at $1970/73 zone which would boost signals that recovery is running out of steam, which would keep at risk lower pivots at $1936/33 (200DMA/Fibo 38.2% of $1810/$2009) loss of which to generate signal of bearish continuation of the leg from $2009 (Oct 27 high) on completion of failure swing pattern on daily chart.
Res: 1970; 1973; 1979; 1991.
Sup: 1954; 1943; 1936; 1933.
WTI Oil: Worries About China Demand and Rise in US Crude Inventories Keep Bears in Play
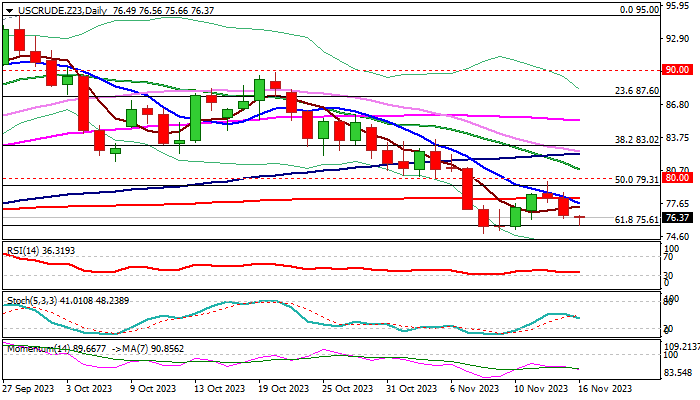
WTI oil price holds in red for the third straight day and pressuring pivotal Fibo support at $75.61 (61.8% retracement of $63.63/$95.00 rally) which was dented last week, but with triple failure to register close below support and generate fresh bearish signal.
Technical picture on daily chart remains bearish as negative momentum continues to strengthen and MA’s are in bearish setup, with formation of 10/200DMA death-cross, adding to bearish near-term outlook.
Sustained break of $75.61 pivot is needed to signal continuation of a larger downtrend, which paused for a limited correction and expose next targets at $71.03 (Fibo 76.4%) and $70.00 (psychological).
Broken 200DMA ($78.12) should keep the upside protected to maintain bearish near-term bias and guard upper pivots at $79.75 (recovery top of Nov 14) and $80 (psychological).
Weakening fundamentals on record production in the US, rise of US crude stocks above expectations and fears that China’s economy may further struggle to recover to pre-pandemic levels, which would further harm demand and keep oil prices under pressure for now.
Res: 76.56; 77.38; 78.12; 79.31.
Sup: 75.61; 74.92; 73.38; 71.73.
Crypto Market Soars to New Heights
Market picture
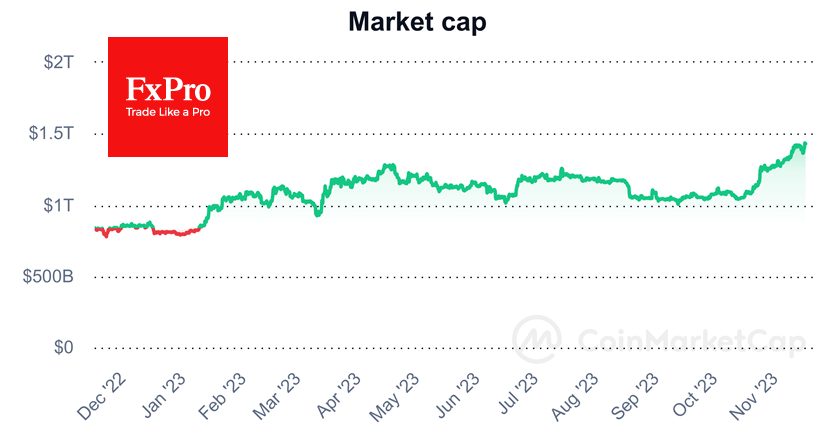
On Wednesday, the crypto market experienced a new growth spurt, rising 4.6% in 24 hours to $1.44 trillion, updating highs since May 2022. Bitcoin and several altcoins returned to the highs they tested a week earlier. Cardano (+11.11%) and Solana (+10.5%) led the growth among the leading coins.
Once again, the dynamics of crypto and equity markets have diverged. However, it should be noted that this seemingly negative correlation only works in the short term, as both asset classes have been rising steadily since October.
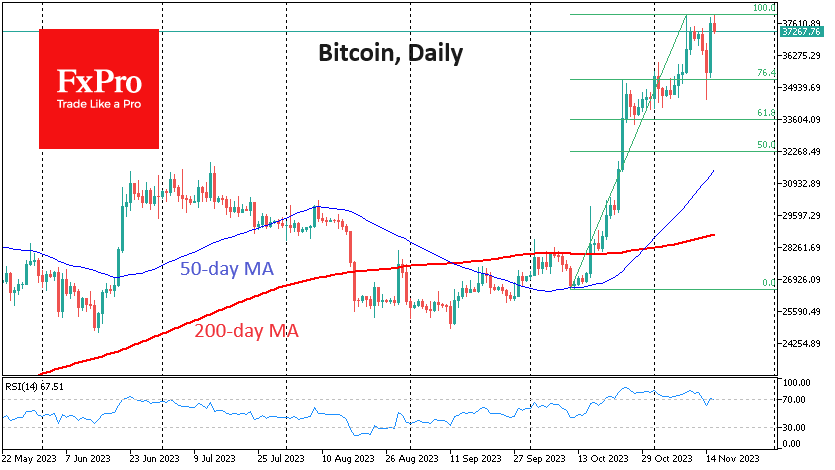
Bitcoin tested the $38K area again on Thursday morning. For now, it is not giving up. A move higher would renew the highs from May 2022, and it makes sense that the bulls would need a reason to break it up. However, the chances of further gains are higher than a reversal to the downside. If we accept that Tuesday’s decline was a correction, it has opened the way to $45-46K.
News background
The crypto market showed resilience in the third quarter, maintaining a steady pace of venture deals and investment volume despite a general downward trend in 2023, according to Binance Research. Venture capital funds invested the most in gamification projects, payment systems and trading platforms.
The US SEC filed 784 enforcement actions in fiscal 2023 and received $4.9 billion in penalties, of which $930 million was distributed to affected investors.
US financial conglomerate Citigroup announced the launch of an app that uses blockchain technology and smart contracts to support bilateral spot foreign exchange transactions.
Uniswap Labs released a cryptocurrency wallet app for Android. The tool allows users to exchange via a decentralised exchange directly within the app, eliminating the need for a separate browser extension.
According to Kaiko, Solana (SOL) has soared 520% in the last 12 months, ranking sixth in the cryptocurrency capitalisation league table. The Solana network developers’ partnership with Google, Circle and Amazon will increase the altcoin’s appeal. The increase in the number of DeFi protocols based on this blockchain will also help increase the value of the digital currency.
BoE’s Greene: Incredibly high wage growth remains a concern
BoE monetary policymaker Megan Greene expressed cautious optimism in a recent interview with Bloomberg TV, acknowledging the positive signs of declining inflation in the UK.
Greene noted that the recent data, which showed a drop in inflation to 4.6% and a weakening in wage growth, was indeed "good news." However, she voiced concerns about the persistence of inflation, particularly in the services component of CPI. Besides, her apprehension primarily stems from the still elevated wage growth, which she described as "incredibly high."
She emphasized the challenges posed by this situation, stating, "If we have an economy with fairly low productivity growth and really high wage growth, it's going to be hard to hit the (2% inflation) target."
Could NZDUSD Enter a New Downtrend?
- NZDUSD in the red today after testing the October high
- USD recovery across the board drives today’s move
- Mixed Momentum indicators complicate the short-term outlook
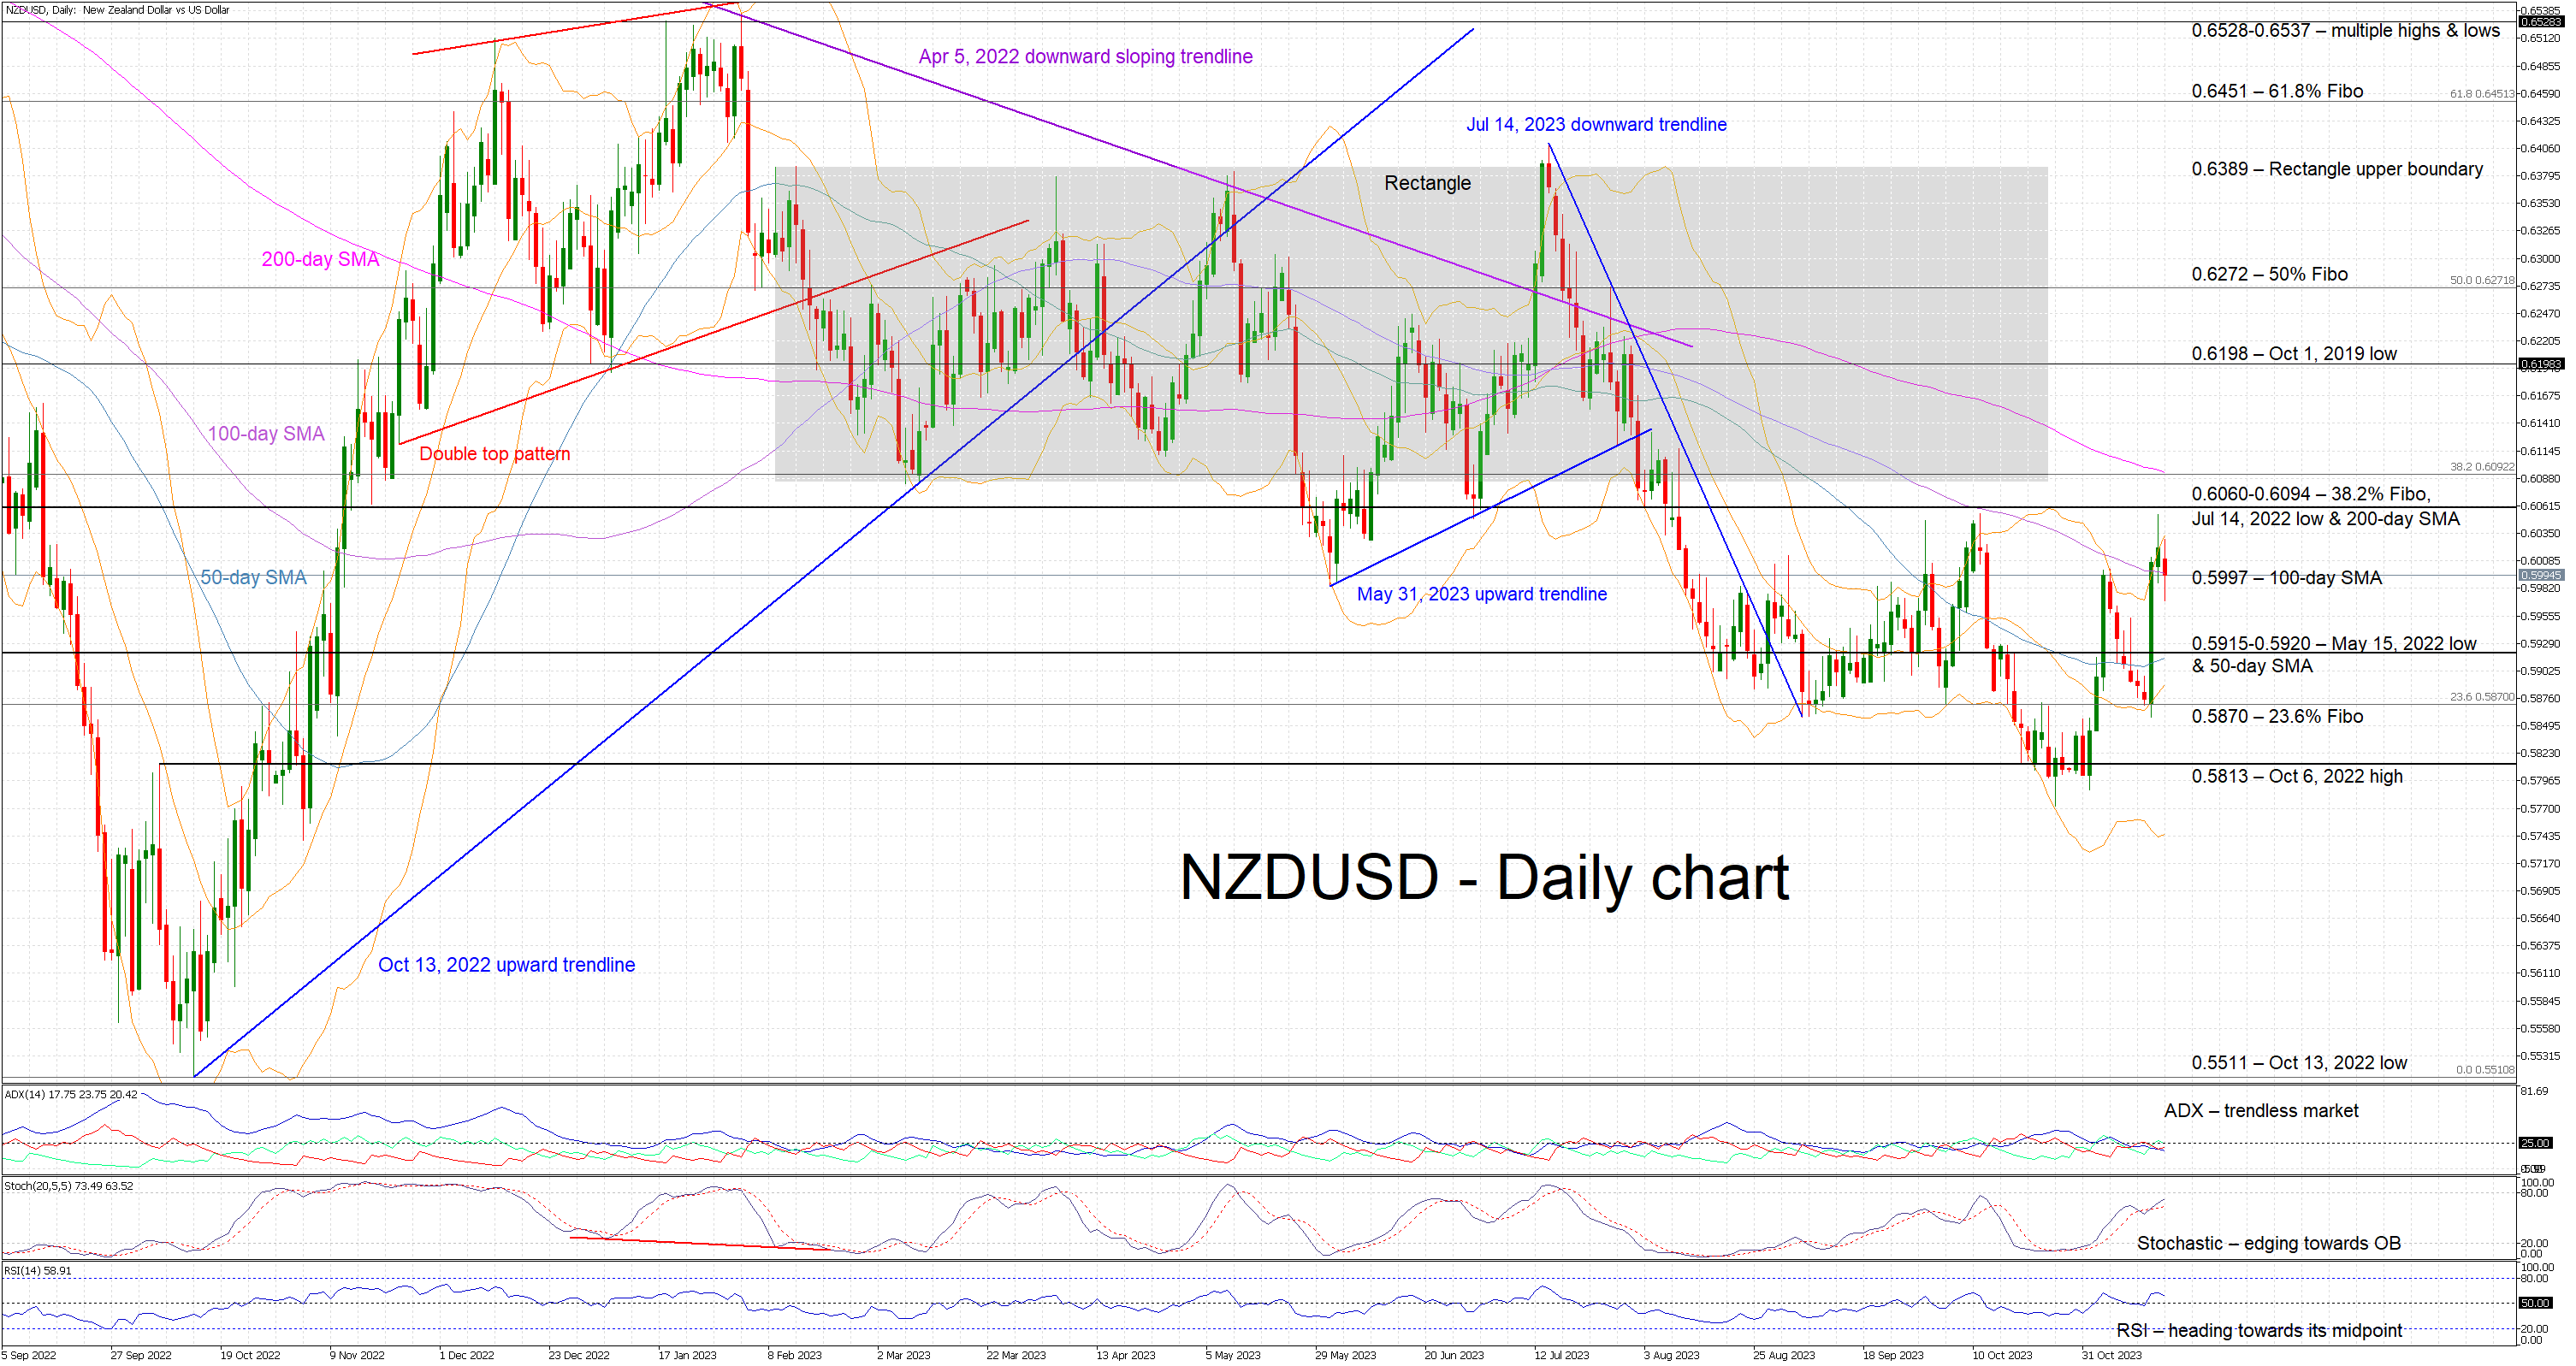
NZDUSD is edging lower, reacting to Tuesday's very strong green candle that pushed the pair towards the October 11 high of 0.6054. NZDUSD bulls took advantage of the widespread USD weakness but failed to overcome the 0.6060 level and are now testing the support set by the 100-day simple moving average (SMA). In the meantime, a double top pattern appears to be forming but a move below the 0.5772 neckline is needed for this structure to become active.
Amidst these developments, the focus has turned to the mixed momentum indicators. More specifically, the Average Directional Movement Index (ADX) points to a trendless market, and the RSI is edging lower but remains above its 50-midpoint. More importantly, the stochastic oscillator has moved above its moving average and is heading for its overbought territory. A higher high in the stochastic oscillator without a similar print in NZDUSD would be considered a bearish signal.
If the bulls remain confident, they could try to keep NZDUSD above the 100-day SMA at 0.5997 and then gradually push towards the busier 0.6060-0.6094 region. This is defined by the 38.2% Fibonacci retracement of the April 5, 2022 – October 13, 2022 downtrend, the July 14, 2022 low and the 200-day SMA. If successful, the bulls could have the chance to record a new 3-month high, opening the door for a protracted move towards the next resistance area that stands at 0.6198.
On the flip side, the bears are trying to regain market control. They could try to keep NZDUSD below the 0.5997 level and then set a course towards the 0.5915-0.5920 range that is populated by the May 15, 2022 low and the 50-day SMA. Lower, the bears could face strong support at both the 0.5870 and 0.5813 levels.
To sum up, NZDUSD bulls have made their move, but they appear to lack the strength to record a new higher high. They now have to defend their recent gains against the resurgent bears.
WTI Oil Turns Down, But 2020 Trendline Feeds Hopes
- WTI oil futures driven by bears
- Will the 2020 bar block the way down?
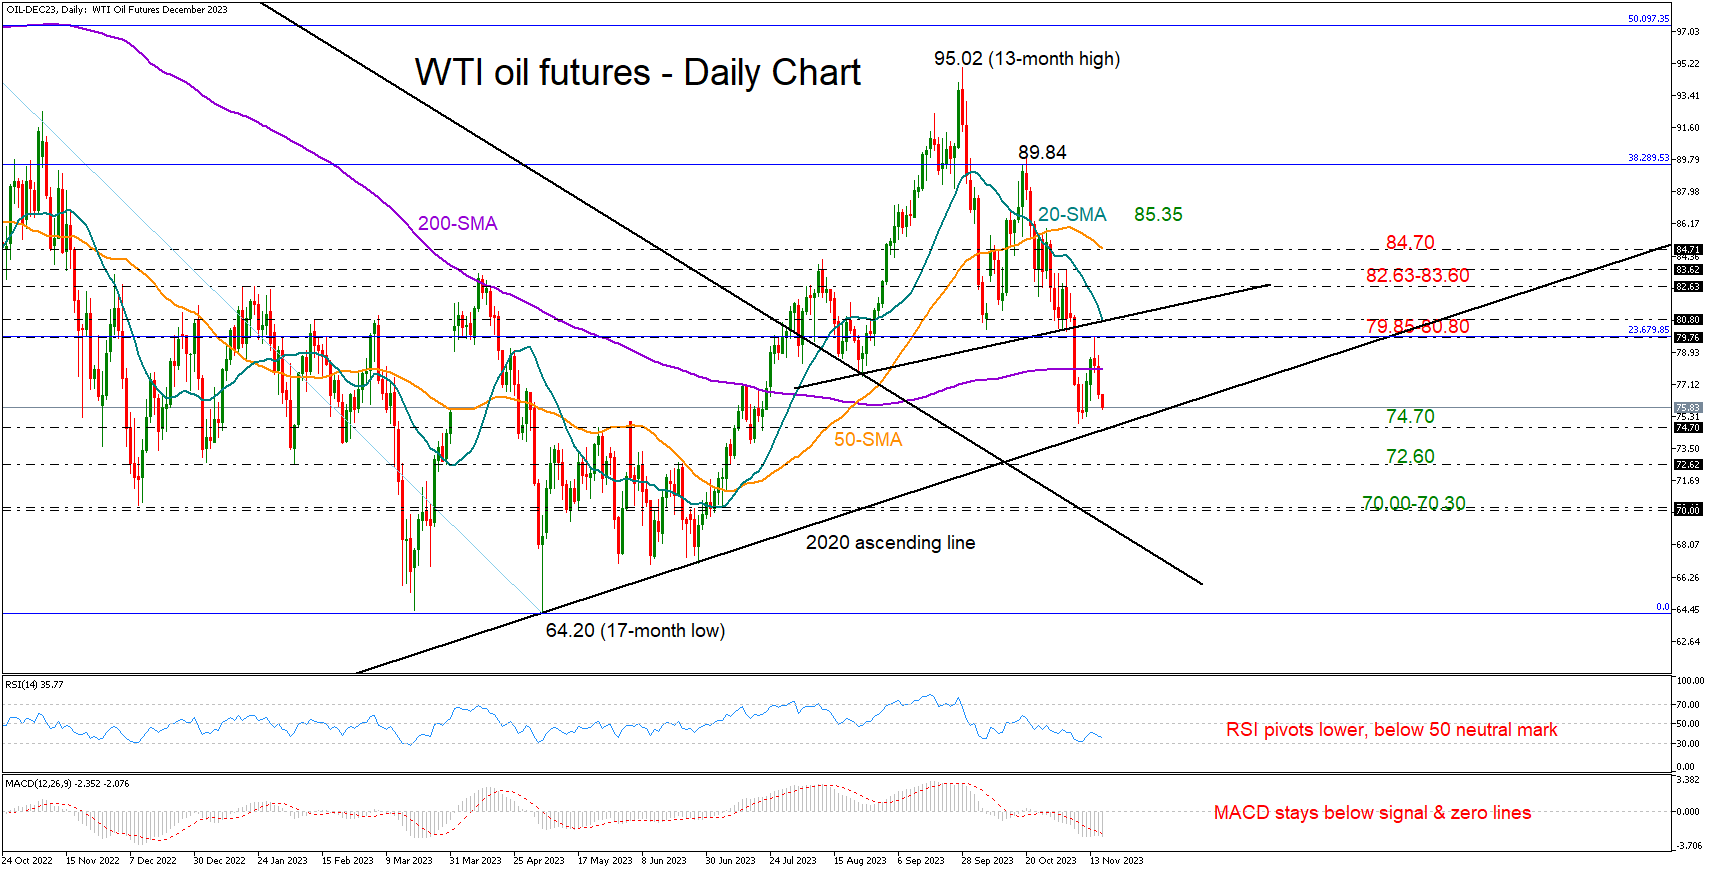
WTI oil futures reversed their post-CPI increase above the 200-day SMA, dropping immediately after reaching a high of 79.77 on Tuesday.
The RSI and the MACD have resumed their negative slope in the bearish area, signaling more depressing sessions ahead. But the upcoming sessions might be quite interesting as the long-term support trendline, which connects the 2020 and 2023 lows, is within breathing distance at 74.70 and could still act as a safety net.
A step below that ascending trendline would dampen market sentiment, likely causing a quick downfall to 72.60. Should selling forces persist, the price could meet its 2022 trough within the 70.00-70.30 zone, while lower, the descending line drawn from March 2022 could come to the rescue at 69.00.
If buying appetite boosts the price above its 200-day SMA, the focus will turn again to this week’s high of 79.77, where the 23.6% Fibonacci retracement of the 2022-2023 downtrend is positioned. The 20-day SMA will be closely watched as well at 80.80 given its limitations in October, while the 82.60-83.60 territory could be another hurdle ahead of the 50-day SMA.
Summing up, despite the negative technical indicators, there is a chance for WTI oil futures to rotate higher when they reach the 2020 upward-sloping line at 74.70.
AUDUSD Pulls Back from a 3-Month High
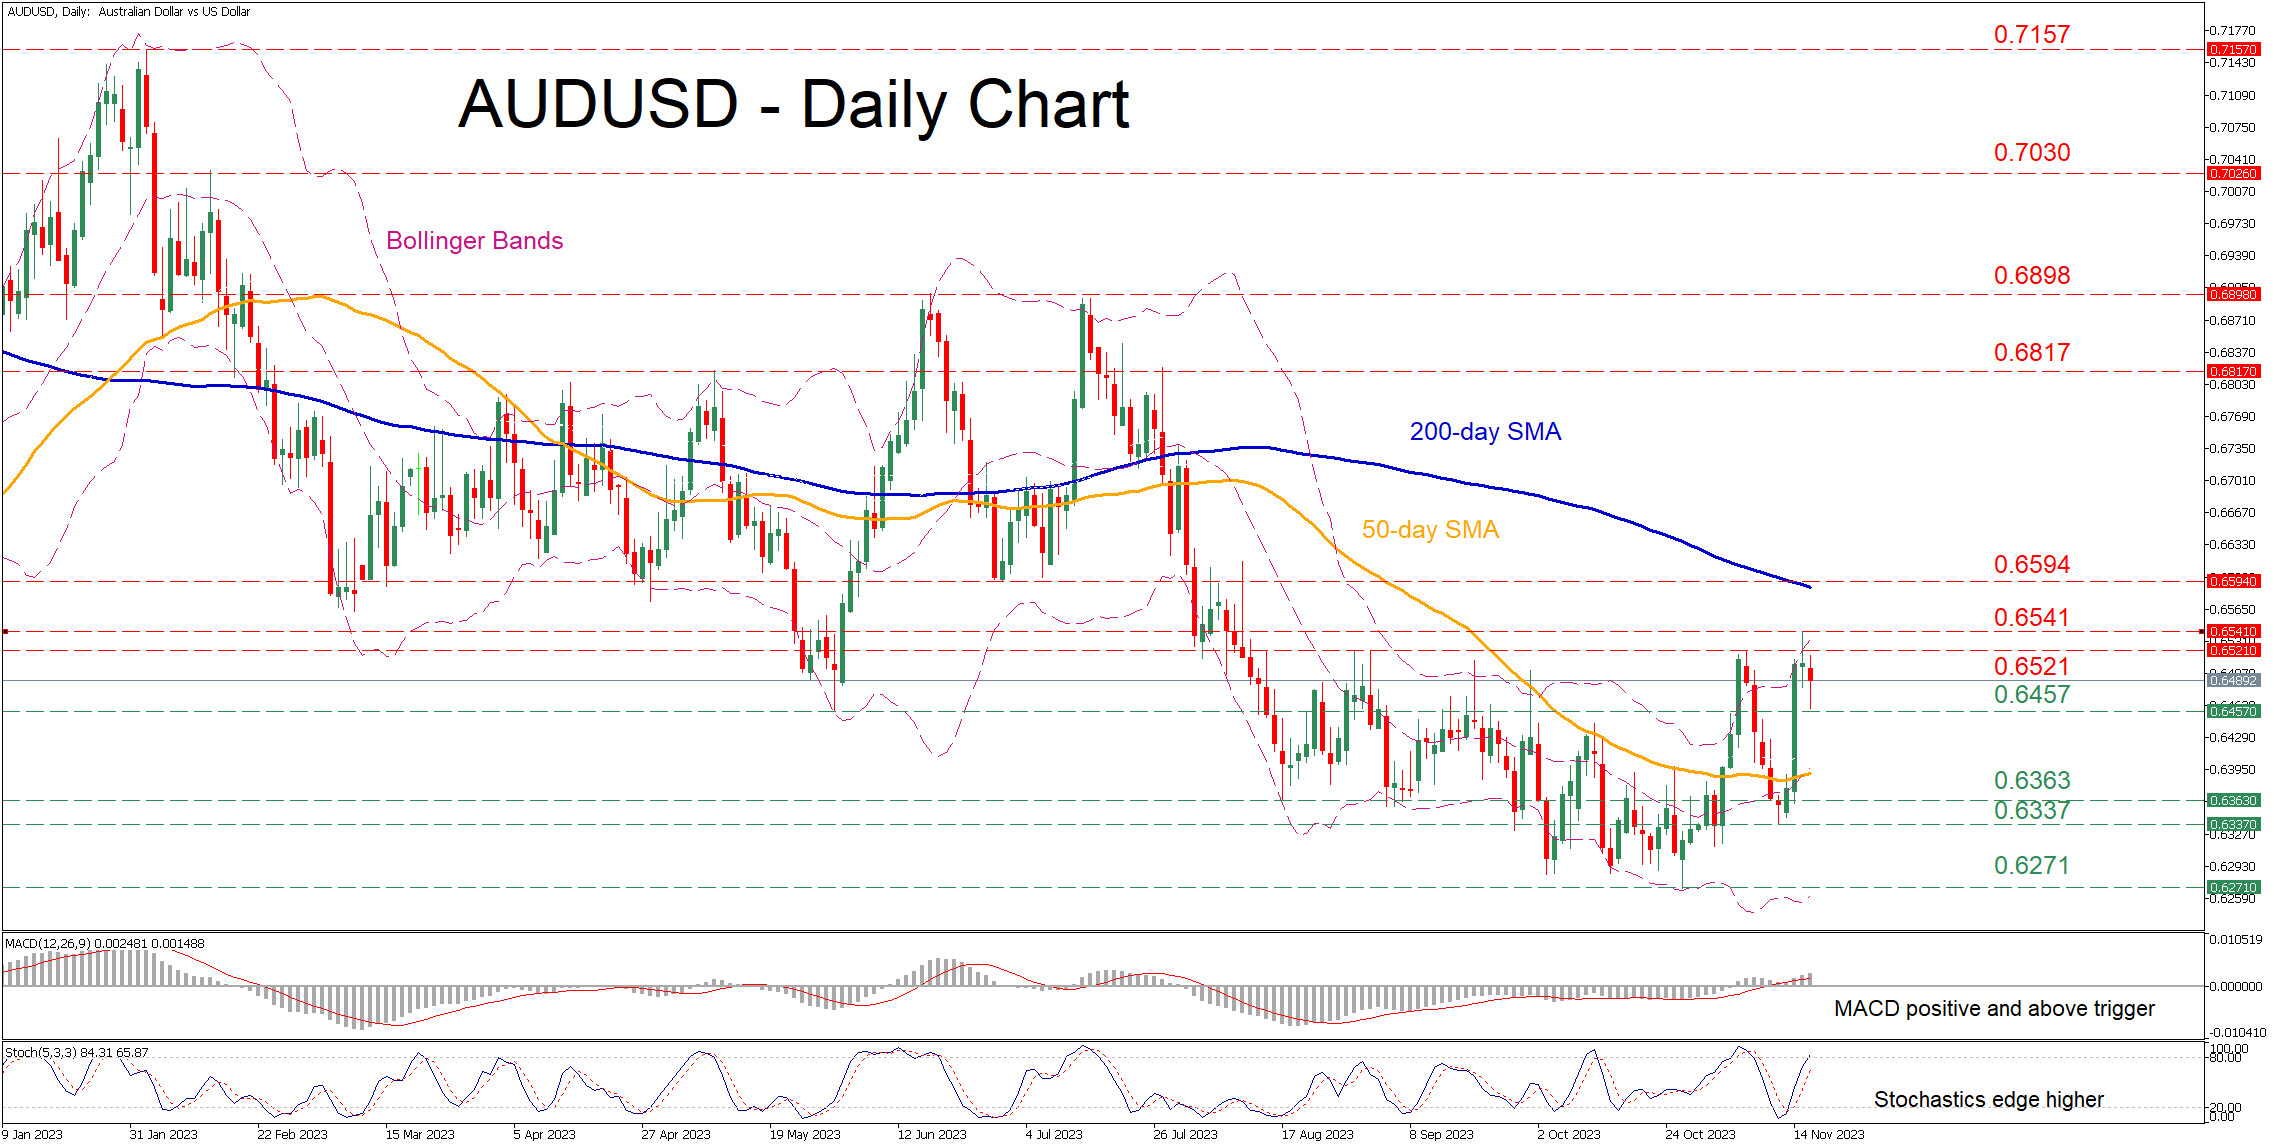
- AUDUSD hit a fresh three-month peak of 0.6541 on Wednesday
- But quickly pared some gains, hinting that the way to recovery is long
- Momentum indicators diverge from the price action
AUDUSD had been in an aggressive decline following a double top pattern in mid-July, with the pair posting consecutive multi-month lows. Even though the price spiked upwards following its bounce off the one-year low of 0.6271, its advance seems to be faltering, despite the momentum indicators being tilted to the upside.
Should the recent setback extend, the price could initially test the May low of 0.6457. A break beneath that region could pave the way for August-September support of 0.6363 ahead of the November bottom of 0.6337. Failing to halt there, the pair might revisit its one-year low of 0.6271.
On the flipside, bullish actions could propel the price towards the November resistance of 0.6521, which also held strong in September and August. Conquering this barricade, the bulls might attack the recent three-month high of 0.6541. Further upside attempts could then stall at the July support of 0.6594, which coincides with the 200-day simple moving average (SMA).
In brief, AUDUSD’s rebound appears to be losing steam amid diverging technical signals. For the bulls to regain confidence that the recovery could resume, the pair must reclaim the 200-day simple moving average (SMA).
US 30 Index Continues the Upside Rally Near 35,000
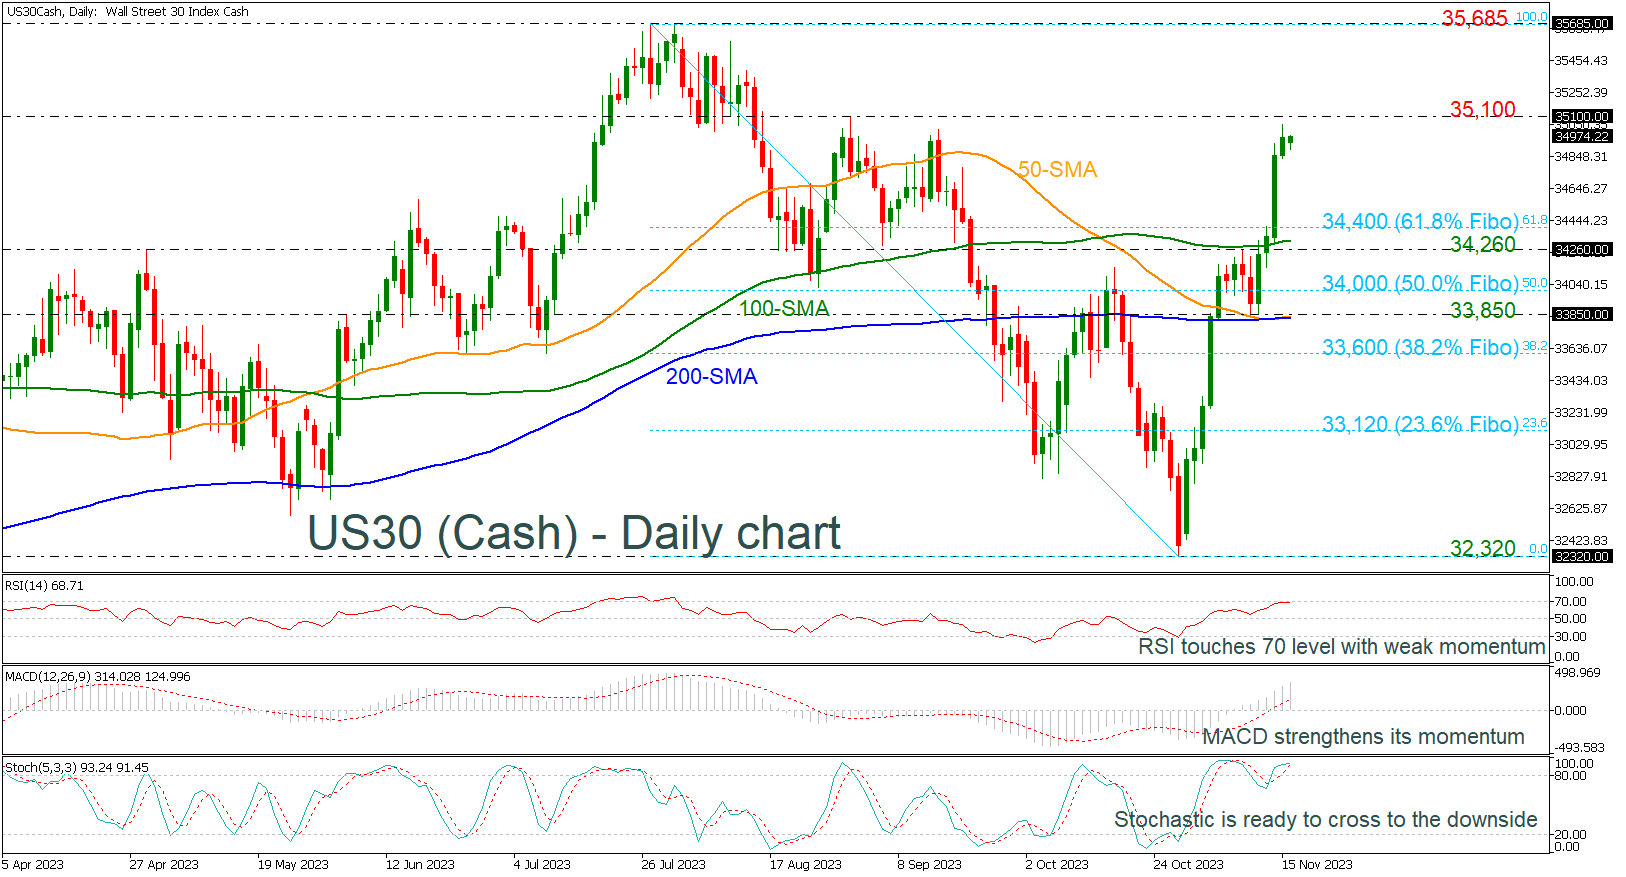
- US 30 holds above 61.8% Fibo and SMAs
- RSI and stochastic suggest bearish correction in near term
- Only a move above 35,985 would shift broader bias to positive
The US 30 (Cash) index has advanced considerably after the bounce off the 32,320 support level, overcoming the 200-day simple moving average (SMA) and the shorter-term SMAs. Notably, the price is rallying well above the 61.8% Fibonacci retracement level of the down leg from 35,685 to 32,320 at 34,400 but with weaker momentum than before.
Technically, the RSI indicator found resistance near the 70 line and the stochastic oscillator is ready for a bearish crossover between its %K and %D lines in the overbought territory, both suggesting a negative correction in the near term. However, the MACD is still extending its bullish momentum above its trigger and zero lines, indicating more gains.
Immediate resistance is coming from the 35,100 barrier, taken from the peaks on August 31, before meeting the 35,685 barricade, registered in August 1. Any jump above these levels would shift the broader outlook to bullish as well.
Alternatively, if the bears take the lead, the price may head towards the 61.8% Fibonacci of 34,400 ahead of the 100-day SMA near the 34,260 support. Steeper losses would open the door for the 50.0% Fibonacci of 34,000 and the 33,850 zone, which stands near the bullish crossover within the 200- and the 50-day SMAs.
All in all, the US 30 index is looking bullish in the near term and any movements above 35,685 would brighten the long-term outlook too.
EUR/GBP: Hits New Multi-Month Highs, On Track For Eventual Clear Break of Pivotal Fibo Barrier
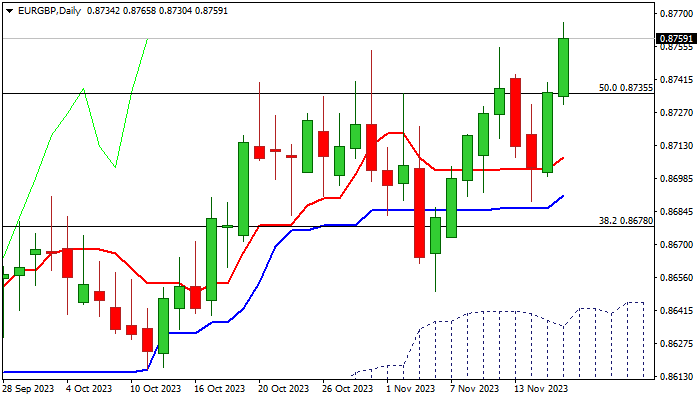
EURGBP holds firm bullish tone and extends fresh bullish acceleration into second consecutive day, trading at the highest levels since late April on Thursday morning.
The cross gained pace after lower than expected UK inflation in October deflated pound on fading expectations for further policy tightening.
Fresh advance is holding comfortably above pivotal Fibo level at 0.8735 (50% retracement of 0.8978/0.8492 downtrend) and on track to register eventual firm break above this level, after several attempts in past one month stalled here.
Rising positive momentum and moving averages in full bullish configuration on daily chart support the action, with close above 0.8735 and penetration into thickening weekly cloud (cloud base lays at 0.8765) to confirm bullish signal for test of next targets at 0.8792/0.8808 (Fibo 61.8% / weekly cloud top).
Broken Fibo 50% (0.8735) reverted to solid support and should hold to keep bulls intact,.
Conversely, another failure here would question bulls and add to risk of another bull-trap, though deeper drop and violation of rising 10DMA (0.8713) will be needed to weaken near-term structure and shift focus to the downside.
Res: 0.8765; 0.8792; 0.8808; 0.8863.
Sup: 0.8735; 0.8713; 0.8705; 0.8688.