

Sample Category Title
USD/JPY Daily Outlook
Daily Pivots: (S1) 150.49; (P) 150.95; (R1) 151.86; More...
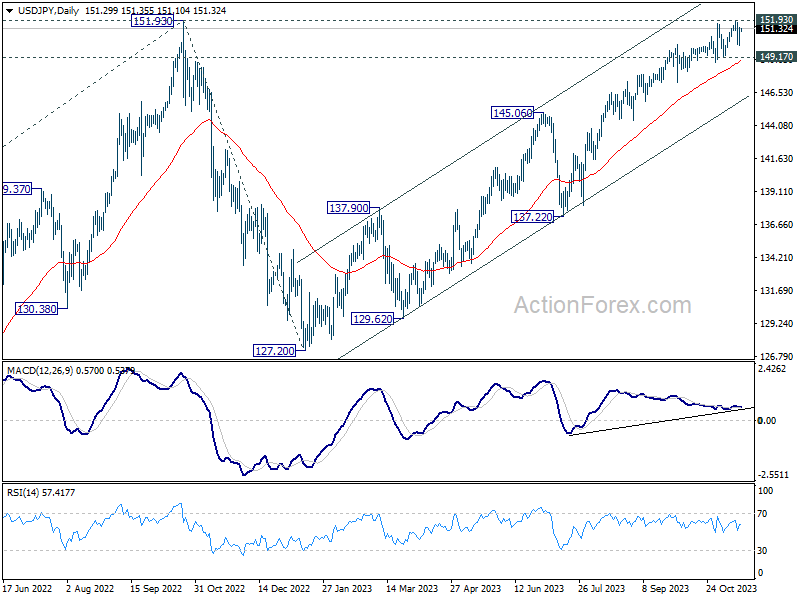
Intraday bias in USD/JPY stays neutral as range trading continues. Further rally is in favor as long as 149.17 support holds. On the upside, decisive break of 151.93 resistance will confirm resumption of long term up trend. Next target will be 157.69 projection level. However, firm break of 149.17 will be a sign of bearish reversal and bring deeper fall to 147.28 support first.
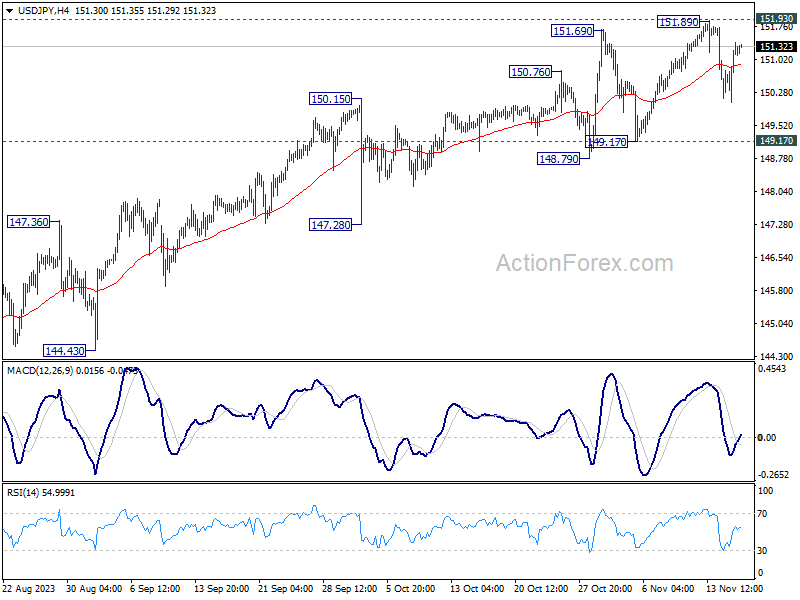
In the bigger picture, immediate focus is now on 151.93 resistance (2022 high). Rejection by 151.93, followed by sustained break of 145.06 resistance turned support will argue that rise from 127.20 has completed, and turn outlook bearish for 137.22 support and below. However, sustained break of 151.93 will confirm resumption of long term up trend. Next target will be 61.8% projection of 102.58 (2021 low) to 151.93 from 127.20 at 157.69.
USD/CAD Daily Outlook
Daily Pivots: (S1) 1.3655; (P) 1.3683; (R1) 1.3710; More...
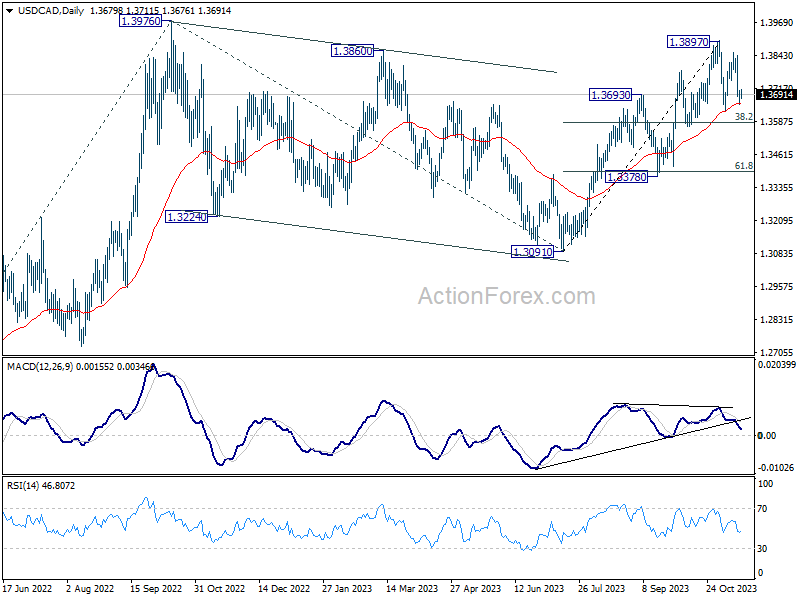
Intraday bias in USD/CAD is turned neutral first with current recovery. Overall outlook is unchanged that price actions from 1.3897 are developing into a consolidation pattern. While deeper fall cannot be ruled out, downside should be contained by 38.2% retracement of 1.3091 to 1.3897 at 1.3589 to bring rebound. Break of 1.3897 is expected at a later stage to resume larger rally.
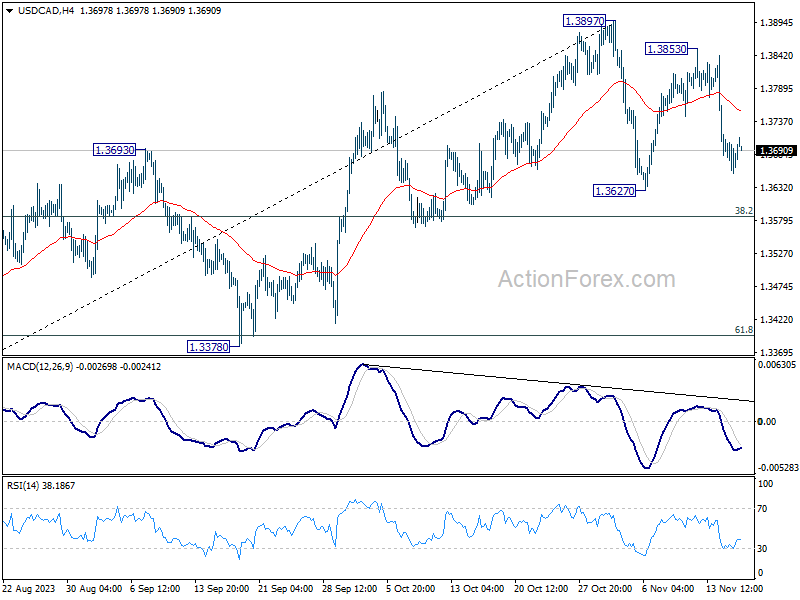
In the bigger picture, corrective pattern from 1.3976 (2022 high) should have completed with three waves down to 1.3091. Decisive break of 1.3976 high will confirm resumption of up trend from 1.2005 (2021 low). Next target is 61.8% projection of 1.2401 to 1.3976 from 1.3091 at 1.4064. This will remain the favored case as long as 1.3378 support holds.
Happily Digesting
Yesterday was about digesting Tuesday’s softer-than-expected US CPI data, feeling relieved that the US Senate passed a stopgap spending bill to avert a government shutdown and welcoming a softer-than-expected producer price inflation, and a softer-than-expected decline in US retail sales – which came to support the idea that, yes, the US economy is probably slowing but it is slowing slowly, while inflation is easing at a satisfactory pace.
The sweet mix of the recent economic data backs the idea that the Federal Reserve (Fed) could achieve what they call a ‘soft landing’ following an aggressive monetary policy tightening – and more importantly stop hiking the interest rates.
At this point, investors are 100% sure that the Fed won’t hike rates in December. They are 100% sure that the Fed won’t hike rates in January. There is more than a quarter of a chance for a rate cut to be announced by March. And the pricing suggests that there is a higher chance for a rate cut in the Fed’s May meeting, than not.
Conclusion: investors threw the Fed’s ‘higher for longer’ mantra out of the window this week.
But this is certainly as good as it gets in terms of Fed optimism. If the markets go faster than the music, the Fed must calm down the game by a tough talk, and if needed, by more action. The Fed’s Mary Daly expressed her concerns about the Fed’s credibility if it declared victory over inflation prematurely. And credibility is the most important tool that a central bank has. When the credibility is broken, there is nothing to break.
Therefore, the US 2-year yield may have bottom at 4.80% level and should be headed back toward 5%. The US 10-year yield should hold ground above 4.50%. As per equities, the direction is unclear to everyone, but the recent dovish shift in Fed expectations and the dropping yields gave a great energy boost to the US stocks. The S&P500 jumped more than 10% since end of October, the rate-sensitive Nasdaq 100 is now flirting with the highest levels since summer while the Russell 2000 index is having a blast since its October dip. The index rallied almost 12% in 3 weeks, pulled out the 50-DMA, the major 38.2% Fibonacci retracement and consolidated gains in the medium-term bullish consolidation zone yesterday.
As equities move higher and inflation slows, the anxiety regarding short positions mount – hence short covering is adding to the positive pressure.
The Big Short’s Micheal Burry reportedly exited his short position against SPDR’s P&P500 and Invesco’s QQQ and began betting against semiconductor stocks, including Nvidia.
Nvidia, on the other hand, is flirting with its ATM levels near the $500 per share level. A quick glance at Nvidia’s long-term price chart clearly suggests that the chances are that we are in the middle of an AI-led bubble and that the exponential move cannot extend infinitely. Yes, AI is boosting Nvidia’s revenue and profits, but the revenues that will flow into the pockets of Nvidia thanks to AI are already embedded in the share price, and we will likely see the price bubble burst. But there are two things to keep in mind when you bet against a bubble. 1. A bubble is a bubble only when it bursts – it's like ‘you are innocent until proven guilty’. And 2. You can wait a while before the market comes back to its senses. For now, we are in the middle of making eye-popping predictions and beating them. The company is due to release earnings on November 21st.
One big risk for Nvidia is the tense relations between the US and China, and the extension of chip export curbs to a bigger range of Nvidia chips. This week’s meeting between Biden and Xi carried hope that the high-level communication could help melting ice. There has apparently been some ‘real progress’ in restoring military communication and foreign policy... Then, Joe Biden said that Xi is a dictator.
The Relief-Rally Fades Amid a Rebound in Fates
Market movers today
Today's US data is not the kind that usually moves markets a lot: industrial production, NAHB housing market index and Philly Fed index for November. On the latter, we saw a quite strong increase in the Empire index, but both Empire and Philly Fed are rather unreliable guides to the manufacturing PMI that we get next week.
We have speeches today from Fed's Mester and Williams, and from ECB's President Lagarde.
In Norway, the Q4 Expectations Survey will be important for Norges Bank (NB) in the current situation with a weakening NOK but all other inflation drivers are moving in the opposite direction. In the previous Expectations Survey, inflation expectations were rising across the board. Lower inflation and weaker GDP growth beyond the autumn have probably dampened inflation expectations, especially on 12-month and 2-year horizons.
The 60 second overview
Markets. After a string of sessions characterised by sharp declines in global real rates and a subsequent very strong risk appetite in markets risk sentiment has soured somewhat again over the last 18 hours. The culprits seem to be a combination of US data releases driving a rebound in US rates (see below) and weak Chinese house data overnight driving a sell-off in the big Chinese indices with some spill-over to Asian markets. The USD sell-off has stabilised and industrial metals have edged lower. Also oil has extended yesterday's decline on the back of both worse global risk appetite and the weekly US crude inventory report showing a larger-than-expected build in inventories.
Markets wrap. Yesterday' release of US data was a mixed bag. Overall data indicated a slowing economy and weaker price growth - yet the market reaction was to roll back expectations for US rate cuts next year. In short, both retail sales and not least Empire Manufacturing surprised to the topside while producer prices came in lower than expected. On US retail sales the headline figure printed at -0.1% m/m (cons.: -0.3%, prior: 0.9%). Excluding the volatile auto and gas sales, the retail sales control group revealed monthly growth of 0.2% m/m which was in line with expectations. Additionally, last month's retail sales control group was revised higher, from 0.6% to 0.7% which overall painted a picture of somewhat better goods buying from the US consumer in recent months than expected. On the other hand, the October PPI figures were weaker than expected, with the headline at -0.5% m/m (cons.: 0.1%, prior: 0.4%), while November Empire Manufacturing rose to 9.1 (cons.: -3.0, prior: -4.6), the highest reading since April.
In the euro area, industrial production declined slightly more than expected in September, at -1.1% (consensus: 1.0%, prior: 0.6%). Hence, the hard data continues to confirm the weakening in the soft indicators in the region.
US-China diplomatic relations. Chinese President Xi Jinping is currently meeting his US counterpart in Joe Biden in California. This is the first in-person meeting between the two presidents in a year and the initial remarks from both sides have been that the talks have been constructive. In particular the two country heads have agreed on resuming collaboration on military communication, drug trafficking prevention and on AI-progresses. Also the question on Taiwan was discussed with both parties explaining a wish to maintain peace. There has been no market reaction.
Equities: Equities continued higher yesterday but lost some steam during the afternoon. Yields continue to govern the direction of equities, and it was after yields began to rise that equities retreated. Europe rose a mild 0.4% and US 0.2%. Cyclicals beat defensives and value made a revenge vs growth. Staples and banks were in the top yesterday while utilities declined a little after the surge earlier this week. US futures are a tad lower this morning.
FI: US data releases drove global yields higher yesterday. UST yields ended the day up by 7-8bp across the curve, while the Bund curve bear steepened with the 10Y tenor rising 4bp. The 5y5y EUR inflation swap rate dropped to a new 6M low of 2.39% as prices on oil and European natural gas (TTF) fell throughout the day. Markets continue to price in close to 90bp worth of ECB cuts next year.
FX: Yesterday's session saw a slight reversal of the relief induced rallies to the cyclically sensitive currencies as NZD, AUD, NOK, SEK and the CEEs all traded on the back-foot. The USD decline has also stabilised with EUR/USD edging below the 1.0850 mark after having traded close to 1.09 yesterday morning.
Credit: Credit markets settled into calmer territory after the massive post-CPI rally on Tuesday. Itrax closed 0.5bp higher at 70.7bp, while Itrax Xover closed 2.1bp higher to close at 390.2bp. Primary markets were still fairly active with corporates and financials seeking to utilize the final couple of weeks of the pre-Xmas issuance window.
AUD/USD Daily Report
Daily Pivots: (S1) 0.6481; (P) 0.6512; (R1) 0.6540; More...
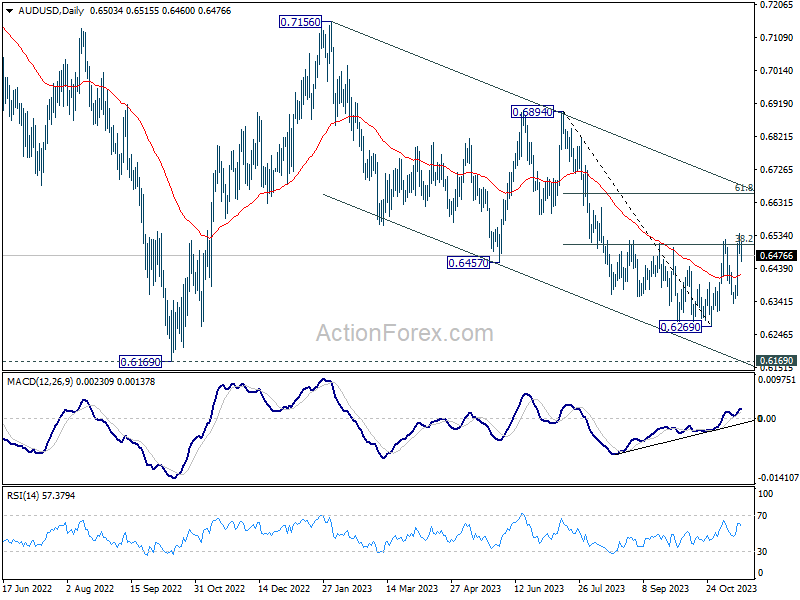
Despite spiking higher to 0.6541, subsequent retreat in AUD/USD suggests that a temporary top was formed. Intraday bias is turned neutral for some consolidations first. Downside should be contained by 55 4H EMA (now at 0.6427) to bring rebound. Break of 0.6541, and sustained trading above 38.2% retracement of 0.6894 to 0.6269 at 0.6508, will argue that whole corrective fall from 0.7156 has completed with three waves down to 0.6269. Stronger rally should seen to falling channel resistance (now at 0.6684) next.
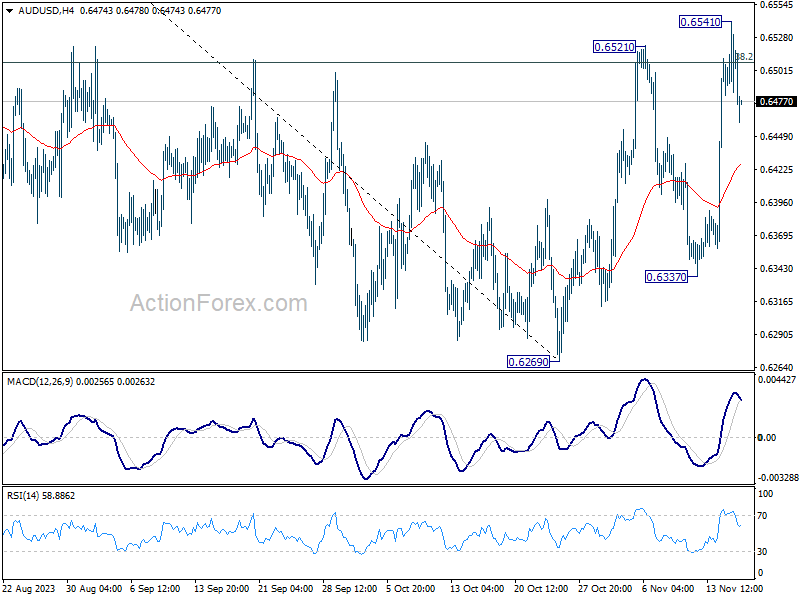
In the bigger picture, there is no confirmation that down trend from 0.8006 (2021 high) has completed. While current rebound from 0.6269 might extend higher, it could be the third leg of the corrective pattern from 0.6169 (2022 low) only. For now, medium term bearishness will remain as long as 0.6894 resistance holds.
Aussie Dips Amid Mixed Employment Data and Global Market Cautiousness
Australian Dollar weakens broadly in Asian session, as Australian employment data and shifting global risk sentiment take center stage. The mixed nature of the latest Australian jobs report is causing a rethink among investors regarding RBA's next steps. Despite robust increase in overall employment numbers, a nuanced look reveals cracks in the job market's strength.
The unexpected uptick in the unemployment rate and deceleration in work hours growth are clear indicators of a cooling labor market. This cooling trend reinforces expectation for RBA to hit pause on its interest rate hikes again in December meeting. RBA is likely to closely monitor the economic indicators over the festive season to gauge the need for further monetary policy adjustments in February.
Australian Dollar's descent is also exacerbated by a cooling of risk-on sentiment that had buoyed the global markets earlier in the week. Investors are seemingly taking a breather and reassessing their positions. A key event that has captured the market's attention is the meeting between US President Joe Biden and Chinese President Xi Jinping, which occurred on the sidelines of APEC summit. Although the meeting marked a step forward in re-establishing high-level military communications, it fell short of offering substantial breakthroughs in broader geopolitical tensions. The absence of a new defense minister appointment in China, following the unexplained dismissal of Gen. Li Shangfu, adds to the air of uncertainty affecting market sentiment.
In the broader currency spectrum, New Zealand Dollar is joining Australian Dollar as one of the day's weakest performers so far, alongside British Pound and Canadian Dollar. On the flip side, Japanese Yen is emerging as the strongest currency for the day at this point, with t Dollar and Swiss Franc also showing resilience. Euro's performance remains uneven across different pairings.
Despite the daily fluctuations, when looking at the weekly performance, Dollar continues to be at the bottom of the league, with Japanese Yen and Canadian Dollar also underperforming. Australian and New Zealand Dollars, along with Swiss Franc and Euro, are experiencing the strongest gains, whereas British Pound exhibits mixed results across the board.
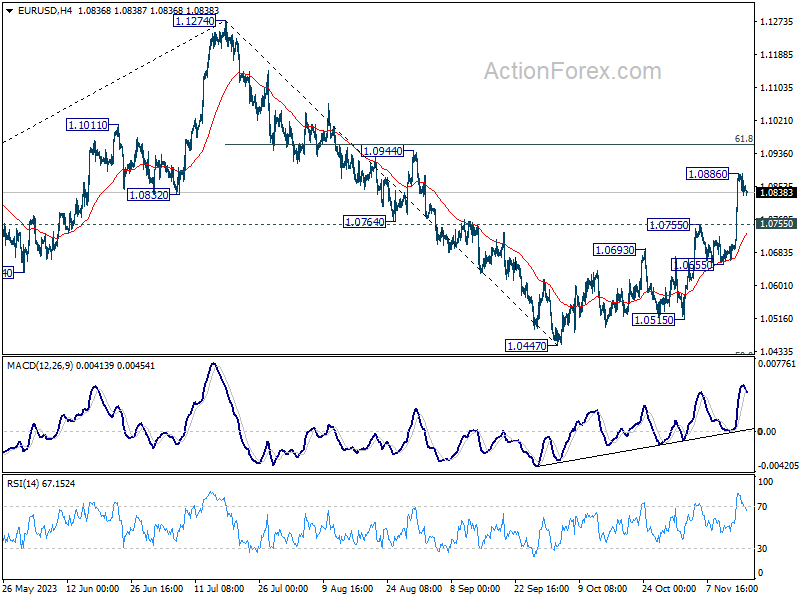
Technically, EUR/USD turned into consolidation after surging to 1.0886 earlier in the week. Some consolidations would be seen in the near term, but outlook will stay bullish as long as 1.0755 resistance turned support holds. Above 1.0886 will resume the rebound from 1.0447 to 61.8% retracement of 1.1274 to 1.0447 at 1.0958. Upside momentum will likely start to wane above 1.0958 fibonacci level. But any acceleration above there could be an early signal of more intense selloff in Dollar elsewhere.
In Asia, Nikkei closed down -0.27%. Hong Kong HSI is down -1.11%. China Shanghai SSE is down -0.49%. Singapore Strait Times is up 0.11%. Japan 10-year JGB yield is down -0.002 at 0.795. Overnight, DOW rose 0.47%. S&P 500 rose 0.16%. NASDAQ rose 0.07%. 10-year yield rose 0.094 to 4.535.
Fed's Daly cautions against premature end to rate hikes, emphasizes need for patience
San Francisco Fed President Mary Daly, in an interview with the Financial Times, acknowledged the "very, very encouraging" signs of falling inflation in this week's data. However, she cautioned against hastily concluding the rate-raising cycle, emphasizing the importance of a cautious and informed approach.
Daly expressed concern about prematurely ending the cycle, noting the potential risks involved. "We have to be bold enough to say 'we don't know' and bold enough to say 'we need to take the time to do it right'," she stated. She warned that a premature halt could lead to a 'stop-start' scenario, which could ultimately harm the Fed's credibility.
In her view, rate cuts are not on the immediate horizon. "Rate cuts are 'not happening for a while'," Daly remarked, suggesting a continued commitment to the current restrictive monetary policy direction until there is substantial evidence of a sustainable return to the 2% inflation target.
Australia's employment grows 55k, yet signs of cooling emerge
Australia's labor market displayed stronger-than-anticipated performance in October, with employment figures surpassing expectations. The economy added 55k jobs, well above forecasted growth of 22.8k. This increase was driven by both full-time and part-time employment, which rose by 17k and 37.9k respectively.
Despite this robust job growth, unemployment rate edged up slightly from 3.6% to 3.7%, aligning with market expectations. Pparticipation rate also saw an uptick, rising by 0.2% to 67.0%. Additionally, month-over-month hours worked in the economy increased by 0.5%.
Bjorn Jarvis, ABS head of labour statistics, noted that over the past two months, this equates to an average monthly employment growth of approximately 31k people, slightly lower than average growth of 35k people a month since October 2022.
He also highlighted that annual growth rate in hours worked has slowed to 1.7%, down from around 5% mid-year, and lower than annual employment growth of 3.0%. This slowdown may suggest that "the labour market is starting to slow, following a particularly strong period of growth."
Japan's exports increase for second month, despite persistent decline in China shipments
In October, Japan experienced a mixed bag in its trade sector. Exports saw a modest rise of 1.6% yoy to JPY 9167B, marking the second consecutive month of growth, albeit at a slower pace compared to September's 4.3% yoy increase.
One notable aspect was the continued decline in shipments to China, which fell by -4.0% yoy. This marks the eleventh consecutive month of decline, underscoring the strained trade relations and potentially shifting economic alliances in the region.
Conversely, exports to the US surged by 8.4% yoy, buoyed by robust demand for hybrid vehicles and mining and construction machinery. This surge propelled the value of U.S.-bound shipments to record levels. Similarly, exports to Europe experienced a healthy increase of 8.9% yoy, indicating diversified trade relations.
On the import front, Japan witnessed a significant drop of -12.5% yoy to JPY 9810B. The trade balance resulted in a deficit of JPY -663B.
Looking at seasonally adjusted terms, both exports and imports saw month-on-month declines, with exports decreasing by -1.2% mom to JPY 8800B and imports falling by -0.7% mom to JPY 9262B. Consequently, trade deficit widened from September's JPY -420B to JPY -462B.
Looking ahead
The European economic calendar is empty today. Canada will release housing starts in North American session. US will release jobless claims, Philly Fed survey, and industrial production.
AUD/USD Daily Report
Daily Pivots: (S1) 0.6481; (P) 0.6512; (R1) 0.6540; More...
Despite spiking higher to 0.6541, subsequent retreat in AUD/USD suggests that a temporary top was formed. Intraday bias is turned neutral for some consolidations first. Downside should be contained by 55 4H EMA (now at 0.6427) to bring rebound. Break of 0.6541, and sustained trading above 38.2% retracement of 0.6894 to 0.6269 at 0.6508, will argue that whole corrective fall from 0.7156 has completed with three waves down to 0.6269. Stronger rally should seen to falling channel resistance (now at 0.6684) next.
In the bigger picture, there is no confirmation that down trend from 0.8006 (2021 high) has completed. While current rebound from 0.6269 might extend higher, it could be the third leg of the corrective pattern from 0.6169 (2022 low) only. For now, medium term bearishness will remain as long as 0.6894 resistance holds.
Economic Indicators Update
| GMT | Ccy | Events | Actual | Forecast | Previous | Revised |
|---|---|---|---|---|---|---|
| 23:50 | JPY | Trade Balance (USD) Oct | -0.46T | -0.71T | -0.43T | |
| 23:50 | JPY | Machinery Orders M/M Sep | 1.40% | 0.90% | -0.50% | |
| 00:00 | AUD | Consumer Inflation Expectations Nov | 4.90% | 4.80% | ||
| 00:30 | AUD | Employment Change Oct | 55.0K | 22.8K | 6.7K | |
| 00:30 | AUD | Unemployment Rate Oct | 3.70% | 3.70% | 3.60% | |
| 04:30 | JPY | Tertiary Industry Index M/M Sep | -1.00% | -0.10% | -0.10% | 0.70% |
| 13:15 | CAD | Housing Starts Y/Y Oct | 255K | 270K | ||
| 13:30 | USD | Initial Jobless Claims (Nov 10) | 222K | 217K | ||
| 13:30 | USD | Import Price Index M/M Oct | -0.30% | 0.10% | ||
| 13:30 | USD | Philadelphia Fed Manufacturing Survey Nov | -11 | -9 | ||
| 14:15 | USD | Industrial Production M/M Oct | -0.40% | 0.30% | ||
| 14:15 | USD | Capacity Utilization Oct | 79.40% | 79.70% | ||
| 15:00 | USD | Natural Gas Storage |
CHFJPY Impulse Structure Should Extend Higher
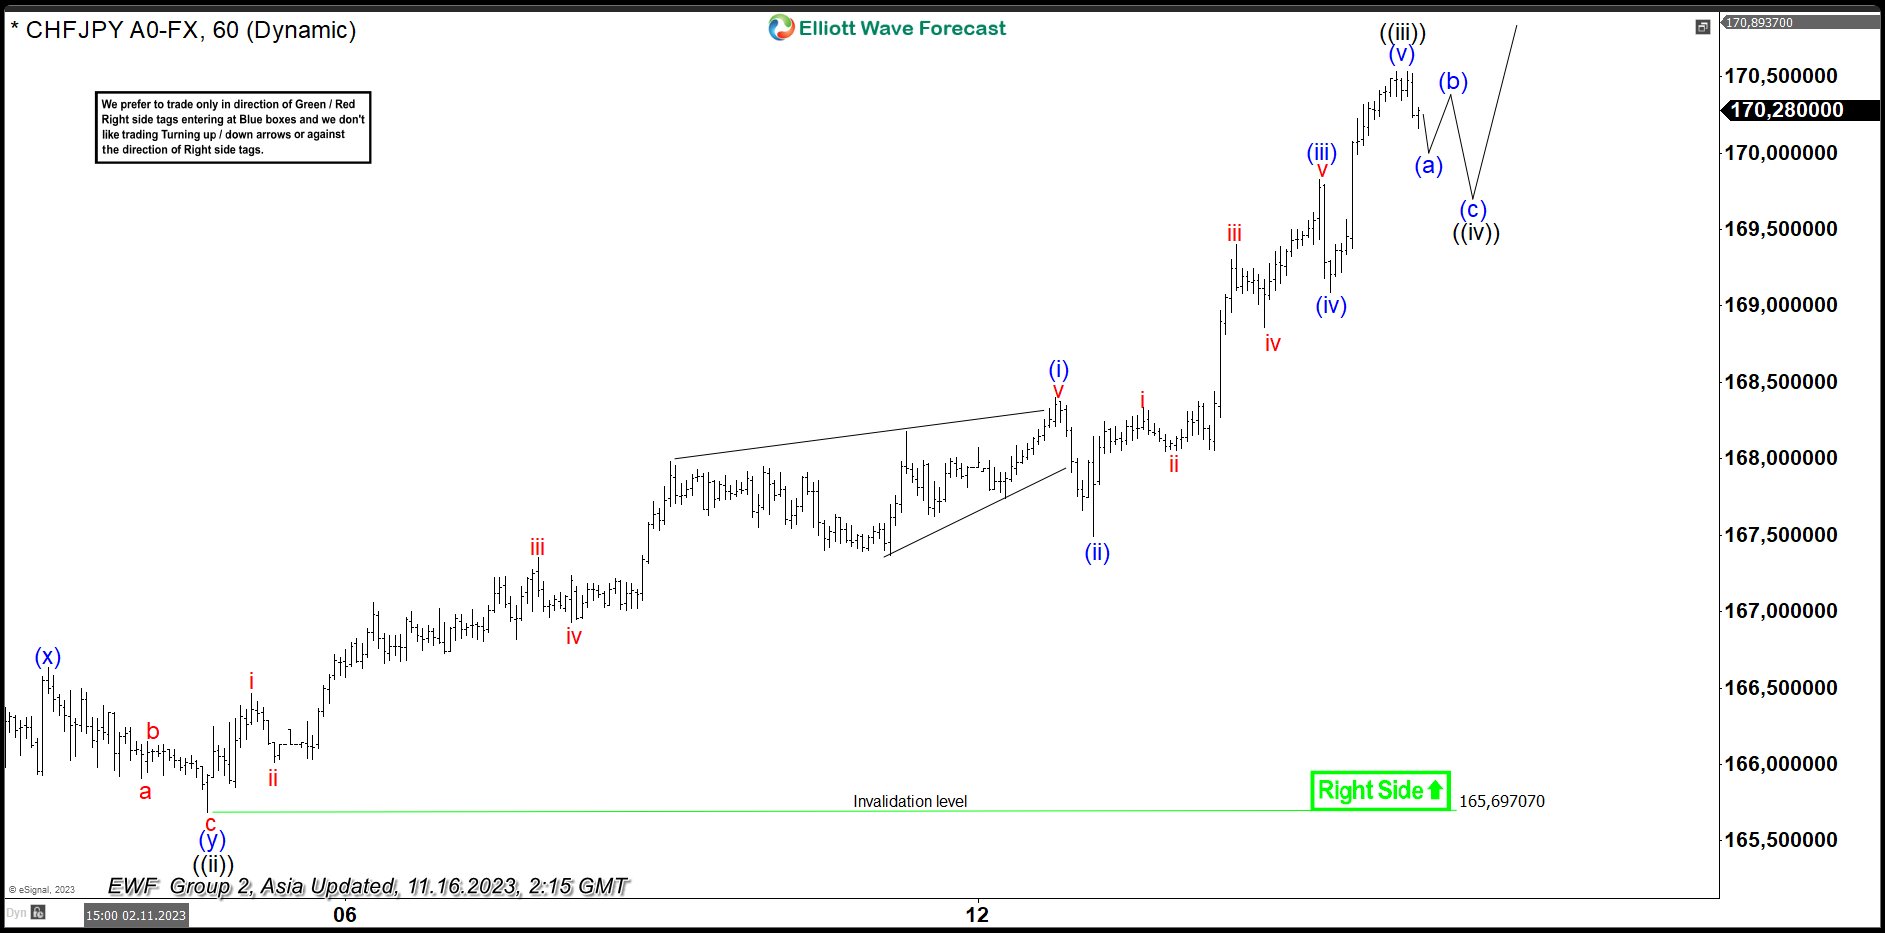
CHFJPY continues to make a sequence of higher high suggesting the pair is in a bullish market. Recent impulsive move higher looks incomplete and pair should continue to extend higher. Sequence from 10.3.2023 low is in progress as an impulse Elliott Wave structure. Up from 10.3.2023 low, wave 1 ended at 168.41 and dips in wave 2 ended at 164.96. Pair has resumed higher in wave 3 with internal subdivision as an impulse structure in lesser degree.
Up from wave 2, wave ((i)) ended at 167.22 and pullback in wave ((ii)) ended at 165.69 as the 1 hour chart below shows. Up from there, wave (i) ended at 168.4 and dips in wave (ii) ended at 167.49. Pair rallies higher in wave (iii) towards 169.82 and dips in wave (iv) ended at 169.08. Wave (v) higher ended at 170.535 which completed wave ((iii)) in higher degree. Pullback in wave ((iv)) is in progress to correct cycle from 11.3.2023 low before the rally resumes. Near term, as far as pivot at 165.69 low stays intact, expect pullback to find support in 3, 7, or 11 swing for further upside. Potential support for wave ((iv)) comes at 23.6 – 38.2% Fibonacci retracement of wave ((iii)). This area comes at 168.7 – 169.4.
CHFJPY 60 Minutes Elliott Wave Chart
CHFJPY Elliott Wave Video
https://www.youtube.com/watch?v=ew0tluG0g7s
Technical Outlook and Review
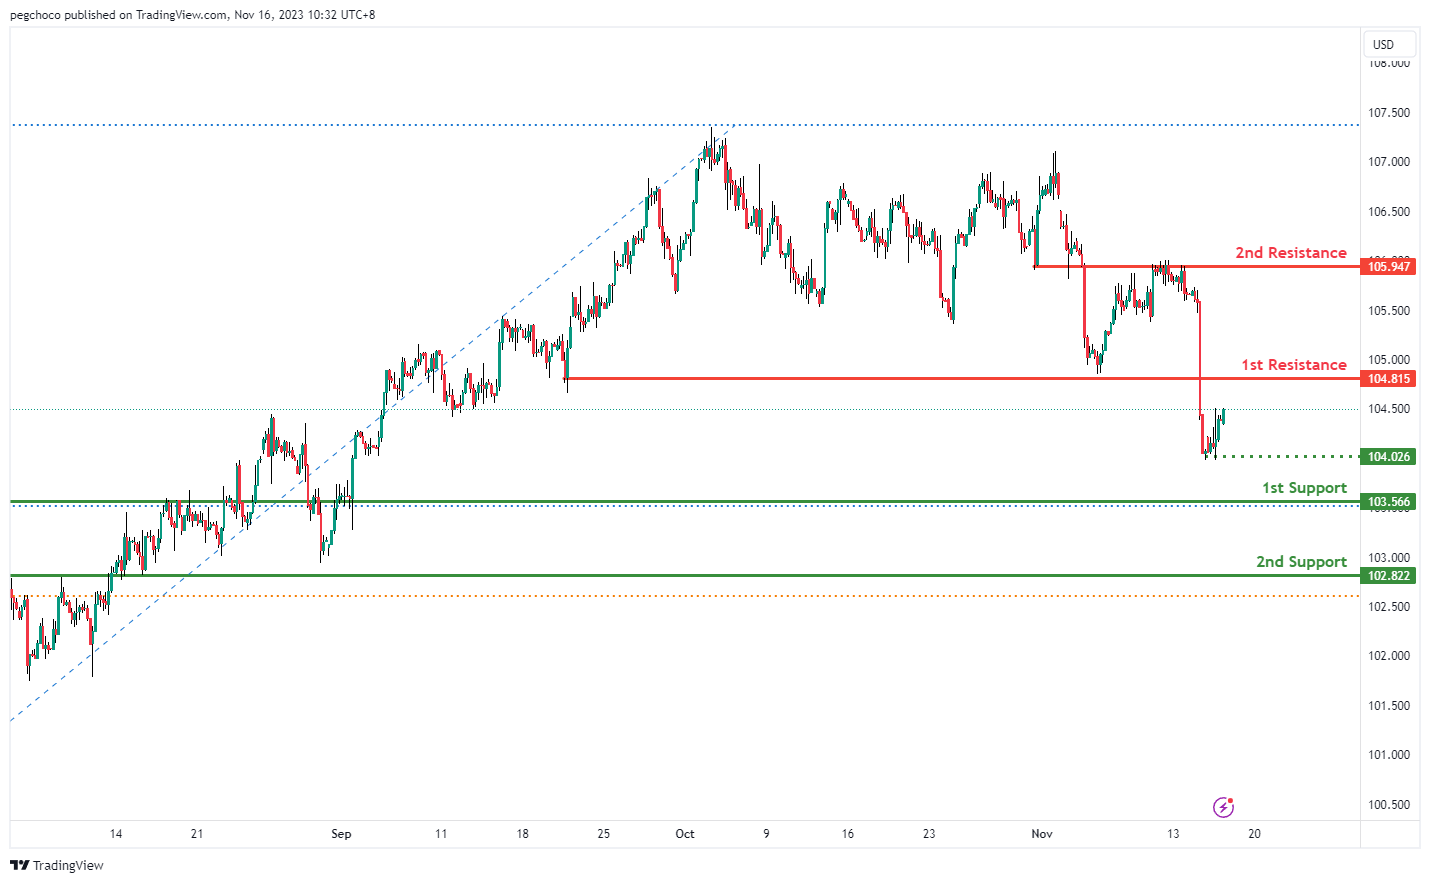
DXY:
The DXY (US Dollar Index) chart currently displays a bearish overall momentum, suggesting the potential for a bearish reaction off the 1st resistance level, followed by a drop towards the 1st support.
The 1st support at 103.56 is identified as an overlap support and also coincides with the 50% Fibonacci Retracement level. This confluence suggests that it could act as a significant level of support, where traders may expect the price to find buying interest or experience a pause in the bearish movement.
The 2nd support at 102.82 is categorized as an overlap support and coincides with the 61.80% Fibonacci Retracement level. This level further reinforces its potential as a support level, given the confluence of technical factors.
On the resistance side, the 1st resistance at 104.01 is noted as a pullback resistance. This level indicates a potential barrier to further upward movement, where selling interest may emerge.
The 2nd resistance at 105.94 is identified as an overlap resistance, suggesting another potential level where the price may encounter selling pressure during its bearish reaction.
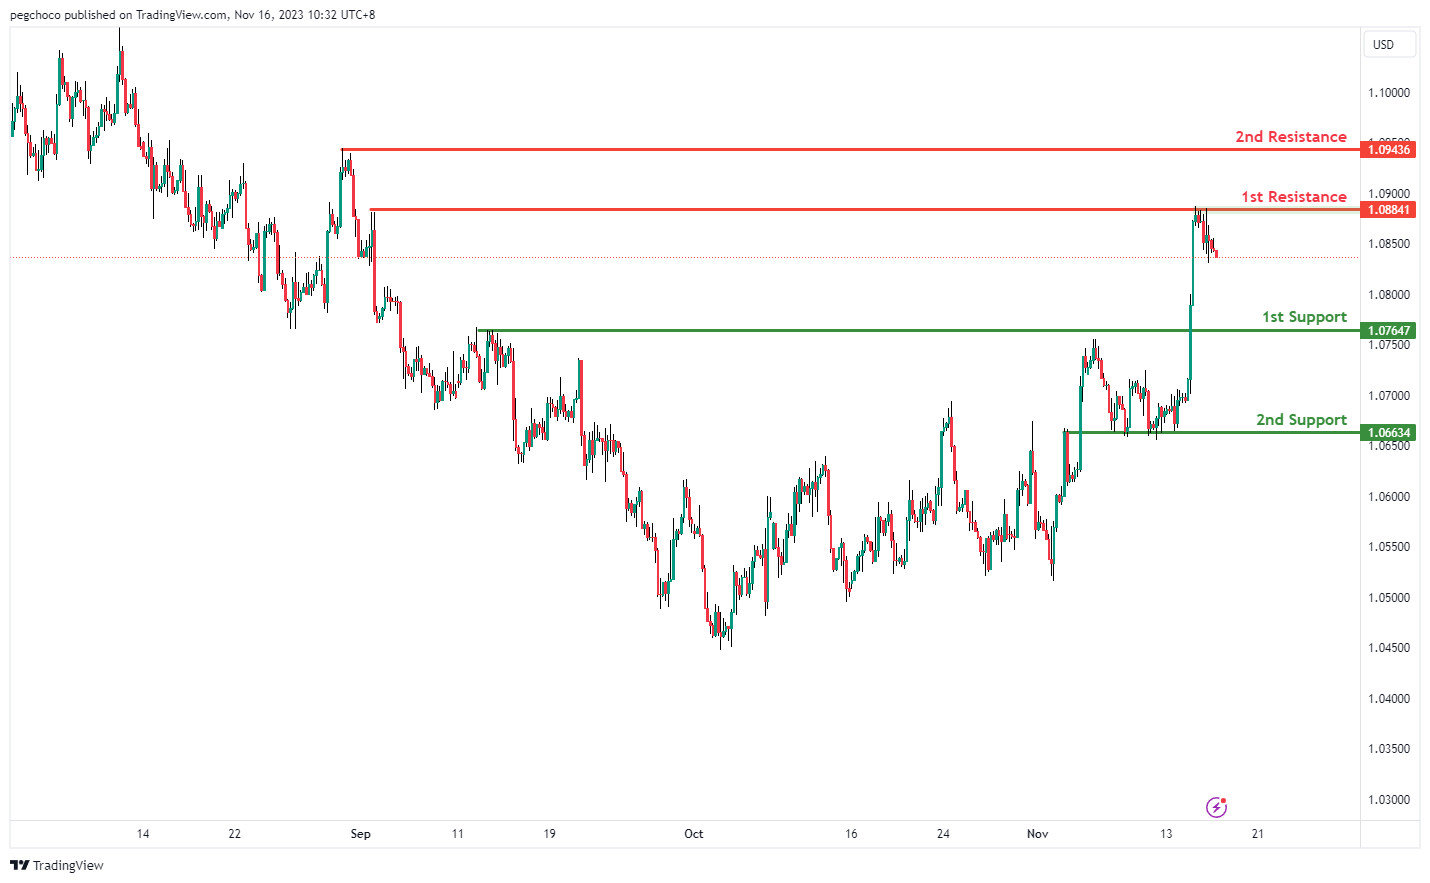
EUR/USD:
The EUR/USD chart currently exhibits a bearish overall momentum, indicating the potential for a bearish continuation towards the 1st support level.
The 1st support at 1.0764 is considered a pullback support level. This level suggests a potential area of support where traders may anticipate the price finding buying interest or experiencing a pause in its bearish movement.
The 2nd support at 1.0663 is categorized as an overlap support level. Overlap supports often carry significance as they represent areas where the price has previously found support, making it a relevant level to watch for potential price reactions.
On the resistance side, the 1st resistance at 1.0884 is identified as a multi-swing high resistance level. This level indicates a potential barrier to further upward movement, where selling interest may emerge.
The 2nd resistance at 1.0943 is characterized as a swing high resistance level. Swing highs often act as points of resistance, further reinforcing the potential for a bearish continuation.
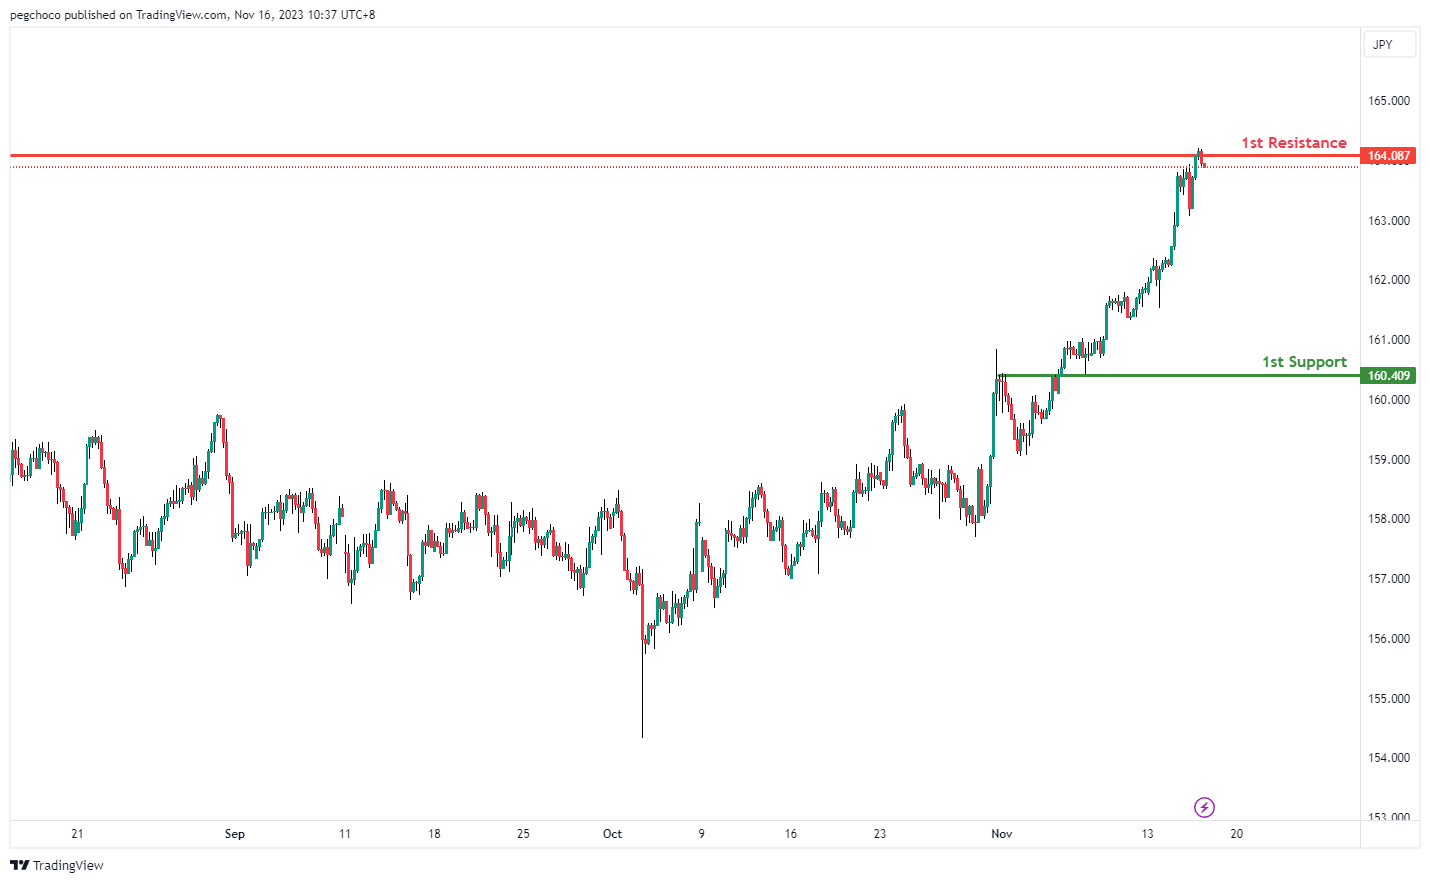
EUR/JPY:
The EUR/JPY chart currently exhibits a bearish overall momentum, suggesting the potential for a bearish reaction off the 1st resistance level and a subsequent drop towards the 1st support.
The 1st support at 160.40 is identified as an overlap support, indicating a price level where historical trading activity has occurred. It may act as a level where buyers could potentially step in or where selling pressure may decrease.
On the resistance side, the 1st resistance at 164.08 is categorized as a multi-swing high resistance. This level signifies an area where the price has faced significant selling pressure in the past, making it a relevant resistance level.
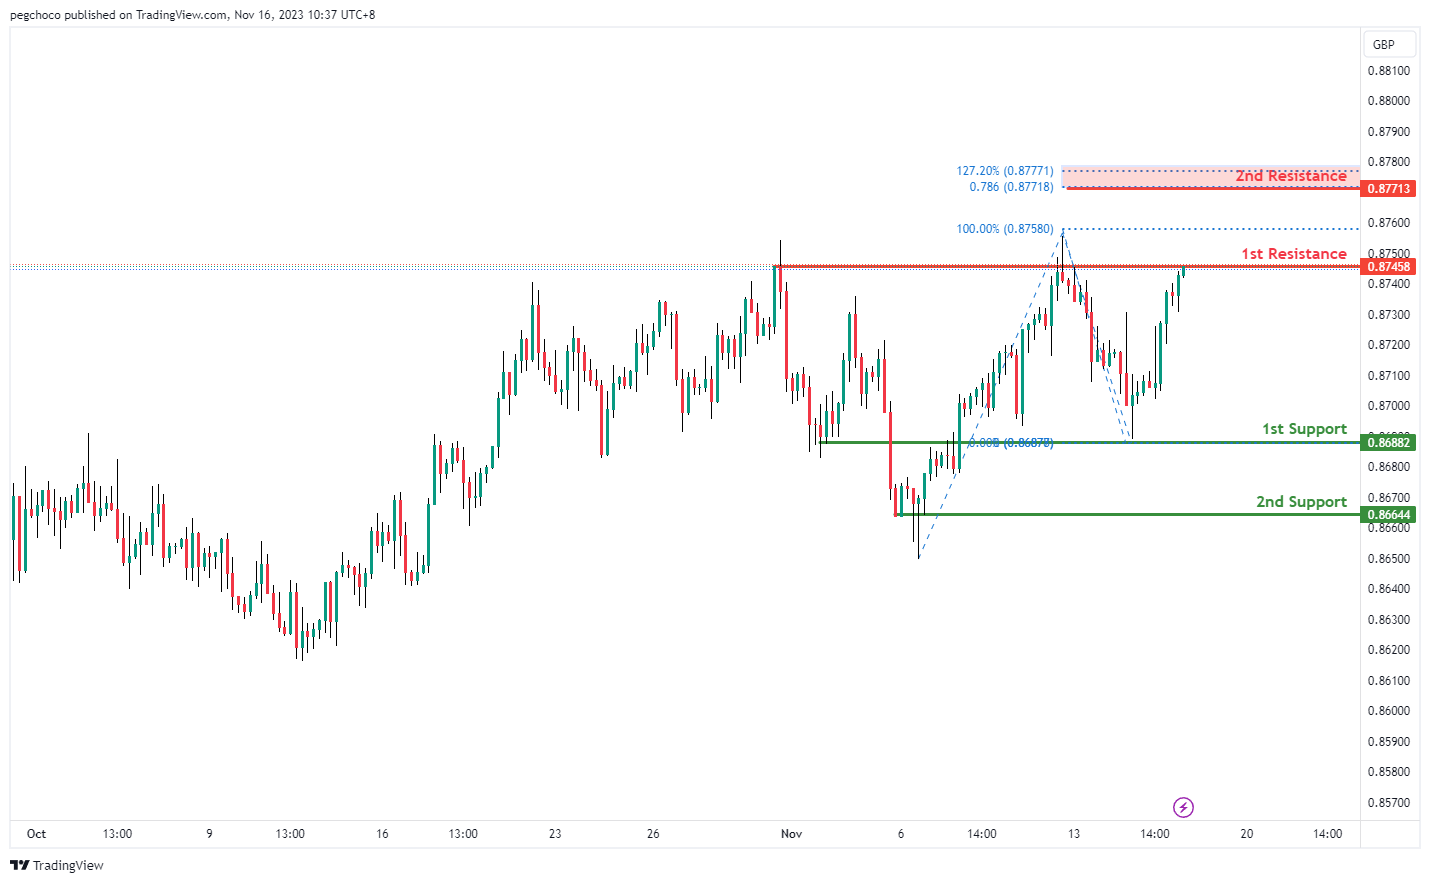
EUR/GBP:
The EUR/GBP chart currently demonstrates a bearish overall momentum, indicating the potential for a bearish reaction off the 1st resistance level, followed by a drop towards the 1st support.
The 1st support at 0.8713 is identified as an overlap support, signifying a historical price level where trading activity has occurred. It may act as a level where buyers could potentially step in or where selling pressure may decrease.
The 2nd support at 0.8664 is considered a multi-swing low support, reinforcing its significance as a support level. Multi-swing lows often indicate areas where buyers have intervened previously, making it a relevant support level.
On the resistance side, the 1st resistance at 0.8745 is categorized as a swing high resistance. This level represents a point where the price has encountered significant selling pressure in the past, making it a notable resistance level.
The 2nd resistance at 0.8771 is noteworthy as it is associated with both the 78.60% Fibonacci Projection and the 127.20% Fibonacci Extension. This indicates a potential Fibonacci confluence, suggesting a strong resistance barrier.
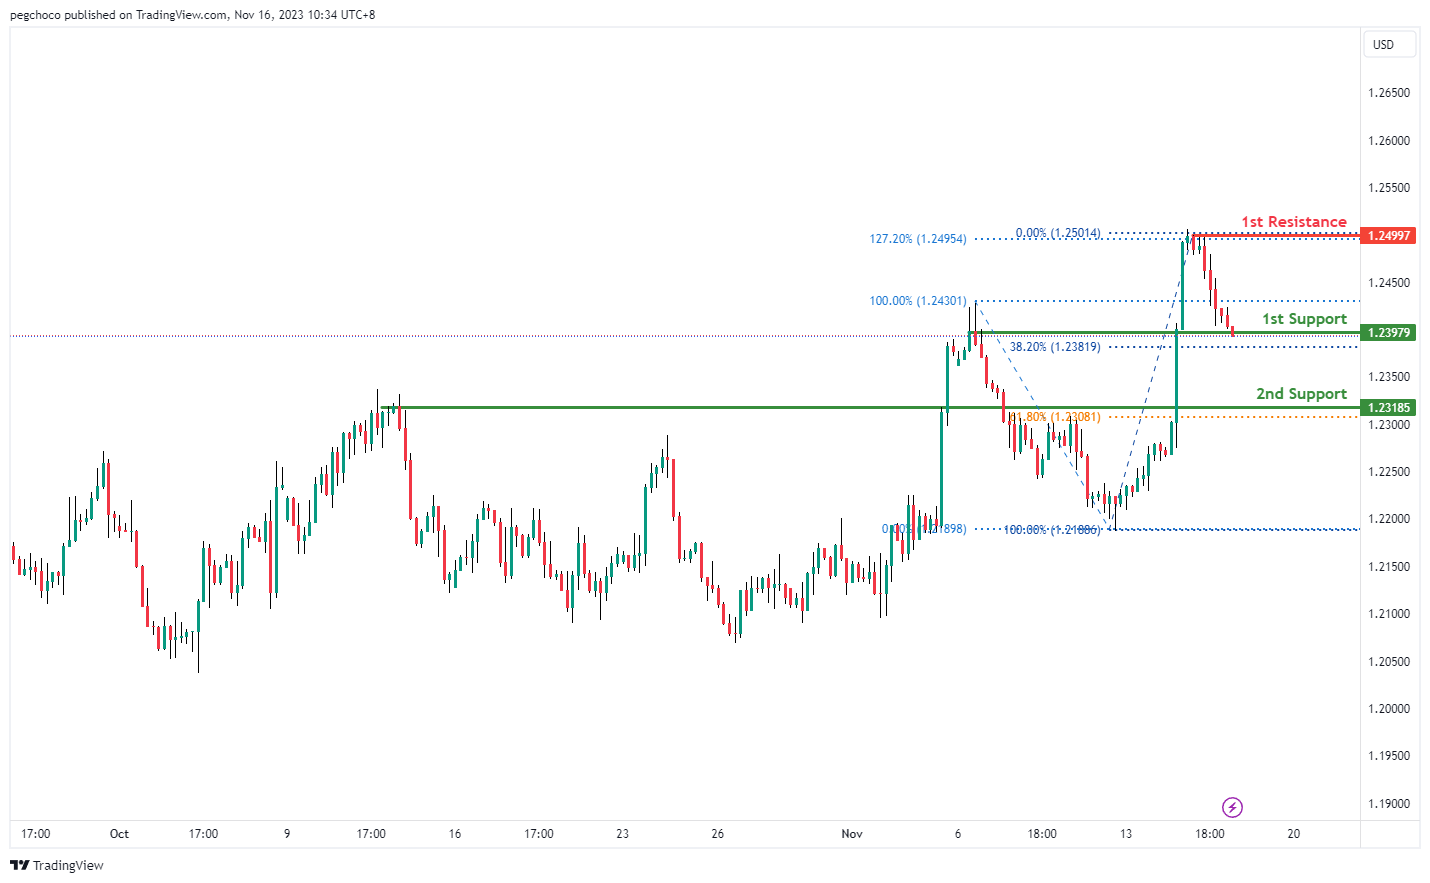
GBP/USD:
The GBP/USD chart currently has a bearish overall momentum, suggesting the potential for a bearish break off the 1st support level, followed by a drop towards the 2nd support level.
The 1st support at 1.23979 is identified as a pullback support and coincides with the 38.20% Fibonacci Retracement level. This level suggests a potential area of support where traders may expect the price to find buying interest or experience a pause in the bearish movement.
The 2nd support at 1.23185 is also categorized as a pullback support and coincides with the 61.80% Fibonacci Retracement level. It further reinforces its potential as a support level, indicating another relevant area where buyers may step in.
On the resistance side, the 1st resistance at 1.2499 is described as a swing high resistance and also coincides with the 127.20% Fibonacci Extension level. This level suggests a potential barrier to further upward movement, where selling interest may emerge.
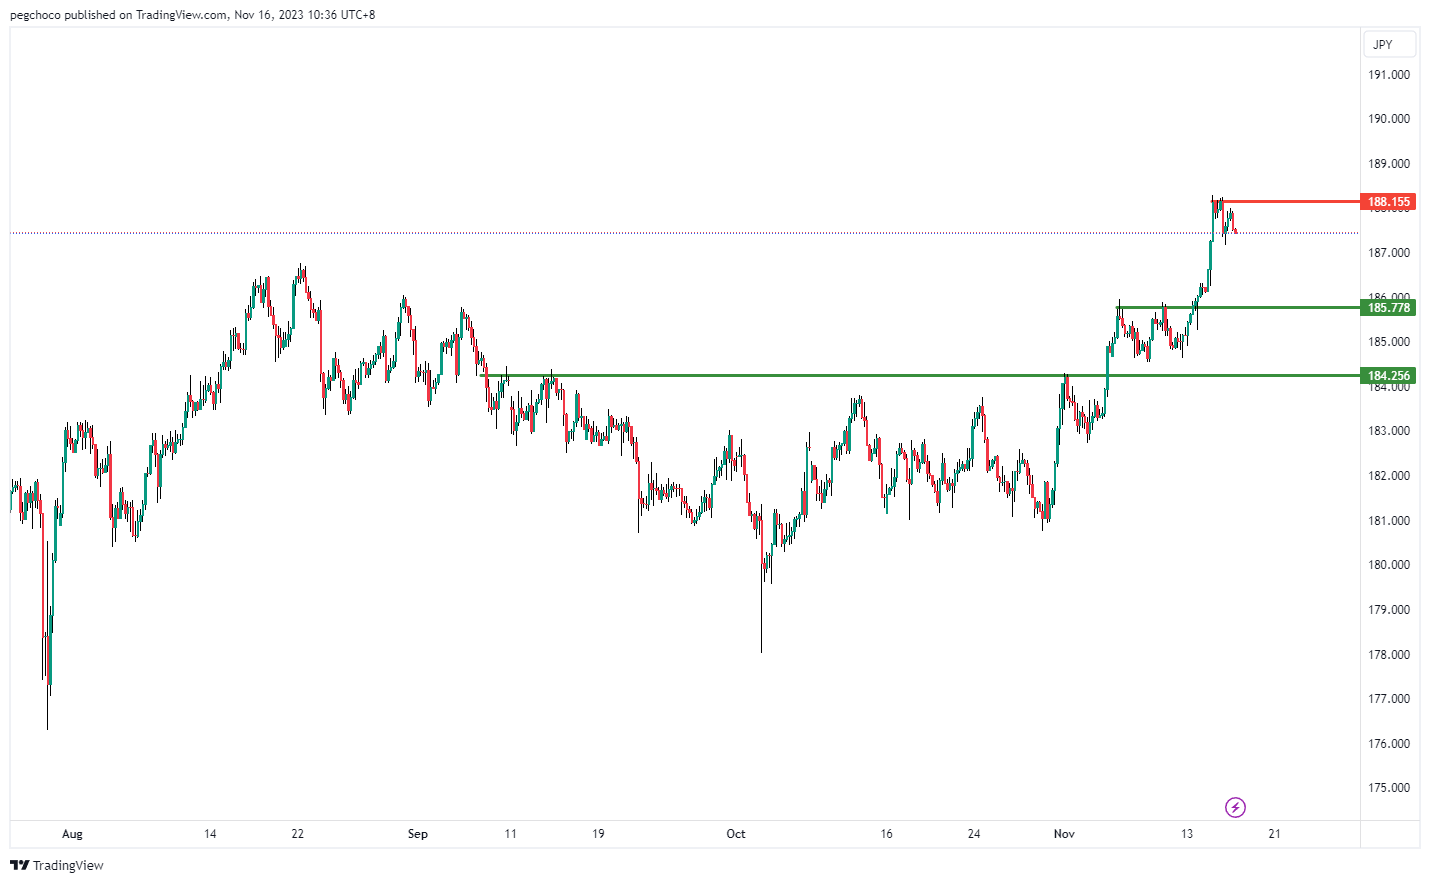
GBP/JPY:
The GBP/JPY chart currently exhibits a bearish overall momentum, suggesting the potential for a bearish continuation towards the 1st support level.
The 1st support at 185.77 is identified as a pullback support. This level signifies a point where the price may find buying interest or a temporary pause in the bearish movement. It is a level to watch for potential support.
The 2nd support at 184.25 is also a pullback support, reinforcing its significance as a potential level of support. Pullback supports are areas where buyers have previously stepped in, making them relevant support levels.
On the resistance side, the 1st resistance at 188.15 is categorized as a swing high resistance. This level represents a point where the price has encountered significant selling pressure in the past, making it a notable resistance level.
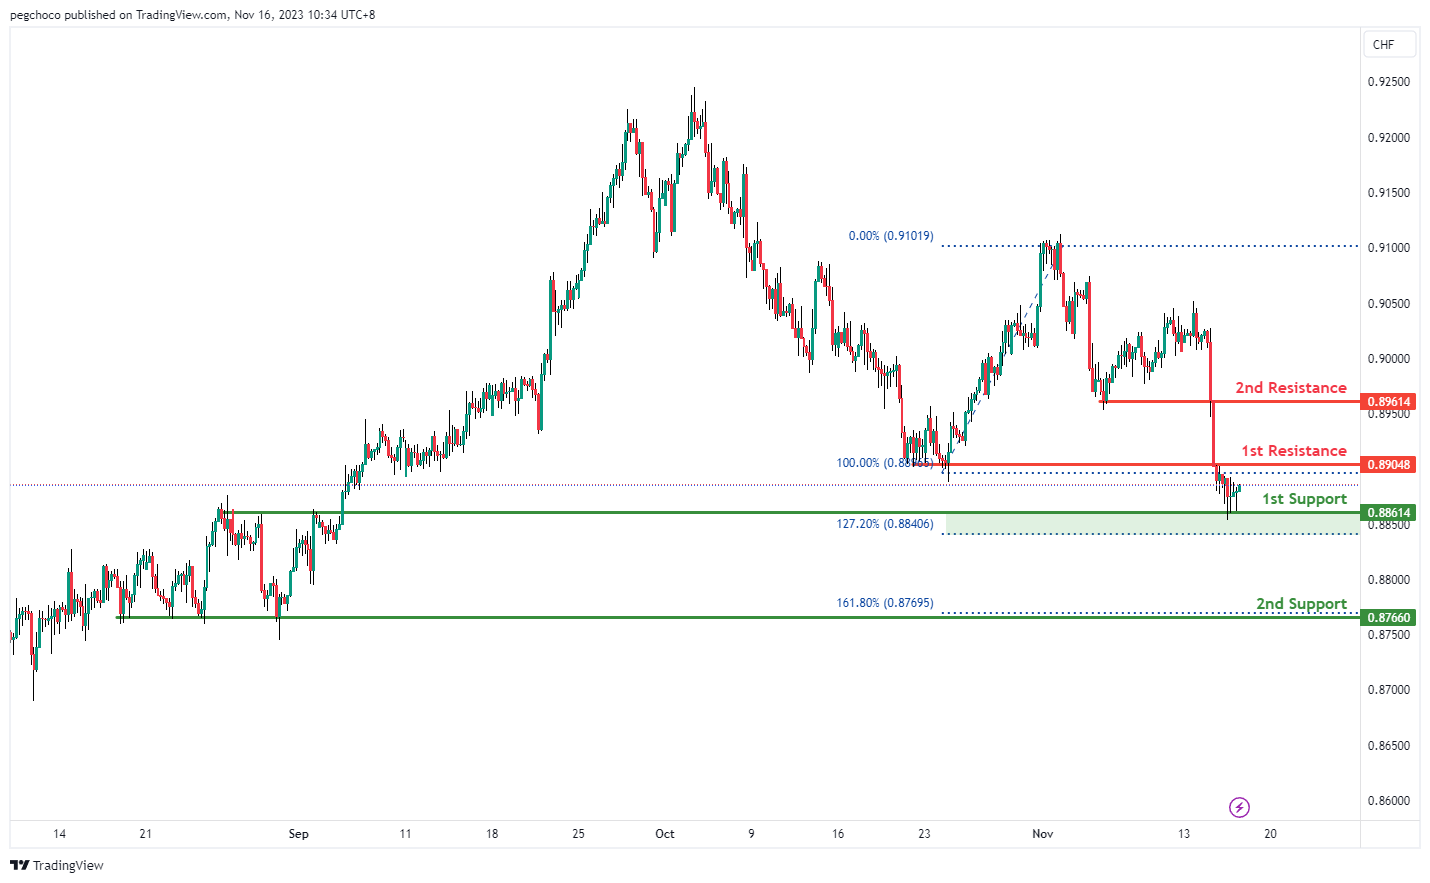
USD/CHF:
The USD/CHF chart currently shows a neutral overall momentum, suggesting that price could potentially fluctuate between the 1st resistance and 1st support levels.
The 1st support at 0.8861 is considered a pullback support level, and it also coincides with the 127.20% Fibonacci Extension, making it a significant level to watch. This level may act as a potential area of support where traders could expect buying interest or a pause in downward movement.
The 2nd support at 0.8766 is categorized as a multi-swing low support and is further reinforced by the 161.80% Fibonacci Extension. Multi-swing lows often indicate areas where buyers have previously stepped in, making it a relevant support level.
On the resistance side, the 1st resistance at 0.8904 is identified as a pullback resistance. This level suggests a potential area where selling interest may emerge, potentially leading to a pause or reversal in the upward movement.
The 2nd resistance at 0.8961 is also characterized as a pullback resistance, reinforcing the potential for a price reversal or a barrier to further upward movement.
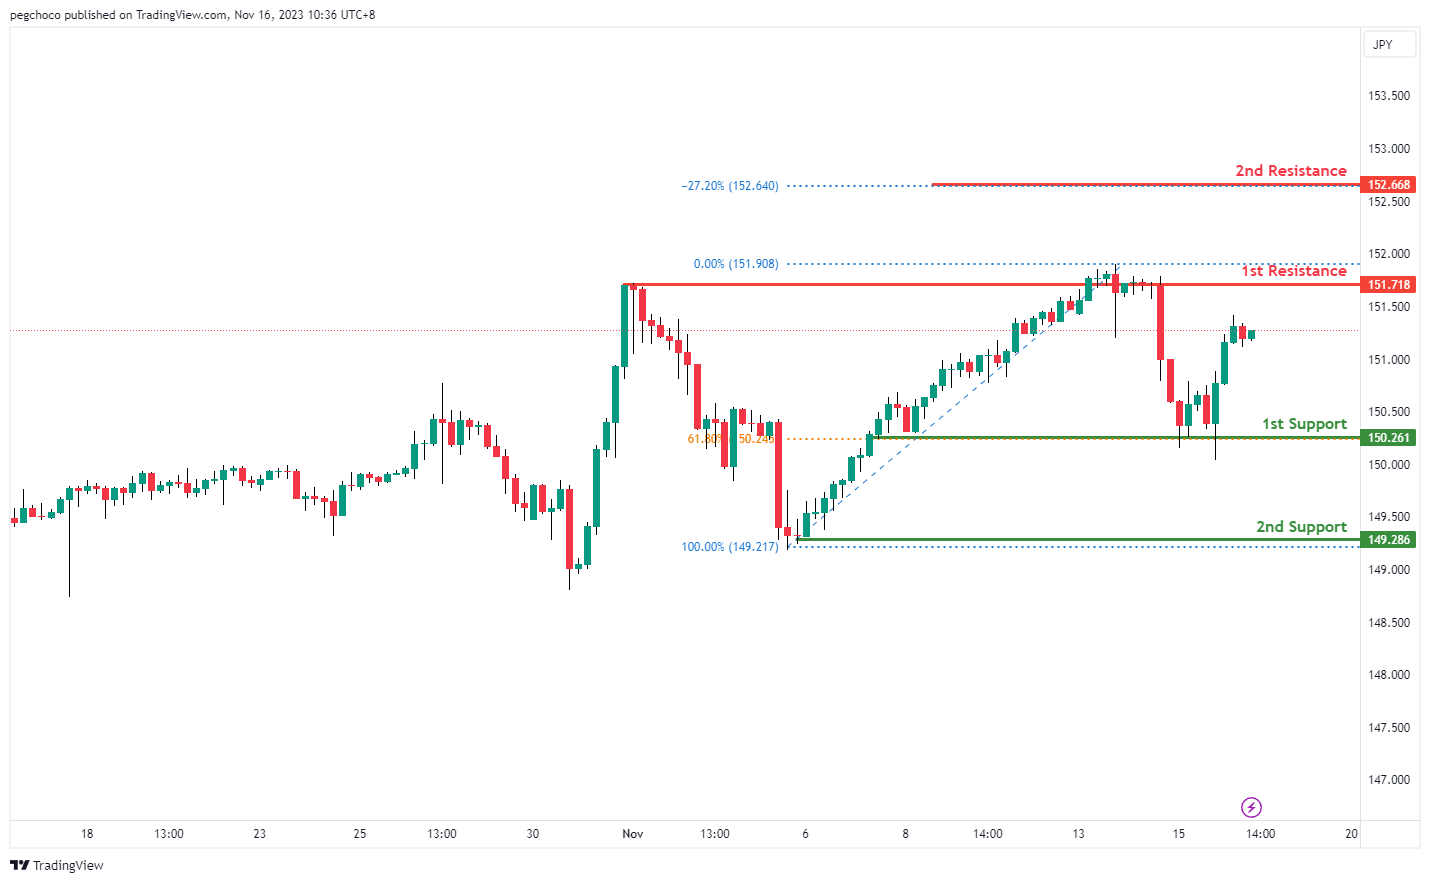
USD/JPY:
The USD/JPY chart currently exhibits a bullish overall momentum, suggesting the potential for a bullish continuation towards the 1st resistance level.
The 1st support at 150.26 is identified as an overlap support, and it also coincides with the 61.80% Fibonacci Retracement level. This level indicates a significant area of potential support, where traders may expect buying interest or a pause in the upward movement.
The 2nd support at 149.28 is considered a swing low support, further reinforcing its potential as a support level. Swing lows often signify areas where buyers have stepped in previously, making it a relevant support level.
On the resistance side, the 1st resistance at 151.71 is categorized as a multi-swing high resistance. This level suggests that there may be selling interest in this area, potentially acting as a barrier to further upward movement.
The 2nd resistance at 152.66 is noted as a level associated with the -27% Fibonacci Extension, indicating another potential area where the price may encounter selling pressure during its bullish continuation.
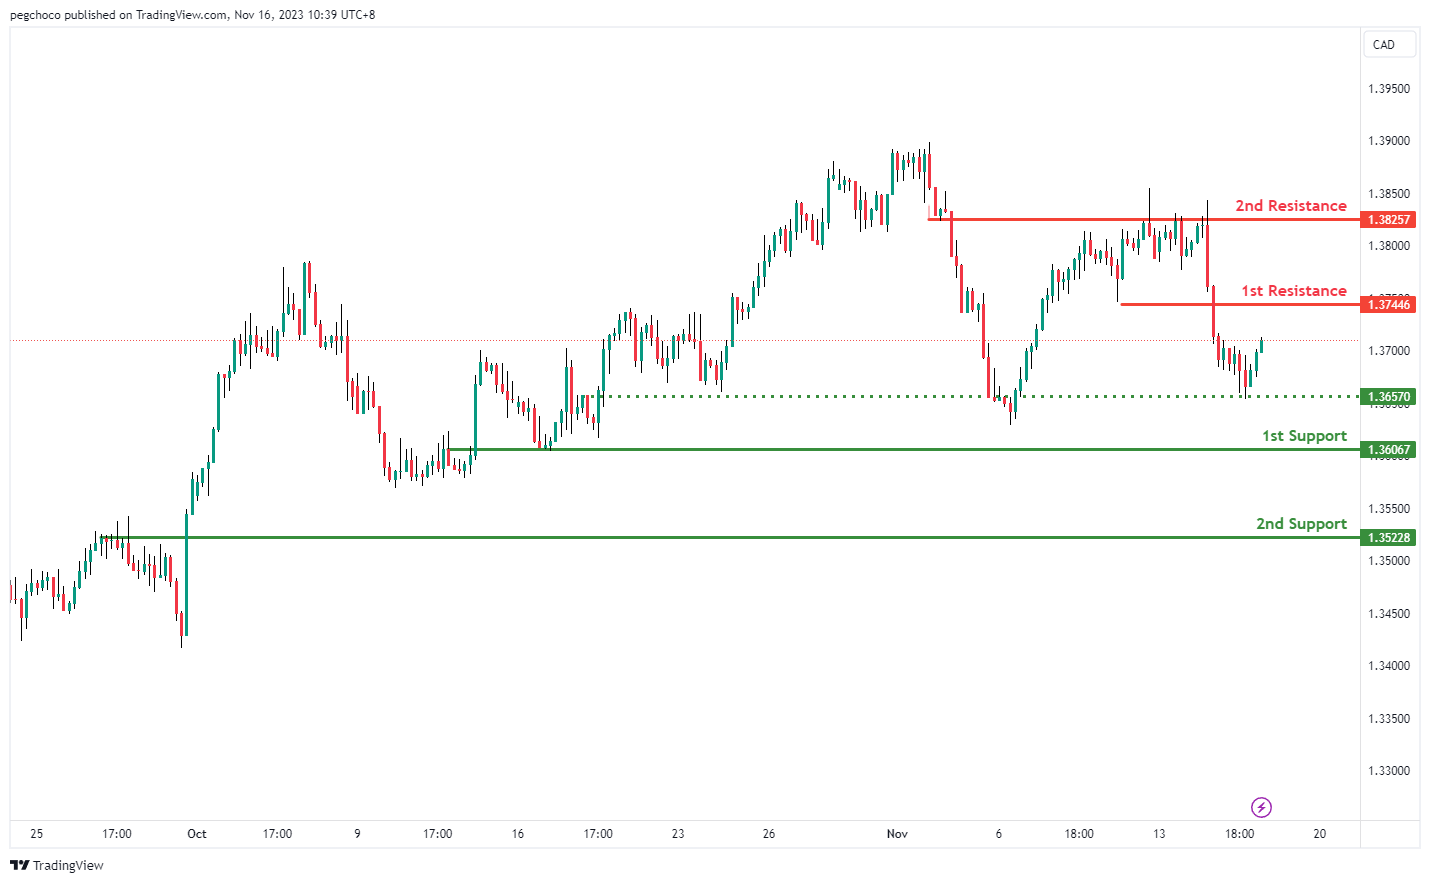
USD/CAD:
The USD/CAD chart currently shows a weak bullish momentum, indicating the potential for further upside movement towards the 1st resistance.
The 1st resistance level at 1.3745 is identified as a pullback resistance. Higher up, the 2nd resistance level at 1.3826 is marked as an overlap resistance, highlighting a potential barrier against further upward momentum.
To the downside, the intermediate support at 1.3657 is identified as an overlap support while the 1st support level at 1.3607 is also marked as an overlap support. Further below, the 2nd support level at 1.3523 is noted as a pullback support.
AUD/USD:
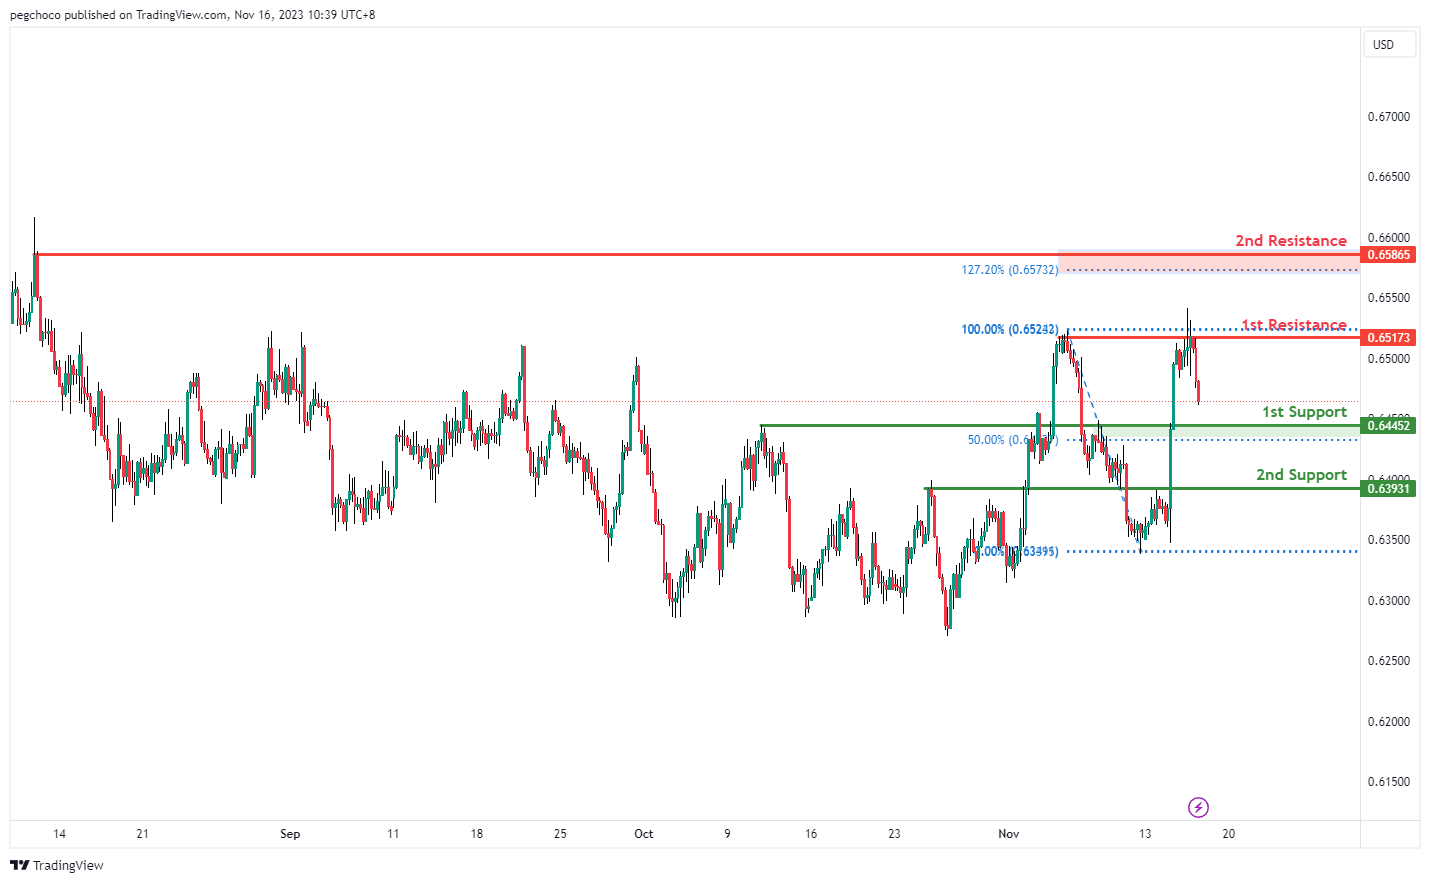
The AUD/USD chart currently exhibits an overall bearish momentum, suggesting the potential for a bearish continuation towards the 1st support.
The 1st support level at 0.6455 is identified as a pullback support that aligns close to the 50.00% retracement level. Further below, the 2nd support level at 0.6393 is marked as an overlap support, suggesting a significant support level.
To the upside, the 1st resistance level at 0.6517 is identified as a multi-swing-high resistance. Higher up, the 2nd resistance level at 0.6587 is marked as a pullback resistance, suggesting that it could serve as a strong resistance level.
NZD/USD
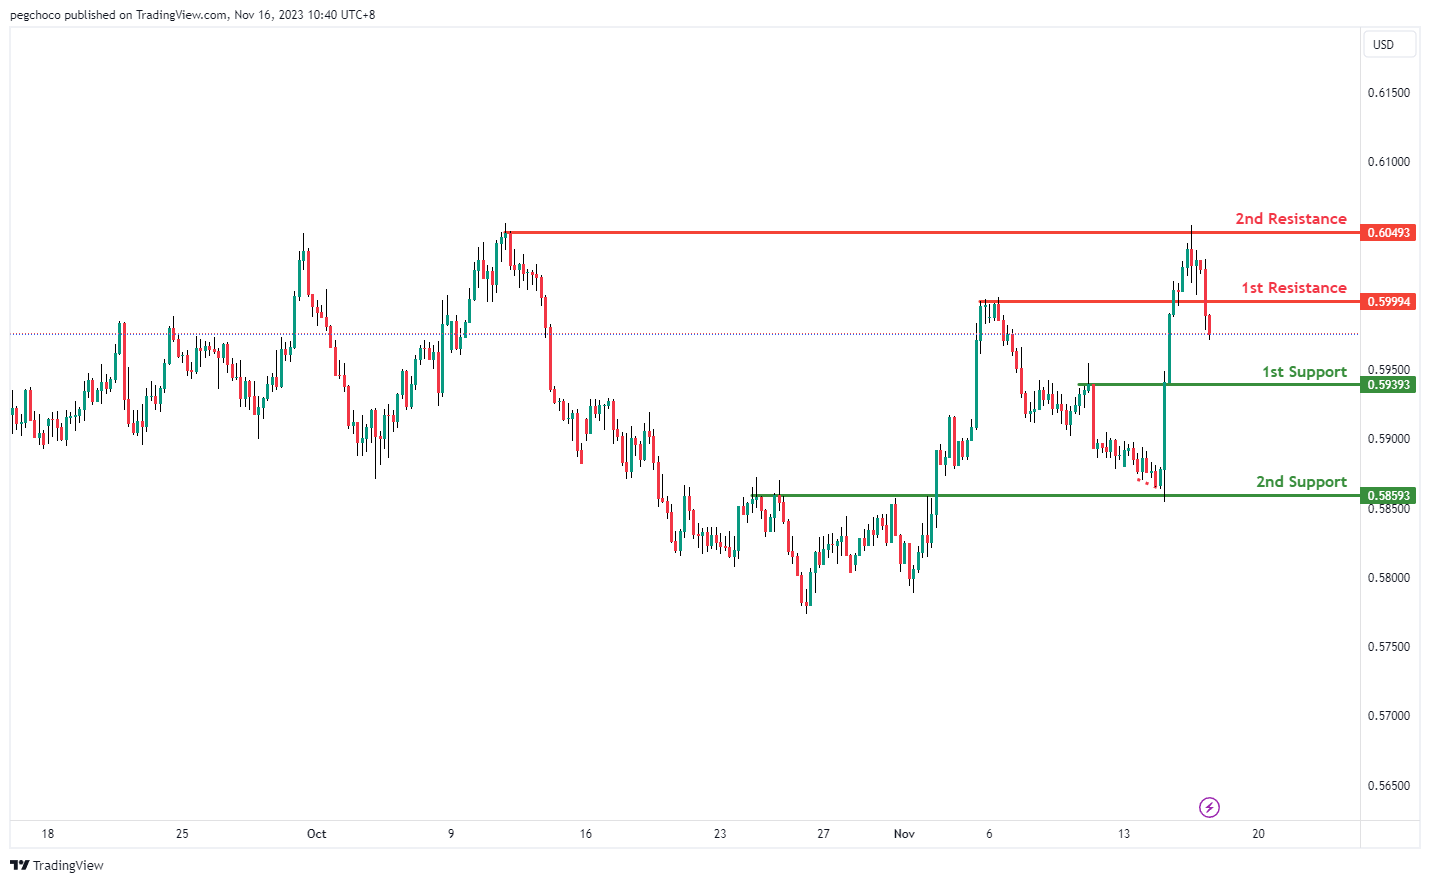
The NZD/USD chart currently exhibits an overall bearish momentum, suggesting the potential for a bearish continuation towards the 1st support.
The 1st support level at 0.5939 is identified as a pullback support. Further below, the 2nd support level at 0.5859 is noted as an overlap support, signifying its significance as a strong support area.
To the upside, the 1st resistance level at 0.5999 is identified as a pullback resistance while the 2nd resistance level at 0.6049 is marked as a multi-swing-high resistance, indicating its potential strength as a barrier to further bullish movement.
DJ30:
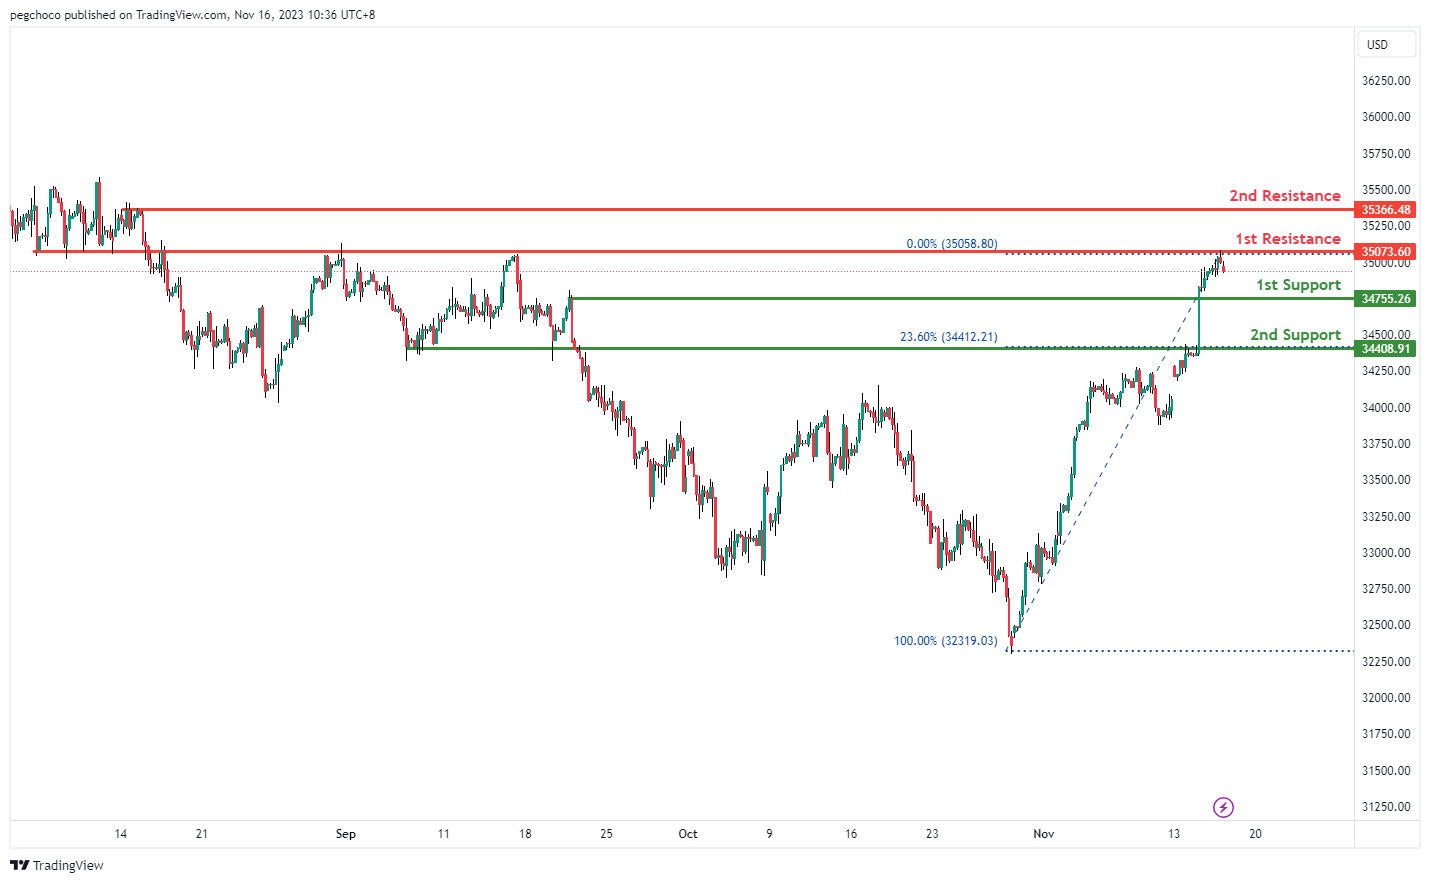
The DJ30 chart is currently showing an overall bearish momentum, with price making a bearish reaction off the 1st resistance and potentially make a bearish continuation towards the 1st support.
The 1st resistance level at 35073.60 is marked as an overlap resistance. Higher up, the 2nd resistance level at 35366.48 is noted as a pullback resistance, indicating a potential resistance area for further upward movement.
On the support side, the 1st support level at 34755.26 is identified as a pullback support. Further below, the 2nd support level at 34408.91 is noted as an overlap support, marking another potential level for a strong support area.
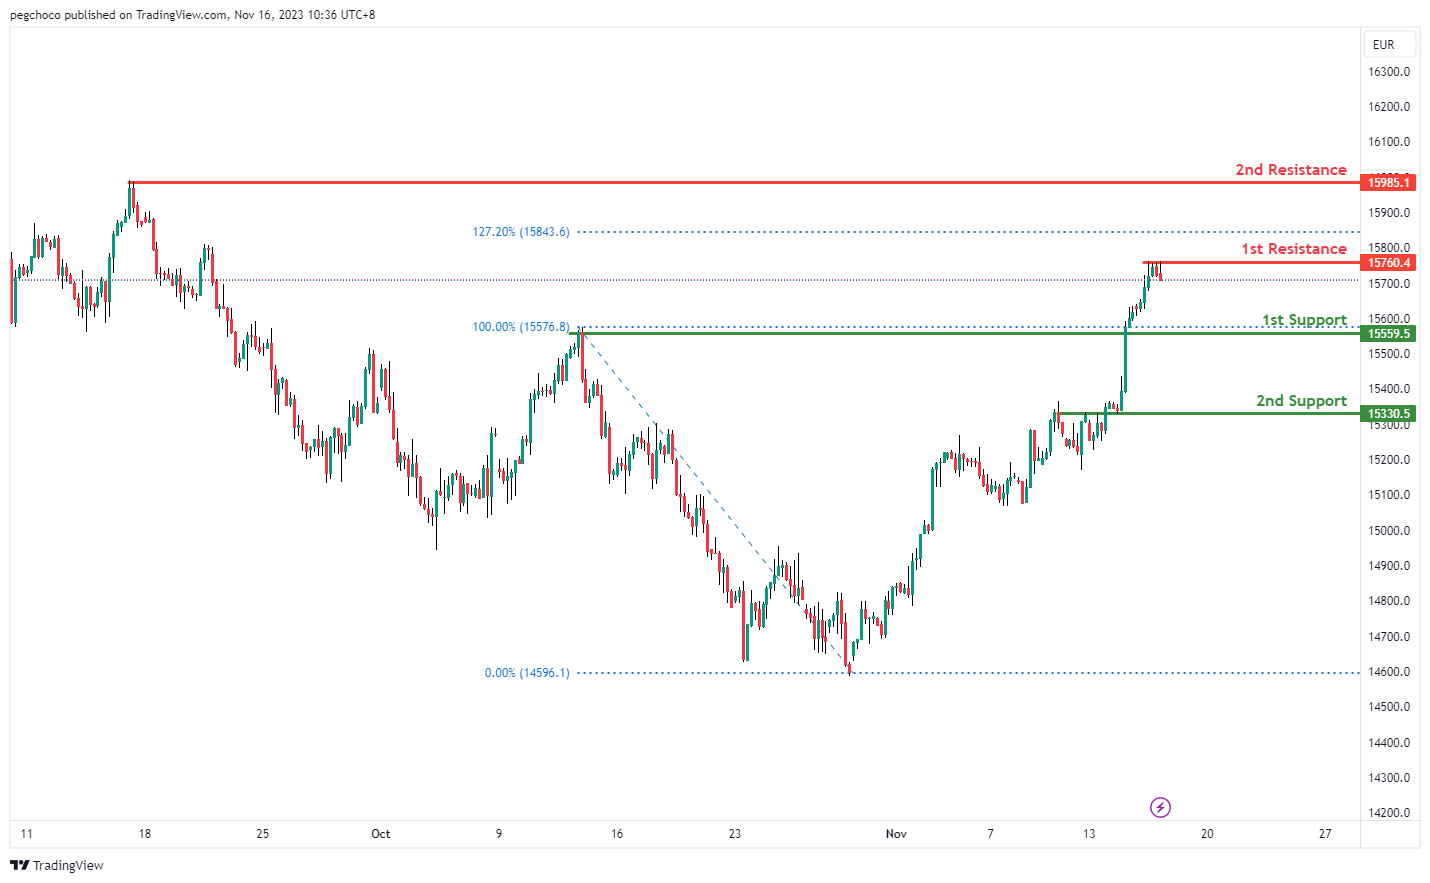
GER40:
The GER40 chart is currently displaying an overall bearish momentum, with price making a bearish reaction off the 1st resistance and potentially make a bearish continuation towards the 1st support.
The 1st resistance level at 15760.40 is marked as a pullback resistance that aligns close to the 127.20% Fibonacci extension level. Higher up, the 2nd resistance level at 15985.10 is noted as a swing-high resistance, indicating a potential resistance area for further upward movement.
On the support side, the 1st support level at 15559.50 is identified as a pullback support. Further below, the 2nd support level at 15330.50 is noted as an overlap support, marking another potential level for a strong support area.
US500
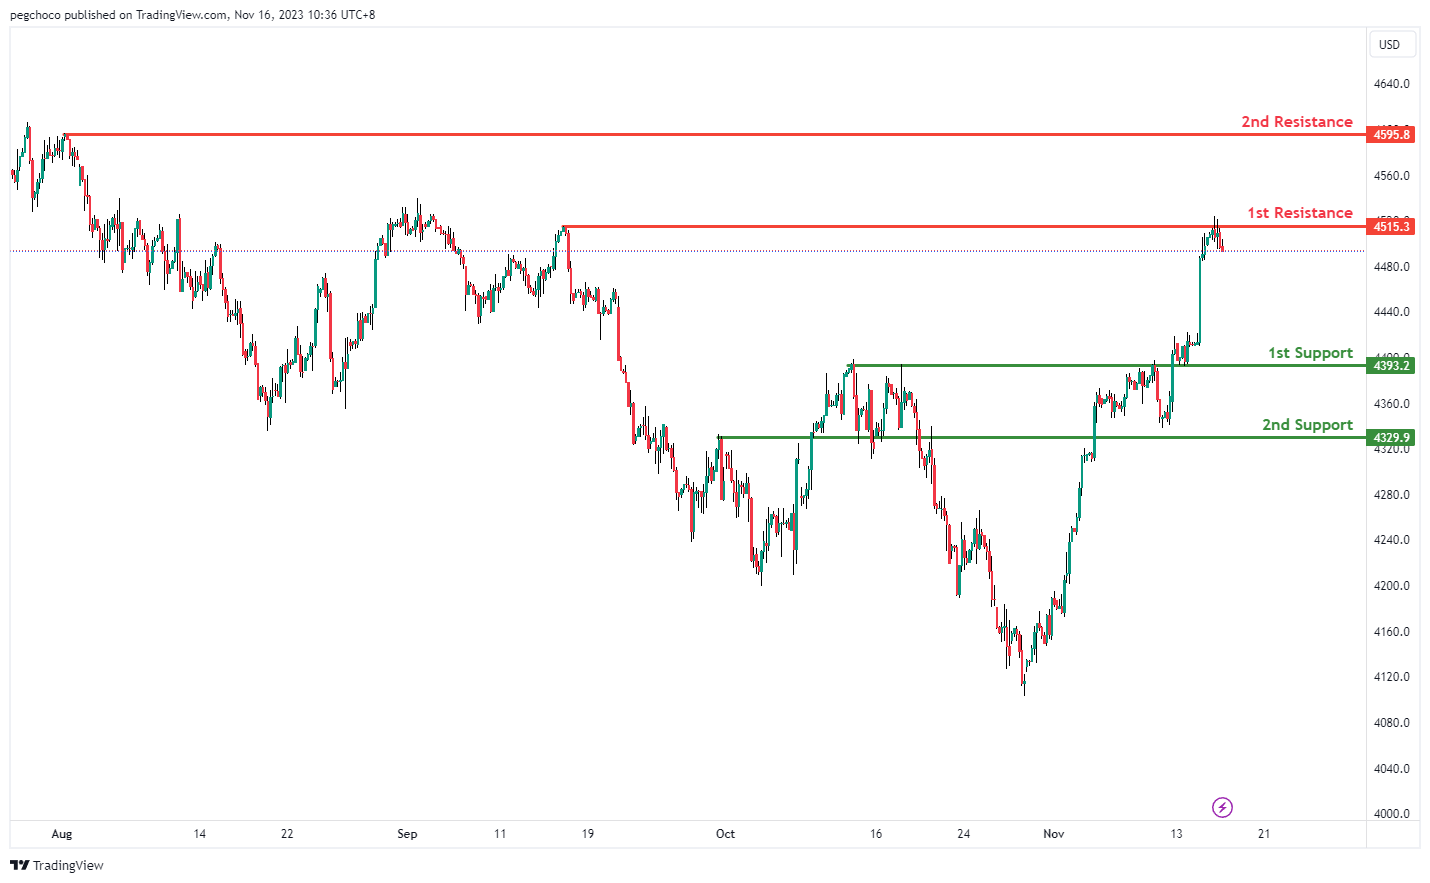
The US500 chart is currently indicating an overall bearish momentum, with price making a bearish reaction off the 1st resistance and potentially make a bearish continuation towards the 1st support.
The 1st resistance level at 4515.30 is marked as a pullback resistance. Higher up, the 2nd resistance level at 4595.80 is also noted as a pullback resistance, indicating a potential resistance area for further upward movement.
On the support side, the 1st support level at 4393.20 is identified as an overlap support. Further below, the 2nd support level at 4329.90 is also noted as an overlap support, marking another potential level for a strong support area.
BTC/USD:
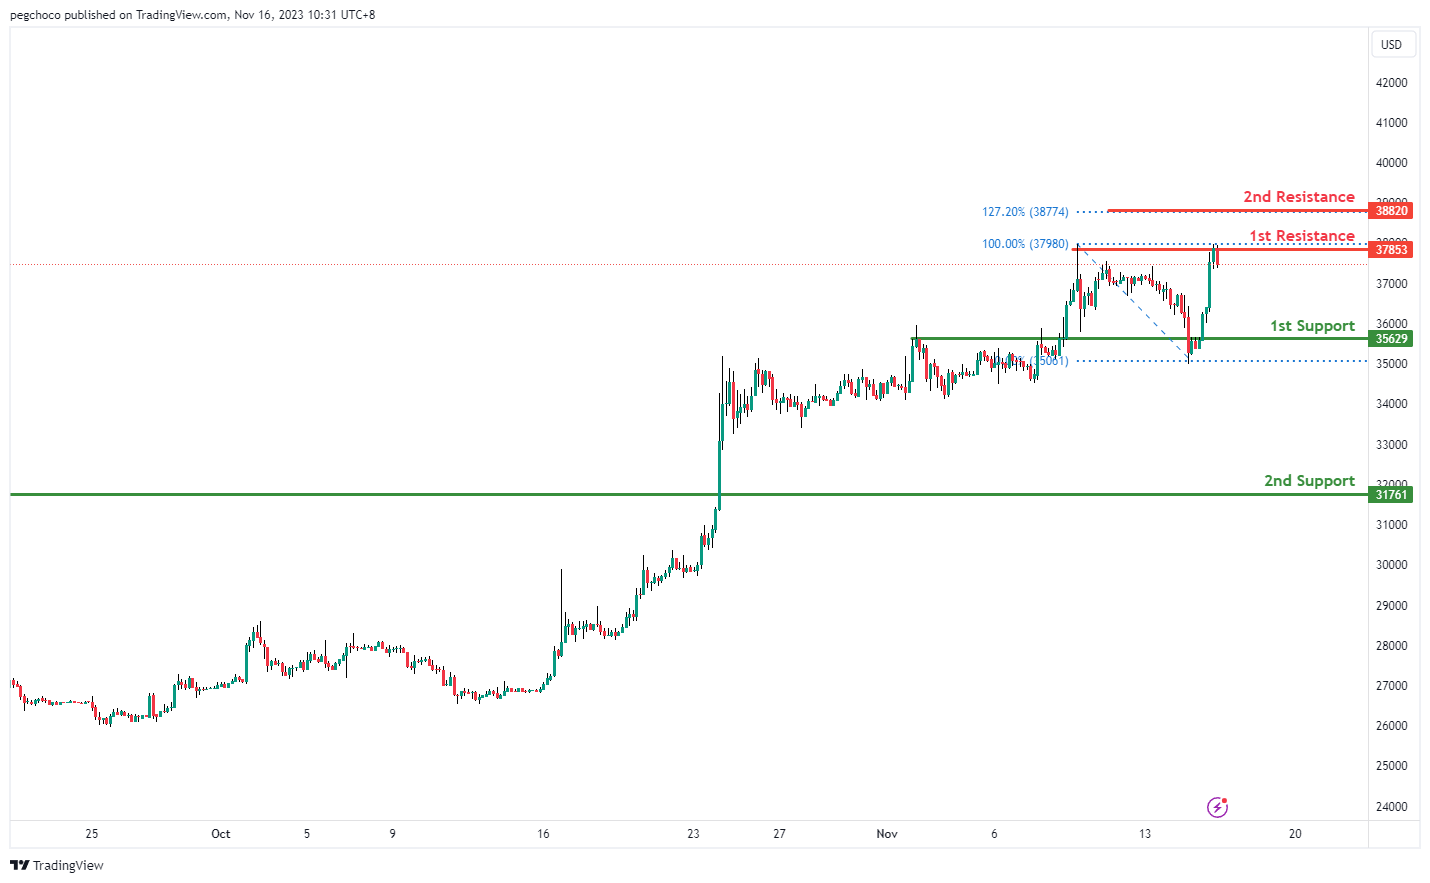
The BTC/USD chart currently exhibits a bearish overall momentum, suggesting the potential for a bearish reaction off the 1st resistance level and a drop towards the 1st support.
The 1st support at 35,629 is identified as a pullback support. This level indicates a point where buyers may step in or where a temporary pause in the bearish movement could occur. It is a level to watch for potential support.
The 2nd support at 31,761 is also a pullback support, reinforcing its significance as a potential support level. Pullback supports often indicate areas where buyers have previously intervened, making them relevant support levels.
On the resistance side, the 1st resistance at 37,853 is categorized as a swing high resistance. This level represents a point where the price has previously encountered significant selling pressure, making it a notable resistance level.
The 2nd resistance at 38,820 is noted as the 127.20% Fibonacci Extension level, which suggests a potential barrier to further upward movement
ETH/USD:
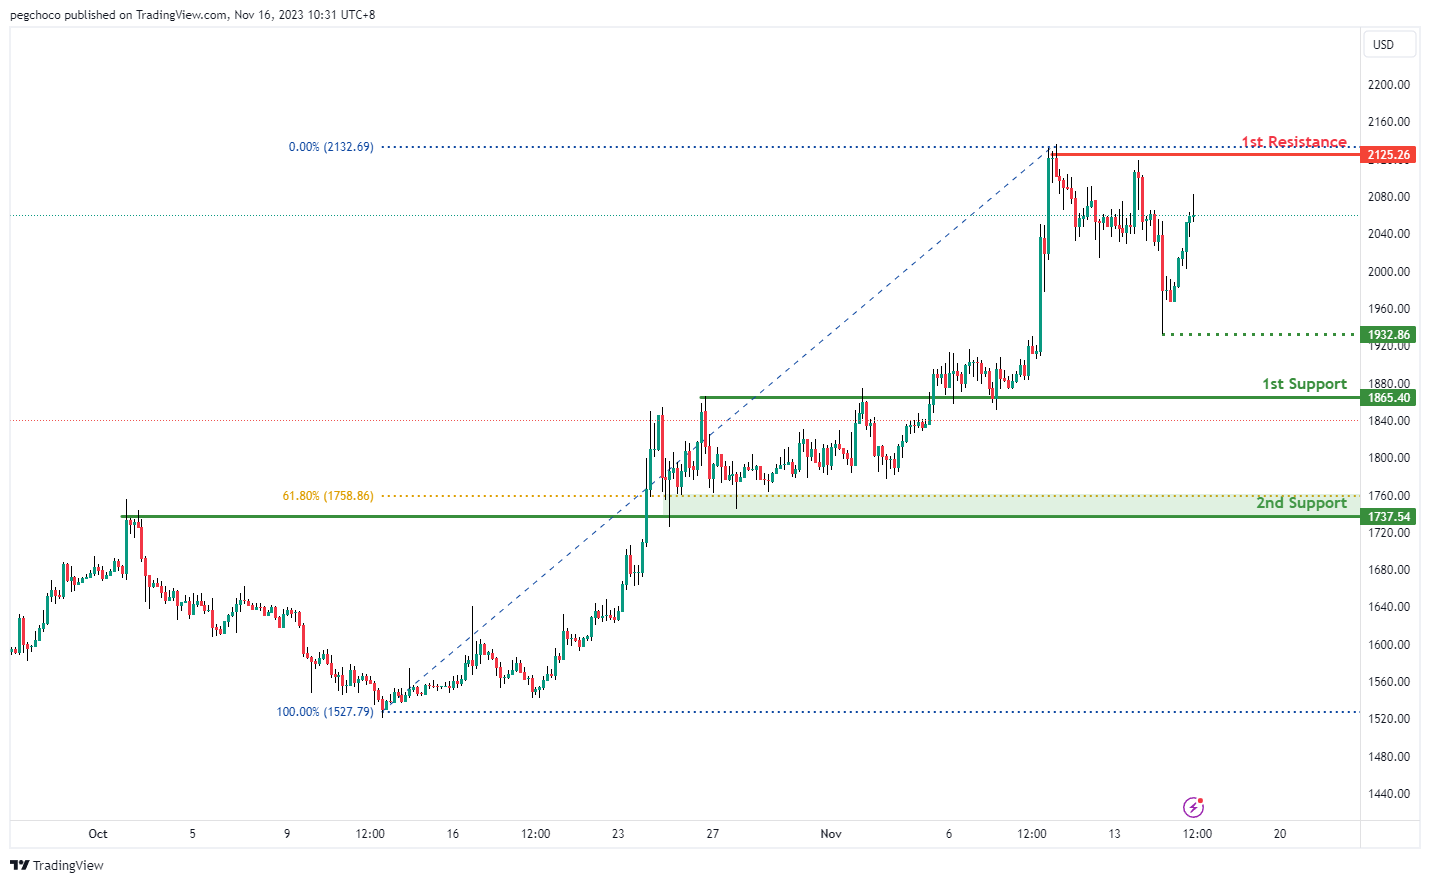
The ETH/USD chart currently demonstrates a bearish overall momentum, suggesting the potential for a bearish continuation towards the 1st support level.
The 1st support at 1,865.40 is identified as an overlap support. This level indicates a potential area where buyers may show interest or where a pause in the bearish movement could occur. It is a key level to watch for potential support.
The 2nd support at 1,737.54 is also an overlap support and coincides with the 61.80% Fibonacci Retracement level. This adds to its significance as a potential support level. Fibonacci retracement levels are commonly used by traders to identify key support and resistance areas.
On the resistance side, the 1st resistance at 2,125.26 is categorized as a multi-swing high resistance. This level represents a point where the price has previously faced notable selling pressure, making it an important resistance level to monitor.
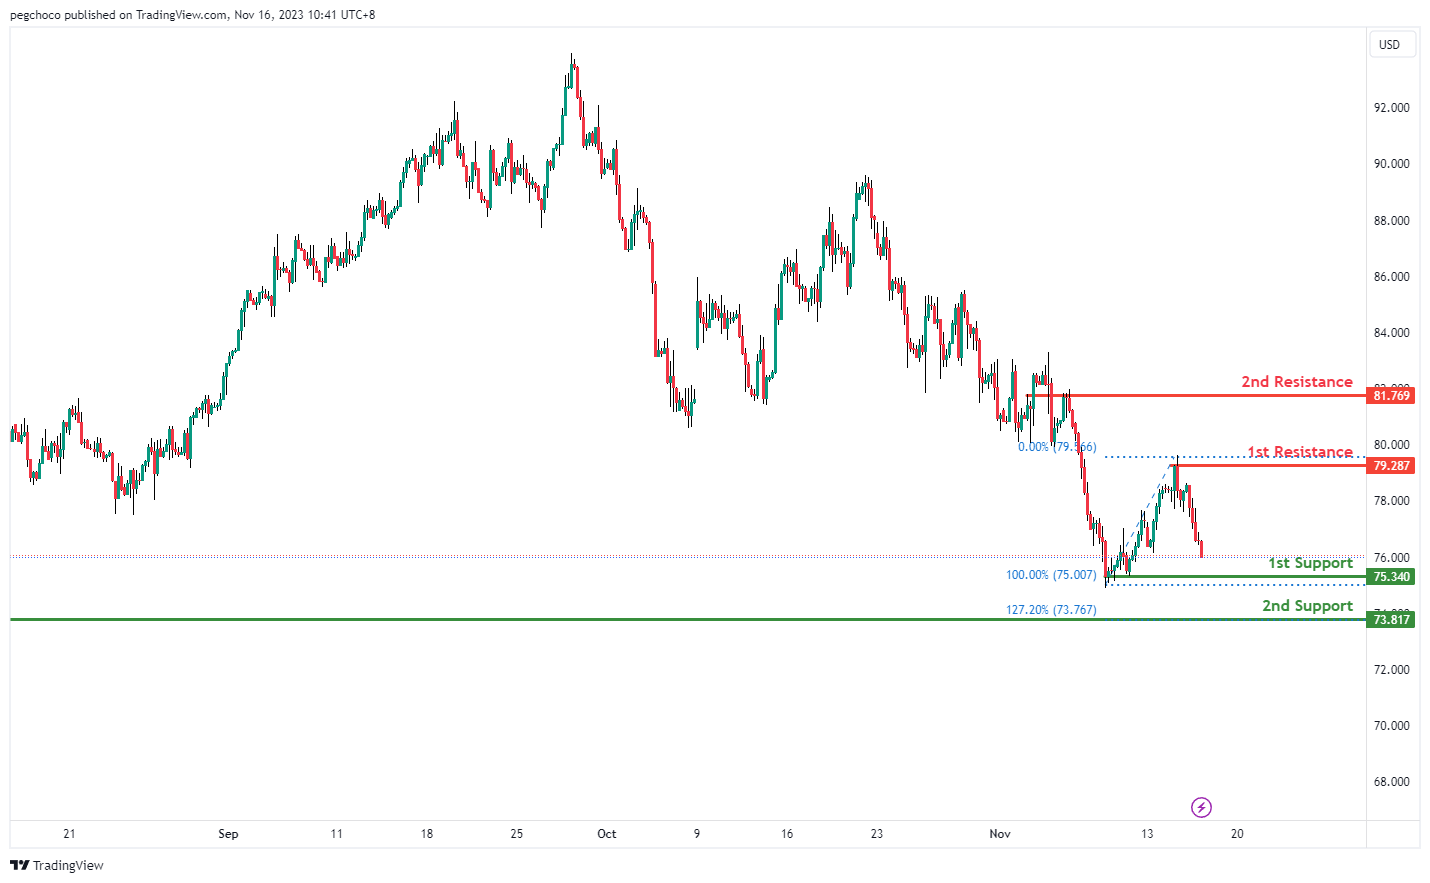
WTI/USD:
The WTI (West Texas Intermediate) chart currently shows an overall bearish momentum, suggesting the potential for a bearish continuation towards the 1st support.
The 1st support level at 75.34 is identified as a pullback support. Further below, the 2nd support level at 73.82 is noted as an overlap support that aligns with the 127.20% Fibonacci extension level, signifying its potential as a strong support area.
To the upside, the 1st resistance level at 79.29 is identified as a swing-high resistance. Higher up, the 2nd resistance level at 81.77 is marked as an overlap resistance, suggesting potential strength as a barrier to further bullish movement.
XAU/USD (GOLD):
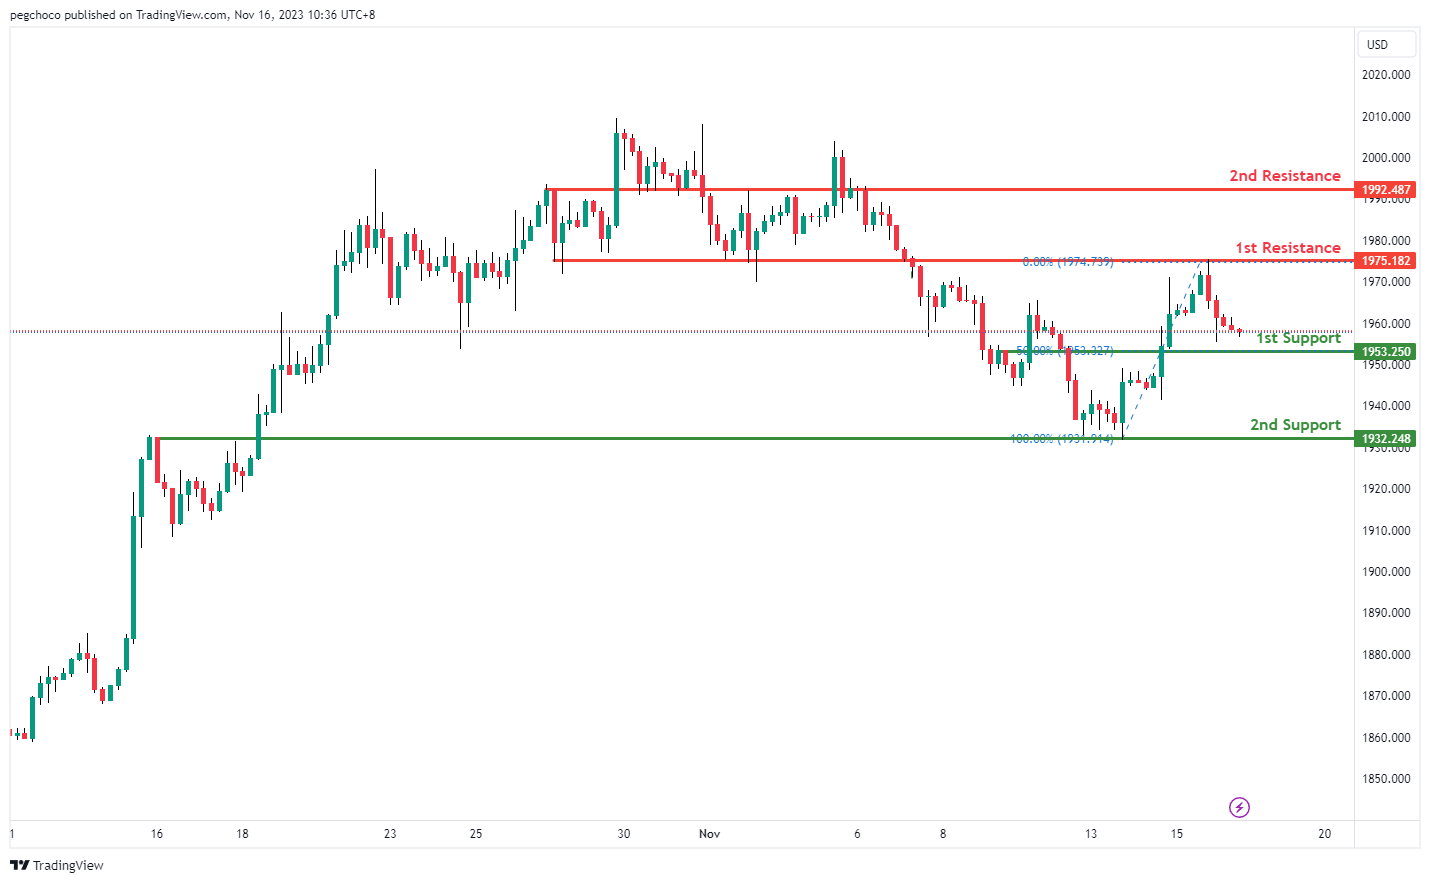
The XAUUSD (Gold) chart currently exhibits a bullish overall momentum, suggesting the potential for a bullish bounce off the 1st support level and a movement towards the 1st resistance.
The 1st support at 1953.25 is identified as a pullback support, indicating a potential level where buyers may step in. It signifies a price area where the market has previously found support during a pullback.
The 2nd support at 1932.77 is considered an overlap support, further reinforcing its potential as a support level. Overlap supports often indicate areas where price reversals or bounces may occur.
On the resistance side, the 1st resistance at 1975.18 is categorized as an overlap resistance. This level suggests that there may be selling interest in this area, potentially acting as a barrier to further upward movement.
The 2nd resistance at 1992.48 is also noted as an overlap resistance, indicating another potential area where the price may encounter selling pressure during its bullish movement.
Crude Oil Price At Risk of More Downsides, Gold Turns Green
Key Highlights
- Crude oil prices declined heavily toward $7520 before the bulls appeared.
- A key bearish trend line is forming with resistance near $78.80 on the 4-hour chart.
- Gold prices started a fresh increase from the $1,935 support zone.
- EUR/USD surged above the 1.0720 resistance zone.
Crude Oil Price Technical Analysis
In the past few days, Crude oil prices saw a steady decline amid the Israel-Hamas war. The price declined toward the $75.00 zone before the bulls appeared.
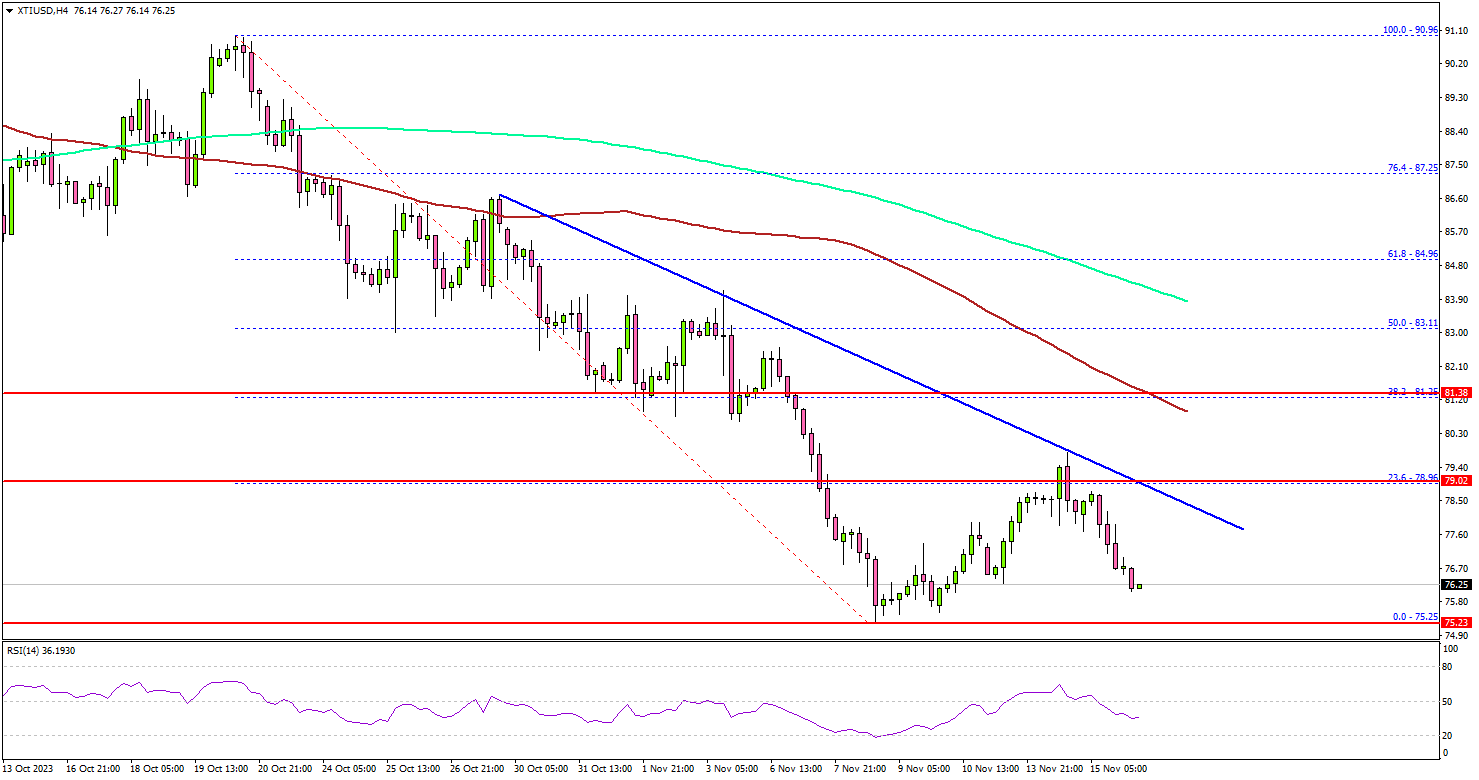
Looking at the 4-hour chart of XTI/USD, the price settled below the $80.00 pivot level, the 200 simple moving average (green, 4-hour), and the 100 simple moving average (red, 4-hour).
A low was formed near $75.25 and recently the price started an upside correction. There was a move above the $77.50 resistance zone. However, the price failed to clear the $78.80 resistance zone. It struggled near the 23.6% Fib retracement level of the downward move from the $90.96 swing high to the $75.25 low.
There is also a key bearish trend line forming with resistance near $78.80 on the same chart. The next major resistance is near the $81.20 zone or the 38.2% Fib retracement level of the downward move from the $90.96 swing high to the $75.25 low, above which the price may perhaps accelerate higher.
In the stated case, it could even visit the $83.20 resistance or the 200 simple moving average (green, 4-hour) in the coming days.
If not, the price might continue to move down. Immediate support is near the $75.80 level. The next support is at $75.00, below which there is a risk of a sharp decline. In the stated case, the price could dive toward the $72.50 support. Any more losses might call for a test of the $70.00 support zone.
Looking at gold prices, there was a consolidation phase near the $1,960 level and the bulls might now aim for more upside.
Economic Releases to Watch Today
- US Initial Jobless Claims - Forecast 220K, versus 217K previous.
Japan’s exports increase for second month, despite persistent decline in China shipments
In October, Japan experienced a mixed bag in its trade sector. Exports saw a modest rise of 1.6% yoy to JPY 9167B, marking the second consecutive month of growth, albeit at a slower pace compared to September's 4.3% yoy increase.
One notable aspect was the continued decline in shipments to China, which fell by -4.0% yoy. This marks the eleventh consecutive month of decline, underscoring the strained trade relations and potentially shifting economic alliances in the region.
Conversely, exports to the US surged by 8.4% yoy, buoyed by robust demand for hybrid vehicles and mining and construction machinery. This surge propelled the value of U.S.-bound shipments to record levels. Similarly, exports to Europe experienced a healthy increase of 8.9% yoy, indicating diversified trade relations.
On the import front, Japan witnessed a significant drop of -12.5% yoy to JPY 9810B. The trade balance resulted in a deficit of JPY -663B.
Looking at seasonally adjusted terms, both exports and imports saw month-on-month declines, with exports decreasing by -1.2% mom to JPY 8800B and imports falling by -0.7% mom to JPY 9262B. Consequently, trade deficit widened from September's JPY -420B to JPY -462B.