

Sample Category Title
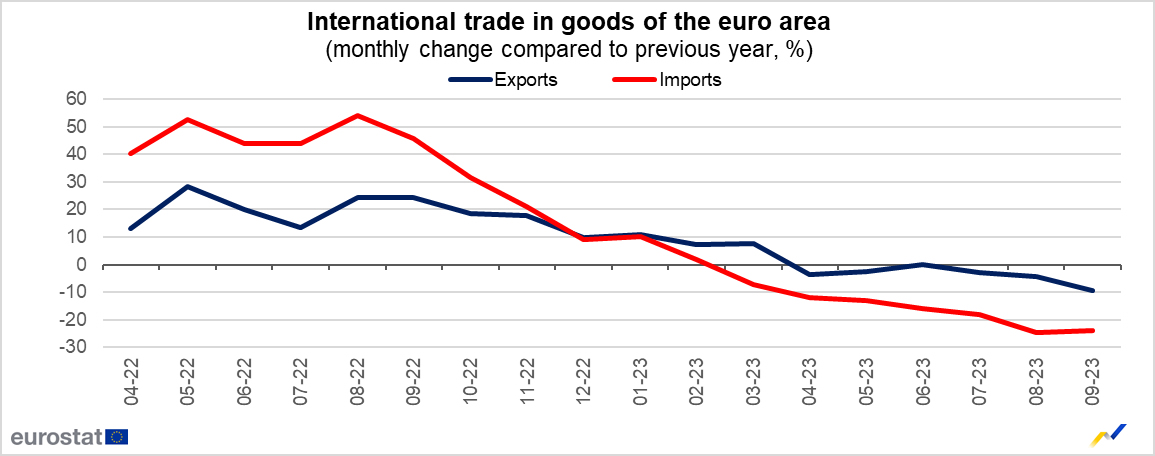
Eurozone goods exports falls -9.3% yoy in Sep, imports down -23.9% yoy
Eurozone exports of goods fell -9.3% yoy to EUR 235.8B in September. Imports fell -23.9% yoy. As a result, a EUR 10.0B trade surplus was recorded. Intra-Eurozone trade fell -15.5% yoy to EUR 217.3B.
In seasonally adjusted term, Eurozone goods exports fell -0.5% mom to EUR 234.0B. Imports rose 0.3% mom to 224.8B. Trade surplus narrowed from August's EUR 11.1B to EUR 9.2B, smaller than expectation of EUR 12.3B. Intra-Eurozone trade fell from August's 215.8B to EUR 213.9B.
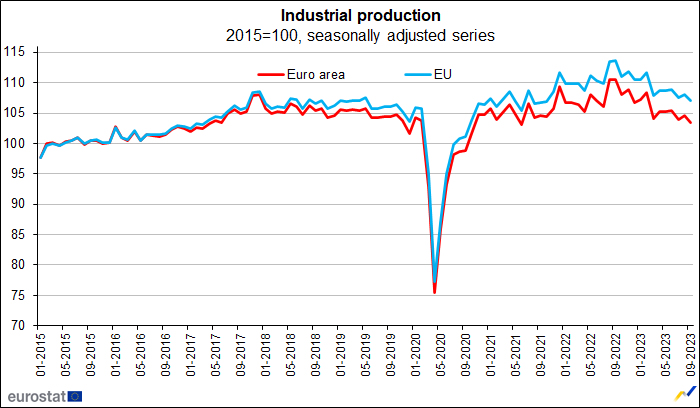
Eurozone industrial production down -1.1% in Sep, EU down -0.9% mom
Eurozone industrial production fell -1.1% mom in September, worse than expectation of -0.9% mom. Production of durable consumer goods and non-durable consumer goods fell both by -2.1%, energy by -1.3% and intermediate goods by -0.3%, while production of capital goods grew by 0.3%.
EU industrial production fell -0.9% mom. Among Member States for which data are available, the largest monthly decreases were registered in Belgium (-3.2%), Portugal (-3.0%), Estonia and Ireland (both -2.9%). The highest increases were observed in Croatia (+4.3%), Slovenia (+4.1%) and Hungary (+1.3%).
No More Rate Hikes Likely from BoE as Inflation Hits Two-Year Low
UK inflation fell sharply in October and faster than the Bank of England anticipated, further reducing the prospect of any more rate hikes in this tightening cycle.
It was already likely that the BoE was done raising rates but as that was based on the view that inflation would fall to 4.8% last month, that could have changed with a higher reading this morning. Instead, it fell even further to 4/6% so there's unlikely to be a big swing on the MPC in favour of hiking now, not unless the data performs much worse over the coming months.
It's not just the headline numbers that are encouraging though. Much like the other data we're seeing, the most recent monthly figures look extremely promising too, suggesting the pace of disinflation has accelerated recently in a manner consistent with inflation now running much lower than the annual comparisons suggest.
If we continue to see this over the coming months, especially if paired with similar trends in monthly wage growth, that first rate cut from the BoE could come earlier than many expect.
There will obviously be areas of stubbornness in the data, most notably services, but if monthly wage data continues to print at levels consistent with the 2% inflation goal and CPI data too, it's surely only a matter of time until services fall as well. All things considered, this week's data from the UK looks incredibly promising.
US retail sales, PPI, and a manufacturing survey in focus
There's still plenty more to come today, in a week filled with major economic releases from both sides of the pond. US retail sales, PPI inflation and the Empire State manufacturing index are due later and will offer some further insight into the resilience of household demand, price pressures and the manufacturing recession.
Oil prices easing again after running into a brick wall around October lows
Oil prices have bounced back over the last four trading sessions but appeared to run into a brick wall yesterday around $84 in Brent and $80 in WTI. That's around the October lows in WTI and perhaps a sign that traders have not become less bearish despite promising inflation data and improved prospects for an economic soft landing.
Considering the more than 10% decline we've now seen from the September peak, you have to wonder whether Saudi Arabia and Russia will feel compelled to extend their unilateral cuts beyond the end of the year in fear of what will happen if they don't. OPEC attempted to push back against pessimistic expectations recently but clearly to no avail. While they may not be too concerned about current price levels, the trend will be making them uncomfortable.
Gold moving closer to $2,000 back by better fundamentals
The US inflation data on Tuesday was a big positive for gold, which rallied as the dollar and US yields both fell. That came as markets fully priced out any further rate hikes from the Federal Reserve and the first rate cut by May. It's hard to argue considering the recent progress and suddenly gold is on an upward trajectory, not far from $2,000, and backed by better fundamentals.
AUD/USD Soars on US Inflation, Aussie Employment Next
- Australian wage growth hits record high
- US inflation slips to 3.2%
- Australian job growth expected to rise
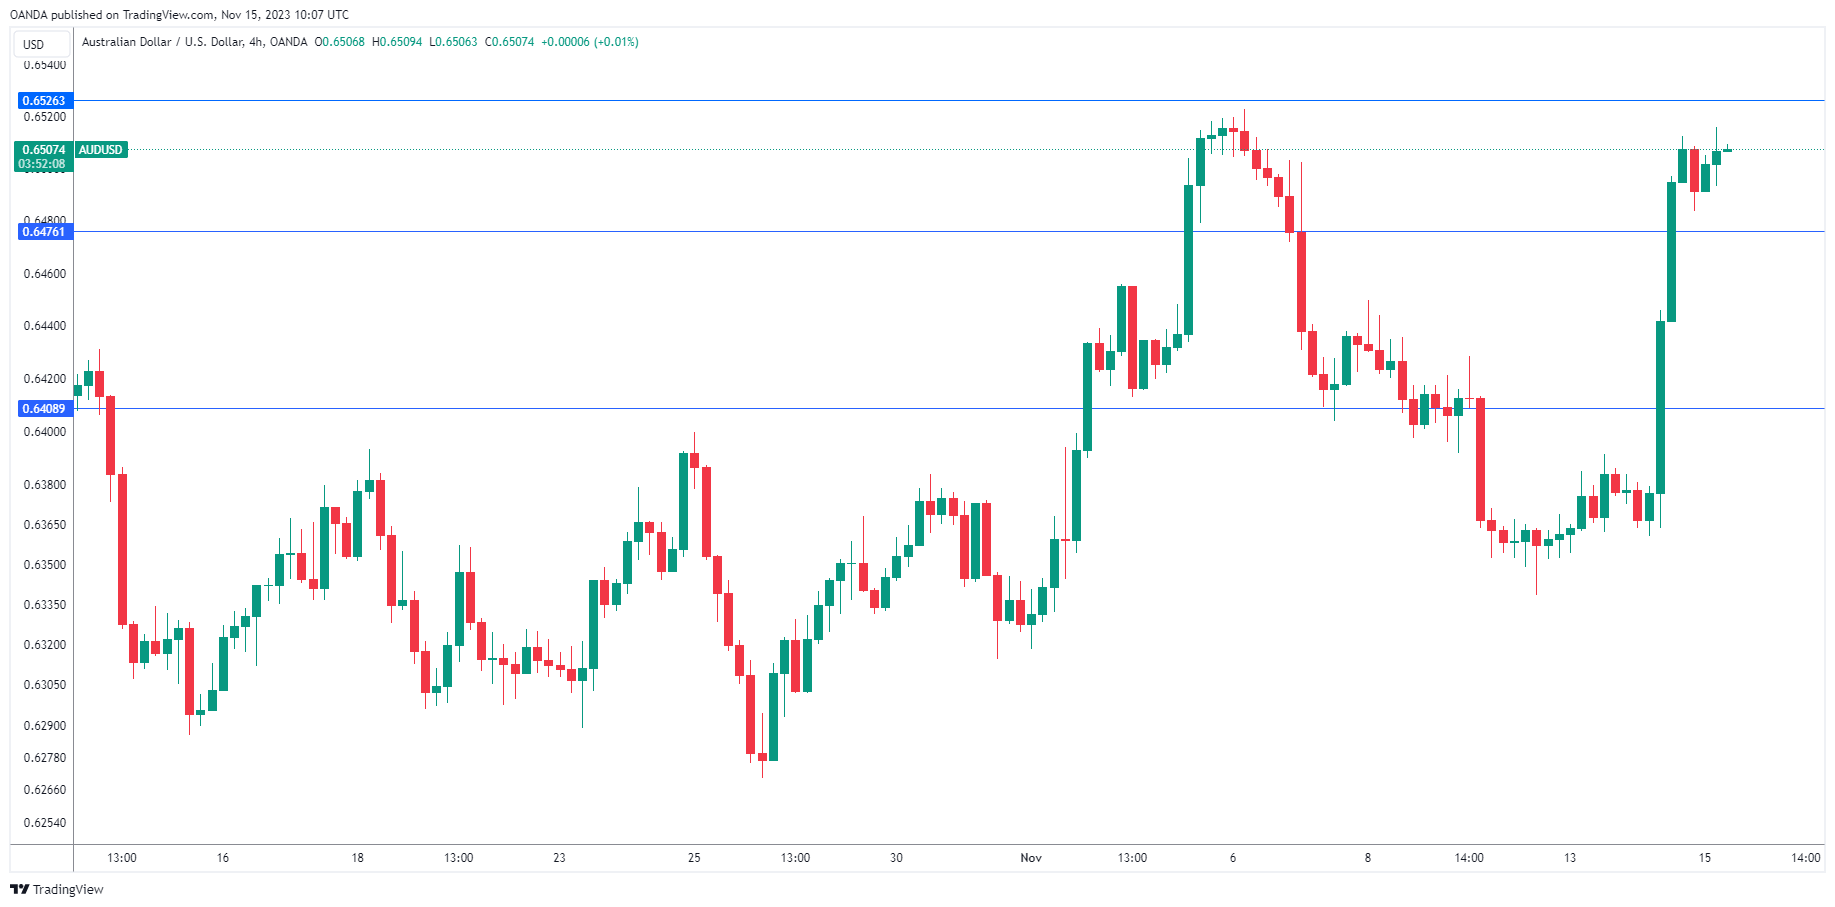
The Australian dollar is unchanged on Wednesday, after massive gains a day earlier. In the European session, AUD/USD is trading at 0.6505.
Australian wages soar
Australian wage growth climbed 1.3% q/q in the third quarter, matching the consensus estimate and above an upwardly revised 0.9% gain in Q2. This was the highest gain since records started in 1997, but the spike was largely due to an increase in minimum wage and a pay rise for elderly care workers.
The unusual confluence of factors behind the strong wage growth print meant that it had little effect on market pricing of a rate hike. The markets have priced in a pause above 90% at the Reserve Bank of Australia’s next meeting on December 5th. The RBA raised rates earlier this month after four straight pauses but the hike was considered dovish by the markets and the Australian dollar took a tumble following the decision.
Australia releases employment data on Thursday, with the labour market continuing to show resilience. The economy is expected to have added 20,000 jobs in October, compared to 6,700 in September. The RBA will be keeping a close eye on consumer inflation expectations, which is expected to fall in October from 4.8% to 4.1%.
US inflation softer than expected
The US inflation report was only a bit lower than expected, but the US dollar was pummelled on Tuesday with sharp losses against the major currencies. The Australian dollar soared, gaining 2% against the greenback. Monthly, headline inflation was unchanged in October for the first time in 15 months, with lower gasoline prices helping to push inflation lower. On an annual basis, headline inflation fell from 3.7% to 3.2%, below the market consensus of 3.3%. Core inflation inched lower to 4.0%, down from the September reading of 4.1% which was also the market consensus.
AUD/USD Technical
- AUD/USD is putting pressure on resistance at 0.6526. Above, there is resistance at 0.6592
- 0.6476 and 0.6408 are providing support
EUR/USD: Euro Consolidating After Biggest One-Day Advance in a Year
EURUSD edged lower in European trading on Wednesday as traders collected some profits after Tuesday’s 1.7% advance (the biggest one-day gain in one year), sparked by bigger than expected drop in US inflation in October, which deflated dollar
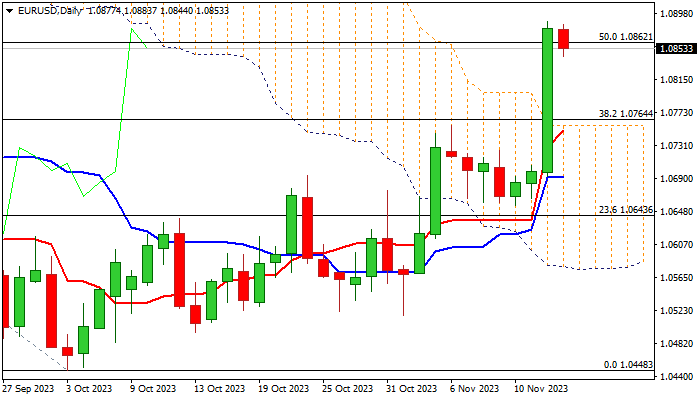
Near-term picture is increasingly bullish after Tuesday’s acceleration surged through few key technical barriers, resulting in close well above thick daily Ichimoku cloud and above 50% retracement of 1.1275/1.0448 downtrend.
Bulls are taking a breather and positioning for fresh push higher, with broken 200DMA (1.0802) to ideally contain dips and offer better buying opportunities for extension towards targets at 1.0959/1.1000 (Fibo 61.8% / psychological).
Broken Fibo 38.2% and daily cloud top (1.0764/1.0759 respectively) mark pivotal supports which should hold extended dips and keep near-term bias with bulls.
Res: 1.0887; 1.0945; 1.0959; 1.1000.
Sup: 1.0802; 1.0764; 1.0756; 1.0700.
EURUSD Eases after Sharp Rally Towards 2½-month High
- EURUSD adds 200 pips and tries to reach 1.0900
- Trades well above moving average lines
- RSI suggests negative correction
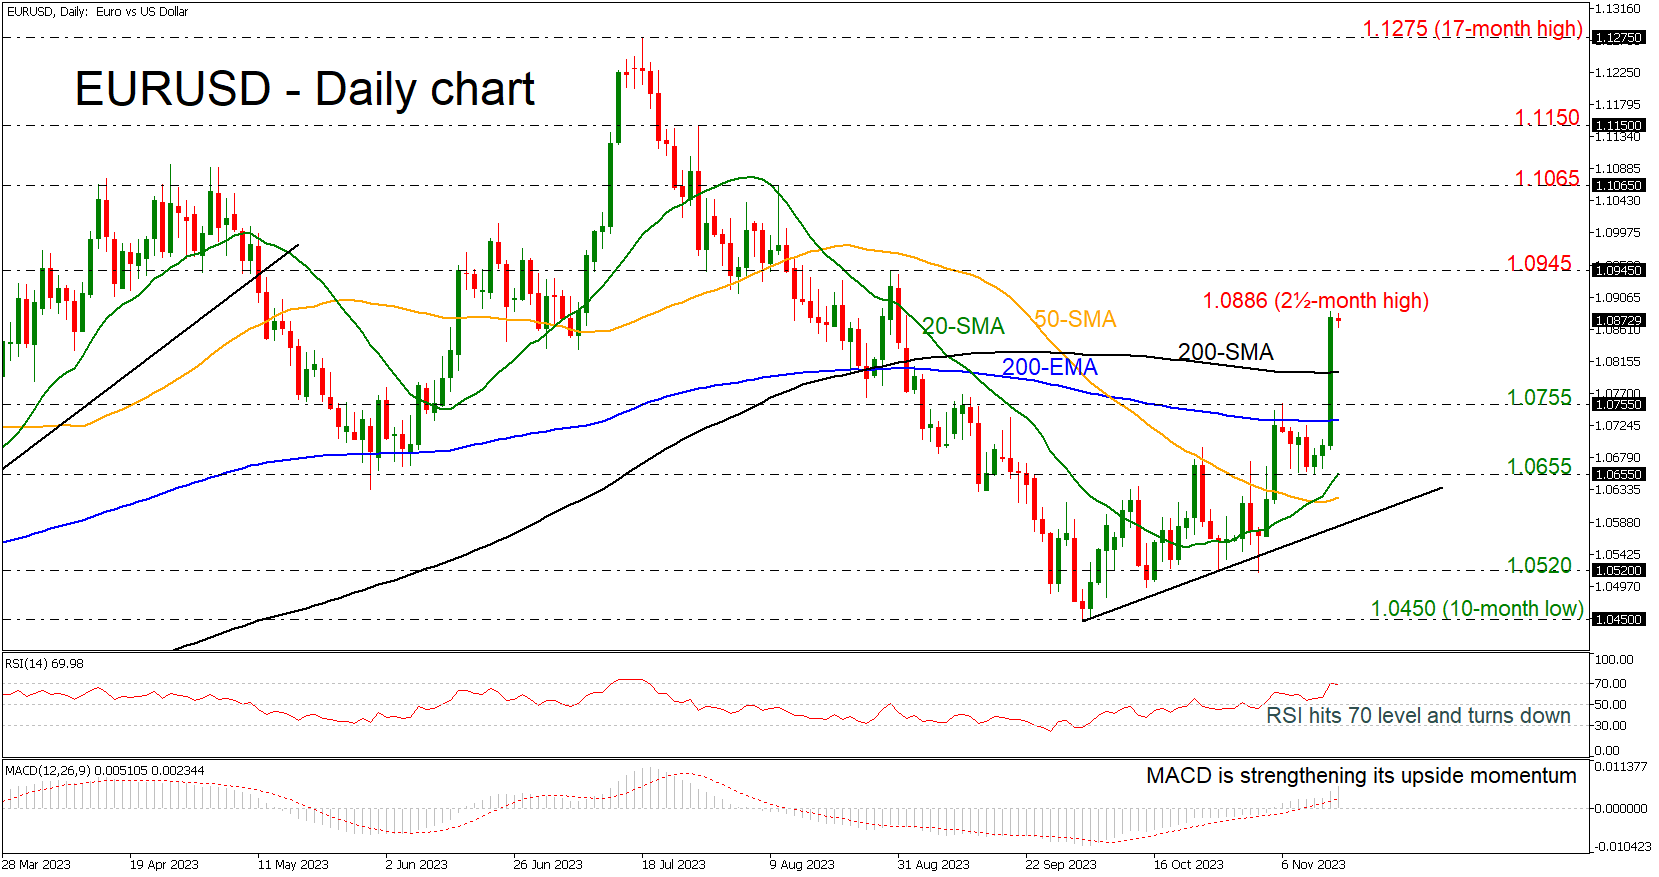
EURUSD skyrocketed yesterday after the US CPI release and added almost 200 pips, recording a new two-and-a-half-month high of 1.0886, but its rally seems to have temporarily paused.
Approaching the 1.0900 area, it seems to be a real struggle to surpass this round number according to the RSI. The RSI is losing momentum after it touched the overbought region; however, the MACD oscillator is still strengthening its bullish movement, suggesting that the bulls may not give the battle yet. Also, the pair climbed well above the 200-day exponential moving average (EMA) and the 200-day simple moving average (SMA), which were acting as strong resistance levels in the past and the 20- and 50-day SMAs printed a bullish crossover.
In the event the pair re-activates its uptrend above Tuesday’s top of 1.0886, the next target will be the 1.0945 resistance. Even higher, the bulls might head for the 1.1065 barricade, which was a key resistance zone during August.
On the downside, the 200-day SMA at 1.0800 is the first stop to have in mind ahead of the 1.0755 support and the 200-day EMA at 1.0733. Hence, a step beneath that line, the 1.0655 line, which overlaps with the 20-day SMA might produce negative volatility.
Summarizing, EURUSD is sustaining an upward trend above the moving average lines and well above the short-term uptrend line. To attract new buyers, the pair will need to pierce through the 1.0900 psychological mark.
US 500 Index Snaps Downtrend
- The US 500 index breaks downtrend after amazing rally
- Short-term bias bullish, but overbought conditions evident
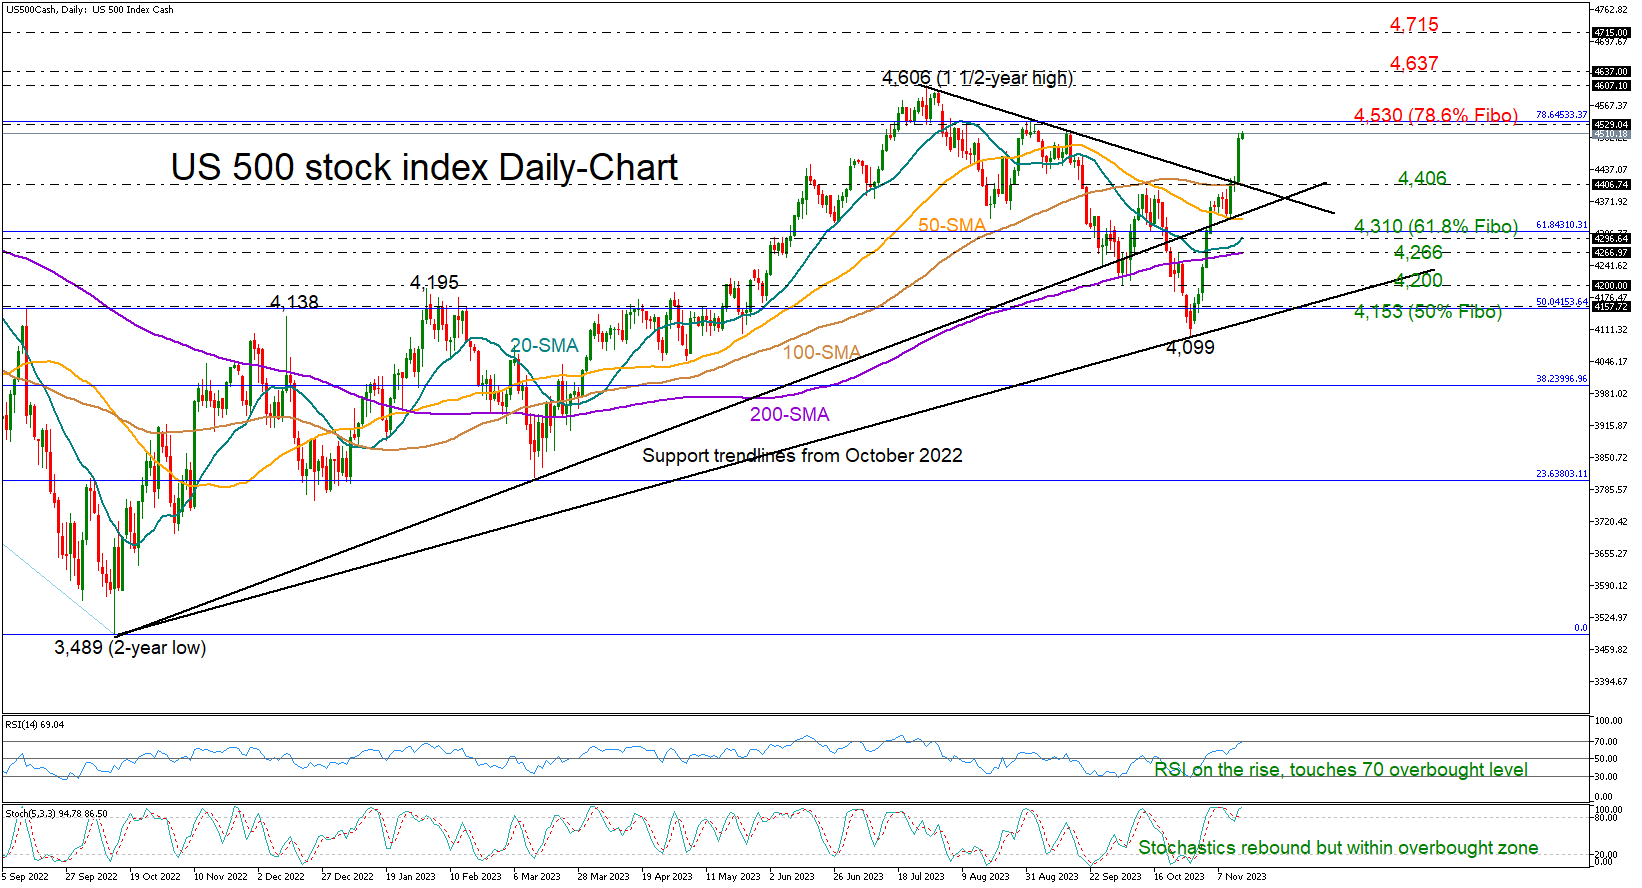
The US 500 stock index (cash) enjoyed its fastest daily rally (+2%) in a year on Tuesday, successfully scraping off the aggressive sell-off that started on September 15th to trade around 4,500 again.
The latest bullish explosion indicates that the price will continue to rise as it is significantly above the descending trendline from July and its simple moving averages. Yet, the overbought signals coming from the RSI and the stochastic oscillator are warning that the acceleration might be unsustainable, especially as the 4,530 high from September is within breathing distance. The latter also overlaps with the 61.8% Fibonacci retracement of the 2021-2022 downtrend.
If the bulls eliminate downside risks above 4,530, all the attention will turn to the 1½-year high of 4,606 registered in July. The March 2022 peak of 4,637 could come in sight as well ahead of the 4,715 barrier last seen in November 2021-January 2022.
Should the bears retake control, the index could slump back to 4,415 to test its 100-day SMA and the broken resistance trendline. Another bearish correction lower could halt immediately somewhere between the constraining line from October 2022 at 4,355 and the 50-day SMA. The 20- and 200-day SMAs could next come under the spotlight. If the latter proves fragile, the sell-off could worsen towards the 4,200 area.
In brief, the US 500 stock index has surpassed key obstacles, violating the downtrend from July’s peak. Hence, a continuation higher is more likely now, though with the index sailing in overbought waters some caution is warranted below 4,530.
Crypto Retreated Despite a Boom in Equities
Market picture
The burst of optimism in traditional markets bypassed cryptocurrencies on Tuesday. It seems that some investors shifted some of their assets from coins to shares, reducing the total capitalisation of cryptocurrencies by 1.7% over the last 24 hours.
Bitcoin continued its correction on Tuesday, which at one point seemed to get out of control as the price fell below $34.5K due to stop orders triggered. However, prices quickly moved away from the local extreme lows, and by Wednesday morning, there was moderate buying that took BTC back up to $35.6K.
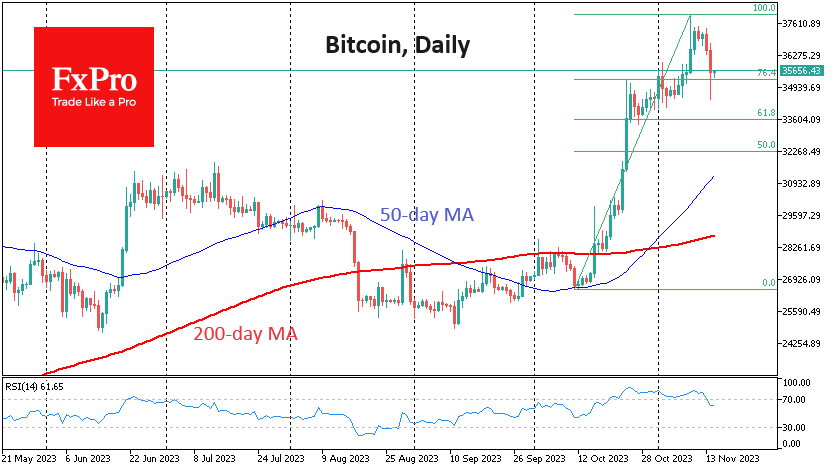
Perhaps the most acute question is whether the cryptocurrency market’s counter-trend dynamic indicates risk demand exhaustion or an attempt at a quick correction to continue following equities. We are leaning towards the latter and expect a fresh test of last week’s highs soon.
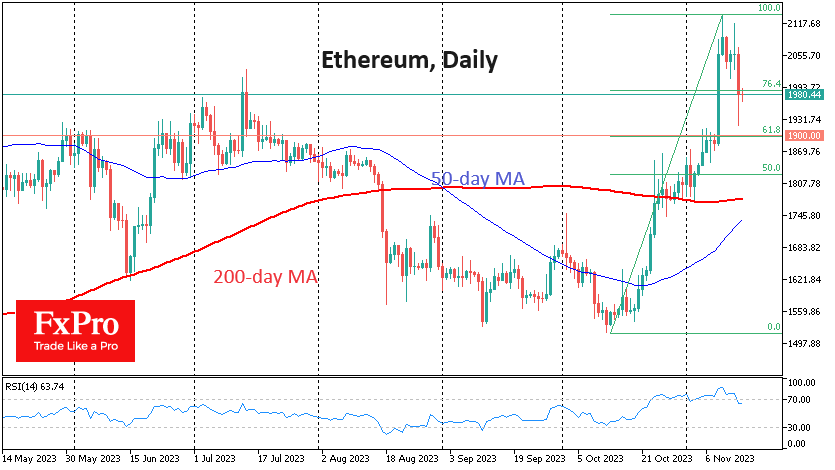
Ethereum pulled back below $2000 on Tuesday but is attempting to move higher again early Wednesday. In addition, there will be two “golden crosses” on the charts in the coming weeks – on the daily and weekly timeframes. The formation of this pattern usually attracts further buying demand.
News background
According to CCData, the Solana token (SOL) has seen the strongest growth among the major cryptocurrencies in recent weeks, and the coin’s share of total trading volume in the digital asset market has reached an all-time high (8.85%).
The leading meme coin of the Solana ecosystem, the Bonk token (BONK), has also seen rapid growth. In the last 30 days, it has grown by 850%, significantly outperforming popular and larger capitalisation meme coins such as DogeCoin, Pepe and Shiba.
Coinciding with the name of Elon Musk’s chatbot, the Grok token rose 13,000% in just one week after its launch, with a market capitalisation of $160 million.
The CBOE will launch leveraged futures trading on Bitcoin and Ethereum on 11 January 2024.
Morgan Creek founder Anthony Pompliano believes that all applications to launch spot bitcoin ETFs should be approved by the SEC simultaneously to avoid favouritism. He believes this will increase capital inflows into the cryptocurrency market and create a bullish trend.
Gold Rises as U.S. Dollar Weakens After Inflation Report
Gold (XAU) gained 0.87% on Tuesday as the U.S. dollar started to weaken after the U.S. inflation data demonstrated a slowdown, reinforcing beliefs that the U.S. interest rate might have already peaked.
Possible effects for traders
U.S. inflation indicated that U.S. consumer prices didn't change in October, and the year-over-year increase in core inflation numbers was the least significant in two years. The U.S. Dollar Index (DXY) and benchmark U.S. 10-year Treasury yields fell towards their two-month low due to lower-than-expected inflation figures. Thus, the opportunity cost of holding gold decreased. Following Tuesday's data, U.S. interest rate futures indicated a notable shift in market expectations regarding the U.S. interest rate trajectory. The chances of a rate cut by May 2024 jumped from 34% to 65%, according to the CME's FedWatch tool. Thus, anticipations of decreasing U.S. interest rates increase the gold's appeal.
XAUUSD continued to rise during the Asian and early European trading sessions. Today, traders should focus on the U.S. Producer Price Index (PPI) report due at 1:30 p.m. UTC. Higher-than-expected PPI figures may bring the XAUUSD price below 1,955. However, the short-term bullish trend in the pair may continue if the figures are lower than expected.
British Pound Rose Confidently as U.S. Inflation Slowed
Yesterday, GBPUSD rose by 1.79% after lower-than-expected U.S. Consumer Price Index (CPI) figures.
Possible effects for traders
On Tuesday, the GBPUSD pair strengthened following the mixed employment data from the U.K. and the U.S. CPI reports. Lower-than-expected U.S. inflation numbers caused significant shifts in the global markets, marking some of the most intense movements this year. Contrary to the anticipated 0.1% growth, the U.S. CPI remained unchanged in October. The core inflation rate increased by only 0.2% instead of the expected 0.3% rise. This data sharply contrasted with the forecast, leading to the reassessment of the U.S. rate hike trajectory.
During the early European trading session, GBPUSD declined following the release of lower-than-anticipated U.K. CPI numbers. Today's key event is the U.S. Producer Price Index (PPI) report due at 1:30 p.m. UTC. If the PPI figures exceed the forecast, GBPUSD could fall below 1.24500. Meanwhile, lower-than-expected PPI figures could support the short-term upward trend in GBPUSD.