

Sample Category Title
UK CPI eases significantly to 4.7% in Oct, another step to BoE’s target
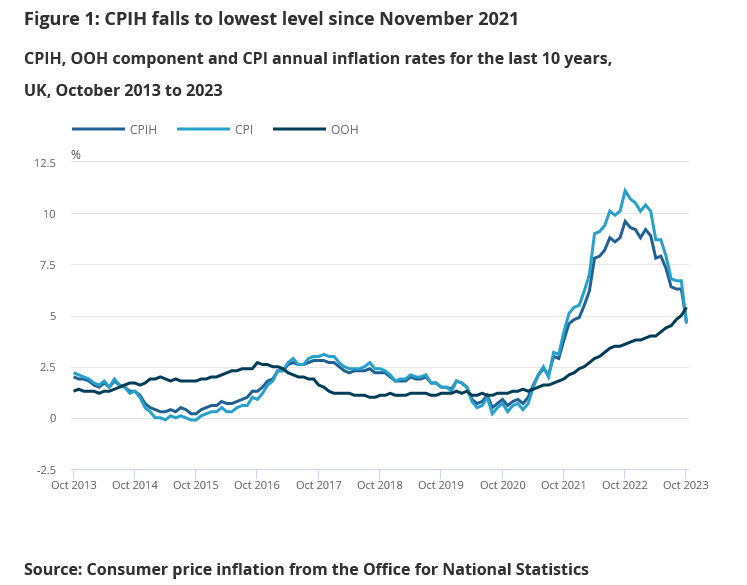
UK CPI showed a marked slowdown in October, dipping below market expectations. The annual CPI rate decelerated from 6.7% yoy to 4.6% yoy , falling short of the anticipated 4.7% yoy. This decline reflects a broader trend of easing inflationary pressures, as evidenced by a flat monthly CPI rate of 0.0% mom, which was below the forecasted 0.2% mom.
Delving deeper, core CPI, which excludes volatile items such as energy, food, alcohol, and tobacco, mirrored this downtrend. It slowed from an annual rate of 6.1% yoy to 5.7% yoy, again undershooting the expected 5.8% yoy.
A notable aspect of the report was the significant drop in CPI goods annual rate, which plummeted from 6.2% yoy to 2.9% yoy. Meanwhile, services sector also saw a decline, albeit less pronounced, with CPI services annual rate reducing from 6.9% yoy to 6.6% yoy.
The most substantial downward pressure on the annual rates came from housing and household services sector. Notably, CPI annual rate in this category recorded its lowest level since record-keeping began in January 1950. Additionally, food and non-alcoholic beverages sector contributed to the downward trend, marking its lowest annual rate since June 2022.
Was Inflation Transitory After All?
Market movers today
Joe Biden and Xi Jinpeng meet in San Francisco.
US retail sales will be the first hard data point on how consumption has developed after the very strong September. Leading indicators and weekly credit card data point towards slowing growth, a new experimental CNBC/NRF indicator shows -0.08% m/m. US PPI inflation should decline on headline due to energy prices but core is expected at 0.3% m/m, same as in September. The Empire manufacturing PMI is a warm up to the national PMI next week, but not strongly correlated with it.
Industrial production figures for the euro area for September will shed light on how much of the decline in Q3 GDP manufacturing was accountable for.
UK October inflation is released where we expect a large downtick in headline inflation given the downtick in household energy bill and base effects. Core and in particular service inflation will however be the main market movers as the BoE sees these as key indicators of inflation persistence.
Japanese foreign trade data for October is released early Thursday morning.
The 60 second overview
The US House of Representatives reached a deal on a temporary budget bill such that a government shutdown on Friday is avoided. However, the deal is lasting only till January next year, but was passed with a majority of Republicans and Democrats in the House. This should limit the risk for a downgrade of US Treasuries for now.
The preliminary Q3 GDP numbers from Japan surprised on the downside as the annualized growth was -2.1% Q/Q compared to expectations of -0.4% Q/Q. Hence, the numbers show the challenge for Bank of Japan given the rise in inflation.
The Chinese central bank left policy rates unchanged this morning, but gave a big injection of cash through the medium-term lending facility (MLF). The amount (USD 83bn) was the largest amount since 2016.
Yesterday's, US October CPI surprised to the downside both in headline (+0.04% m/m SA; consensus +0.1%, Sep +0.40%) and core (+0.23% m/m SA; consensus +0.3%; Sep +0.32%) terms. Shelter accounted for the majority of the downtick in core inflation, but promisingly for the Fed, price pressures in the broader services sector also appeared to moderate. UAW's strike had little impact on car prices, and Core Goods CPI overall continued its modest decline. While realized inflation data clearly cooled in October, some inflation expectations measures still flagged upside risks. NFIB's small business survey showed that companies' price plans have risen further despite still bleak outlook for general business conditions, mirroring signals from University of Michigan's consumer survey last Friday. However, despite the broad-based easing in financial conditions seen yesterday after the CPI release, oil prices remained surprisingly stable, and the past weeks' decline should help with keeping both realized and expected inflation under control. Read more details in our monthly Global Inflation Watch - Signs of weaker demand ease inflation risks in October, 14 November.
Equities: Inflation relief sparked huge moves in the bond market, which in turn sparked an outright rally in equities. US surged about 2% and Europe 1.5%. This was a risk-on session with all sectors higher. Most notably a jump up in real estate and especially Nordics, with most names surging double digit. Cyclicals beat defensives and oversold utilities recovered. Positioning plays a part here too of course, as we have seen in slightly oversold conditions, which we have written a great deal about lately. Asian markets are surging in catch-up this morning while US futures are pointing slightly upwards.
FI: There was a broad-based rally in the global fixed income markets after the weaker than expected US inflation data as inflation may prove transitory after all. However, several Fed officials were out stating that there is some way to go and several market participants also warned that inflation might not go away that quickly and that the Federal Reserve should not cut rates too fast.
FX: The US CPI induced rally in global fixed income markets and the subsequent decline in the USD gave a substantial relief boost to risk appetite globally, which in turn strongly benefitted cyclically sensitive currencies such as ZAR, the CEEs and the Scandies. Also, the GBP benefitted while the CAD, CNH and naturally the USD were the clear underperformers with EUR/USD notably moving close to the 1.09 mark
Credit: Credit and equity markets rallied on Tuesday, after a more dovish than expected US inflation print. Itrax Main tightened 3.4bp to close at 70.5, while Itrax Xover tightened 14.6bp to close at 389.5bp (the lowest level since mid-September). Primary markets were once again fairly active, as was the case on Monday.
Nordic macro
Following yesterday's lower-than-consensus inflation print in Sweden, today's highlight is Prospera's inflation expectations survey. However, as it is the (small) monthly survey, its market impact is likely to be muted.
AUD/USD Daily Report
Daily Pivots: (S1) 0.6408; (P) 0.6461; (R1) 0.6560; More...
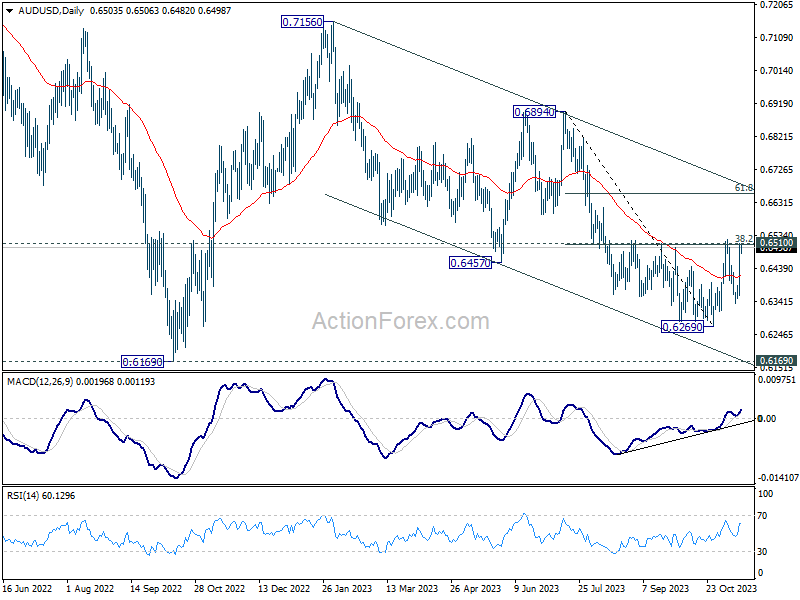
Intraday bias in AUD/USD stays on the upside at this point. Decisive break of 0.6510 cluster resistance (38.2% retracement of 0.6894 to 0.6269 at 0.6508) will argue that whole corrective fall from 0.7156 has completed with three waves down to 0.6269. Stronger rally should seen to falling channel resistance (now at 0.6684) next. On the downside, below 0.6455 minor support will turn intraday bias neutral first.
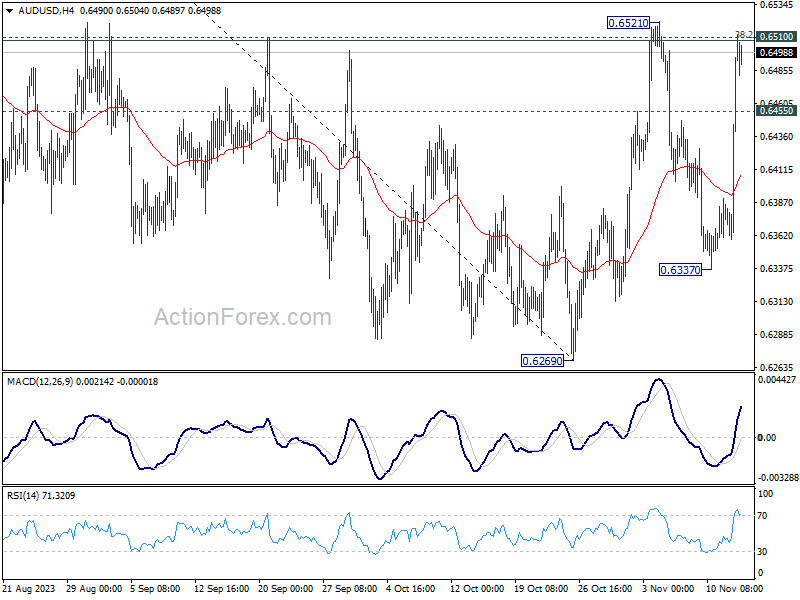
In the bigger picture, there is no confirmation that down trend from 0.8006 (2021 high) has completed. While current rebound from 0.6269 might extend higher, it could be the third leg of the corrective pattern from 0.6169 (2022 low) only. For now, medium term bearishness will remain as long as 0.6894 resistance holds.
USD/CAD Daily Outlook
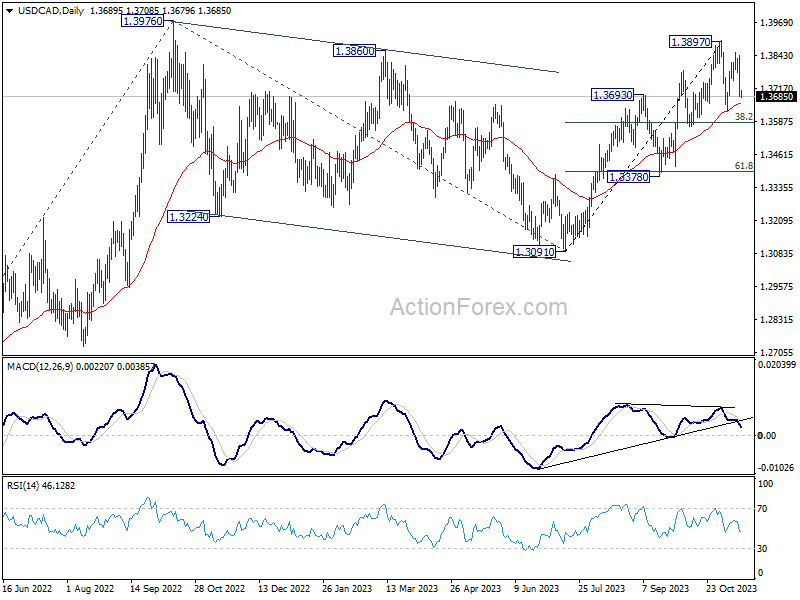
Daily Pivots: (S1) 1.3637; (P) 1.3741; (R1) 1.3796; More...
Intraday bias in USD/CAD remains on the downside for the moment. Fall from 1.3853 is seen as the third leg of the corrective pattern from 1.3897. Deeper fall would be seen to 1.3627 and possibly below. Strong support should be seen from 38.2% retracement of 1.3091 to 1.3897 at 1.3589 to bring rebound. Break of 1.3897 is expected at a later stage to resume larger rally.
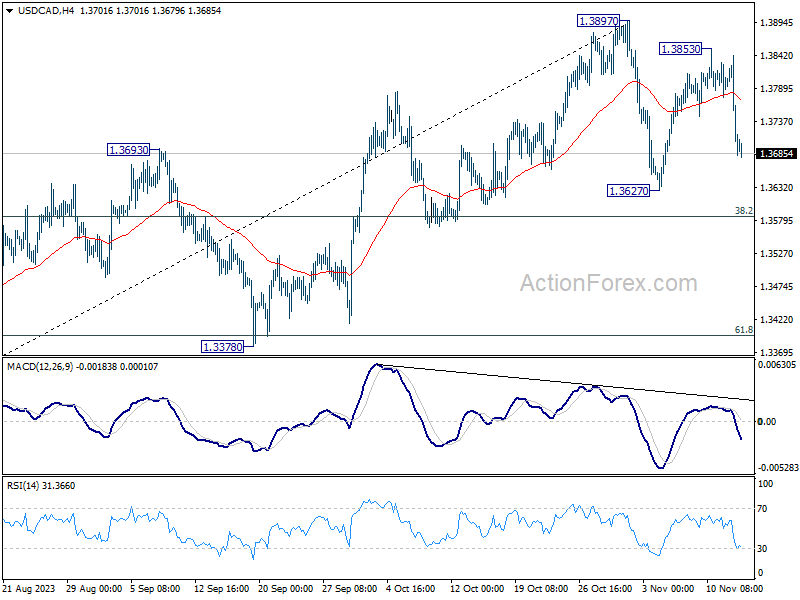
In the bigger picture, corrective pattern from 1.3976 (2022 high) should have completed with three waves down to 1.3091. Decisive break of 1.3976 high will confirm resumption of up trend from 1.2005 (2021 low). Next target is 61.8% projection of 1.2401 to 1.3976 from 1.3091 at 1.4064. This will remain the favored case as long as 1.3378 support holds.
USD/JPY Daily Outlook
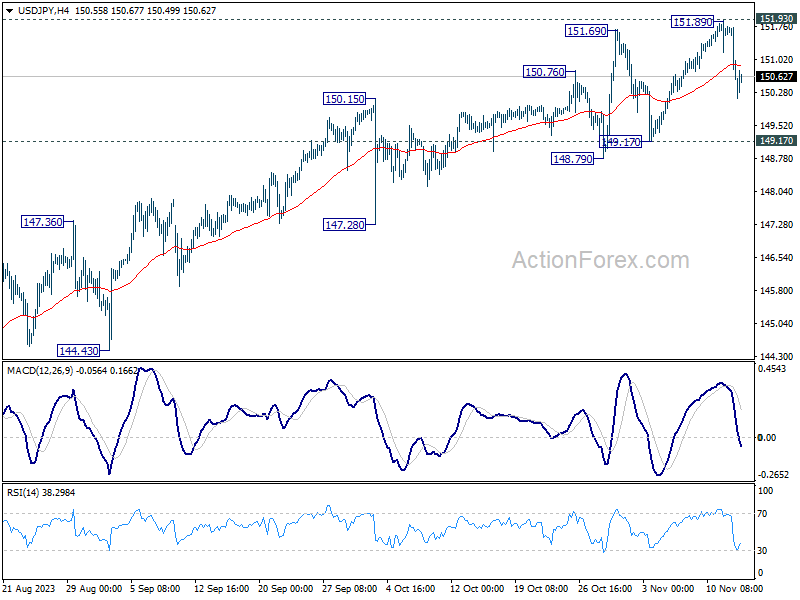
Daily Pivots: (S1) 149.77; (P) 150.78; (R1) 151.39; More...
Intraday bias in USD/JPY remains neutral for the moment and some more sideway trading could be seen. Further rally is in favor as long as 149.17 support holds. On the upside, decisive break of 151.93 resistance will confirm resumption of long term up trend. Next target will be 157.69 projection level. However, firm break of 149.17 will be a sign of bearish reversal and bring deeper fall to 147.28 support first.
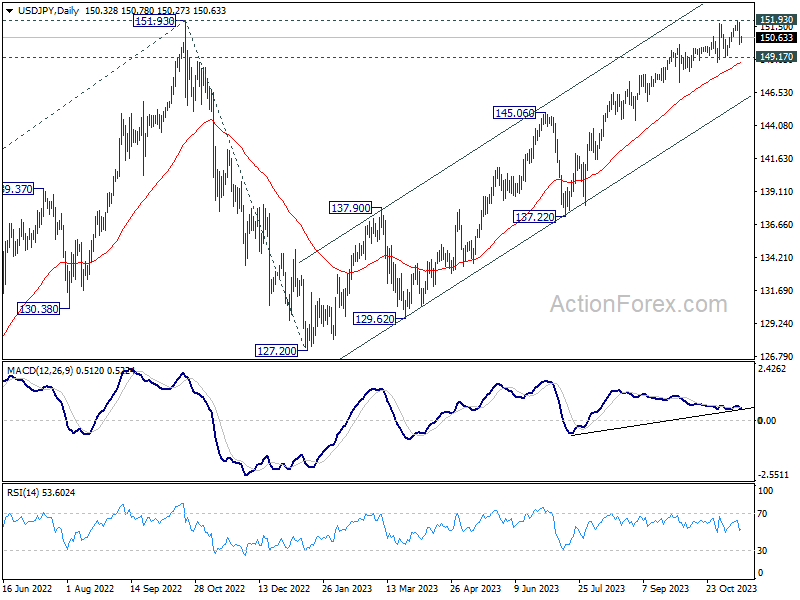
In the bigger picture, immediate focus is now on 151.93 resistance (2022 high). Rejection by 151.93, followed by sustained break of 145.06 resistance turned support will argue that rise from 127.20 has completed, and turn outlook bearish for 137.22 support and below. However, sustained break of 151.93 will confirm resumption of long term up trend. Next target will be 61.8% projection of 102.58 (2021 low) to 151.93 from 127.20 at 157.69.
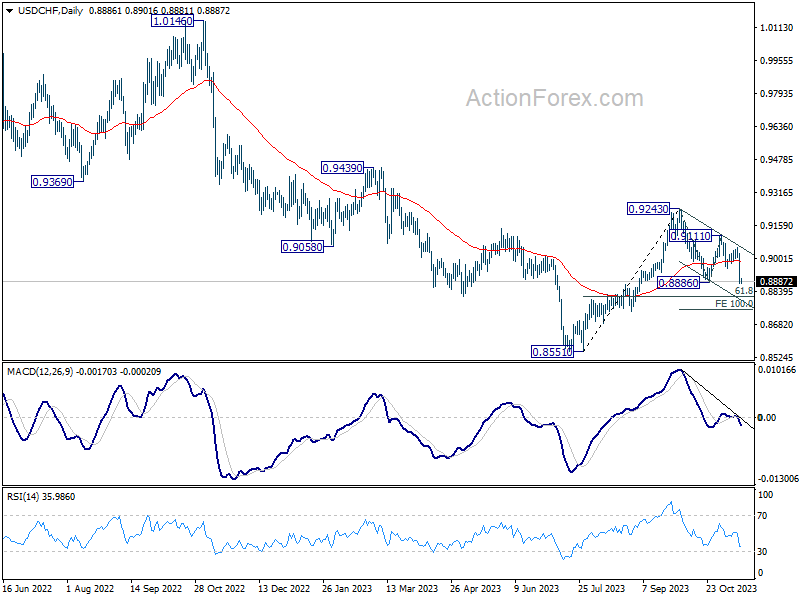
USD/CHF Daily Outlook
Daily Pivots: (S1) 0.8837; (P) 0.8933; (R1) 0.8988; More....
Intraday bias in USD/CHF remains on the downside for the moment. Decisive break of 0.8886 support will resume whole decline from 0.9243, and target 100% projection of 0.9243 to 0.8886 from 0.9111 at 0.8754. On the upside, above 0.8925 minor resistance will turn intraday bias neutral first. But recovery should be limited well below 0.9051 resistance to bring another fall.
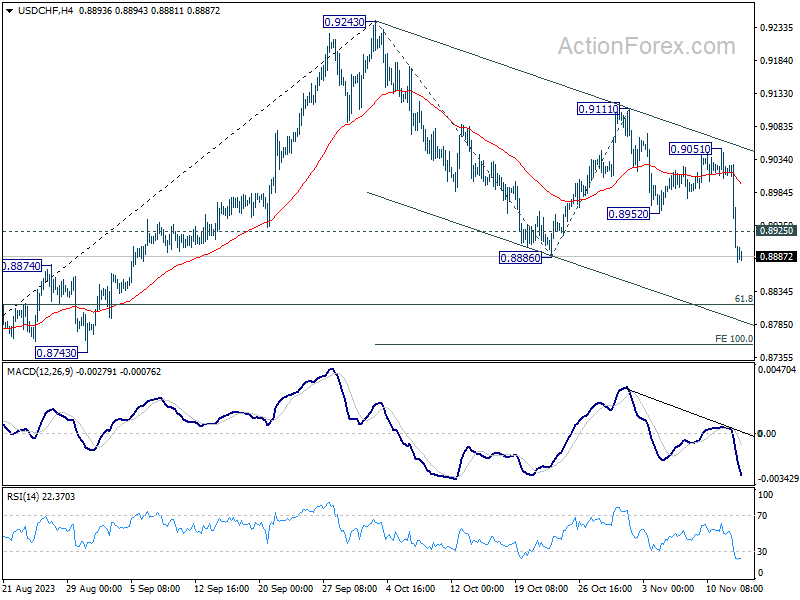
In the bigger picture, outlook is mixed up by the deeper than expected pull back from 0.9243. Yet there was no follow through selling after hitting 0.8886. On the upside, break of 0.9243 resistance will revive the case of medium term bottoming at 0.8851, and turn outlook bullish. However, sustained break of 61.8% retracement of 0.8551 to 0.9243 at 0.8815 will argue that larger decline from 1.0146 is ready to resume through 0.8551 low.
EUR/USD Daily Outlook
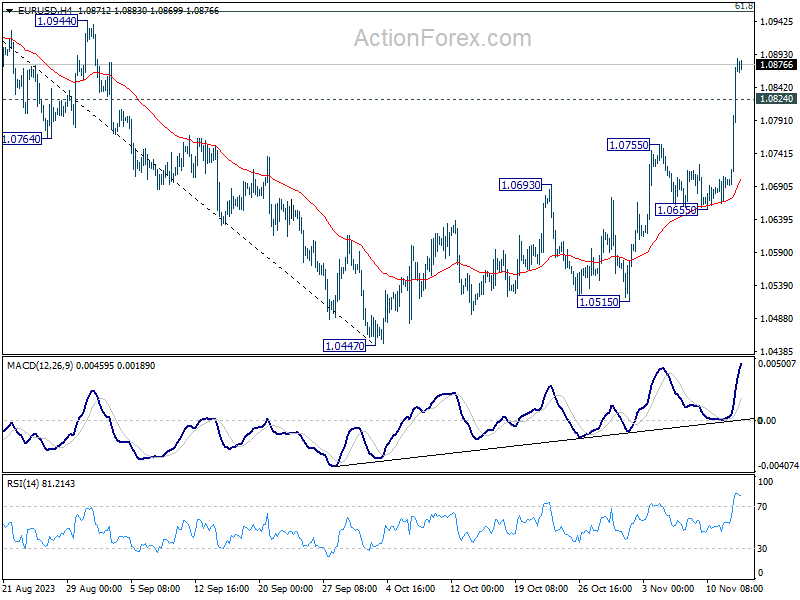
Daily Pivots: (S1) 1.0752; (P) 1.0820; (R1) 1.0947; More...
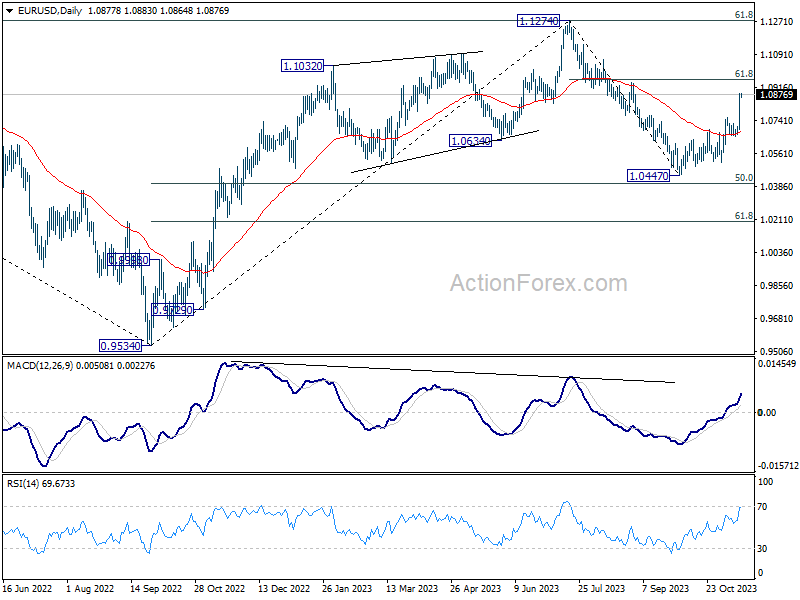
Intraday bias in EUR/USD stays on the upside at this point. Further rally should be seen to 61.8% retracement of 1.1274 to 1.0447 at 1.0958 next. On the downside, below 1.0824 minor support will turn intraday bias neutral and bring retreat first. But downside should be contained well above 1.0655 support to bring another rally.
In the bigger picture, price actions from 1.1274 are viewed as a corrective pattern to rise from 0.9534 (2022 low). Rise from 1.0447 is tentatively seen as the second leg. Hence while further rally could be seen, upside should be limited by 1.1274 to bring the third leg of the pattern. However, break of 1.0447 will resume the fall to 61.8% retracement of 0.9543 to 1.1274 at 1.0199.
Technical Outlook and Review
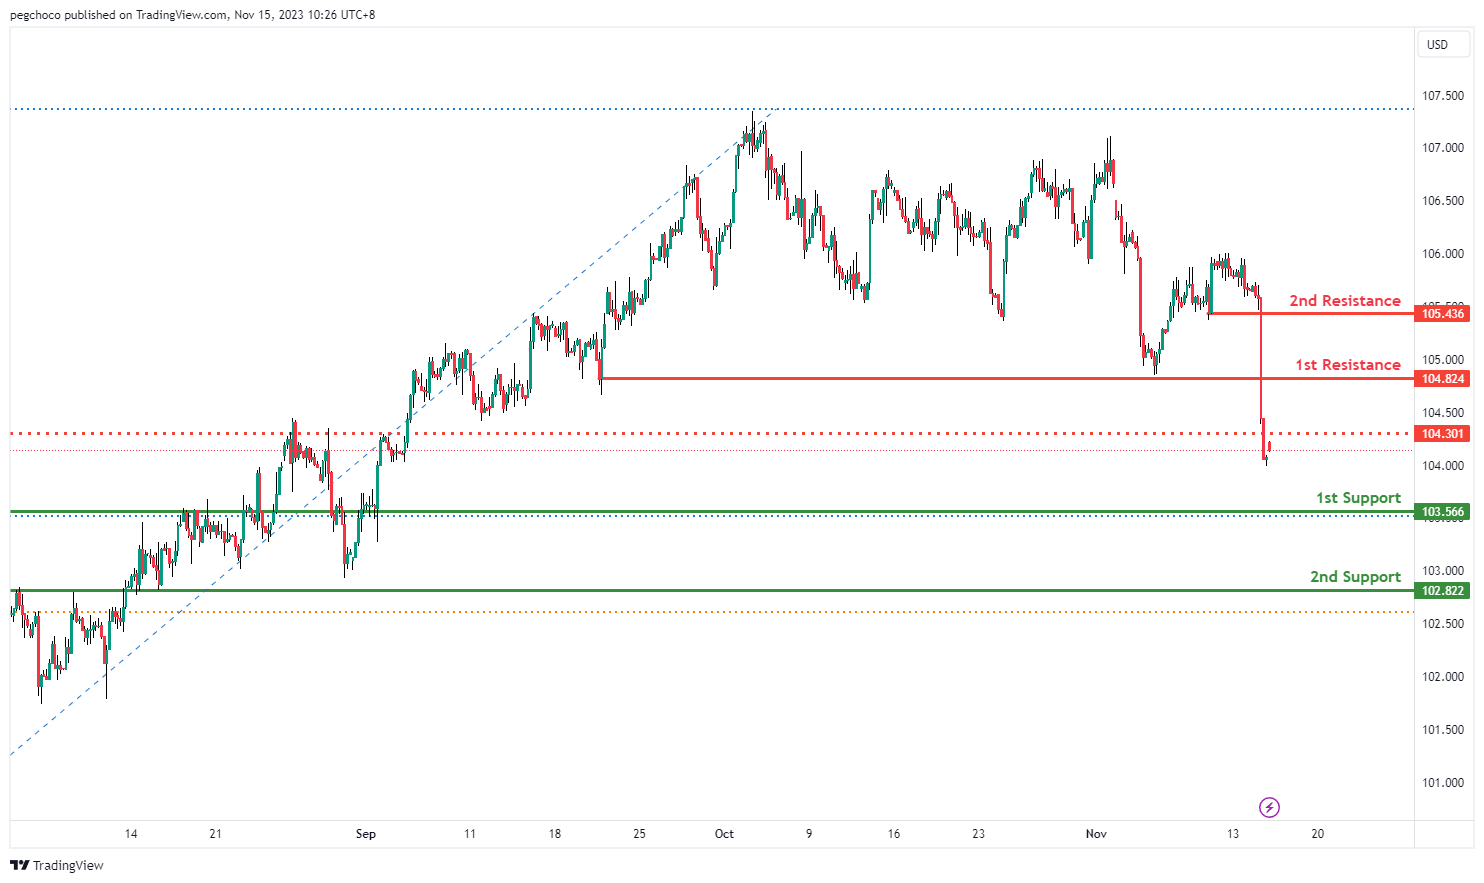
DXY:
The current chart for DXY exhibits a bearish overall momentum, implying the likelihood of a bearish continuation, primarily targeting the 1st support level.
The 1st support level at 105.40 holds significance as it aligns with both an overlap support and the 50% Fibonacci Retracement level. This confluence indicates a substantial zone where we might witness a noteworthy influx of buyers or a pause in the prevailing bearish trend.
Supporting this, the 2nd support at 104.95 is identified as a multi-swing low support. This classification reinforces its credibility as a support level, signifying past instances where buying interest emerged, making it a key reference point.
On the flip side, we encounter the 1st resistance at 105.95, characterized as an overlap resistance and coinciding with the 50% Fibonacci Retracement level. This juncture suggests the potential for heightened selling interest, possibly serving as a hindrance to any substantial upward movement.
Additionally, the 2nd resistance at 106.46 is classified as a pullback resistance, signifying another noteworthy level where price action could encounter selling pressure as it continues its bearish momentum
EUR/USD:
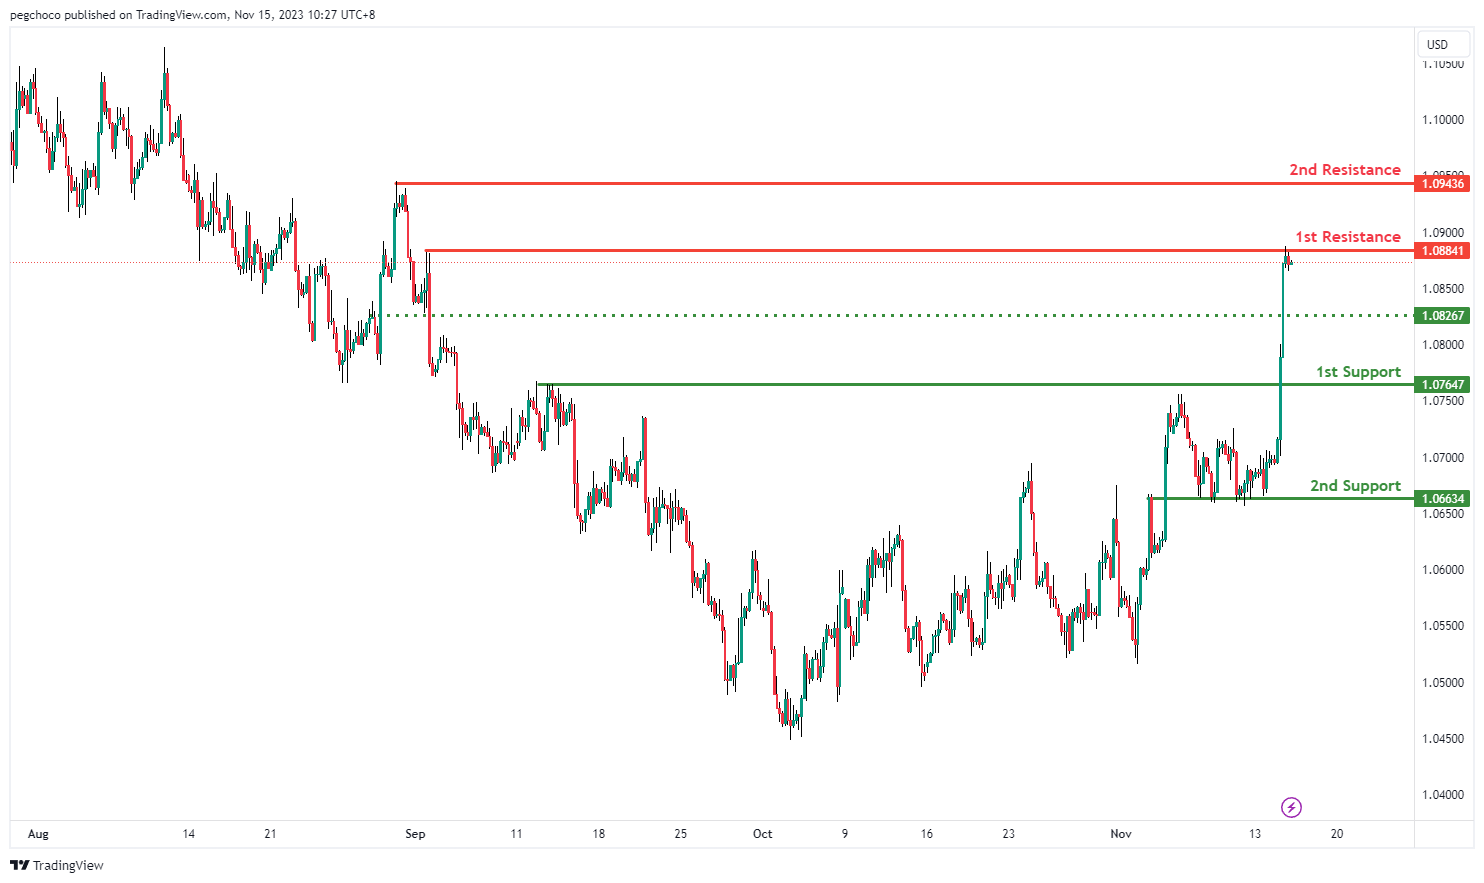
The EUR/USD chart currently exhibits a bullish overall momentum, but there is a short-term potential for a drop towards the 1st support level before a bounce that could lead to a rise towards the 1st resistance level.
The 1st support level at 1.0764 is considered a pullback support. This level is expected to provide a solid foundation for potential buyers, acting as a point of interest where the price may find support during any short-term decline.
Supporting this, the 2nd support at 1.0663 is identified as an overlap support. Overlap supports often carry significance as they indicate areas where price has previously found support, making them relevant levels to watch.
On the flip side, the 1st resistance at 1.0884 is characterized as a multi-swing high resistance. This level suggests a notable zone where selling interest may intensify, potentially serving as a barrier to further upward movement in the short term.
Additionally, the 2nd resistance at 1.0943 is categorized as a swing high resistance. This level adds another layer of resistance, indicating a point where the price could encounter increased selling pressure during its potential rise.
An intermediate support level at 1.0826 is also noted, serving as an additional pullback support. This level adds further reinforcement to the idea of a short-term drop followed by a potential bounce from the 1st support.
EUR/JPY:
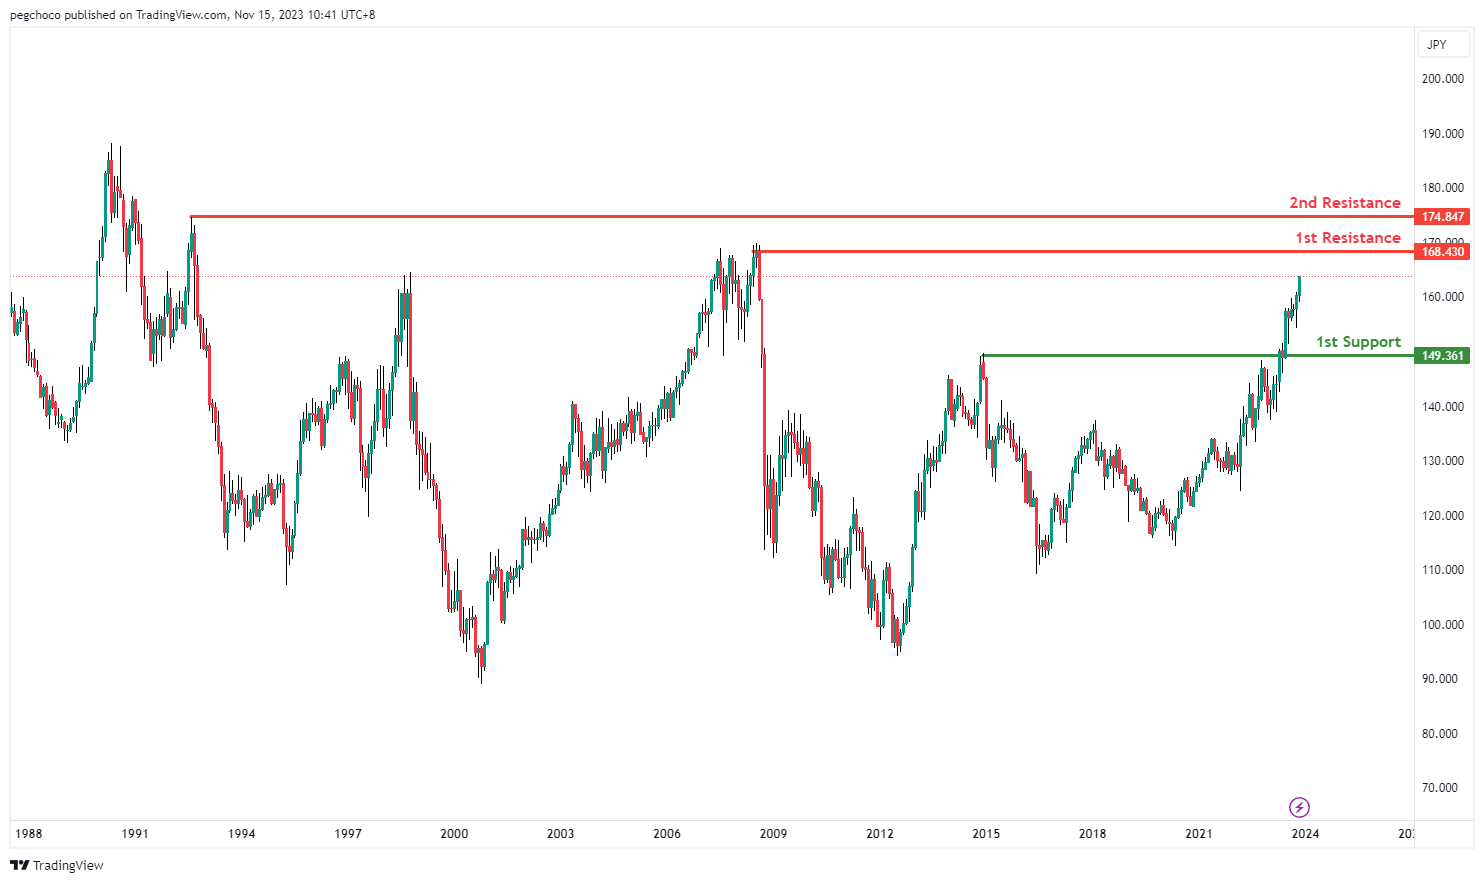
The EUR/JPY chart currently suggests a bullish momentum, suggesting a potential for price to make a bullish continuation towards the 1st resistance.
The 1st resistance level at 168.43 is identified as a swing-high resistance. Higher up, the 2nd resistance level at 174.85 is also noted as a swing-high resistance.
To the downside, the 1st support level at 149.36 is identified as a pullback support, potentially acting as a strong support area.
EUR/GBP:
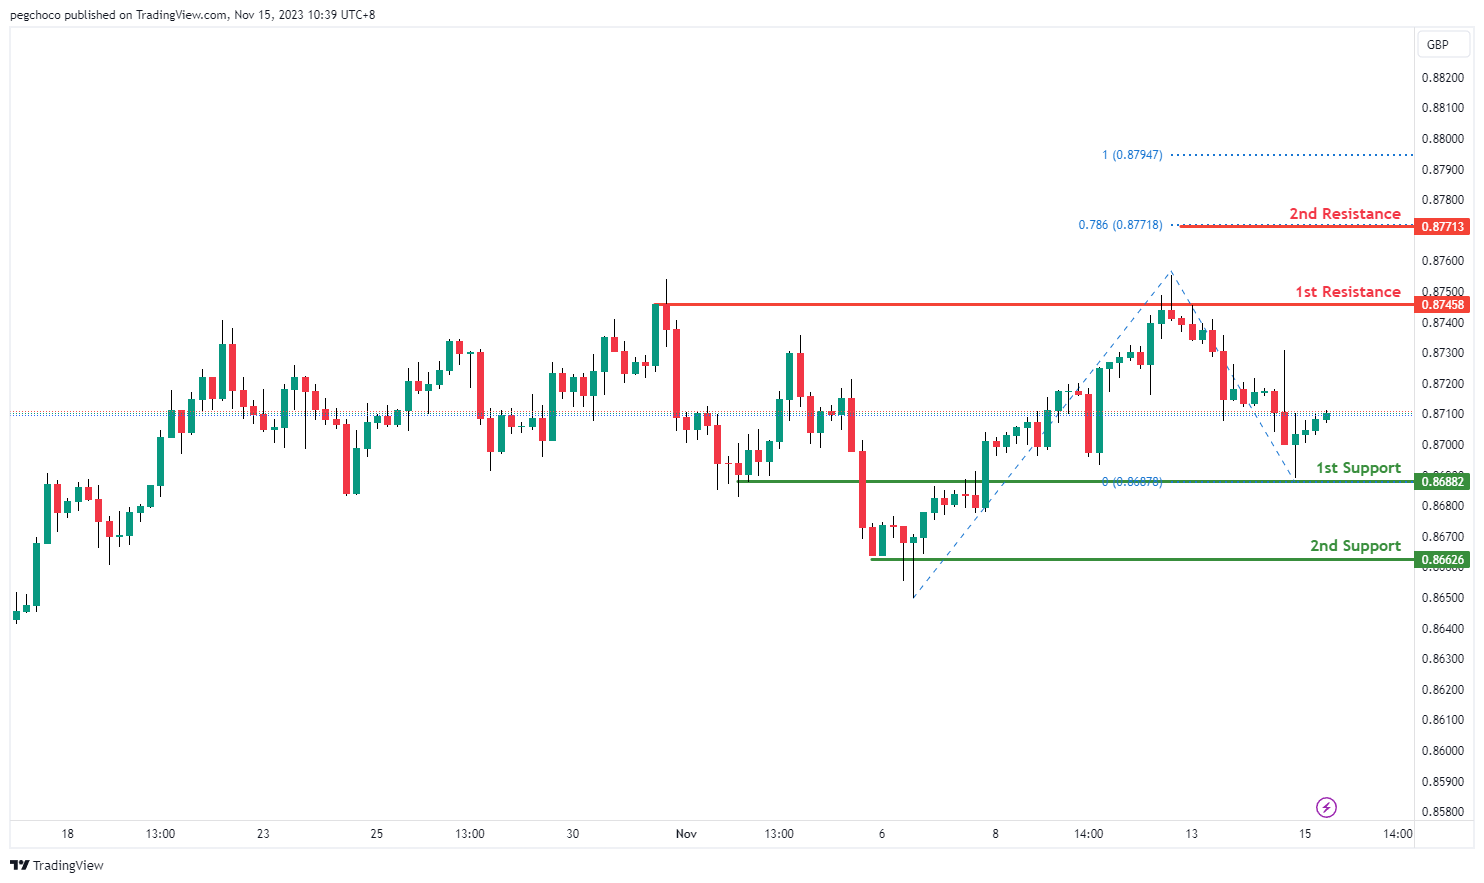
The EUR/GBP chart currently demonstrates a bullish momentum, suggesting a potential for price to make a bullish continuation towards the 1st resistance.
The 1st resistance level at 0.8746 is identified as a pullback resistance. Higher up, the 2nd resistance level at 0.8771 is noted as a resistance level that aligns witt the 78.60% Fibonacci projection level.
To the downside, the 1st support level at 0.8688 is identified as an overlap support. Additionally, the 2nd support level at 0.8663 is marked as a pullback support, reinforcing the potential strength of the support zone.
GBP/USD:
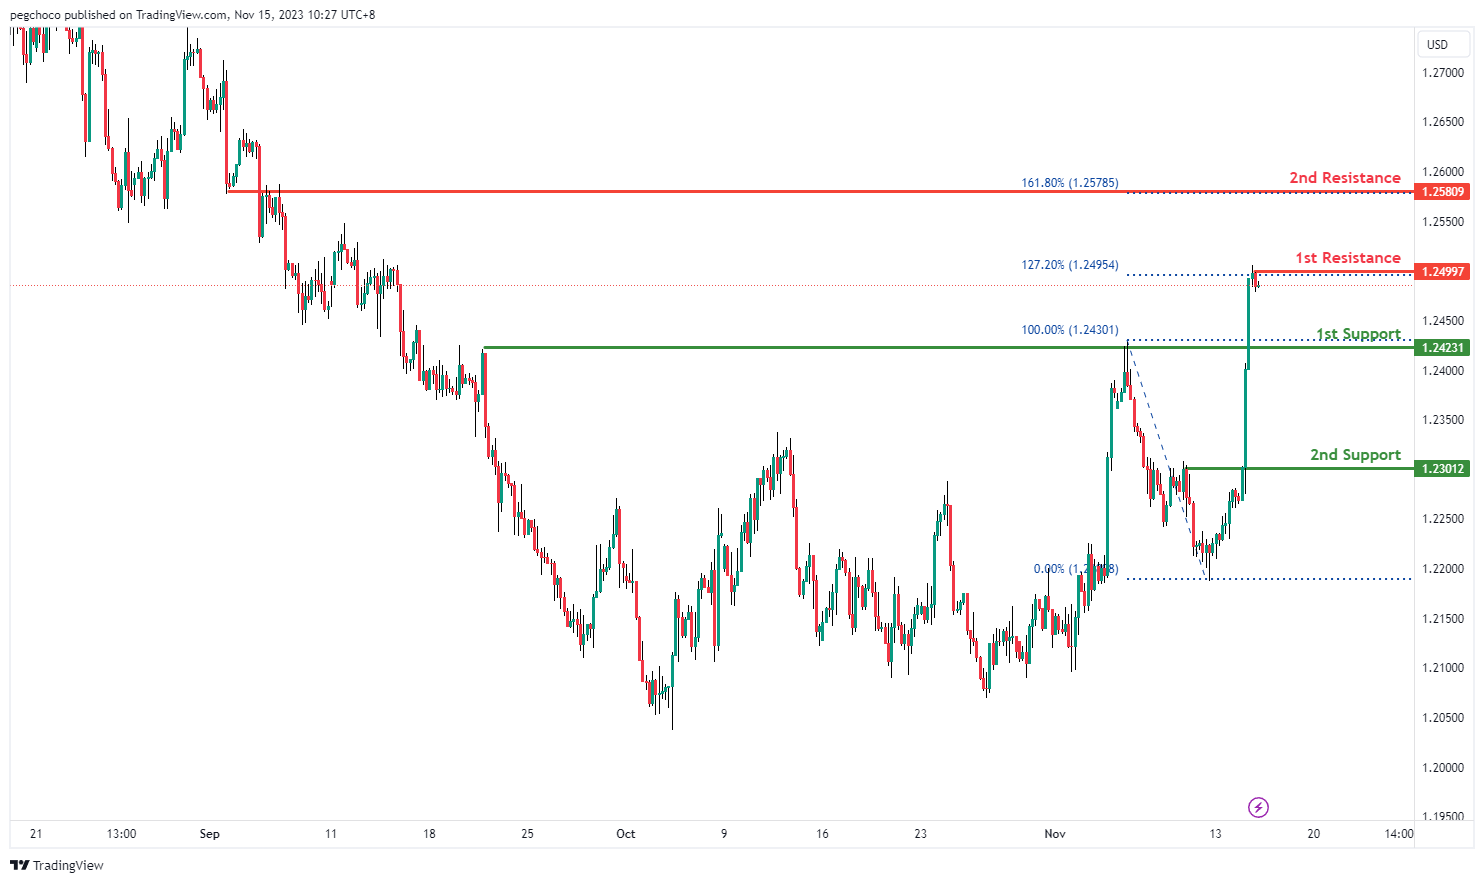
The GBP/USD chart currently displays a bullish overall momentum, but there’s a possibility of a short-term drop towards the 1st support level before a potential bounce that could lead to a rise towards the 1st resistance level.
The 1st support level at 1.2423 is identified as a pullback support. This level is expected to be a point of interest for potential buyers in the short term, possibly acting as a support zone where the price could find some stability during a downward move.
Similarly, the 2nd support at 1.2301 is also considered a pullback support. These pullback support levels indicate areas where buyers have previously stepped in, adding to their significance as relevant support levels to monitor.
On the resistance side, the 1st resistance at 1.2499 is noteworthy as it aligns with the 127.20% Fibonacci Extension level. This Fibonacci extension level suggests a potential zone where selling interest may intensify, acting as a barrier to further upward movement.
Furthermore, the 2nd resistance at 1.2580 is categorized as an overlap resistance and coincides with the 161.80% Fibonacci Extension level. This level adds another layer of resistance, indicating a point where the price could encounter increased selling pressure during its potential rise.
GBP/JPY:
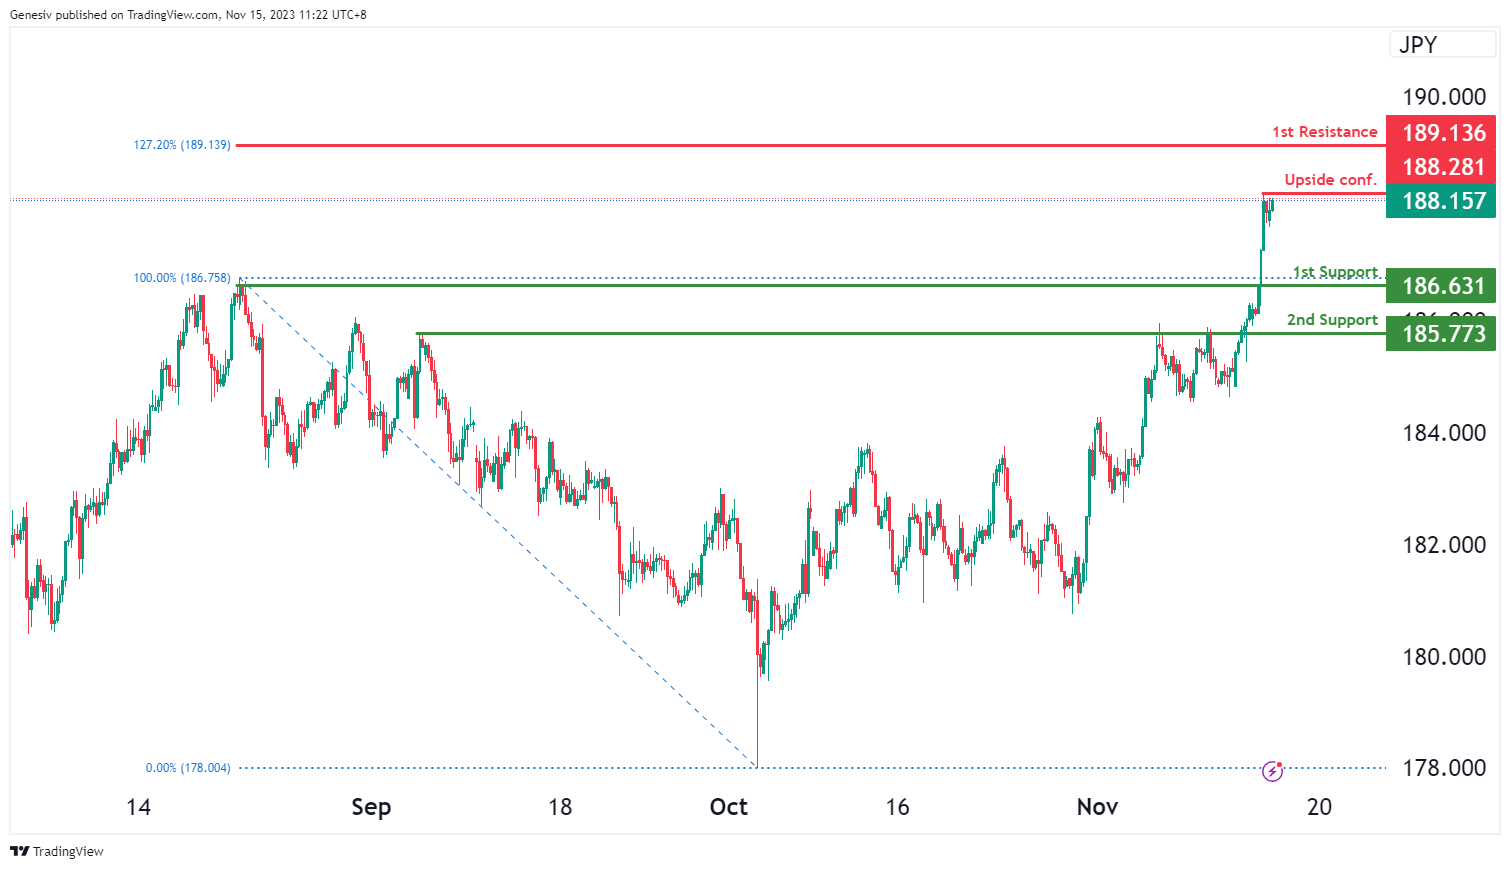
The GBP/JPY chart currently exhibits a bullish momentum, suggesting a potential bullish continuation towards the first resistance should price break above the upside confirmation.
The upside confirmation level at 188.28 is identified as a pullback support while the 1st resistance level at 189.14 is marked as a resistance level that aligns with the 127.20% Fibonacci extension level.
To the downside, the 1st support level at 186.63 is identified as a pullback support. Additionally, the 2nd support level at 185.77 is also noted as a pullback support, further reinforcing the potential strength of the support zone.
USD/CHF:
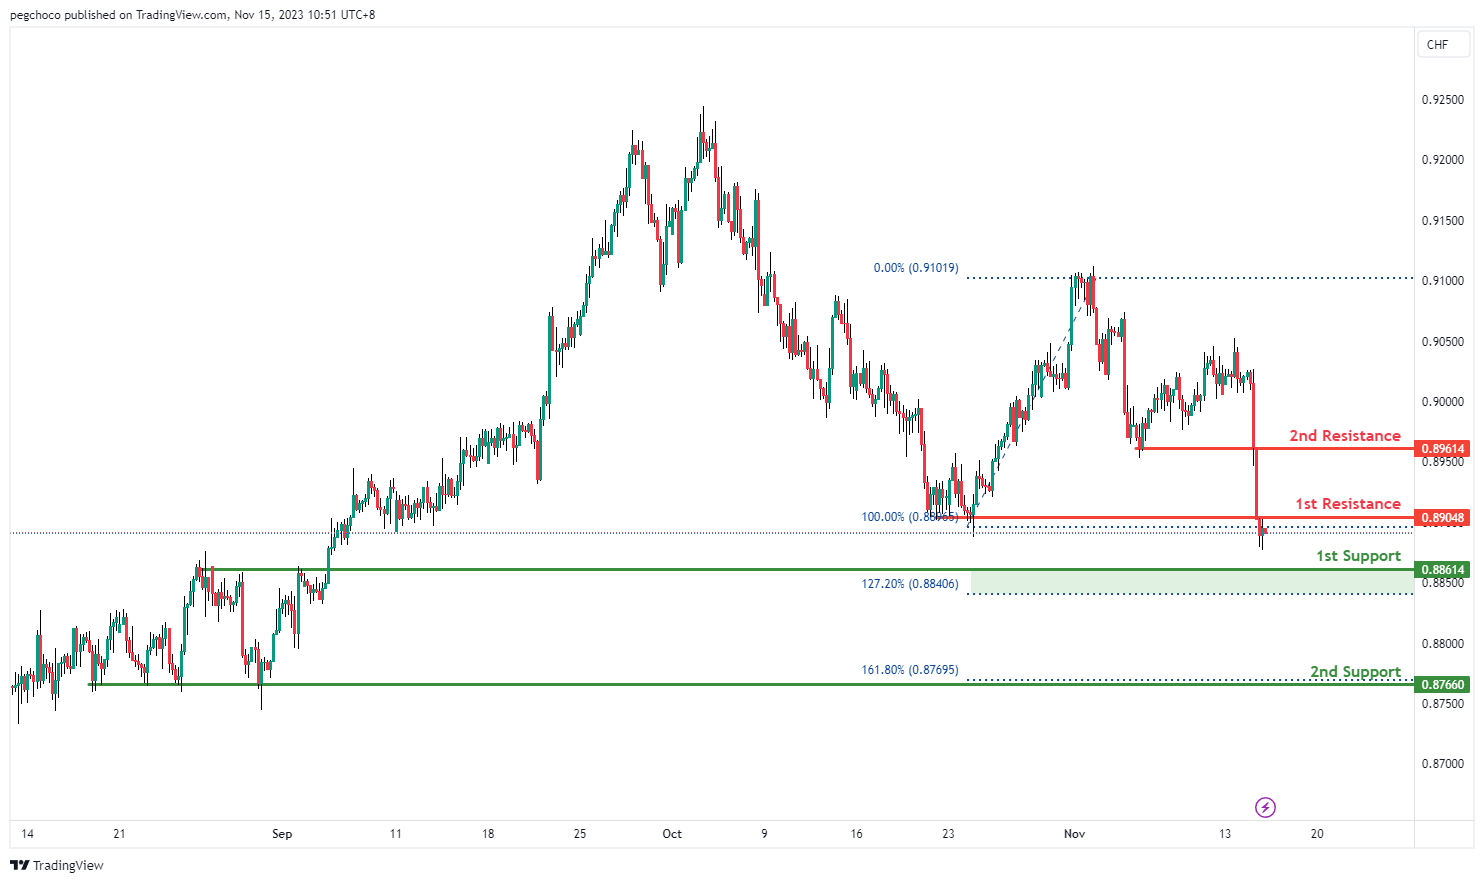
The USD/CHF chart currently exhibits a bearish overall momentum, suggesting the potential for a bearish continuation towards the 1st support level.
The 1st support level at 0.8861 is identified as a pullback support and coincides with the 127.20% Fibonacci Extension level. This confluence suggests a significant level of support where traders might expect buying interest or a pause in the bearish movement.
The 2nd support at 0.8766 is considered a multi-swing low support and coincides with the 161.80% Fibonacci Extension level. Such levels often indicate areas where buyers have previously intervened, further reinforcing their importance as potential support levels.
On the resistance side, the 1st resistance at 0.8904 is categorized as a pullback resistance. This level may act as a barrier to upward movements, where selling interest could intensify.
Similarly, the 2nd resistance at 0.8961 is also noted as a pullback resistance, adding another layer of potential resistance to the price’s upward movements.
USD/JPY:
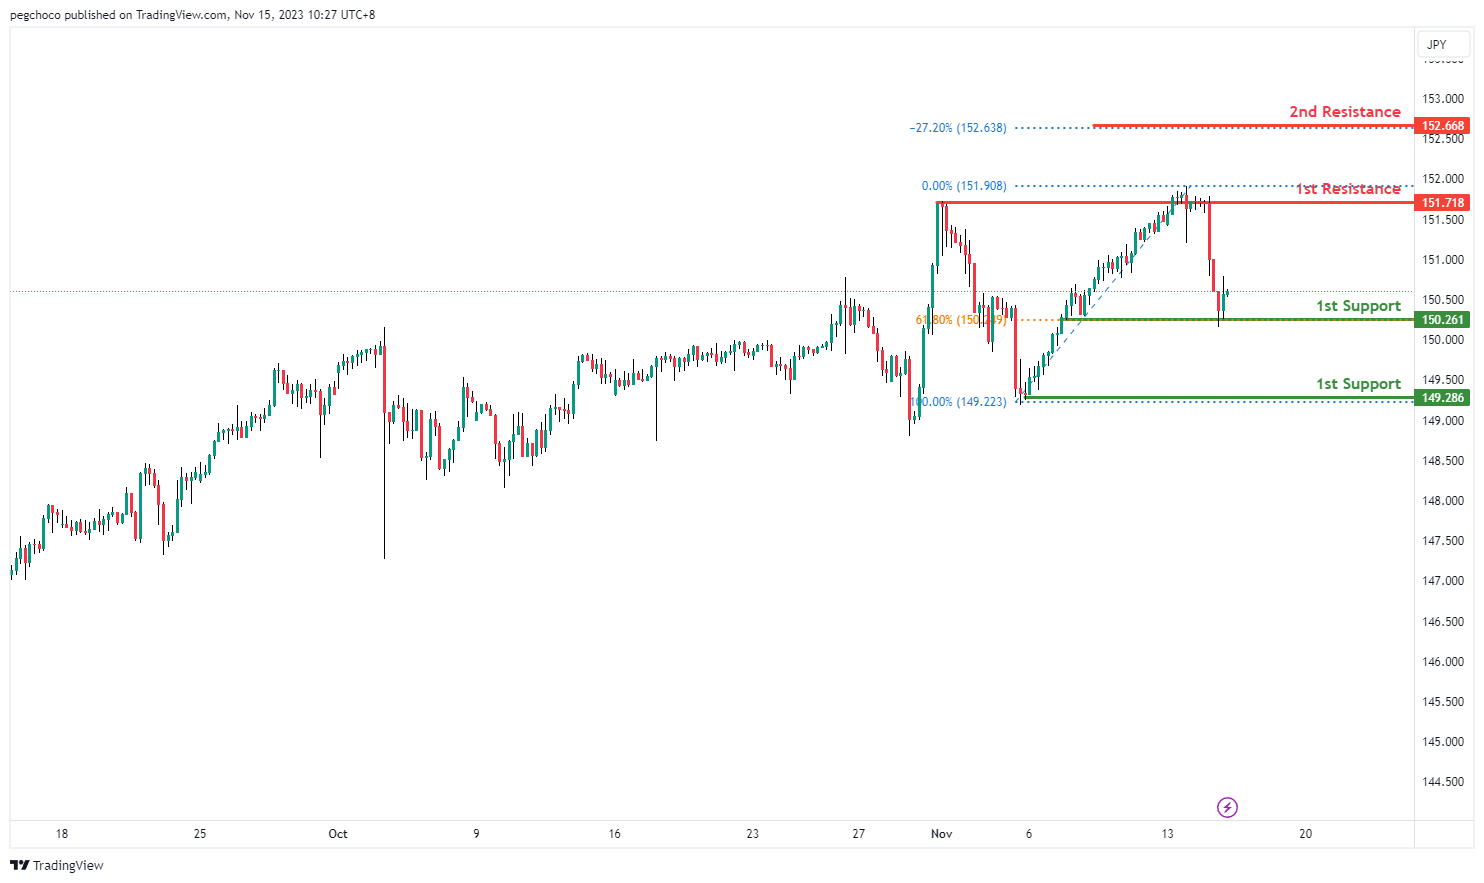
The USD/JPY chart currently has a bullish overall momentum, suggesting the potential for a bullish bounce off the 1st support level and a move towards the 1st resistance.
The 1st support level at 150.26 is identified as an overlap support and also coincides with the 61.80% Fibonacci Retracement level. This confluence indicates a significant level of support where traders may anticipate buying interest or a pause in the bullish movement.
The 2nd support at 149.28 is considered a swing low support, further reinforcing its potential as a support level. Swing lows often represent areas where buyers have previously stepped in, making it a relevant support level.
On the resistance side, the 1st resistance at 151.71 is categorized as a multi-swing high resistance, suggesting that there could be selling interest in this area. This level could act as a barrier to further upward movement.
The 2nd resistance at 152.66 is noted as a level where the price may encounter selling pressure and corresponds to the -27% Fibonacci Extension level.
USD/CAD:
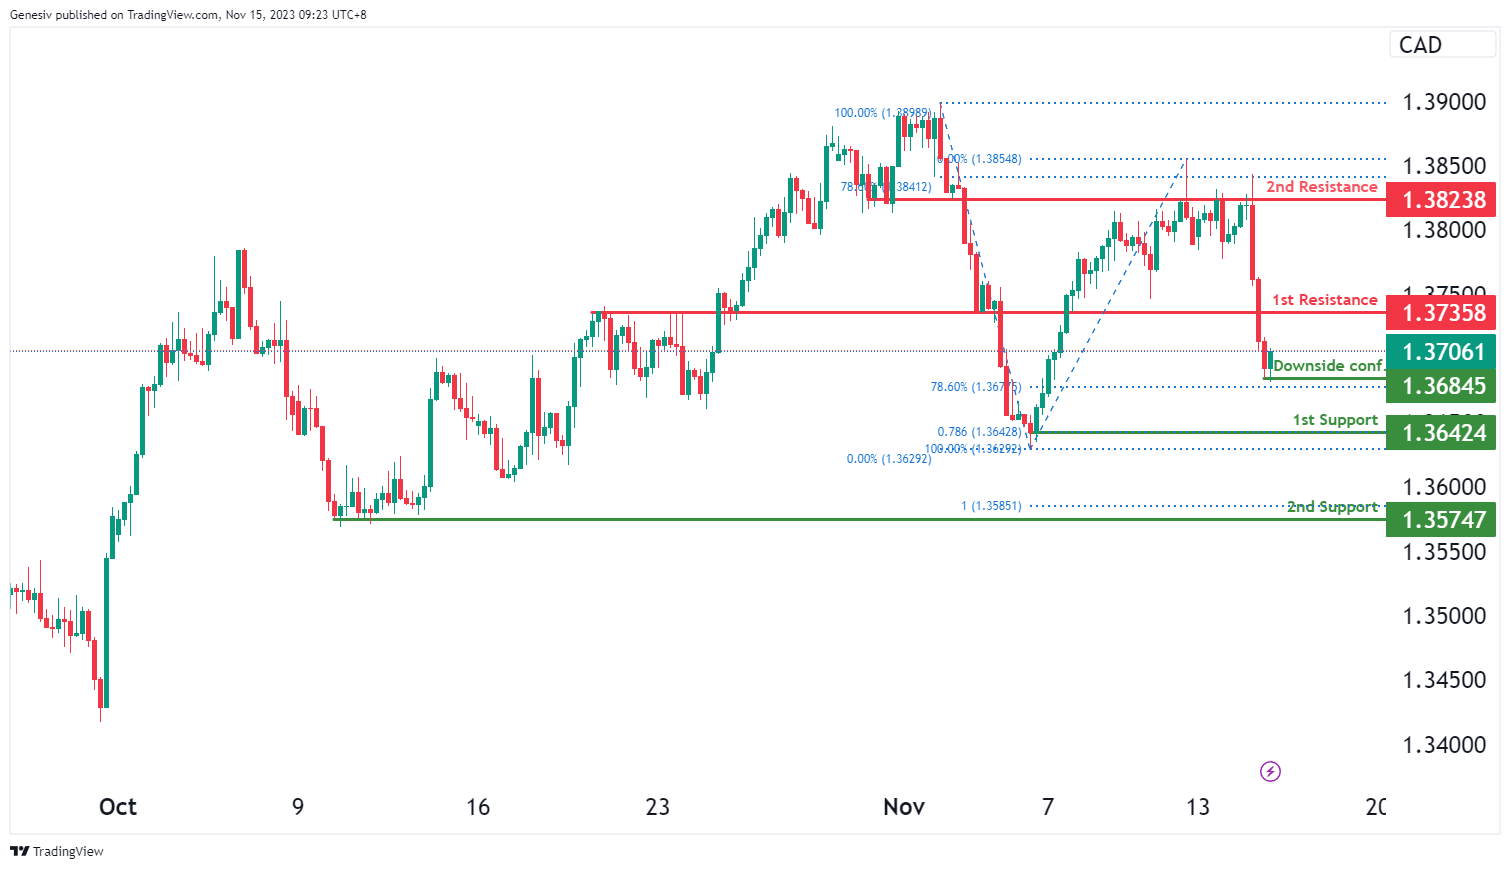
The USD/CAD chart currently shows an overall bearish momentum, indicating the potential for further downside movement should price break under the downside confirmation.
The downside confirmation level at 1.3685 is identified as a pullback support that aligns close to the 78.60% Fibonacci retracement level while the 1st support level at 1.3642 is marked as a swing-low support that aligns close to the 78.60% Fibonacci projection level. Further below, the 2nd support level at 1.3575 is noted as a pullabck support that aligns close to the 100.00% Fibonacci projection level.
To the upside, the 1st resistance level at 1.3736 is identified as an overlap resistance. Higher up, the 2nd resistance level at 1.3824 is also marked as an overlap resistance that aligns close to the 78.60% Fibonacci retracement level.
AUD/USD:
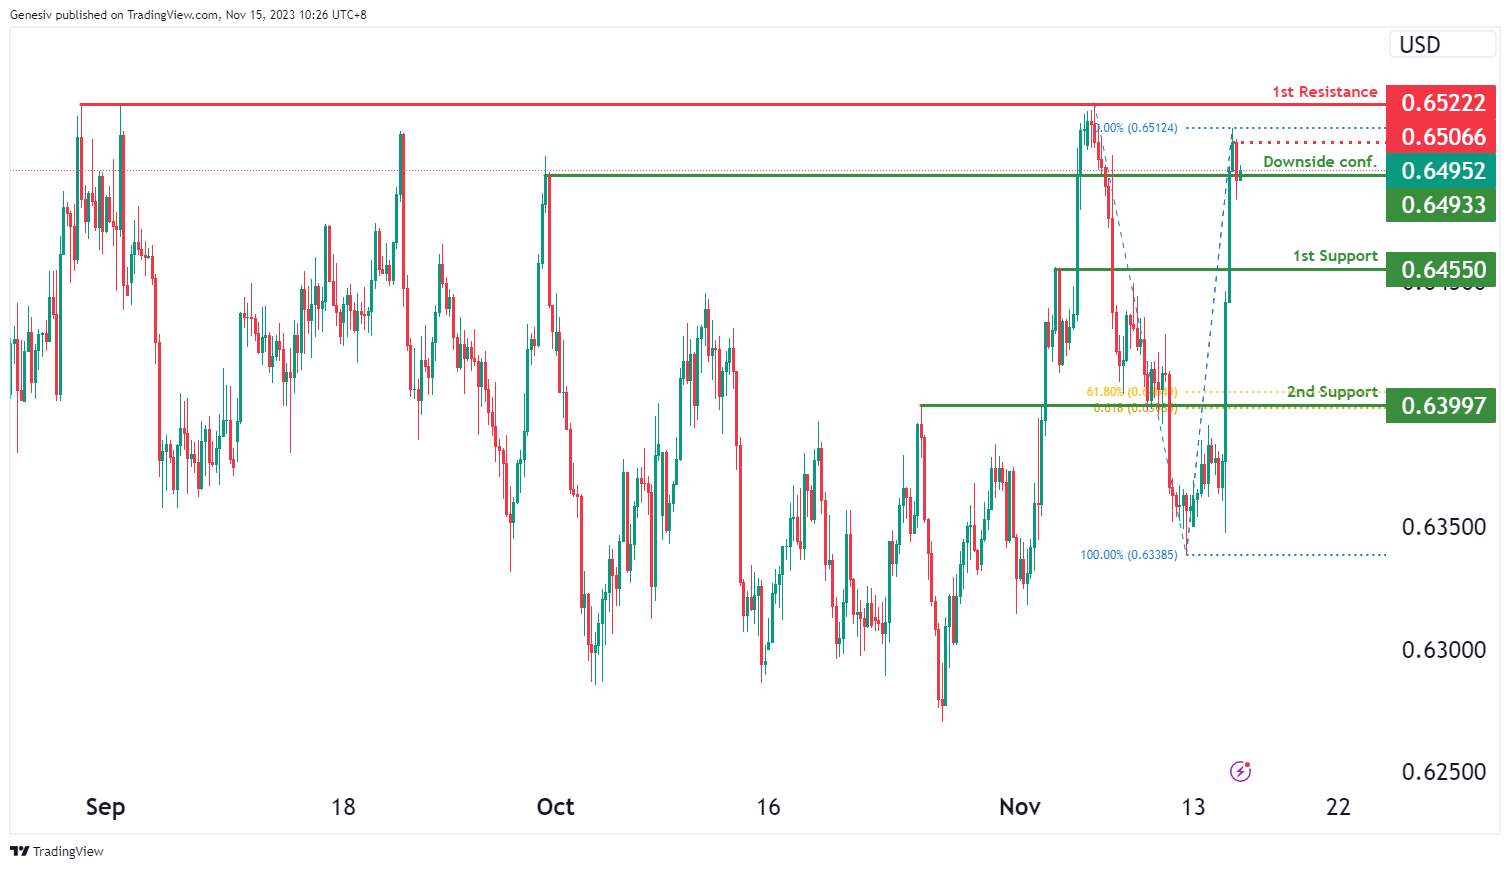
The AUD/USD chart currently exhibits an overall bullish momentum, suggesting the potential for a bullish continuation towards the 1st resistance.
The intermediate resistance level at 0.6507 is identified as a pullback resistance. Higher up, the 1st resistance level at 0.6522 is marked as a multi-swing-high resistance, suggesting that it could serve as a strong resistance level.
On the support side, the downside confirmation level at 0.6493 is identified as a pullback support. Should price break below this level, it could trigger a bearish move towards the 1st support level. The 1st support level at 0.6455 is noted as a pullback support. Further below, the 2nd support level at 0.6399 is also marked as a pullback support that aligns with a confluence of Fibonacci levels i.e. the 61.80% retracement and the 61.80% projection levels, suggesting a significant support level.
NZD/USD
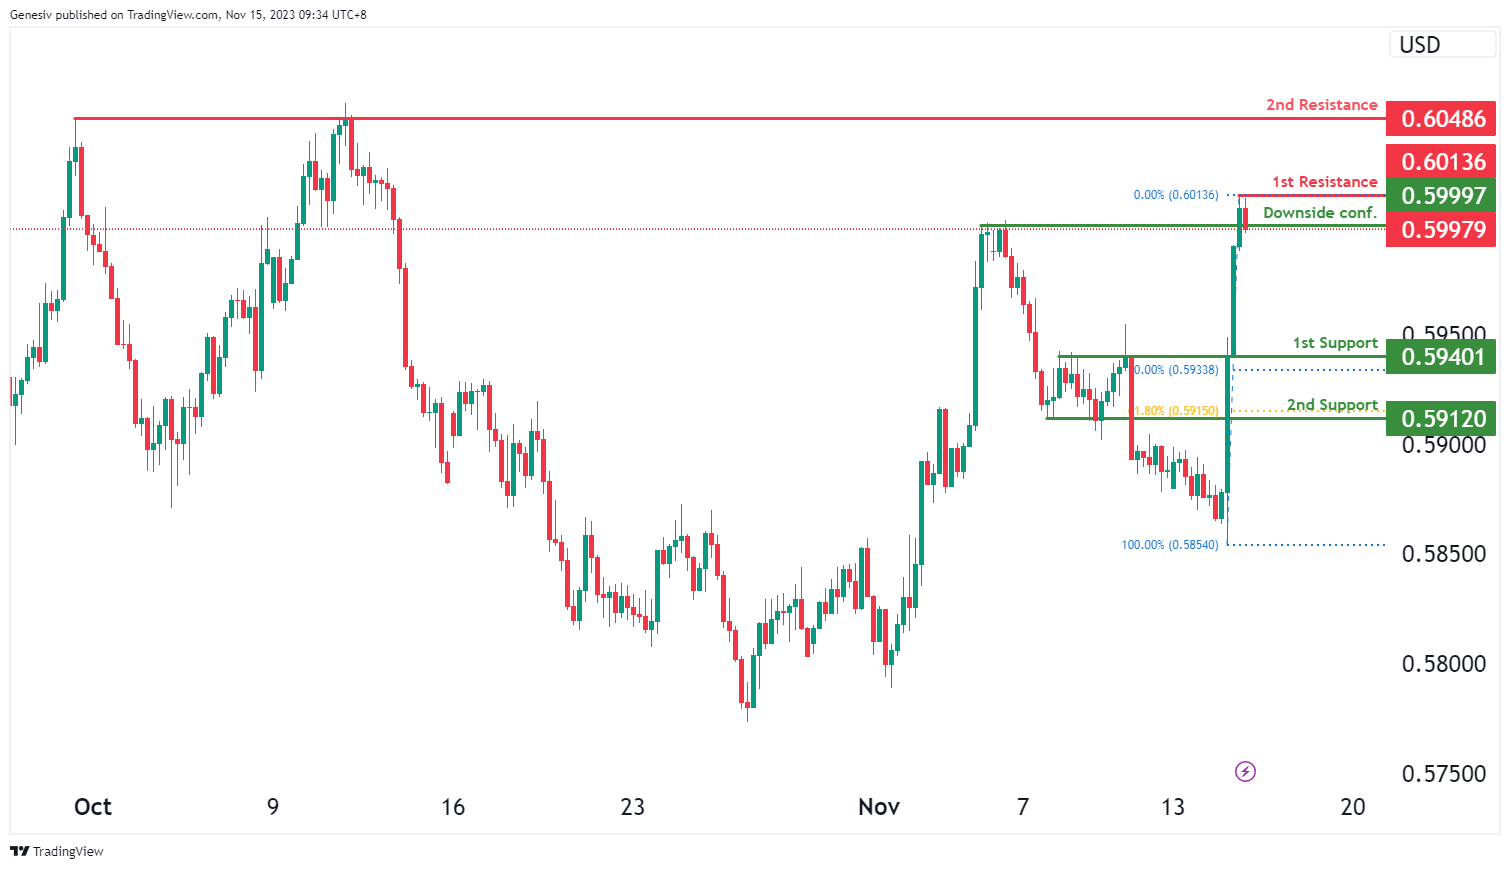
The NZD/USD chart currently exhibits an overall bullish momentum, suggesting the potential for further upward movement.
The 1st resistance level at 0.6014 is identified as a pullback resistance while the 2nd resistance level at 0.6049 is marked as a multi-swing-high resistance, indicating its potential strength as a barrier to further bullish movement.
To the downside, the 1st support level at 0.5940 is identified as a pullback support that aligns close to the 50.00% Fibonacci retracement level. Further below, the 2nd support level at 0.5912 is also noted as a pullback support that aligns with the 61.80% Fibonacci retracement level, signifying its significance as a strong support area.
DJ30:
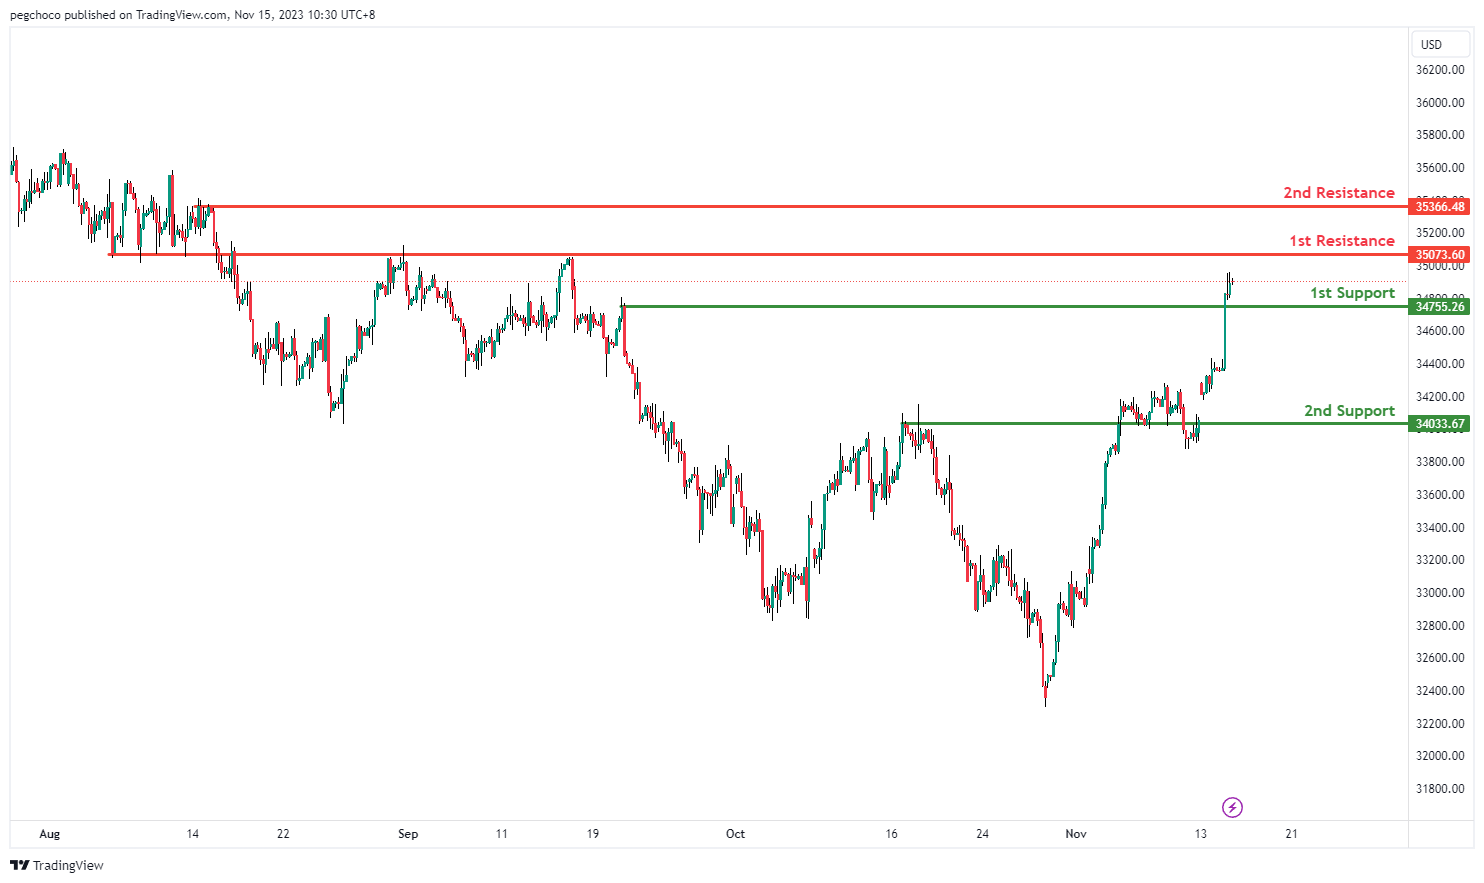
The DJ30 chart is currently showing an overall bullish momentum, suggesting a potential for price to make a bullish continuation towards the 1st resistance.
The 1st resistance level at 35073.60 is marked as an overlap resistance. Higher up, the 2nd resistance level at 35366.48 is noted as a pullback resistance, indicating a potential resistance area for further upward movement.
On the support side, the 1st support level at 34755.26 is identified as a pullback support. Further below, the 2nd support level at 34033.67 is noted as an overlap support, marking another potential level for a strong support area.
GER40:
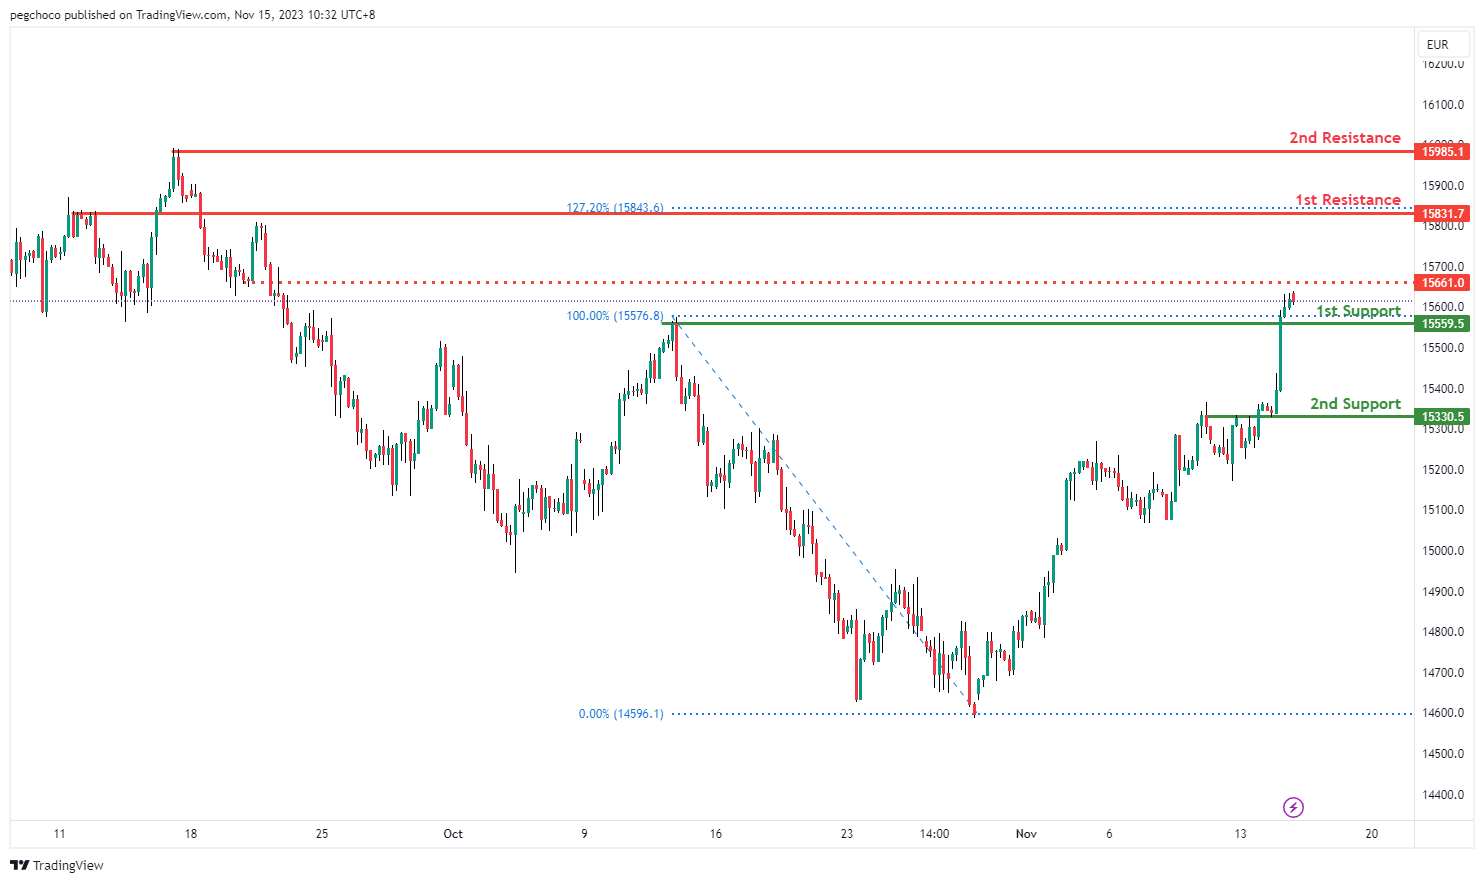
The GER40 chart is currently displaying an overall bullish momentum, suggesting a potential for price to make a bullish continuation towards the 1st resistance should it break above the intermediate resistance.
The intermediate resistance level at 15661.00 is identified as a pullback resistance while the 1st resistance level at 15831.70 is marked as an overlap resistance that aligns with the 127.20% Fibonacci extension level. Higher up, the 2nd resistance level at 15985.10 is noted as a swing-high resistance, indicating a potential resistance area for further upward movement.
On the support side, the 1st support level at 15559.50 is identified as a pullback support. Further below, the 2nd support level at 15330.50 is noted as an overlap support, marking another potential level for a strong support area.
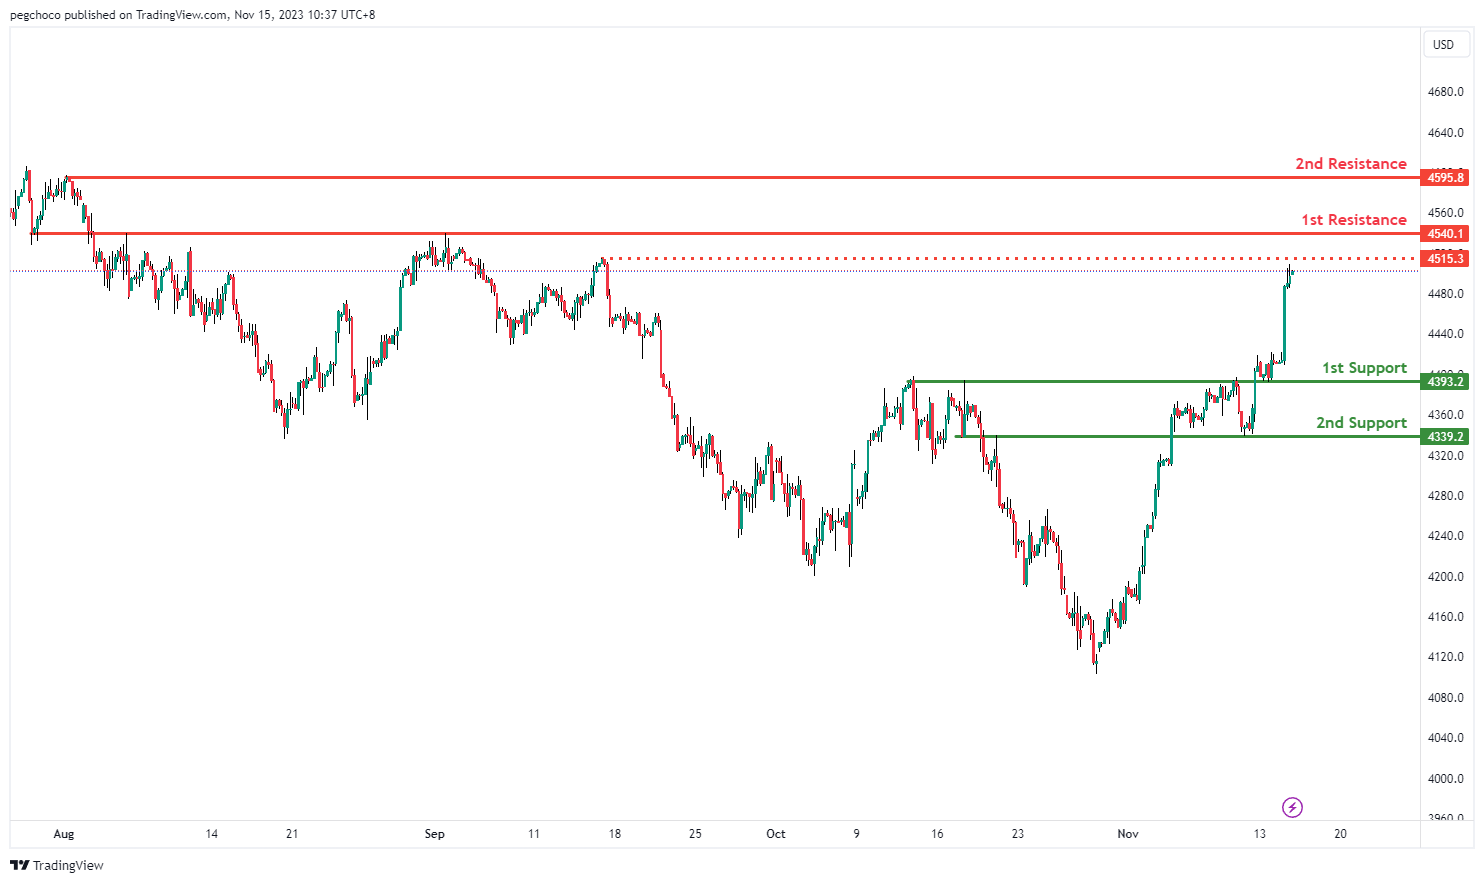
US500
The US500 chart is currently indicating an overall bullish momentum, suggesting a potential for price to make a bullish continuation towards the 1st resistance should it break above the intermediate resistance.
The intermediate resistance level at 4515.30 is identified as a pullback resistance while the 1st resistance level at 4540.10 is marked as an overlap resistance. Higher up, the 2nd resistance level at 4595.80 is noted as a pullback resistance, indicating a potential resistance area for further upward movement.
On the support side, the 1st support level at 4393.20 is identified as an overlap support. Further below, the 2nd support level at 4339.20 is also noted as an overlap support, marking another potential level for a strong support area.
BTC/USD:
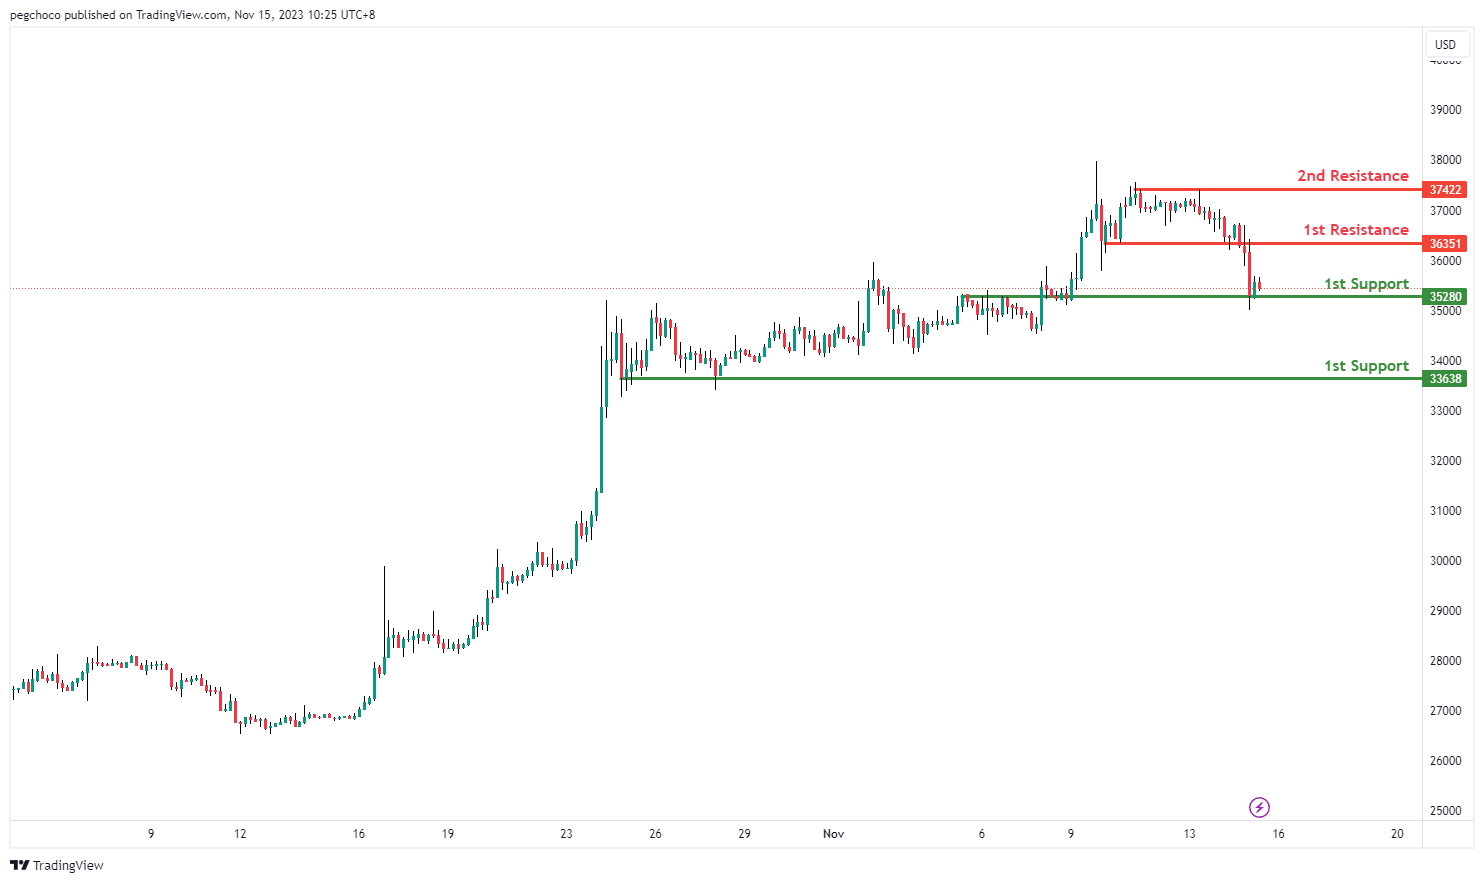
The BTC/USD chart is currently exhibiting a an overall bearish momentum with a potential for price to make a bearish continuation towards the 1st support.
The 1st support level at 35280 is identified as an overlap support. Further below, the 2nd support level at 33638 is marked as a pullback support, potentially acting as a strong support area.
To the upside, the 1st resistance level at 36351 is idenitfed as a pullback resistance while the 2nd resistance level at 37422 is also noted as another pullback resistance, indicating a significant level where price might encounter hurdles to its upward movement.
ETH/USD:
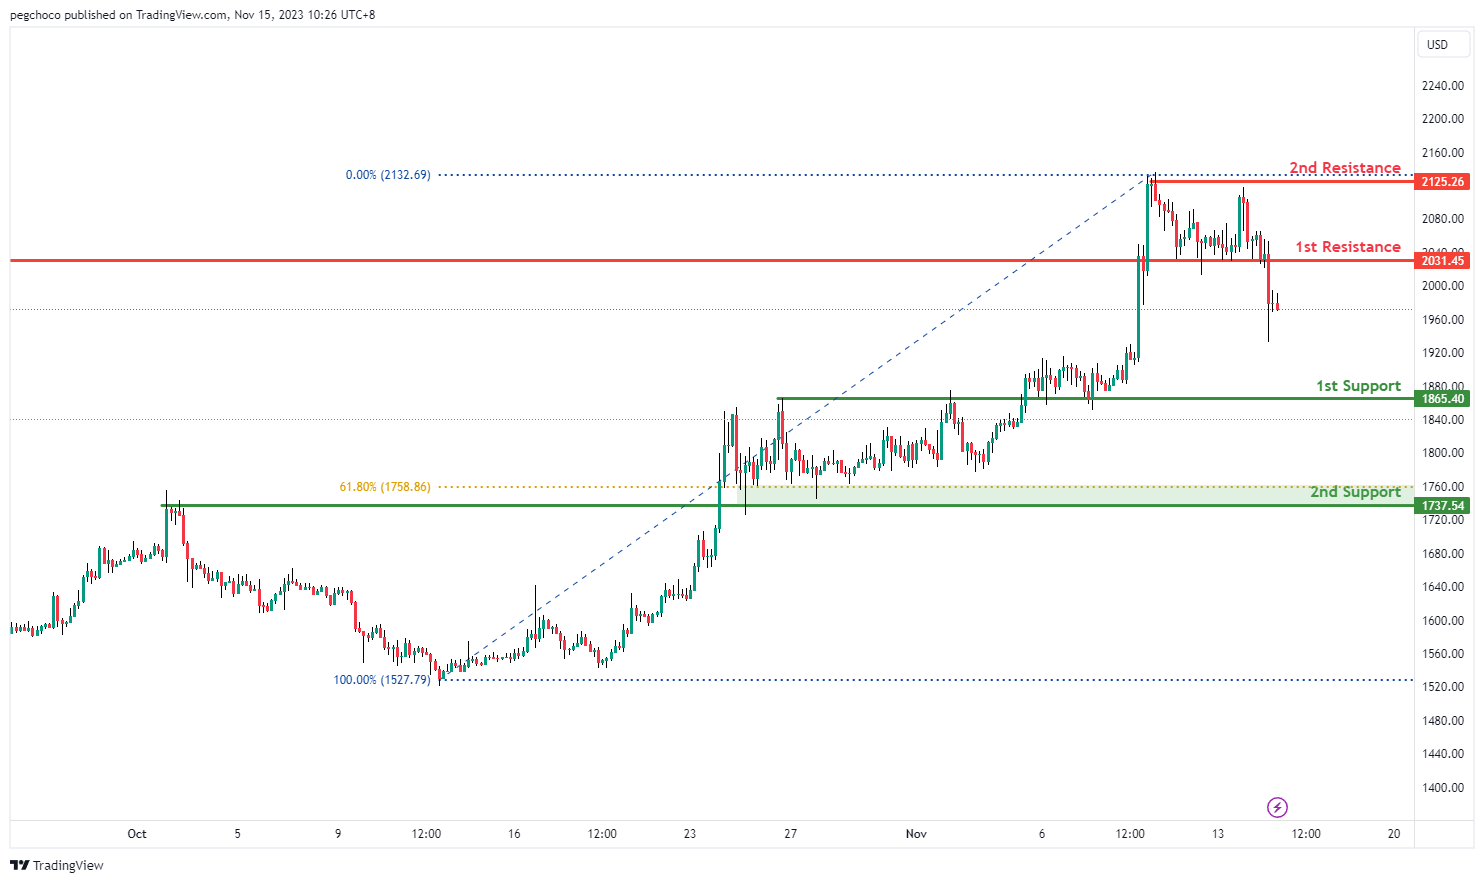
The ETH/USD chart currently displays an overall bearish momentumwith a potential for price to make a bearish continuation towards the 1st support.
The 1st support level at 1865.40 is identified as an overlap support. Further below, the 2nd support level at 1737.54 is also marked as an overlap support that aligns with the 61.80% Fibonacci retracement level.
To the upside, the 1st resistance level at 2031.45 is idenitfed as an overlap resistance while the 2nd resistance level at 2125.26 is noted as a pullback resistance, indicating a significant level where price might encounter hurdles to its upward movement.
WTI/USD:
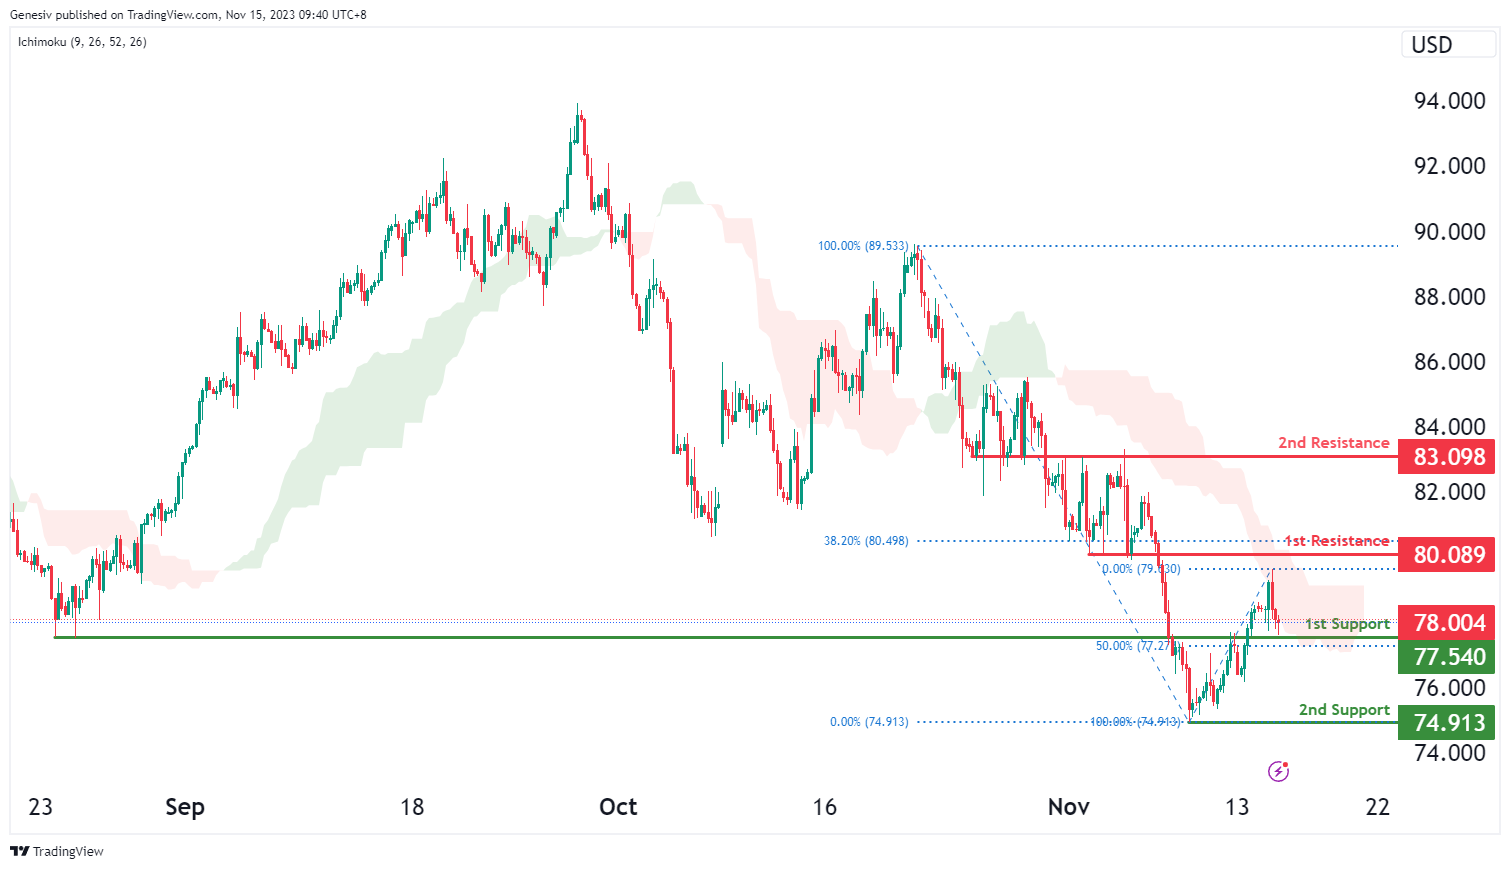
The WTI (West Texas Intermediate) chart currently shows a weak bullish momentum, suggesting the potential for further upward movement towards the 1st resistance. However, price is also trading within the bearish Ichimoku cloud and any price gains could potentially be restricted by the cloud.
The 1st resistance level at 80.09 is identified as a pullback resistance that aligns close to the 38.20% Fibonacci retracement level. Higher up, the 2nd resistance level at 83.09 is marked as an overlap resistance, suggesting potential strength as a barrier to further bullish movement.
To the downside, the 1st support level at 77.54 is identified as an overlap support that aligns with the 50.00% Fibonacci retracement level. Further below, the 2nd support level at 74.91 is noted as a swing-low support, signifying its potential as a strong support area.
XAU/USD (GOLD):
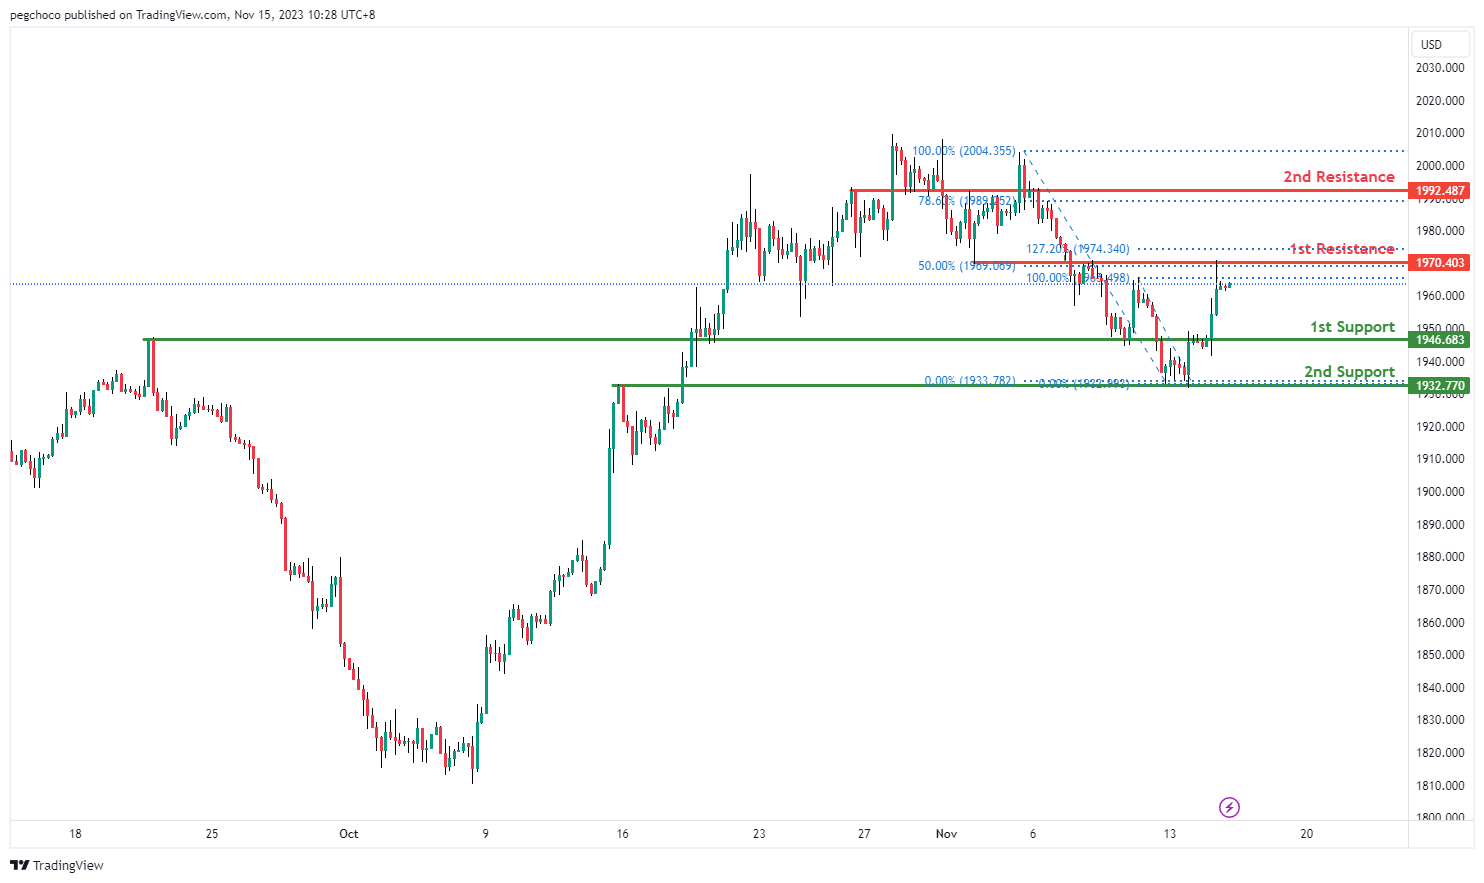
The XAU/USD chart currently exhibits a bullish overall momentum, suggesting the potential for a bullish continuation towards the 1st resistance.
The 1st support level at 1946.68 is identified as a pullback support, indicating it could act as a significant level of support. Pullback supports often attract buying interest or lead to a pause in the bullish movement.
The 2nd support at 1932.77 is categorized as an overlap support, further reinforcing its potential as a support level. Overlap supports indicate areas where historical price action has found support.
On the resistance side, the 1st resistance at 1970.40 is noted as an overlap resistance and coincides with the 50% Fibonacci Retracement level. This confluence suggests that there could be selling interest in this area, potentially acting as a barrier to further upward movement.
The 2nd resistance at 1992.48 is identified as an overlap resistance, further strengthening the potential resistance level.
GBP/USD Daily Outlook
Daily Pivots: (S1) 1.2337; (P) 1.2421; (R1) 1.2583; More...
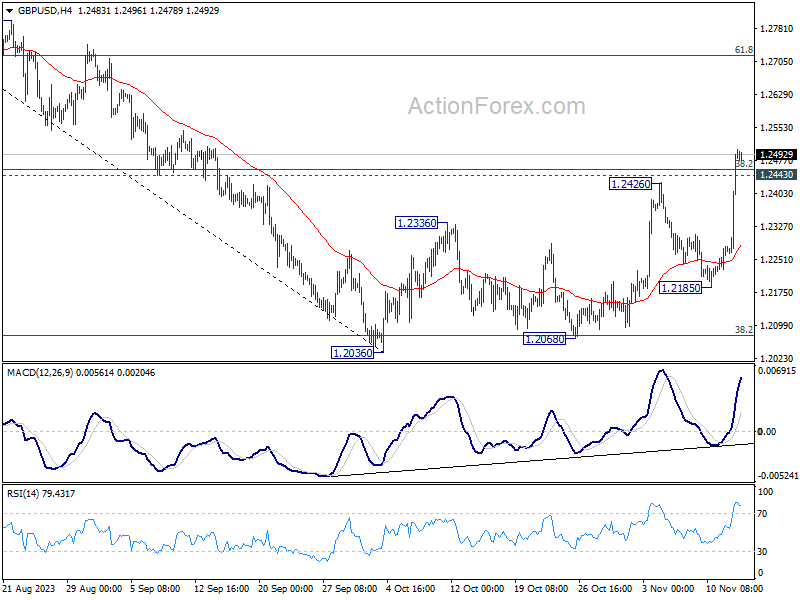
GBP/USD's rally extends to as high as 1.2504 so far. Intraday bias remains on the upside at this point. Sustained trading above 38.2% retracement of 1.3141 to 1.2036 at 1.2458 will pave the way to 61.8% retracement at 1.2716. On the downside, below 1.2443 minor support will turn intraday bias neutral and bring retreat. But downside should be contained well above 1.2185 support to bring another rally.
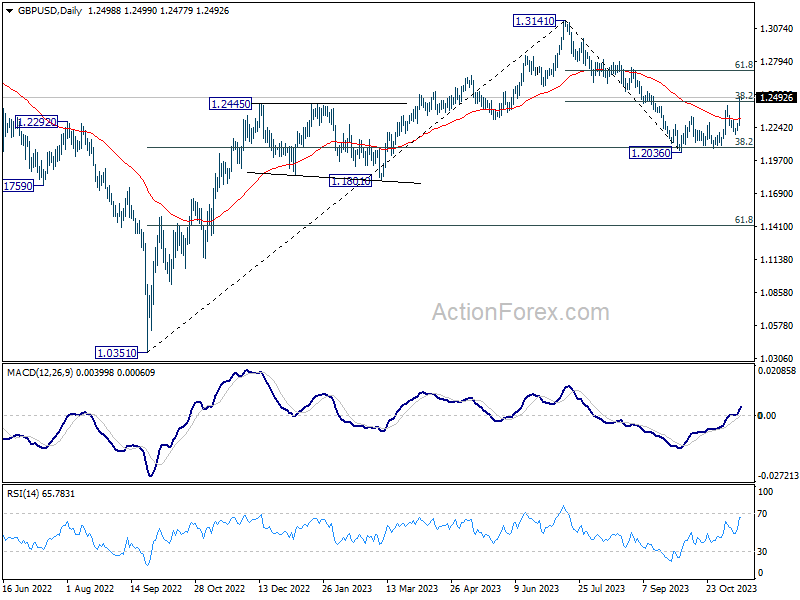
In the bigger picture, price actions from 1.3141 are seen as a corrective pattern to rise from 1.0351 (2022 low). Strong rebound from 38.2% retracement of 1.0351 (2022 low) to 1.3141 at 1.2075 will argue that current rise from 1.2036 is already the second leg. However, while further rally could be seen, upside should be limited by 1.3141 to bring the third leg of the pattern.
Dollar Weakness Prevails as Market Bets on Fed Rate Pivot, H1 Cut Expectations Surge
Dollar remains subdued in the aftermath of its significant selloff triggered by CPI release overnight. Market sentiment has swiftly shifted, with the majority now almost ruling out the possibility of further rate hikes by Fed. This shift indicates a growing consensus that current federal funds rate of 5.25-5.50% marks the peak of this cycle.
Moreover, traders are increasingly speculating more boldly on the timing of rate cuts, with approximately 30% chance by the end of Q1 and over 80% probability by the end of the first half of the next year. This speculation is primarily driven by the belief that Fed might pivot to easing policies sooner if economic data continues to show signs of a downturn.
The impact of these expectations is evident across various markets. Notably, NASDAQ led a robust closing in major indexes, and the 10-year yield experienced a significant decline, losing nearly -0.2%. Looking back, the psychological level of 5% yields seemed to have attracted significant treasury buying interest. Future data that underperforms could spur an even more pronounced dip in yields, and intensifying expectation of Fed's pivot to rate cuts in 2024.
In the foreign exchange markets, Australian and New Zealand Dollars have emerged as the primary beneficiaries of Dollar's weakness, leading the performance charts for the week. This strength is amplified by positive sentiment flowing through Asian markets. British Pound, known for its sensitivity to shifts in risk sentiment, has also performed strongly, while Euro trails closely behind. Conversely, Japanese Yen and Swiss Franc, despite their appreciable gains against Dollar, have not matched the momentum seen in other major currencies.
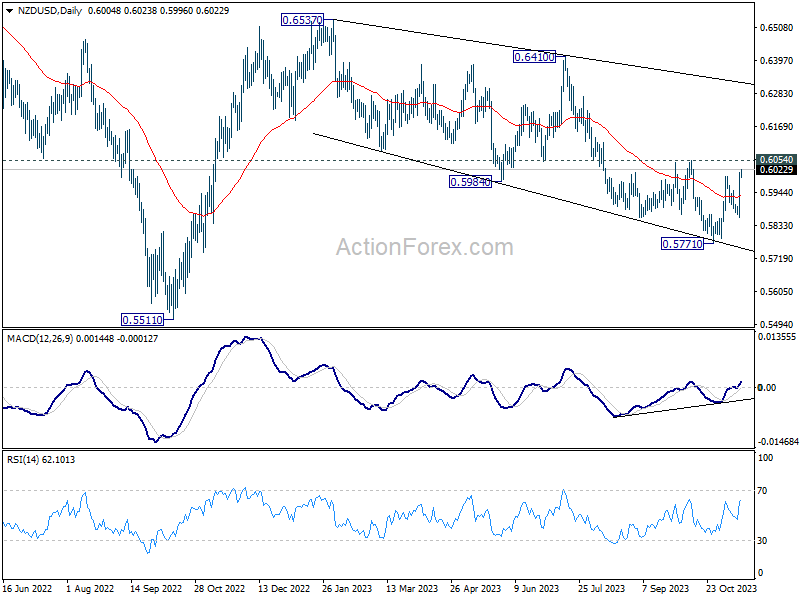
From a technical perspective, a key question is whether NZD/USD and AUD/USD's down trend since February has already completed in October. Focus is now on 0.6054 resistance in NZD/USD (corresponding level of 0.6510 in AUD/USD) for the near term. Decisive break of 0.6054 will argue that the fall from 0.6537 has completed with three waves down to 0.5771. That would change near term outlook bullish for at least a take on falling trend resistance (now at 0.6318). Synchronized rallies in NZD/USD and AUD/USD will reinforce each other.
In Asia, at the time of writing, Nikkei is up 2.28%. Hong Kong HSI is up 2.83%. China Shanghai SSE is up 0.45%. Singapore Strait Times is up 0.50%. Japan 10-year JGB yield is down -0.077 at 0.779. Overnight, DOW rose 1.43%. S&P 500 rose 1.91%. NASDAQ rose 2.37%. 10-year yield fell -0.191 to 4.441.
Fed's Goolsbee eyes housing as crucial for continued disinflation progress
Chicago Fed President Austan Goolsbee acknowledged yesterday that "progress continues towards 2% inflation target. He highlighted the decline in goods inflation, but points out the critical role of housing inflation in the coming quarters.
Goolsbee emphasized, "With goods inflation already coming down and nonhousing services inflation typically slow to adjust, the key to further progress over the next few quarters will be what happens to housing inflation."
Separately, Richmond Fed President Thomas Barkin exhibited a more guarded stance. He expresses doubts about a smooth transition to the Fed's inflation target, underscoring the complexity of the current economic scenario.
Barkin noted, "I'm just not convinced that inflation is on some smooth glide path down to 2%." He acknowledges the recent decrease in inflation rates but attributes it primarily to the partial reversal of spikes seen during the Covid era, driven by high demand and supply constraints.
Barkin further points out that certain sectors, such as shelter and services, continue to exhibit inflation rates above historical norms.
Japan's GDP down -0.5% qoq, -2.1% annualized in Q3
Japan's GDP contracted -0.5% qoq in Q3, starkly underperformed market expectations of -0.1% qoq decline. On annualized basis, the situation appears even more drastic, with the economy shrinking by -2.1%, far exceeding anticipated -0.6% contraction, and being the worst since Q3 2021.
A critical factor in this downturn was a -0.6% decrease in business investment, marking a continuous decline for two consecutive quarters. This reduction was primarily influenced by reduced spending on semiconductor production equipment, reflecting broader challenges in global tech sector.
Additionally, private consumption, a key driver of economic activity, saw a marginal fall of -0.04%. This marks the second successive quarter of decline, with slump in vehicle sales significantly impacting consumer spending.
China's industrial and retail growth surpass expectations, PBOC injects fresh funds
China's industrial output and retail sales for October exceeded market expectations. Industrial production rose 4.6% yoy, surpassing forecasted 4.5% yoy, marking an improvement from September's 4.5% yoy growth. Retail sales recorded a robust 7.6% yoy growth, significantly higher than anticipated 7.0% yoy and showing a considerable improvement from 5.5% yoy increase in September.
However, fixed asset investment experienced slower growth, rising only 2.9% ytd yoy, which was below the expected 3.1%. The real estate sector particularly faced challenges, with investment dropping by -9.3% ytd yoy, a deterioration compared to the previous period through September.
In a separate development, People's Bank of China maintained interest rate on CNY 1.45T worth of one-year medium-term lending facility loans at 2.50%, consistent with previous operations. As CNY 850B worth of MLF loans were set to expire this month, this move resulted in a net injection of CNY 600B of fresh funds into the banking system.
The central bank stated that this loan operation aimed to keep the banking system's liquidity at a reasonably ample level, countering short-term factors such as tax payments and government bond issuances.
Looking ahead
UK CPI is the main focus in European while PPI and RPI will also be released. Eurozone trade balance and industrial production will be featured too.
Later in the day, US retail sales will be the main focus, along with PPI and Empire stat manufacturing index. Canada will release manufacturing sales and wholesale sales.
GBP/USD Daily Outlook
Daily Pivots: (S1) 1.2337; (P) 1.2421; (R1) 1.2583; More...
GBP/USD's rally extends to as high as 1.2504 so far. Intraday bias remains on the upside at this point. Sustained trading above 38.2% retracement of 1.3141 to 1.2036 at 1.2458 will pave the way to 61.8% retracement at 1.2716. On the downside, below 1.2443 minor support will turn intraday bias neutral and bring retreat. But downside should be contained well above 1.2185 support to bring another rally.
In the bigger picture, price actions from 1.3141 are seen as a corrective pattern to rise from 1.0351 (2022 low). Strong rebound from 38.2% retracement of 1.0351 (2022 low) to 1.3141 at 1.2075 will argue that current rise from 1.2036 is already the second leg. However, while further rally could be seen, upside should be limited by 1.3141 to bring the third leg of the pattern.
Economic Indicators Update
| GMT | Ccy | Events | Actual | Forecast | Previous | Revised |
|---|---|---|---|---|---|---|
| 00:30 | AUD | Wage Price Index Q/Q Q3 | 1.30% | 1.30% | 0.80% | 0.90% |
| 23:50 | JPY | GDP Q/Q Q3 P | -0.50% | -0.10% | 1.20% | |
| 23:50 | JPY | GDP Deflator Y/Y Q3 P | 5.10% | 4.80% | 3.50% | |
| 02:00 | CNY | Industrial Production Y/Y Oct | 4.60% | 4.50% | 4.50% | |
| 02:00 | CNY | Retail Sales Y/Y Oct | 7.60% | 7.00% | 5.50% | |
| 02:00 | CNY | Fixed Asset Investment YTD Y/Y Oct | 2.90% | 3.10% | 3.10% | |
| 04:30 | JPY | Industrial Production M/M Sep F | 0.50% | 0.20% | 0.20% | |
| 07:00 | GBP | CPI M/M Oct | 0.20% | 0.50% | ||
| 07:00 | GBP | CPI Y/Y Oct | 4.70% | 6.70% | ||
| 07:00 | GBP | Core CPI Y/Y Oct | 5.80% | 6.10% | ||
| 07:00 | GBP | RPI M/M Oct | 0.50% | |||
| 07:00 | GBP | RPI Y/Y Oct | 6.40% | 8.90% | ||
| 07:00 | GBP | PPI Input M/M Oct | 0.10% | 0.40% | ||
| 07:00 | GBP | PPI Input Y/Y Oct | -2.60% | |||
| 07:00 | GBP | PPI Output M/M Oct | 0.10% | 0.40% | ||
| 07:00 | GBP | PPI Output Y/Y Oct | -0.10% | |||
| 07:00 | GBP | PPI Core Output M/M Oct | 0.00% | |||
| 07:00 | GBP | PPI Core Output Y/Y Oct | 0.70% | |||
| 10:00 | EUR | Eurozone Trade Balance (EUR) Sep | 12.3B | 11.9B | ||
| 10:00 | EUR | Eurozone Industrial Production M/M Sep | -0.90% | 0.60% | ||
| 13:30 | CAD | Manufacturing Sales M/M Sep | 0.80% | 0.70% | ||
| 13:30 | CAD | Wholesale Sales M/M Sep | 1.40% | 2.30% | ||
| 13:30 | USD | Empire State Manufacturing Index Nov | -2.6 | -4.6 | ||
| 13:30 | USD | Retail Sales M/M Oct | -0.30% | 0.70% | ||
| 13:30 | USD | Retail Sales ex Autos M/M Oct | -0.20% | 0.60% | ||
| 13:30 | USD | PPI M/M Oct | 0.10% | 0.50% | ||
| 13:30 | USD | PPI Y/Y Oct | 1.90% | 2.20% | ||
| 13:30 | USD | PPI Core M/M Oct | 0.20% | 0.30% | ||
| 13:30 | USD | PPI Core Y/Y Oct | 2.70% | 2.70% | ||
| 15:00 | USD | Business Inventories Sep | 0.30% | 0.40% | ||
| 15:30 | USD | Crude Oil Inventories |