

Sample Category Title
Australian Dollar Takes a Breather After Wild Week
- Markets see 60% chance of RBA rate hike in H1 of 2024
- US Treasury yields fall to 4.35%
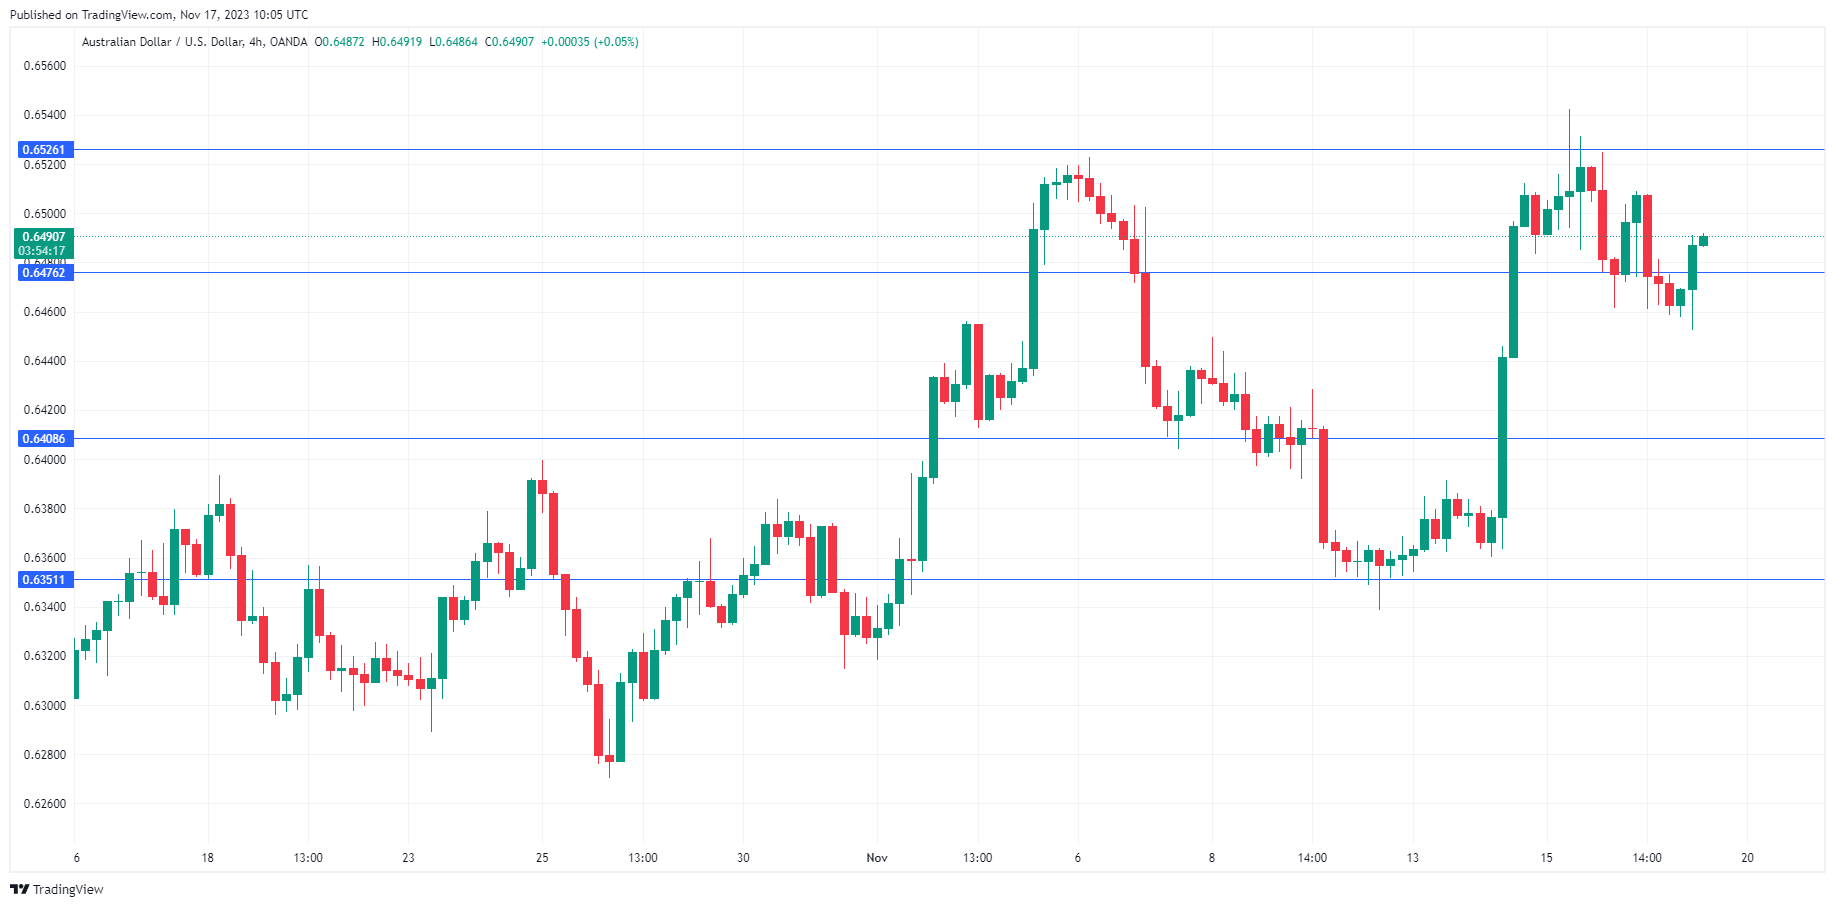
The Australian dollar has bounced back on Friday after losses a day earlier. In the European session, AUD/USD is trading at 0.6487, up 0.24%.
It has been a wild week for the Australian dollar, which soared 2% on Tuesday, courtesy of a softer-than-expected US inflation print. The Aussie climbed as high as 0.6525 on Wednesday, its highest level since August 10th and has climbed 1.9% this week.
Is the RBA done with tightening?
The Reserve Bank of Australia has been aggressive with its rate hikes, bringing the cash rate to 4.35%. The RBA hiked by a quarter-point earlier this month but is widely expected to pause at the December meeting. Thursday’s employment report was much stronger than expected, with a gain of 55,000 jobs compared to the market consensus of 20,000. The release didn’t have much effect on the RBA rate odds, as the lion’s share of the increase in jobs were part-time positions.
As for 2024, investors aren’t sure what to expect from the RBA after December. The markets have priced in about a 60% chance of a quarter-point hike in the first half of 2024, and key releases such as inflation and employment will play major factors in the RBA’s upcoming rate decisions. Goldman Sachs is more dovish, as it projection that inflation to fall below 3% in late 2024 and isn’t expecting any further rate hikes.
In the US, there were further signs this week that the economy is slowly cooling. Inflation was lower than expected at 3.2% and retail sales surprised to the downside with a 0.1% decline. As well, unemployment claims hit a three-month high at 231,000. US Treasury yields fell on Thursday to 4.45%, down from 4.53%, as speculation continues to rise that the Fed has ended or is very close to ending the current rate-tightening cycle.
AUD/USD Technical
- AUD/USD is testing resistance at 0.6476. Above, there is resistance at 0.6526
- 0.6408 and 0.6351 are providing support
XAU/USD: Gold Extends Recovery Towards $2000 Barrier
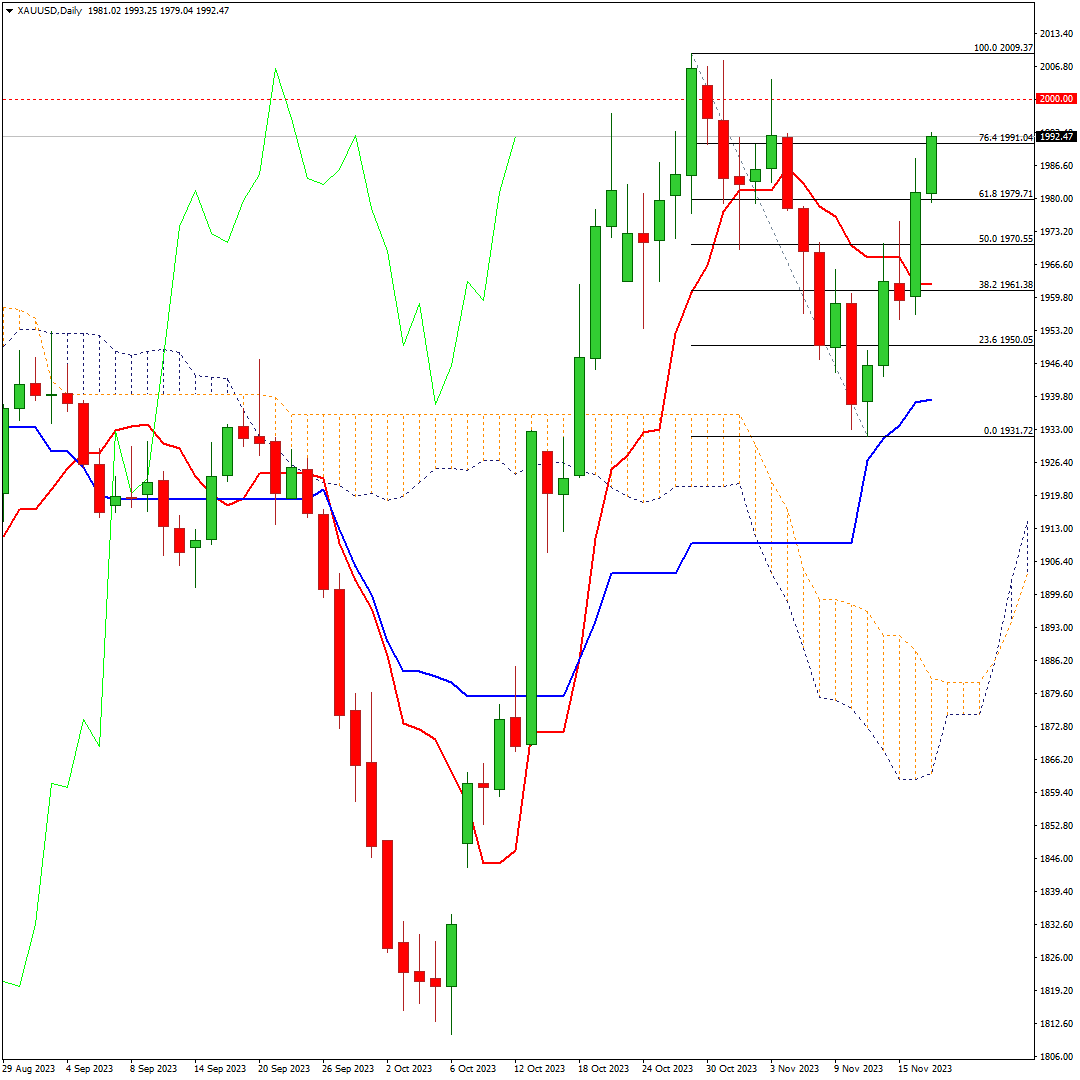
Gold rose to ten-day high on Friday and almost fully retraced last week’s 2.7% drop, driven by growing demand on hopes that the Fed’s tightening cycle is close to its end.
Fresh extension on Friday cracked Fibo barrier at $1991 (76.4% of $2009/$1931), confirming bullish signal generated on close above 20DMA ($1974) and signaling that corrective phase from $2009 (Oct 27 peak) is likely over.
Bulls eye psychological $2000 barrier, where increased headwinds could be expected as daily studies are overbought, with limited dips to ideally find firm ground above $1980 zone (broken Dibo 61.8%) and offer better levels to re-enter bullish market for another probe through $2000.
Only return and close below 20DMA would weaken near-term structure and signal recovery stall.
Res: 2000; 2004; 2009; 2021.
Sup: 1987; 1979; 1974; 1970.
Can JPY Reach New Lows By the End of 2023?
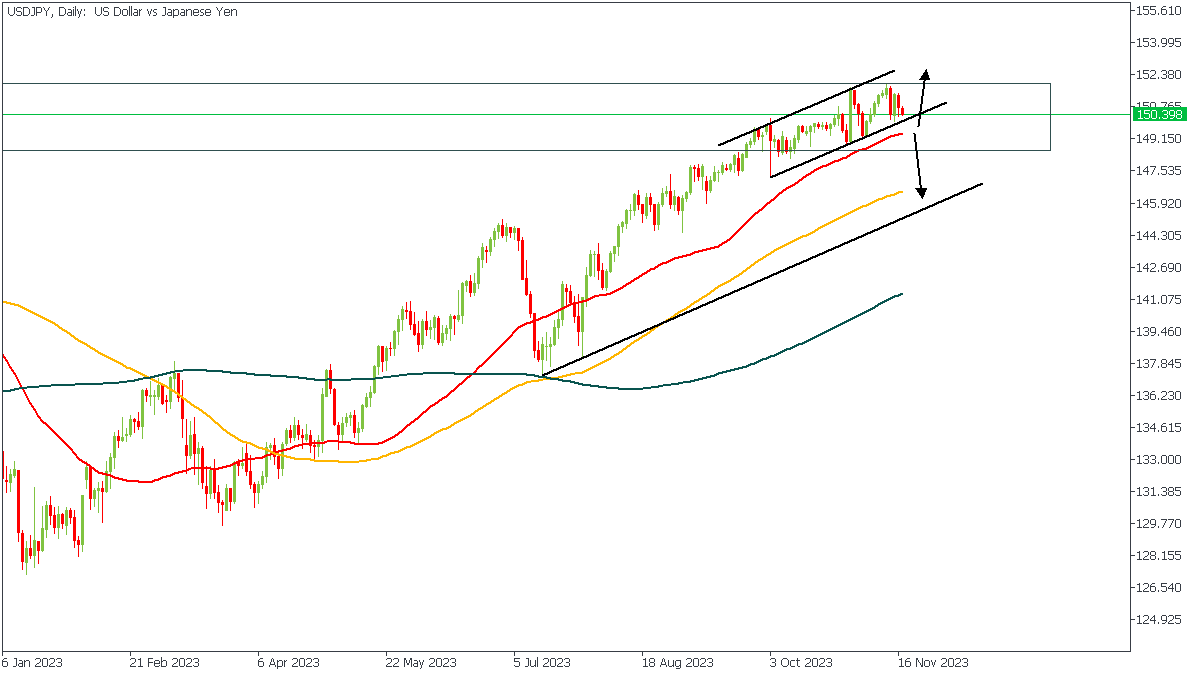
Speculation persists regarding the Bank of Japan's potential departure from negative interest rates, yet the USD/JPY maintains its position within a 150–152 range for seven consecutive sessions. Caution is warranted due to a weaker-than-expected Q3 GDP, a slump in imports, and a more moderate increase in exports, despite inflation remaining elevated. While other central banks approach the conclusion of their rate hike cycles, signals indicate the likelihood of impending Yen strength. BoJ Governor Kazuo Ueda suggests a forthcoming decisive policy move, eliminating the necessity for wage growth to tighten policy. Deputy Gov. Shinichi Uchida explores plans to encourage firms to increase wages, potentially providing forward guidance to break the yen from its current range.
USDJPY - D1 Timeframe
USDJPY on the Daily timeframe is currently trading within a channel right inside a weekly-timeframe supply zone. Even though the clear conclusion should be a bearish sentiment, I would consider this a two-way possibility until the break and retest of the trendline support, since it overlaps the 50-day moving average. My target, in the case of a breakout, would be the 100-day moving average support.
Analyst’s Expectations:
- Direction: Bearish
- Target: 146.600
- Invalidation: 152.039
AUDJPY - D1 Timeframe
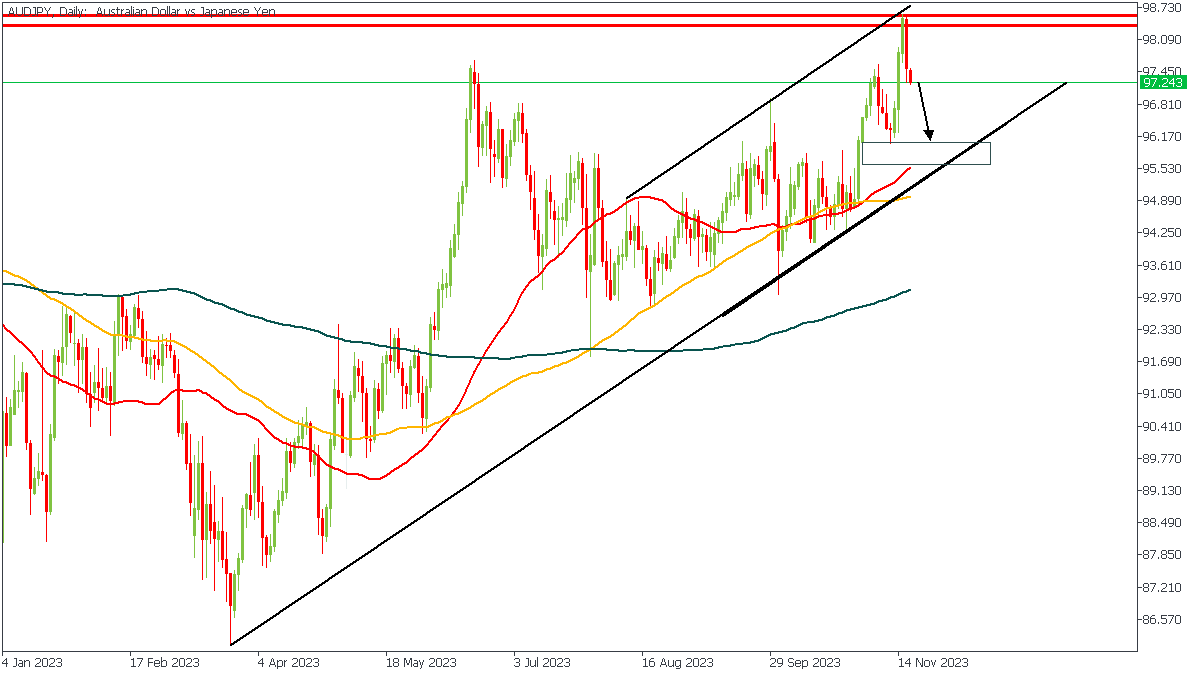
AUDJPY on the daily timeframe has already been rejected from the supply zone, giving a clear indication of what the direction is expected to be - bearish! With this in mind, my target would be the demand zone as marked, since it aligns perfectly with the trendline support.
Analyst’s Expectations:
- Direction: Bearish
- Target: 96.211
- Invalidation: 97.780
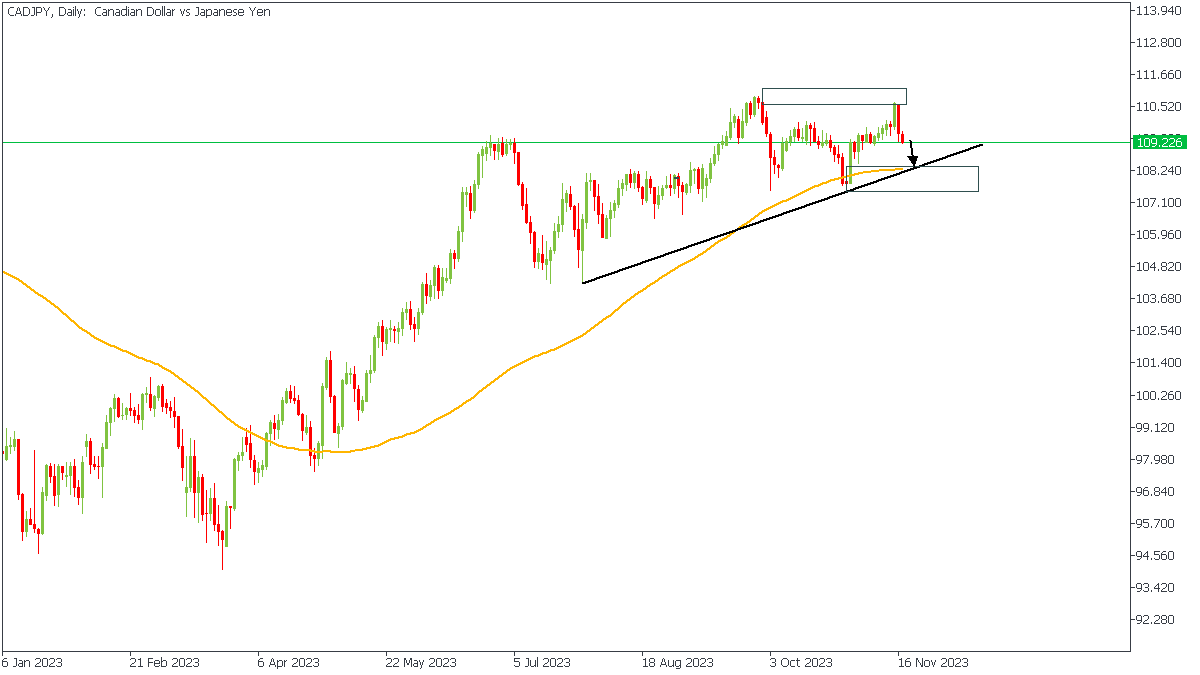
CADJPY - D1 Timeframe
CADJPY is, in my opinion, a no-brainer. On the chart, we can clearly see the supply zone price is currently being rejected from, as well as the demand zone price is likely heading towards. This makes it quite easy to decipher the market sentiment as being bearish.
Analyst’s Expectations:
- Direction: Bearish
- Target: 108.469
- Invalidation: 109.672
CONCLUSION
The trading of CFDs comes at a risk. To succeed, you have to manage risks properly. To avoid costly mistakes while you look to trade these opportunities, be sure to do your due diligence and manage your risk appropriately.
GBPJPY Recedes from New Highs
- GBPJPY starts a new brief bearish cycle after fresh highs
- Support at 185.60, but sellers need to drive deeper to change outlook
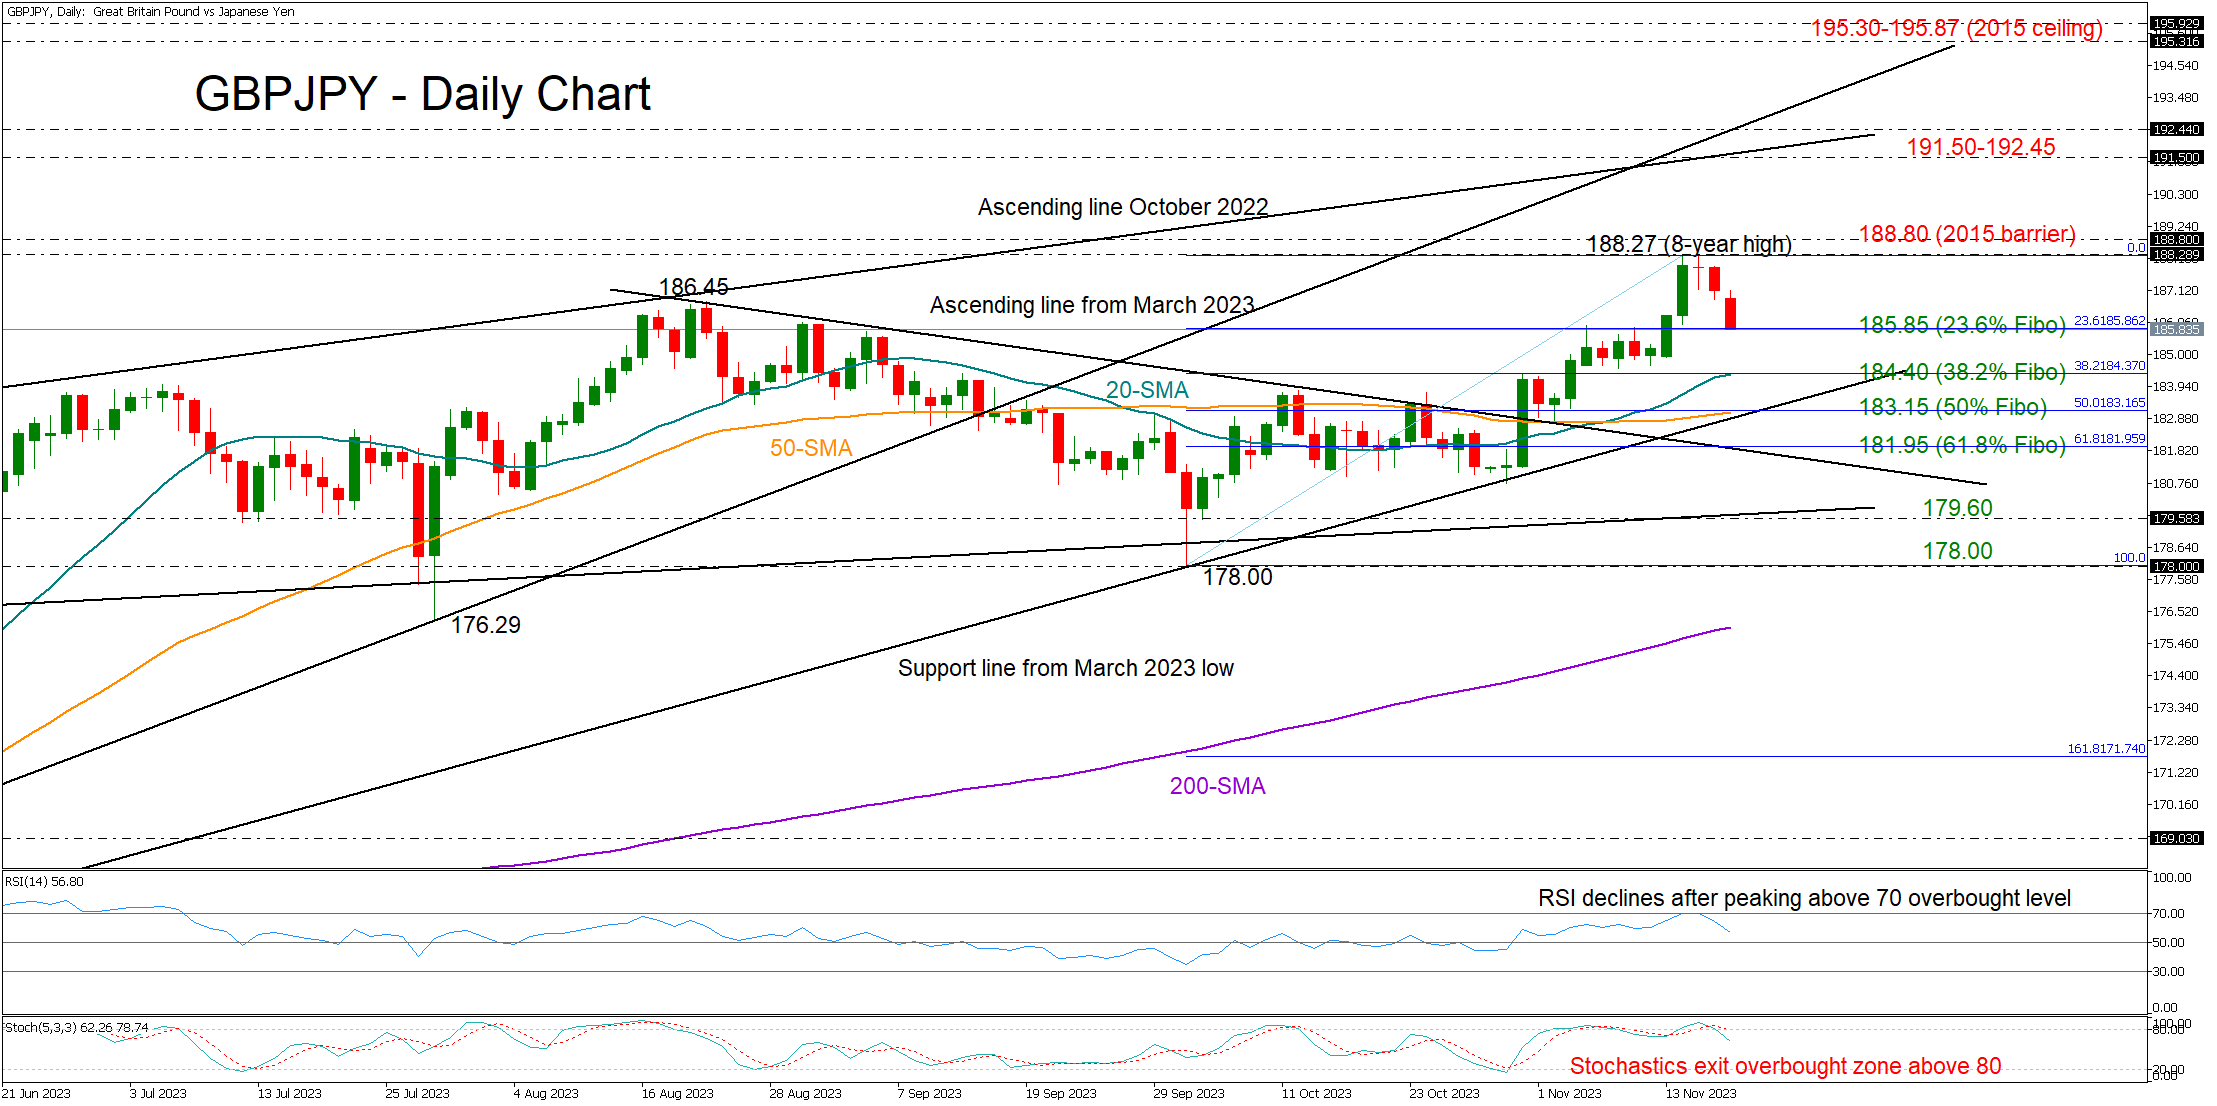
GBPJPY switched into corrective mode, erasing half of its weekly wins after almost approaching the November 15, 2015 peak of 188.80.
The doji candlestick, along with the negative reversals in the RSI and stochastic oscillator, indicate that the bears have an advantage in the short term.
A close below 185.60, where the 23.6% Fibonacci retracement of the latest upleg is placed, could extend the decline straight to the 20-day simple moving average (SMA) at 184.40. Then, the 181.95-183.15 trendline region, which encapsulates the 50-day SMA, might bring some stability before a potential downfall squeezes the price into the important 178.00-179.60 territory. A step lower from there would violate the broad positive trend, motivating more selling towards the 200-day SMA at 176.00.
In the opposite scenario, where the pair revives its uptrend above the key bar of 188.80, immediate resistance is expected to develop between the short-term ascending line from March 2023 and the long-term ascending line from October 2022, both seen within the 191.50-192.45 territory. A successful penetration higher might clear the way towards the 2015 ceiling of 195.30-195.87.
To sum up, the current pullback in GBPJPY could gain extra legs in the coming sessions, though any declines might not be worrisome and could be considered part of the broad uptrend unless the pair tumbles below 178.00.
GBP/USD Edges Lower on Soft UK Retail Sales
- UK retail sales decline unexpectedly
- GBP/USD edges lower
The British pound is trading lower on Friday. In the European session, GBP/USD is trading at 1.2381, down 0.27%.
The pound has shown sharp swings this week, notably a 1.78% jump on Tuesday after US inflation was weaker than expected, sending the US dollar sharply lower against the majors. The pound is up 1.28% this week.
UK retail sales decline
UK retail sales were expected to bounce back in October, after a revised decline of 1.1% m/m in September. Instead, retail sales declined by 0.3% m/m, missing the market consensus of 0.3%. This was the third decline in four months. Fuel sales were down and consumers are being more cautious in their spending. The wet weather has also dampened consumer spending.
On a yearly basis, retail sales slid by 2.7%, down from a revised 1.3% and much weaker than the market consensus of -1.5%. This marked a 19th straight decline, pointing to a dismal picture of consumer spending which could result in a contraction in fourth-quarter GDP.
Consumer confidence remains deeply pessimistic, as high interest rates and high inflation continue to batter consumers. Inflation has fallen to a two-year low of 4.6%, but consumers continue to see higher and higher prices, which has put a damper on consumer spending.
In the US, the latest economic data points to a gradual slowdown, as seen in this week’s inflation and retail sales prints. Thursday’s unemployment claims were further evidence of this trend, with claims rising to a three-month high at 231,000. US Treasury yields fell on Thursday to 4.45%, down from 4.53%, as speculation continues to rise that the Fed has ended or is very close to ending the current rate-tightening cycle. There are hopes for a soft landing for the US economy, as inflation is falling while growth remains strong, which is the so-called Goldilocks scenario.
GBP/USD Technical
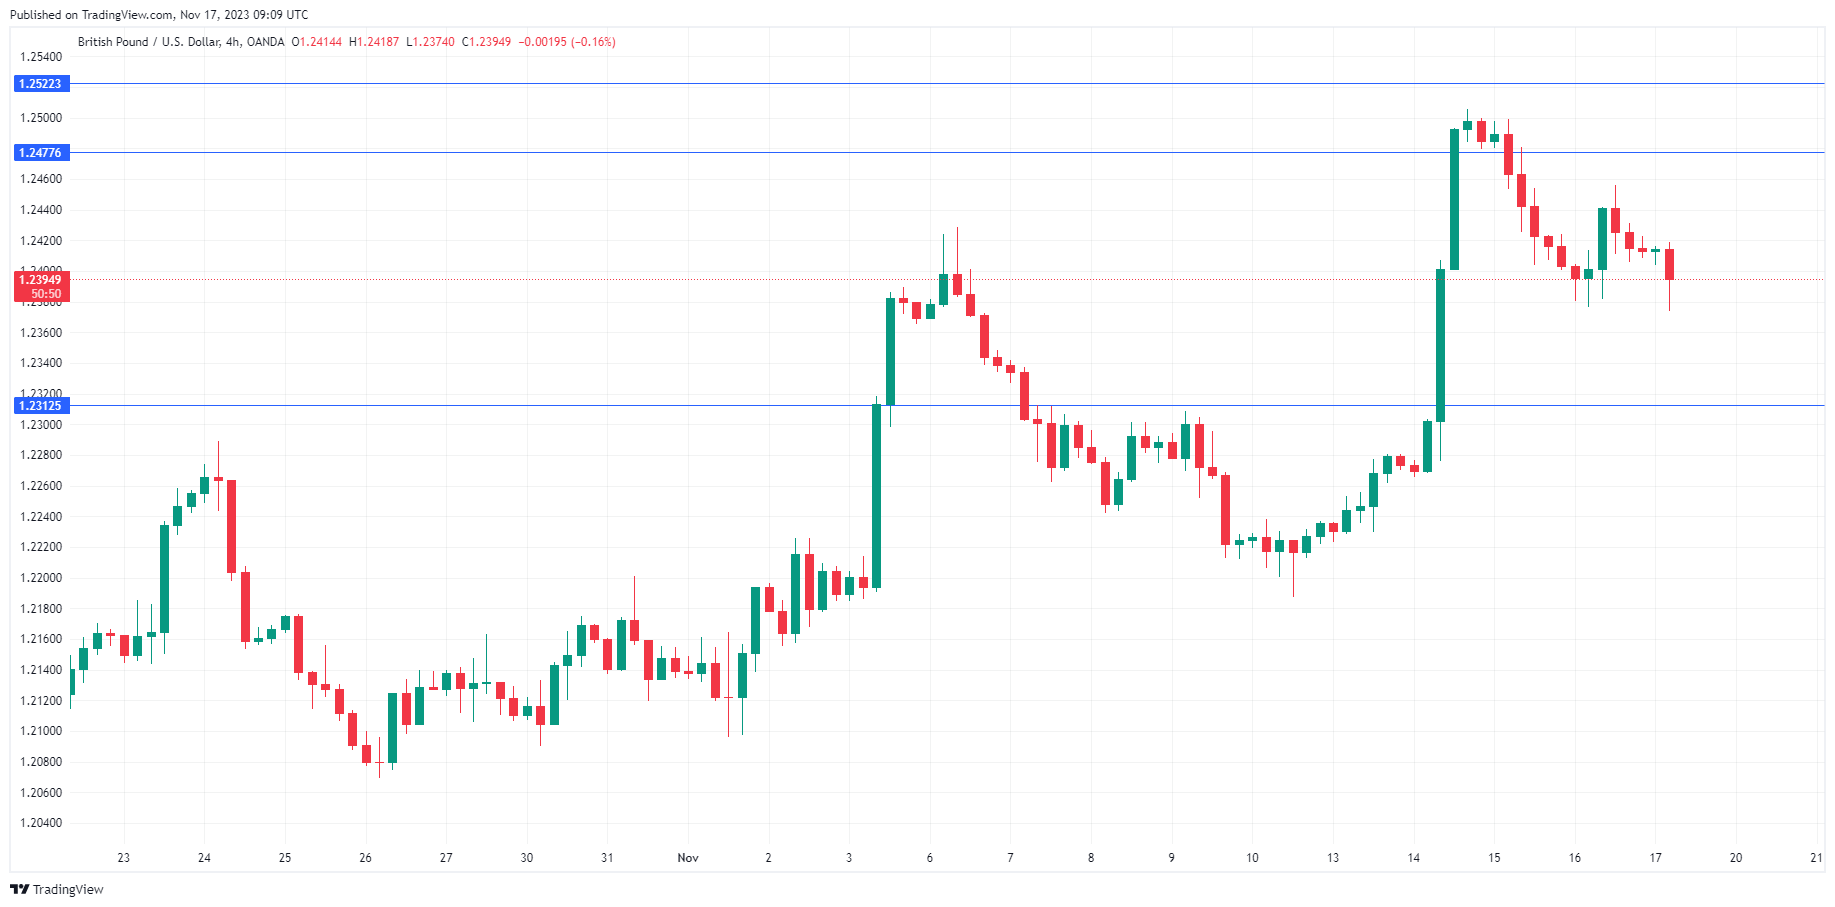
- GBP/USD is putting pressure on support at 1.2374. Below, there is support at 1.2312
- 1.2476 and 1.2522 are the next resistance lines
WTI Oil: Consolidation After 5.3% Fall on Thursday Likely to Precede Fresh Push Lower
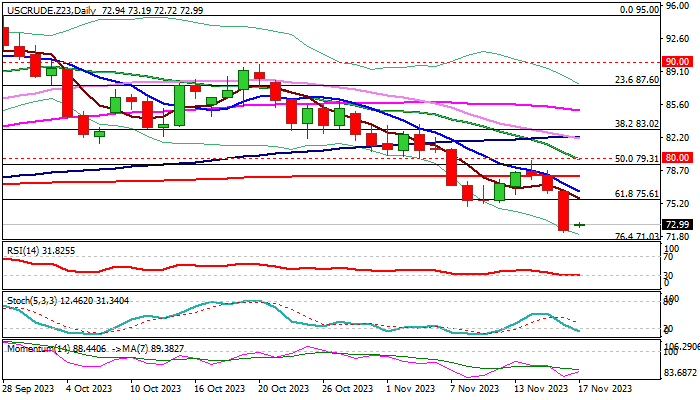
WTI oil is holding within a narrow consolidation in early Friday after falling 5.3% previous day (the biggest one-day drop since Oct 4), being under increased pressure from growing demand concerns and strong supply.
Short-term price action is holding in a downward trajectory and on track for the fourth consecutive week of losses, since fears of output disruption in the Middle East faded, while demand is weaker and supply grows above expectations, which resulted in strong rise in US crude inventories.
The latest acceleration pushed the price to the lowest in over four months and below the base of thick weekly Ichimoku cloud.
Close below weekly cloud to add to bearish signals and open way towards targets at $71.03 and $70.00 (Fibo 76.4% of $63.63/$95.00 / psychological).
Meanwhile, bears are likely to pause for consolidation as daily studies are oversold and partial profit-taking at the end of the week may keep bears on hold.
Former low of Nov 11 ($74.92) and broken Fibo 61.8% ($75.61) reverted to solid resistances which should ideally cap upticks to keep bears intact and offer better selling opportunities.
Caution on lift above falling 10DMA ($76.51) which would increase risk of attack at upper pivot at $78.08 (200DMA).
Res: 74.47; 74.92; 75.61; 76.51.
Sup: 72.16; 71.73; 71.03; 70.00.
Eurozone CPI finalized at 2.9% yoy in Oct, core at 4.2% yoy
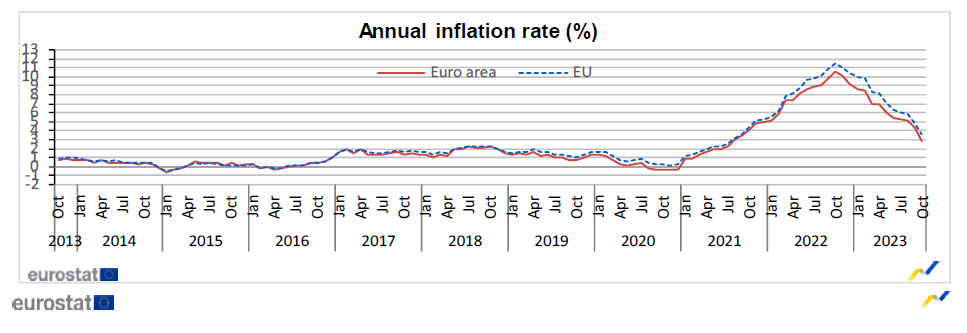
Eurozone CPI was finalized at 2.9% yoy in October, down from September's 4.3% yoy. CPI core (excluding energy, food, alcohol & tobacco) was finalized at 4.2% yoy, down from previous reading of 4.5% yoy. The highest contribution came from services (+1.97%), followed by food, alcohol & tobacco (+1.48%), non-energy industrial goods (+0.90%) and energy (-1.45%).
EU CPI was finalized at 3.6% yoy, down from prior month's 4.9% yoy. The lowest annual rates were registered in Belgium (-1.7%), the Netherlands (-1.0%) and Denmark (-0.4%). The highest annual rates were recorded in Hungary (9.6%), Czechia (9.5%) and Romania (8.3%). Compared with September, annual inflation fell in twenty-two Member States and rose in five.
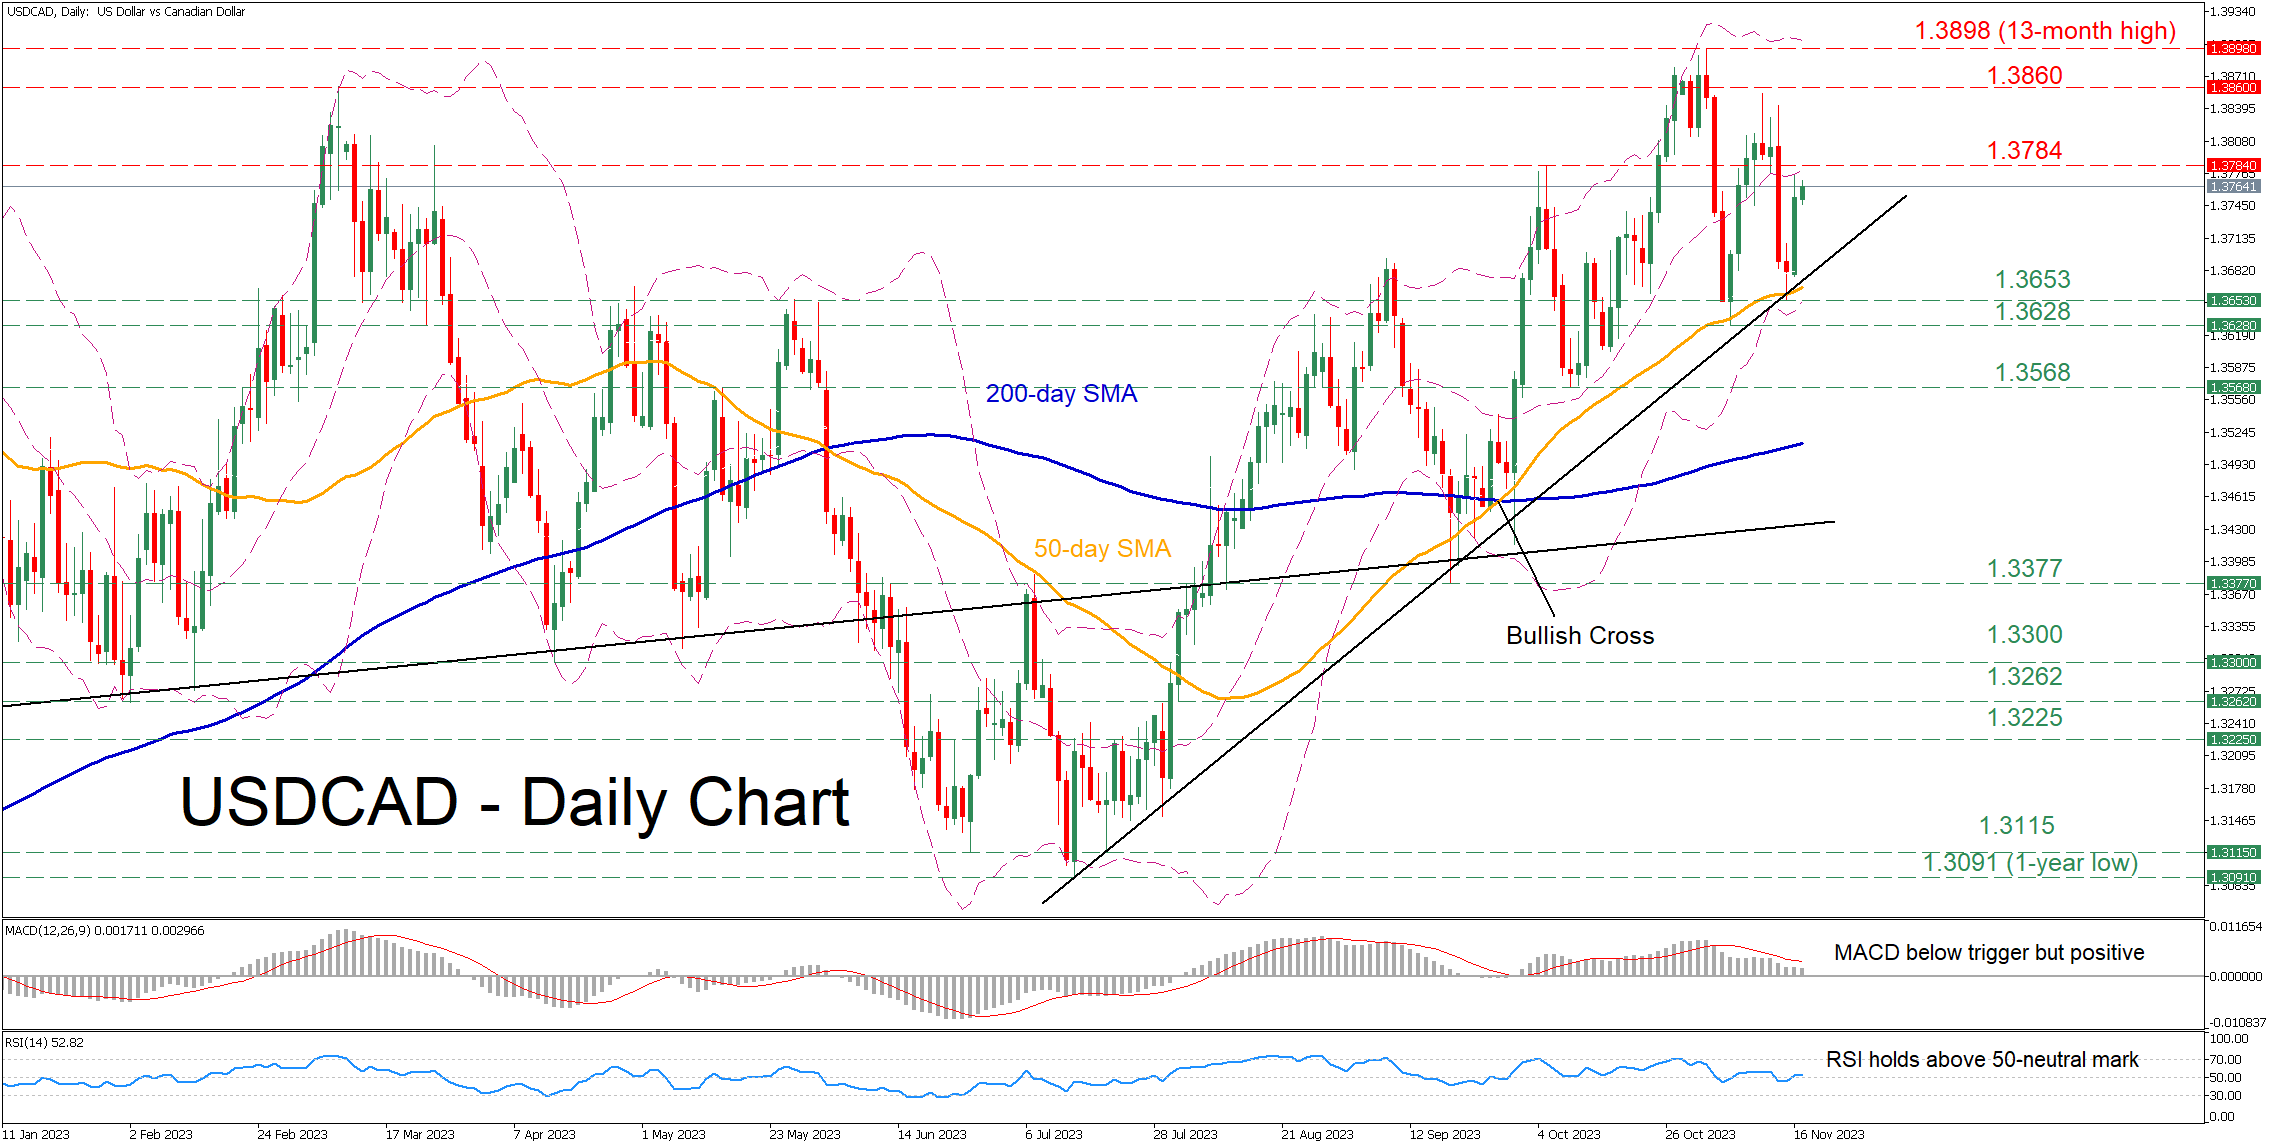
USDCAD Bounces Off 50-day SMA
- USDCAD experienced a setback, falling below the 1.3800 handle
- But quickly found its feet at the 50-day SMA and recouped some losses
- Momentum indicators suggest a cautiously bullish tone
USDCAD had been in a steady advance since July, posting a fresh 13-month peak of 1.3898 on November 2. Since then, the pair has experienced two rounds of weakness, but both attempted declines got curbed by the ascending 50-day simple moving average (SMA).
Given that the momentum indicators are tilted to the upside, the bulls could initially attack the October resistance of 1.3784. A violation of that zone could trigger an advance towards the March peak of 1.3860. Failing to halt there, the price could revisit its 2023 peak of 1.3898, which is also a 13-month high.
On the flipside, should the price reverse lower, the recent support of 1.3653, which overlaps with the 50-day SMA, could act as the first line of defense. Sliding beneath that floor, the pair could test the November bottom of 1.3628. Further retreats could then cease at the October low of 1.3568.
In brief, USDCAD has been experiencing some volatile moves lately, which is also evident by the widening Bollinger bands. However, the bullish medium-term structure of higher lows remains intact as the 50-day SMA has repeatedly repelled any declines.
Easing U.S. Inflation Pushes Gold Higher
Gold rose above 1,980 on Thursday, having a weekly rise of over 2%, boosted by declining inflation and indications of diminishing economic growth in the U.S. These factors have supported market beliefs that the Federal Reserve has completed its rate hiking cycle.
Possible effects for traders
This week's data revealed that the U.S. Consumer Price Index remained unchanged in October, with the core rate rising below the forecast only by 0.2%. Additionally, Producer Price Index figures dropped to their lowest in three and a half years. Finally, U.S. Jobless Claims figures were higher than expected. The data proves the Federal Reserve's inflation containment efforts to be effective. Thus, market participants don't expect more rate increases from the U.S. central bank. Investors believe that the rate hiking cycle has ended, and the opportunity cost for gold, a non-yielding asset, has decreased.
XAUUSD was relatively flat during the Asian and early European trading sessions. Market participants now focus on the upcoming U.S. Building Permits report at 1:30 p.m. UTC. Lower-than-expected figures may push the gold price towards 2,000. However, XAUUSD may correct downwards if the numbers are higher than expected. 'Spot gold may break a resistance at $1,989 per ounce and rise into a range of 1,999–2,003, driven by a wave 3' said Reuters analyst Wang Tao.
Hawkish BOE Policy May Support the British pound
The British pound (GBP) declined by 0.1% on Thursday, even though U.S. Jobless Claims figures were higher than expected.
Possible effects for traders
On Thursday, the U.S. Dollar Index (DXY) declined slightly, weakened by the higher-than-anticipated weekly U.S. Jobless Claims. Also, the market believes the Federal Reserve (Fed) will be more dovish with the monetary policy from now on, so the U.S. dollar is declining. Expectations of interest rate cuts by the U.S. central bank favour the British pound, as rate futures suggest that the Fed may begin to cut rates sooner than the Bank of England (BOE). The BOE's Deputy Governor, Dave Ramsden, said yesterday that the U.K. monetary policy must remain restrictive for a prolonged duration.
During the early European trading session, GBPUSD declined as the U.K. Retail Sales figures came out lower than anticipated. Today, traders should focus on the upcoming U.S. Building Permits report at 1:30 p.m. UTC. If the figures exceed expectations, GBPUSD may drop below 1.23400. Contrarily, lower-than-expected Building Permits numbers could sustain the current short-term upward trend in GBPUSD.