Sample Category Title
GBP/JPY Daily Outlook
Daily Pivots: (S1) 181.66; (P) 182.70; (R1) 183.35; More...
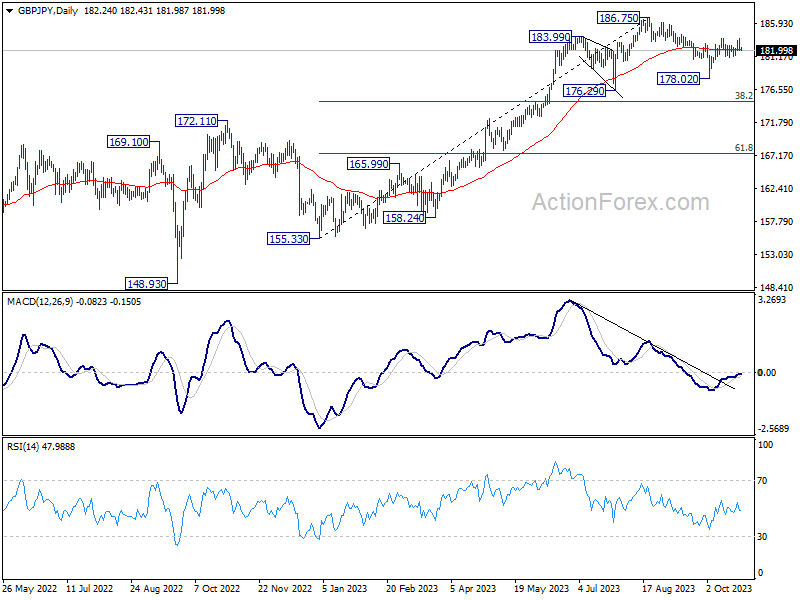
Intraday bias in GBP/JPY remains neutral as range trading continues. With 181.00 support intact, further rise is in favor. The favored case is still that correction from 186.75 has completed at 178.02. Above 183.79 will resume the rise from 178.02 to retest 186.75 high. However, break of 181.00 will dampen this view, and turn bias back to the downside for 178.02 instead.
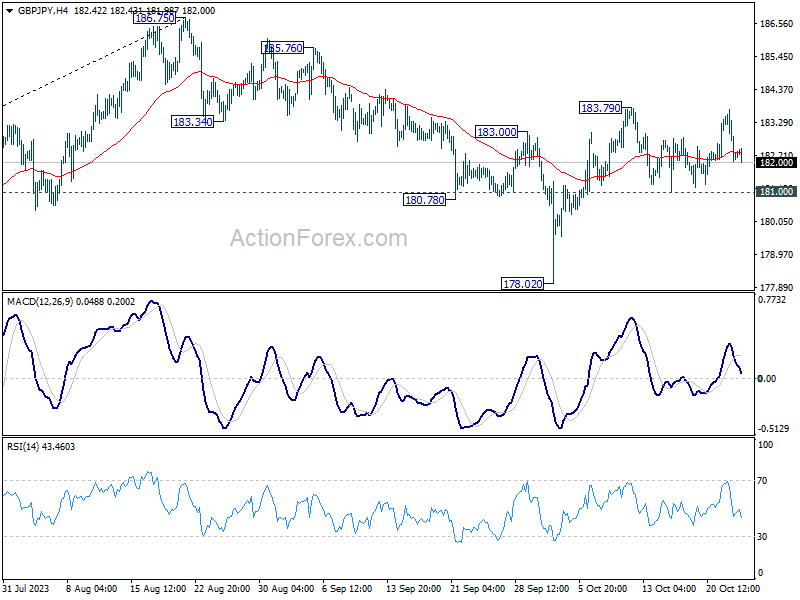
In the bigger picture, fall from 186.75 is seen as a corrective move only. As long as 176.29 support holds, larger up trend from 123.94 (202 low) should still be in progress. Break of 186.75 will target 195.86 (2015 high). Nevertheless, firm break of 176.29 will confirm medium term topping, and bring lengthier and deeper consolidations.
EUR/CHF Daily Outlook
Daily Pivots: (S1) 0.9438; (P) 0.9477; (R1) 0.9497; More...
Intraday bias in EUR/CHF remains neutral and outlook stays bearish with 0.9532 resistance intact. On the downside, decisive break of 0.9407 medium term bottom will confirm resumption of larger down trend. Next near term target will be 100% projection of 0.9840 to 0.9520 from 0.9691 at 0.9499, and then 161.8% projection at 0.9179. However, firm break of 0.9532 will confirm short term bottoming, and turn bias to the upside for 0.9691 resistance instead.
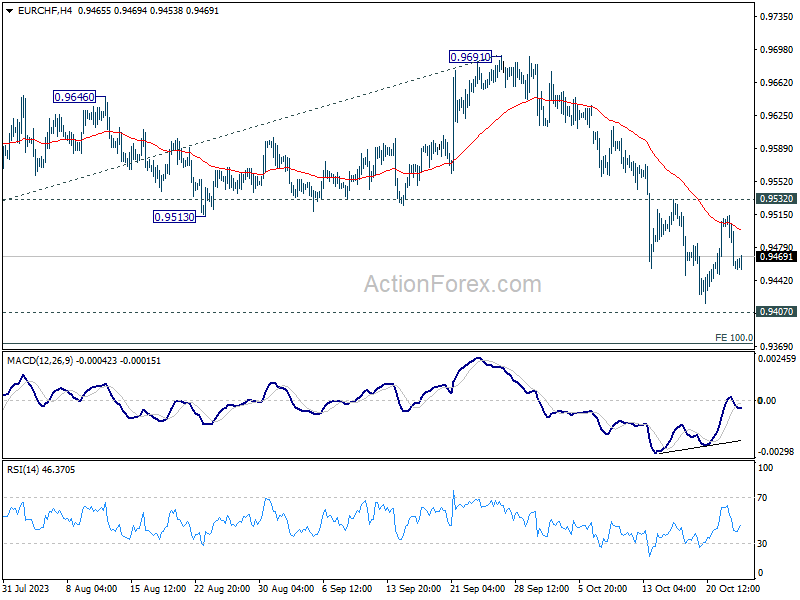
In the bigger picture, down trend from 1.2004 (2018 high) is still in progress. Decisive break of 0.9407 will confirm resumption, and target 61.8% projection of 1.1149 to 0.9407 from 1.0095 at 0.9018. On the upside, break of 0.9691 resistance is needed to be the first sign of medium term bottoming. Otherwise, outlook will stay bearish.
NZDUSD Rallies But All Eyes on Momentum Indicators
- NZDUSD is in the green again today, a tad above a key level
- Bearish pressure lingers as NZDUSD traded at a 1-year low
- Momentum indicators could soon turn bullish
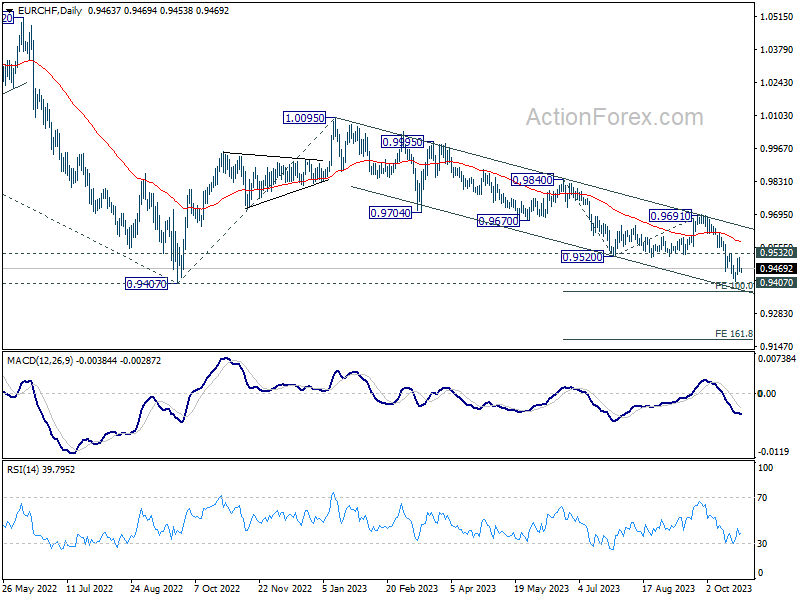
NZDUSD is edging higher today, recording its third consecutive green candle but trading only a tad above the key 0.5813 level. The bears remain in control of the market as the latest downleg, from the October 11 local peak, pushed NZDUSD to the lowest level since November 4, 2022.
Understandably, the focus is now on the momentum indicators for any indications for the next leg in NZDUSD. More specifically, the Average Directional Movement Index (ADX) points to a weakening bearish trend in the market, and the RSI remains a tad below its 50-midpoint. More importantly, the stochastic oscillator is trying to edge above its moving average and exit its oversold territory. Should this take place, the current muted upleg could gain significant traction.
If the bulls feel more confident, they could try to overcome the 23.6% Fibonacci retracement of the April 5, 2022 – October 13, 2022 downtrend at 0.5870, and then push NZDUSD towards the busier 0.5920-0.5924 region. This area is key for short-term sentiment and, if broken, it could open the door for a stronger move towards the 0.6044-0.6092 range.
On the flip side, the bears are probably taking a breather and are preparing for the next sell-off. The support set by the October 6, 2022 high at 0.5813 remains considerable, as proven last week. A successful break below this level would allow the bears to record a new 2023 low and then set sail for the October 13, 2022 low at 0.5511.
To sum up, NZDUSD bulls are trying to defend the 0.5813 level and stage a move towards 0.5920, but they need strong support from the momentum indicators to fend off the bears.
USD Downside Well Protected Going into ECB
Markets
Disappointing and weak EMU October PMI’s contrasted with slightly better (and 50+) readings in the US. European data already cement the case for a technical European recession in the second half of this year with the domestic services sector feeling more and more pain. On top, they were accompanied by the ECB’s lending survey pointing to weaker loan demand and tighter credit standards. The dismal PMI added fuel to the bond fire ignited by Monday’s Ackman tweet (hedge fund closing short US 30-yr bond trade in light of huge uncertainty and absolute yield levels). However, the likes of the Bund eventually closed well off the intraday peak levels. Changes on the German yield curve ranged between 1.7 bps (30-yr) and 5.5 bps (5-yr) with the belly of the curve outperforming the wings. Those changes are almost completely result of gapping open lower, catching up with Monday’s WS moves though. Changes on the US yield curve varied between +6.4 bps and -6.1 bps. The front end underperformed after US PMI’s while the (very) long end rallied into the close together with stock markets. Main US indices “recovered” 0.5% to 1%.
This week’s action on the USD-market deserves some special attention. On Monday, the greenback got whacked by the US Treasury rally, with the trade weighted dollar falling from 106.20 to a new October low around 105.40. The mirror image in EUR/USD was a rise from 1.0580 to nearly 1.07. Yesterday it was back to square one though on the back of those diverging PMI’s with both DXY and EUR/USD completely retracing Monday’s steps. To us, it suggests that the USD downside is well protected going into ECB (Thursday) and Fed (next Wednesday) policy meetings. We see a fair chance that the ECB meeting will produce a dovish skip, while the Fed will end up with a hawkish skip. Unless of course the ECB already introduces additional liquidity-draining measures but we expect those by December at the earliest (ending PEPP reinvestments).
Asian risk sentiment is bullish this morning with South Korea underperforming. China raised its fiscal deficit ratio to about 3.8% of GDP (from 3% target set in March), suggesting more room for fiscal stimulus. More sovereign debt will be issued to support disaster relief and construction. An unexpected central bank visit by president Xi Jinping is also considered as giving a head’s up to a growth supportive policy. Today’s eco calendar is uneventful, making room for more technical and sentiment-driven trading ahead of the ECB meeting.
News and views
The Hungarian central bank lowered the base rate from 13% to 12.25% yesterday. The 75 bps cut was bigger than expected but was justified by the fact that the real policy rate now moved into positive territory after a steep 4.2 ppt drop in September inflation to 12.2%. Core inflation still stands at 13.1% but the three-month annualized change, which is considered a better gauge in the current situation, fell to levels last seen before Covid-19 below 4%. Annual inflation is expected to reach 7-8% by the end of the year, turning real rates more positive and therefore restrictive. Given the poor economic outlook, the MNB plans to further lower the base rate. If the MNB’s inflation expectations materialize and assuming it wants to retain a positive real rate, it could go ahead with the 75 bps pace or, in theory, press the gas even faster. In practice however, the Hungarian forint is critical input to setting the easing speed. The currency gave a cautious sign of approval with EUR/HUF finishing at 383.24 from 381.71. HUF swap yields dropped more than 20 bps at the front end of the curve.
Australian Q3 inflation topped expectations. Q/Q price pressures accelerated from 0.8% to 1.2%. Disinflation still continued in the yearly readings, dropping from 6% in Q2 to 5.4% (vs 5.3% anticipated). Two closely watched core gauges printed at 1.2 and 1.3% Q/Q with Y/Y figures both coming in at 5.2%. “The most significant contributors to the rise in the September quarter were automotive fuel (+7.2%), rents (+2.2%), new dwellings purchased by owner occupiers (+1.3%) and electricity (+4.2%)”, the Australian Bureau of Statistics reported. The numbers come after fresh RBA governor Bullock warned that the central bank won’t hesitate to hike again if the inflation outlook would be raised markedly. Money markets attach a 60% probability to another rate increase (to 4.35%) at the Nov 7 meeting.
PMIs Signal Growth Divergence Between Euro Area and US
Market movers today
Data calendar for today is almost empty for main markets, only German IFO index for October due.
In Sweden, September PPI index will be released.
Otherwise, we continue to keep a close eye on developments in Middle East before we tune in for the ECB meeting on Thursday.
The 60 second overview
Markets: Equities halted a five-day decline as improved earnings reports and a calmer bond market spurred broad gains. The S&P 500 saw a 0.7% increase, with nearly every sector rising, while the tech-centric Nasdaq Composite gained 0.9%. The 10-year Treasury yield, which had surged to a 16-year high of over 5% on Monday, retraced to around 4.84%. European equities closed higher with STOXX600 rising 0.4%, despite the release of a gloomy report on the euro area economy. Elsewhere, EUR/USD ticked lower to 1.06 on the relatively stronger US PMI data. Oil prices ended lower for a third consecutive session as traders continued to monitor the conflict in the Middle East. Markets in Asia are mostly higher this morning as China has once again stepped up stimulus measures. European futures are higher while US futures are mixed with tech-heavy indices lower, driven by late hour earnings disappointments.
Euro area: Monetary policy tightening may be materialising in the euro area after yesterday's weaker-than-expected PMI figures. The economic deterioration seems to be broad-based with both the manufacturing and service sector declining. The composite index stood at 46.5 (cons.: 47.4, prior: 47.2). The rate sensitive manufacturing sector declined for the seventh consecutive month to 43.0 (cons.: 43.7, prior: 43.4), while the service sector fell to 47.8 (cons.: 48.6, prior: 48.7). Overall, the euro area October PMIs signal that economy continued to cool in Q4, which is what the ECB wants, as both activity and prices fell thereby confirming the 'soft landing narrative'. The labour market also cooled with the manufacturing sector recording the largest employment declines in three years while service sector employment almost stagnated. The risk for the soft-landing narrative is still that activity suddenly declines too fast. Currently, this risk is mainly present in the manufacturing sector that continues to be weaker than expected. New orders fell in both sectors, which signals further downside risks ahead. Hence, the economy is still cooling, but the continued weak manufacturing sector could quickly make the slowdown too fast for ECB's comfort.
US: In the US, PMI composite recorded a reading of 51 (cons.: 50.0, prior: 50.2). Both manufacturing and services PMIs exceeded expectations. Manufacturing PMI reached 50 (cons.: 49.5, prior: 49.8), marking its highest level since April. Services PMI showed improvement as well, rising to 50.9 (cons.: 49.9, prior: 50.1). Overall, another upside surprise in US macro data, adding broad support to the USD. Details showed easing services sector price pressures and employment indices ticking modestly lower, which suggest easing price pressures, pointing to less need for Fed tightening.
UK: UK preliminary PMIs for October were slightly better than expected. Composite higher at 48.6 (cons: 48.5, prior: 48.5). Momentum in service sector continues to fade in line with the past months' releases with September at 49.2 (cons: 49.3, prior: 49.3). Input price inflation meanwhile slowed for the third consecutive month in October and was the lowest since early 2021 and cost pressures overall seem to moderate. All indices remain below 50 and overall point to an increasingly gloomy growth outlook despite the slight upside surprise.
Equities: Global equities were higher yesterday, as yields were lower. The biggest drop in US yields was on Monday but still influenced cash equity trading on Tuesday. Macro data was not at all impressive and hence the bad-news-good-news for equities also still vibrant. It was not a massive rotation story yesterday since energy was the only outlier as oil prices lost a couple of percentage points. Earnings numbers were mixed yesterday both during trading hours and after the close of US cash trading. In US yesterday, Dow +0.6%, S&P 500 +0.7%, Nasdaq +0.9% and Russell 2000 +0.8%.
FI: Yesterday, European bonds partly caught up with the rally in US Treasuries late Monday. The quite significant yield declines seen in the morning were supported by the Eurozone PMIs coming out weaker than expected in October, and the Q3 ECB Bank Lending Survey showing renewed tightening of credit conditions among banks. The bond market rally lost some steam in the afternoon, though Bund yields ended the day 5bp lower across the curve. Long UST yields fell marginally throughout the day, while the short end of the curve rose following the surprisingly strong US PMI figures in the afternoon.
FX: After the almost one-figure increase in EUR/USD on the back of declining US yields, the cross declined to around the 1.06 mark yesterday. USD/JPY continues to trade just short of 150. EUR/GBP remains steady slightly above the 0.87 mark. The pressure on Scandies continued with EUR/SEK increasing above 11.75 and EUR/NOK surpassing 11.80.
Credit: Yesterday we saw a continuation of more supportive risk sentiment in the credit markets. Itraxx main tightened 1.6bp to 85.4bp while Xover tightened 8.5bp to 455bp. In spite of the strength in synthetic indices we continue to register weakness in cash bonds where the amount of sellers out-number the buyers, and where investors continue to fear negative fall-outs from the combination of high rates and the risk of a gloomy macro-economy in most jurisdictions.
Technical Outlook and Review
DXY:
The DXY chart currently maintains a bearish overall momentum, suggesting the potential for a bearish continuation towards the 1st support level.
The 1st support at 105.38 is considered significant as it aligns with an overlap support level, indicating its potential importance as a substantial area of price support. Additionally, there is an intermediate support at 106.02, which is identified as a pullback support. This further reinforces the notion of potential support in this region and may act as a key level where buyers could step in to counter further downward movement.
On the resistance side, the 1st resistance at 106.72 is characterized as a swing high resistance level, signifying a potential barrier to upward price movements. Beyond this, the 2nd resistance at 107.37 is also marked as a swing high resistance, emphasizing the presence of resistance zones that could impede any upward price advances.

EUR/USD:
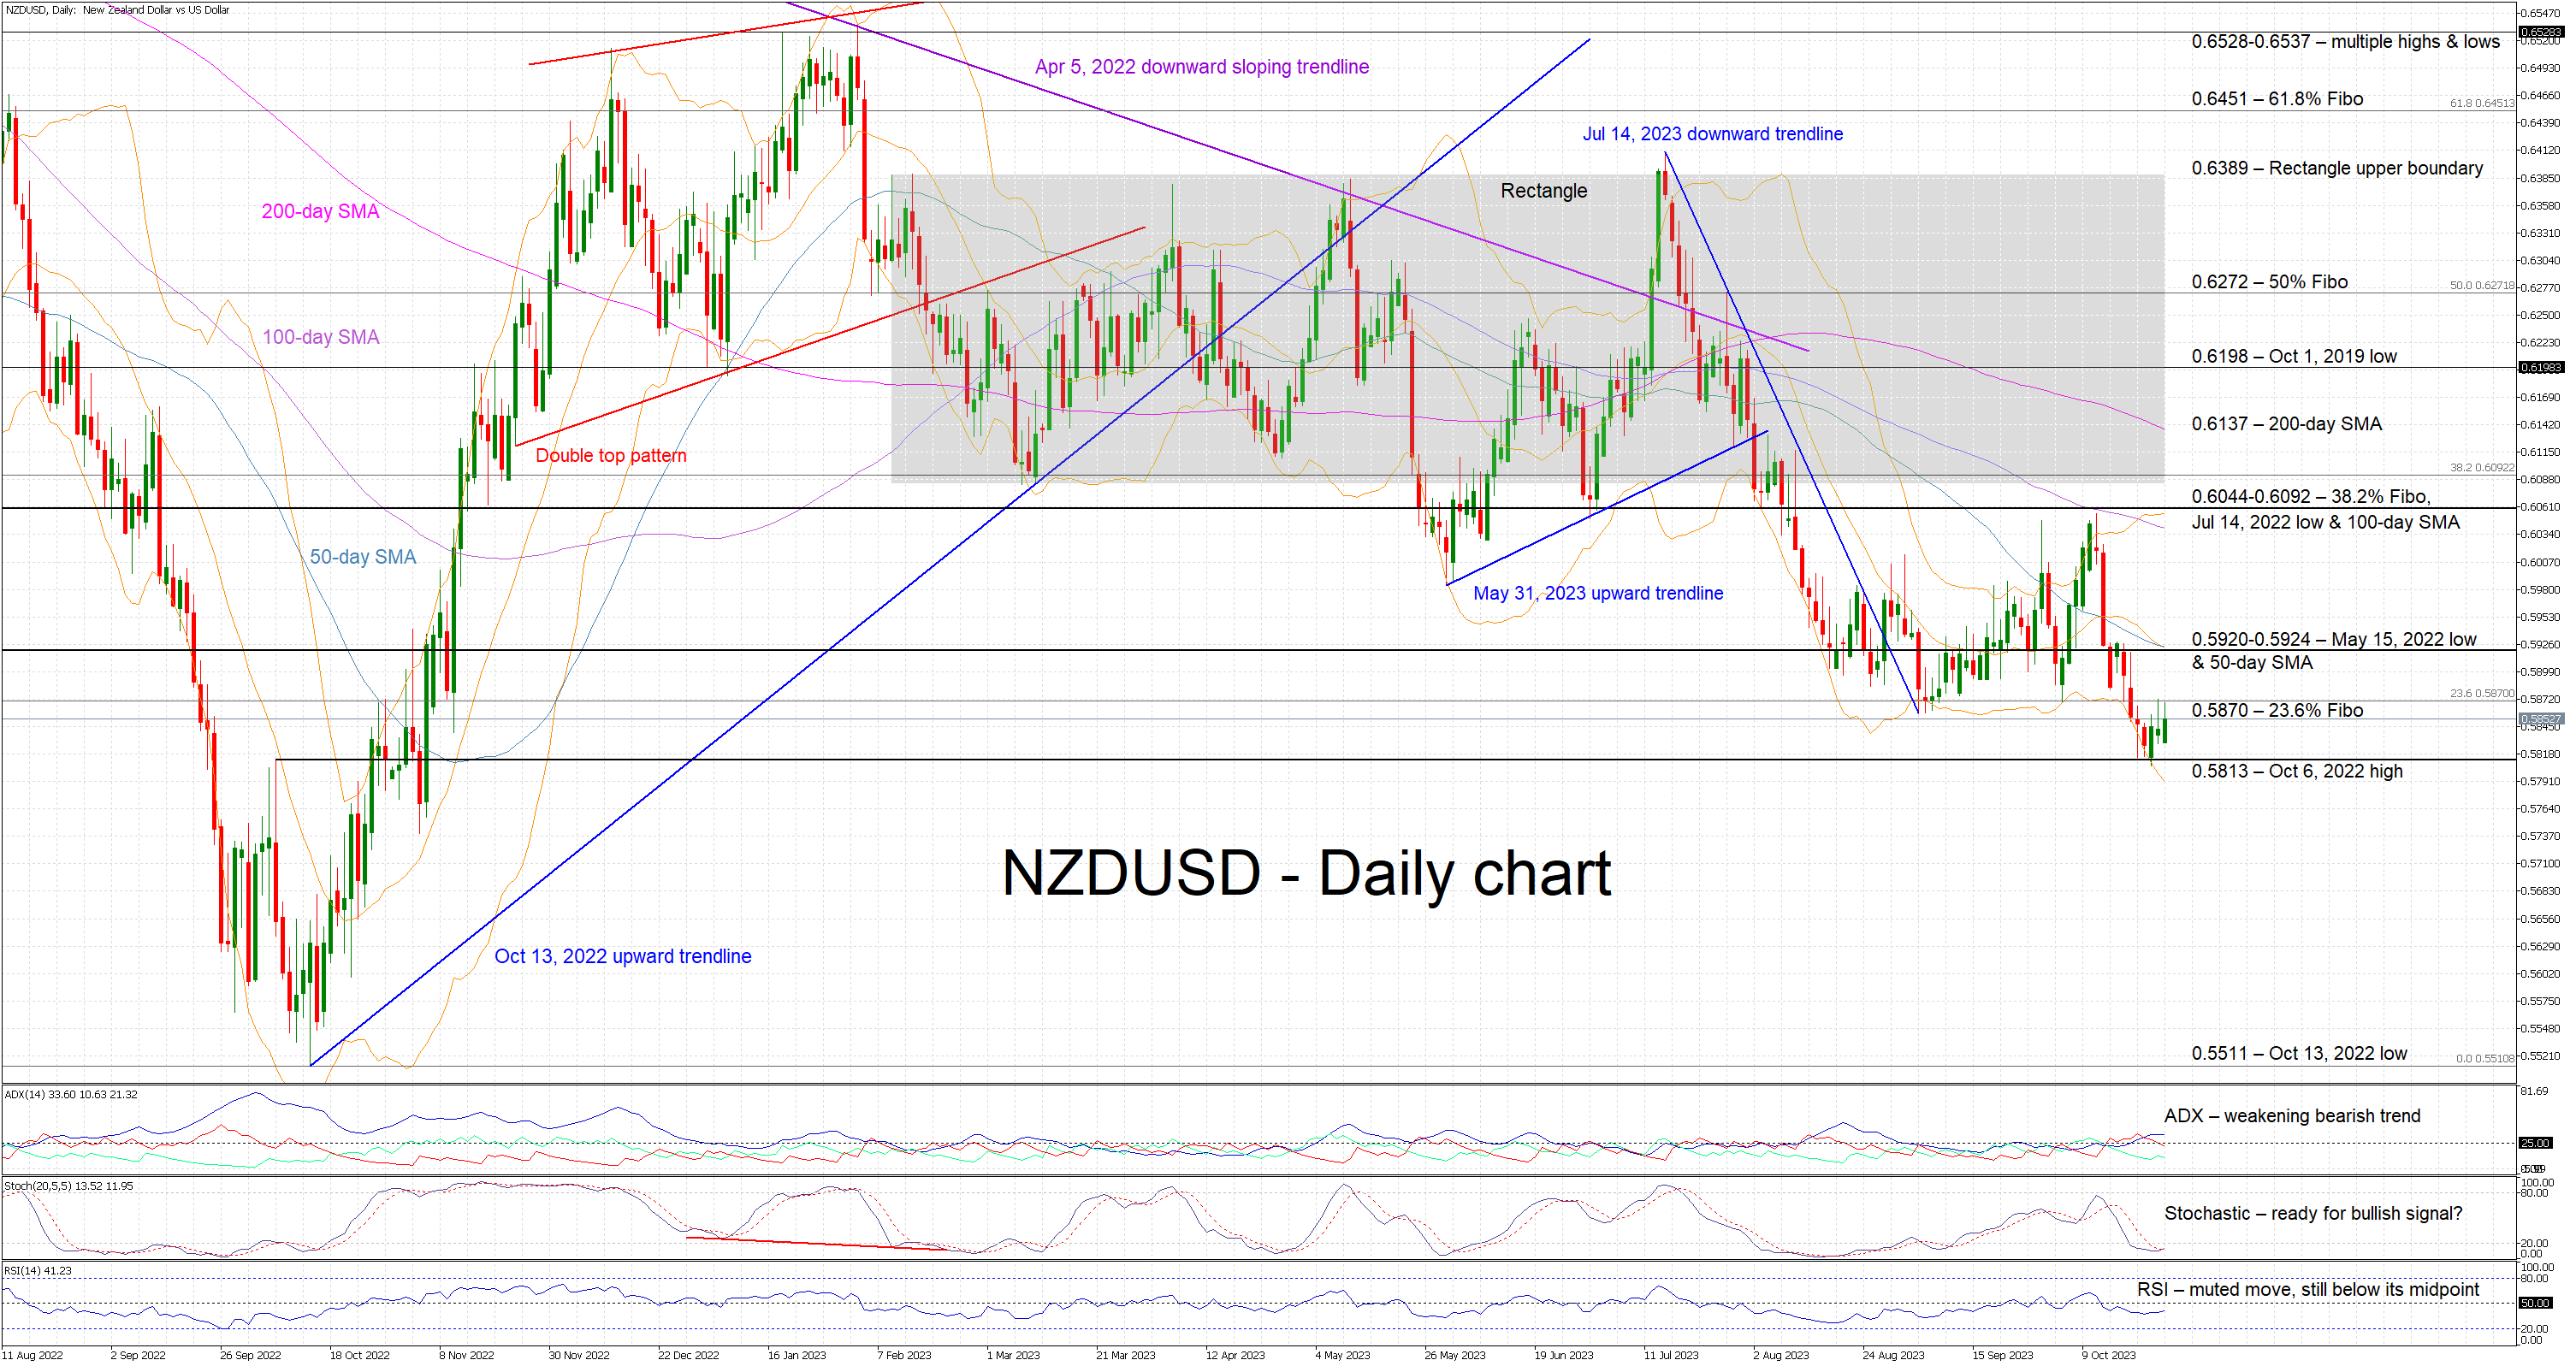
The EUR/USD chart currently exhibits a bullish overall momentum, indicating the potential scenario of a bullish continuation towards the 1st resistance level.
The 1st support at 1.0492 is considered significant as it aligns with a swing low support level, suggesting a potential area of price support. Additionally, there is a level at 1.0580 where traders are waiting for downside confirmation, and it’s identified as an overlap support. This level may serve as a key reference point for potential reversals.
On the resistance side, the 1st resistance at 1.0680 is characterized as a swing high resistance level, indicating a potential barrier to further upward price movements. Additionally, there is an intermediate resistance at 1.0635, marked as an overlap resistance, which could further impede upward price advances.
EUR/JPY:
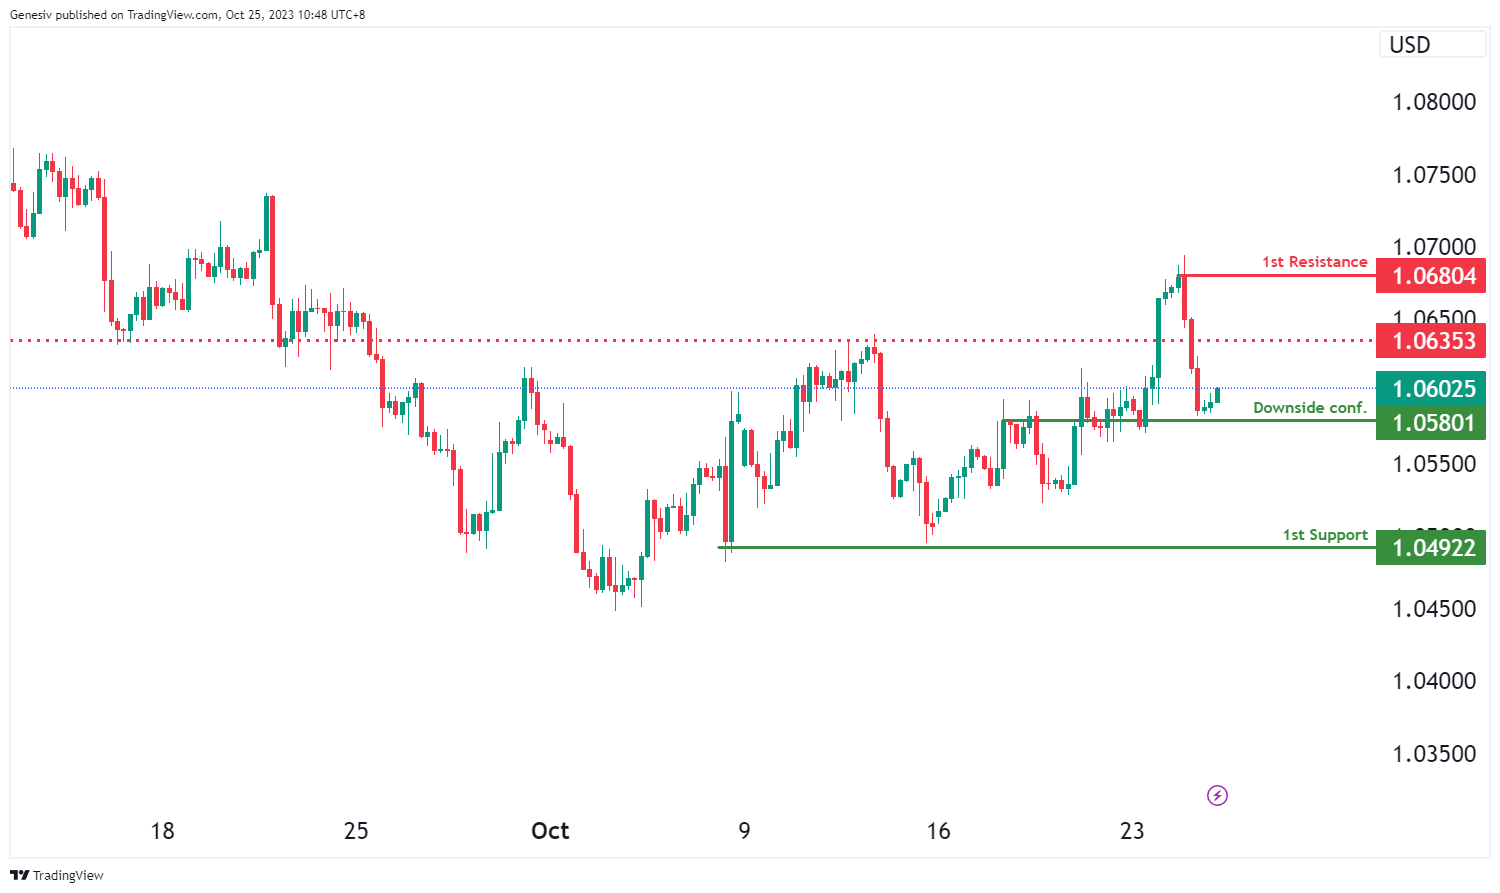
The EUR/JPY chart is exhibiting a weak bullish momentum with price making a bullish reaction off the 1st support level to rise towards the 1st resistance level.
The 1st support level at 158.51 is identified as an overlap support that aligns with the 50.00% Fibonacci retracement level. Further below, the 2nd support level at 157.65 is marked a pullback support that aligns with the 78.60% Fibonacci retracement level.
On the resistance side, the 1st resistance level at 159.78 is identified as a pullback resistance. The 2nd resistance level at 160.31 is identified as a level that aligns with the 61.80% Fibonacci projection level.
EUR/GBP:
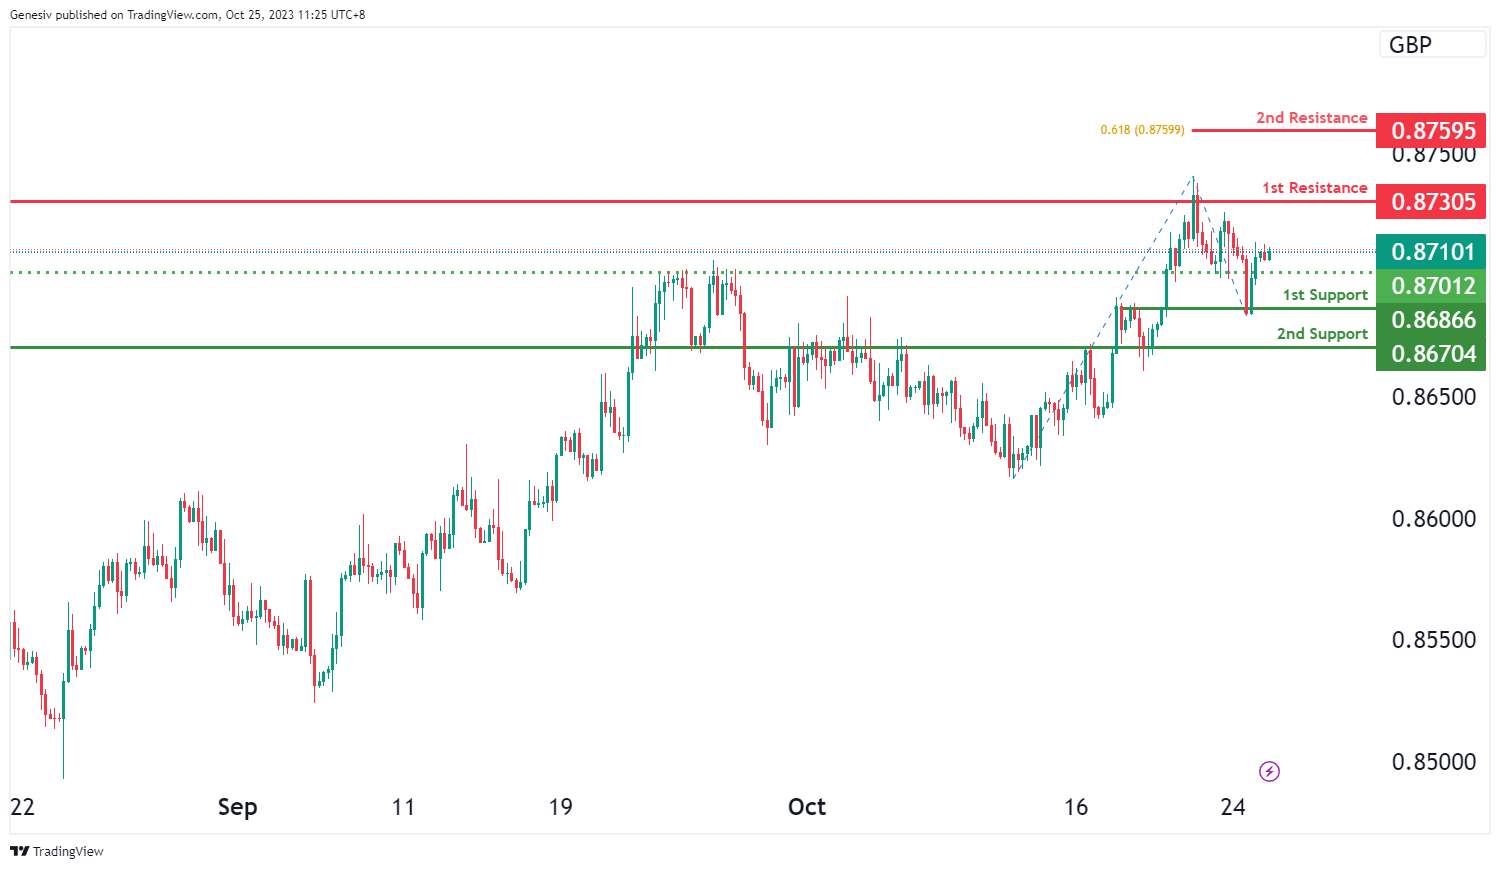
The EUR/GBP chart is exhibiting a bullish momentum with price making a bullish continuation towards the 1st resistance level.
The 1st resistance level at 0.8731 is identified as an overlap resistance. Higher up, the 2nd resistance level at 0.8759 is identified as a level that aligns with the 61.80% Fibonacci projection level.
To the downside, the intermediate support level at 0.8701 is identified as an overlap support while the 1st support level at 0.8687 is also marked as an overlap support. Further below, the 2nd support level at 0.8670 is identified as an overlap support.
GBP/USD:
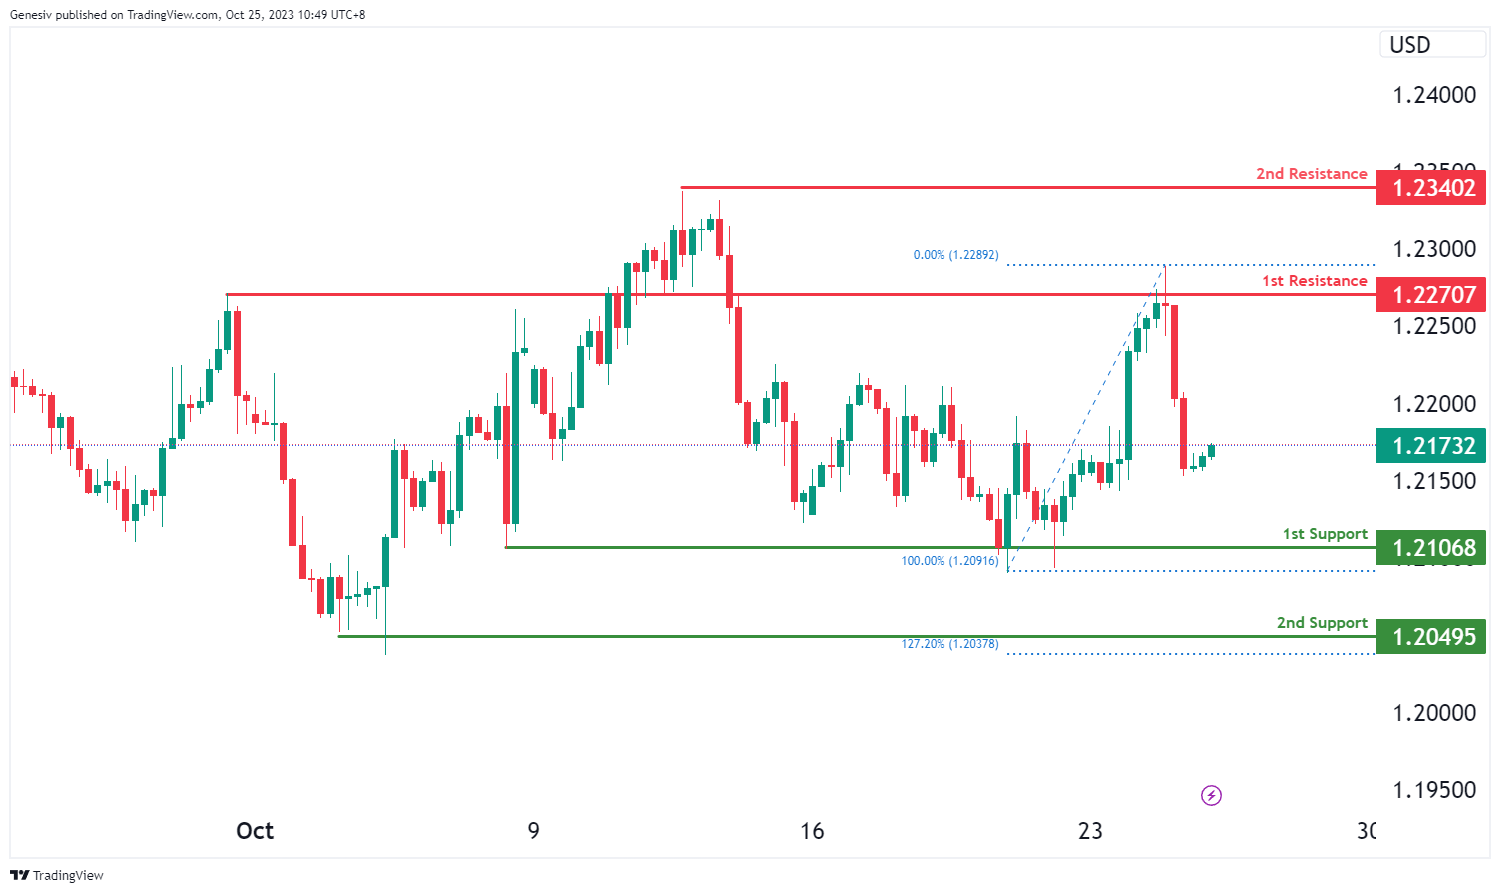
The GBP/USD chart currently exhibits bearish overall momentum, suggesting the potential for a bearish continuation towards the 1st support level.
The 1st support at 1.2106 is considered significant as it aligns with a multi-swing low support level, indicating a potential area of price support. Additionally, the 2nd support at 1.2049 is identified as another multi-swing low support, and it coincides with the 127.20% Fibonacci Extension level, which adds to its significance as a potential strong support level.
On the resistance side, the 1st resistance at 1.2270 is characterized as an overlap resistance level, which could pose as a barrier to further upward price movements. Furthermore, the 2nd resistance at 1.2340 is marked as a swing high resistance, indicating another potential level where the price may face resistance.
GBP/JPY:
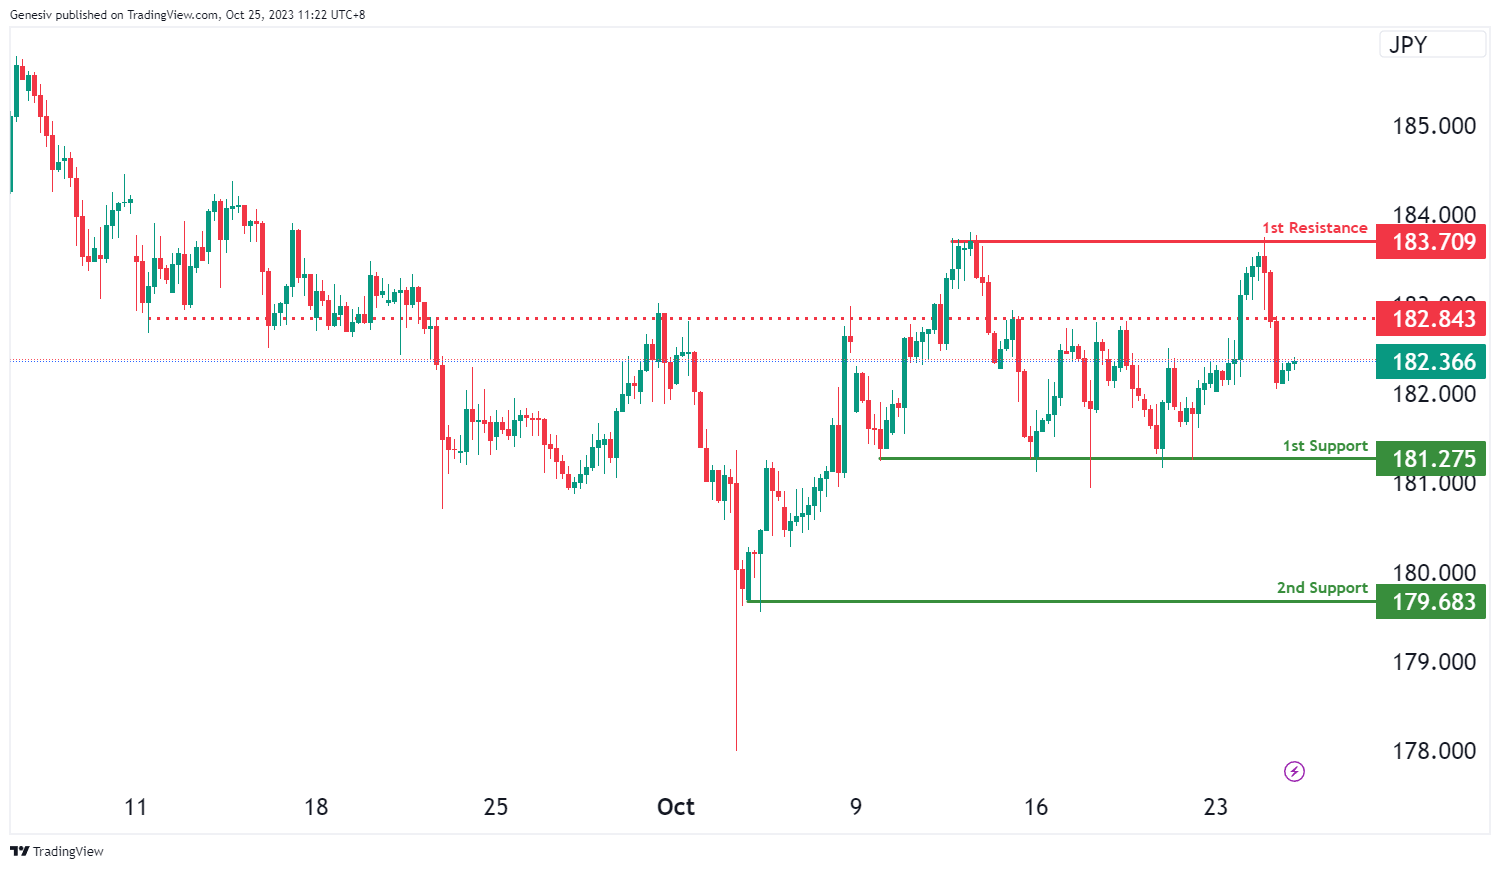
The GBP/JPY chart currently exhibits a neutral momentum with price potentially fluctuating between the 1st resistance and the 1st support levels.
The 1st support level at 181.28 is identified as a pullback support. Further below, the 2nd support level at 179.68 is marked as a swing-low support.
On the resistance side, the intermediate resistance level at 182.84 is identified as an overlap resistance. Higher up, the 1st resistance level at 183.71 is noted as a pullback resistance.
USD/CHF:
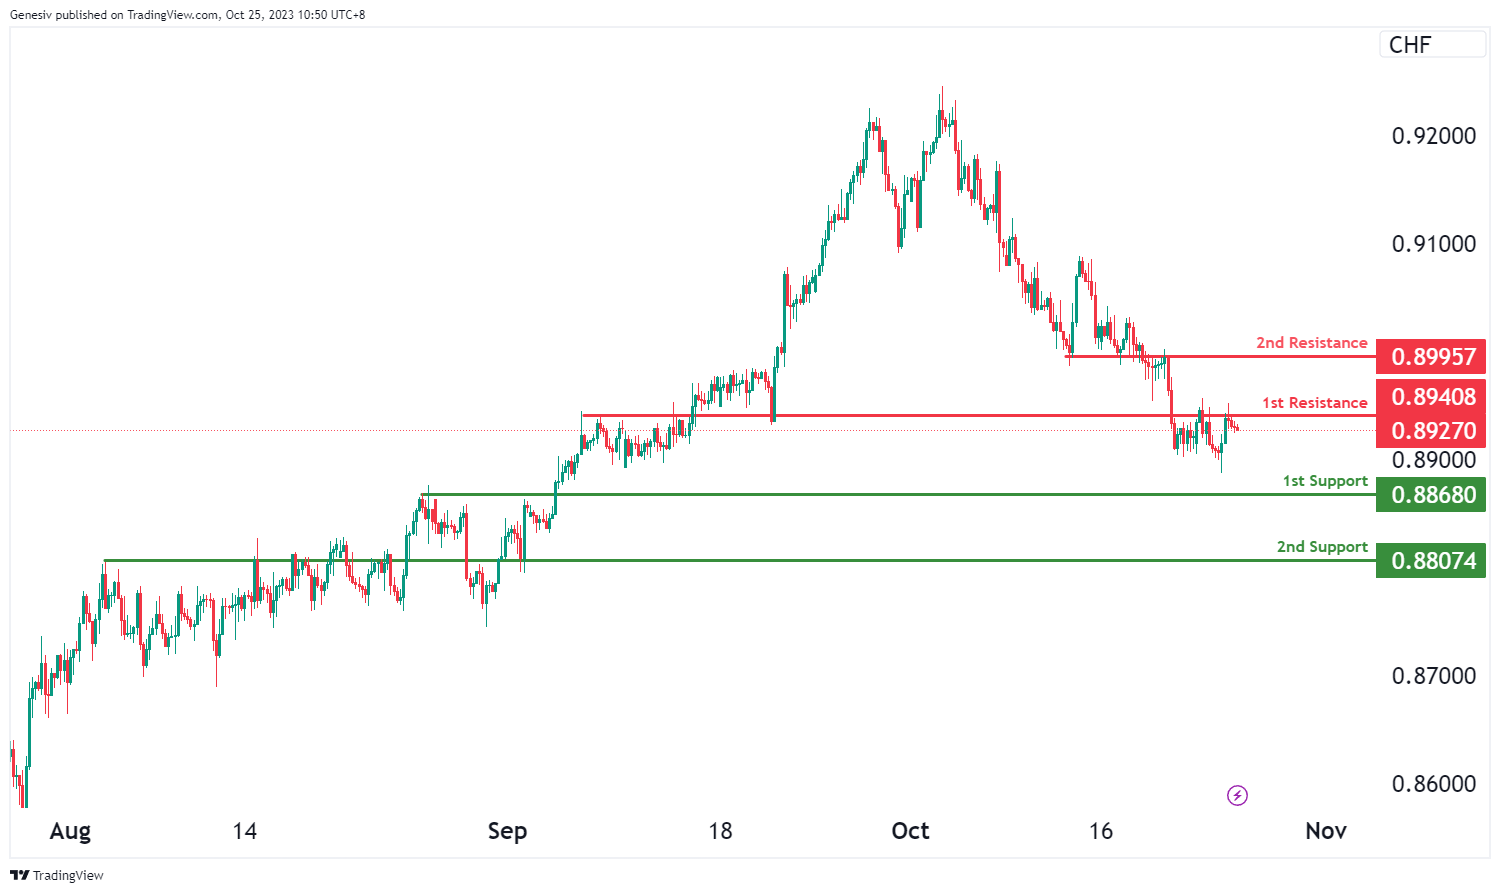
The USD/CHF chart currently exhibits bearish overall momentum, indicating the potential for a bearish continuation towards the 1st support level.
The 1st support at 0.8868 is considered significant as it aligns with a pullback support level, suggesting it could act as a potential area of price support. Additionally, the 2nd support at 0.8807 is identified as an overlap support, further reinforcing the potential for it to provide strong support to the price.
On the resistance side, the 1st resistance at 0.8940 is characterized as an overlap resistance level, which could serve as a barrier to any significant upward price movement. Furthermore, the 2nd resistance at 0.8995 is also marked as an overlap resistance, indicating another potential level where the price may face resistance.
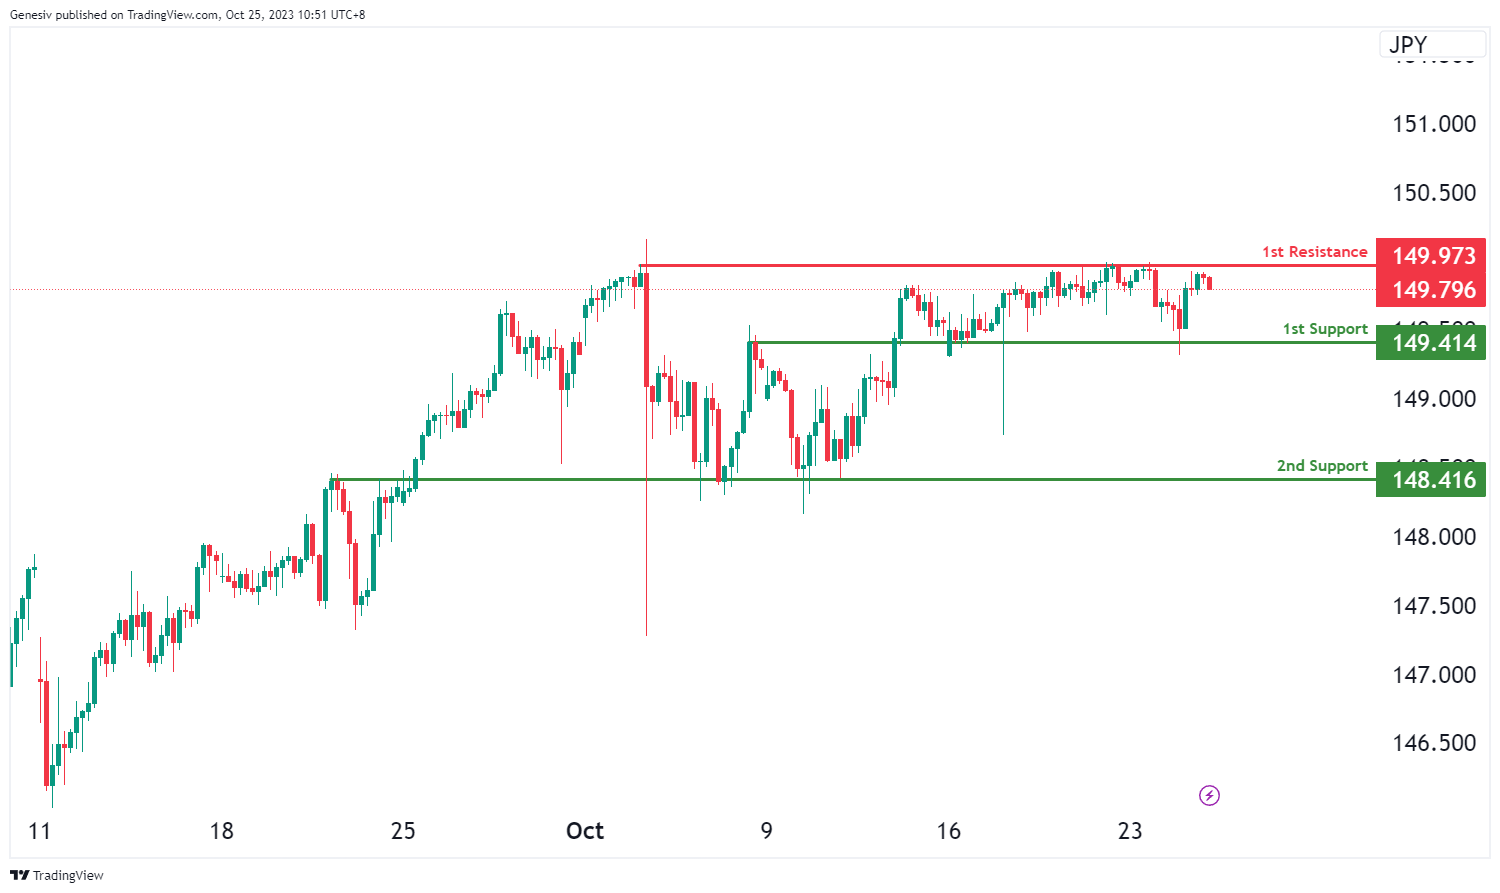
USD/JPY:
The USD/JPY chart currently exhibits a bearish overall momentum, indicating the potential for a bearish continuation towards the 1st support level.
The 1st support at 149.41 is considered significant as it aligns with an overlap support level, suggesting it could act as a potential area of price support. Additionally, the 2nd support at 148.41 is also identified as an overlap support, further reinforcing the potential for it to provide strong support to the price.
On the resistance side, the 1st resistance at 149.97 is characterized as a multi-swing high resistance level, indicating a potential barrier to any significant upward price movement.
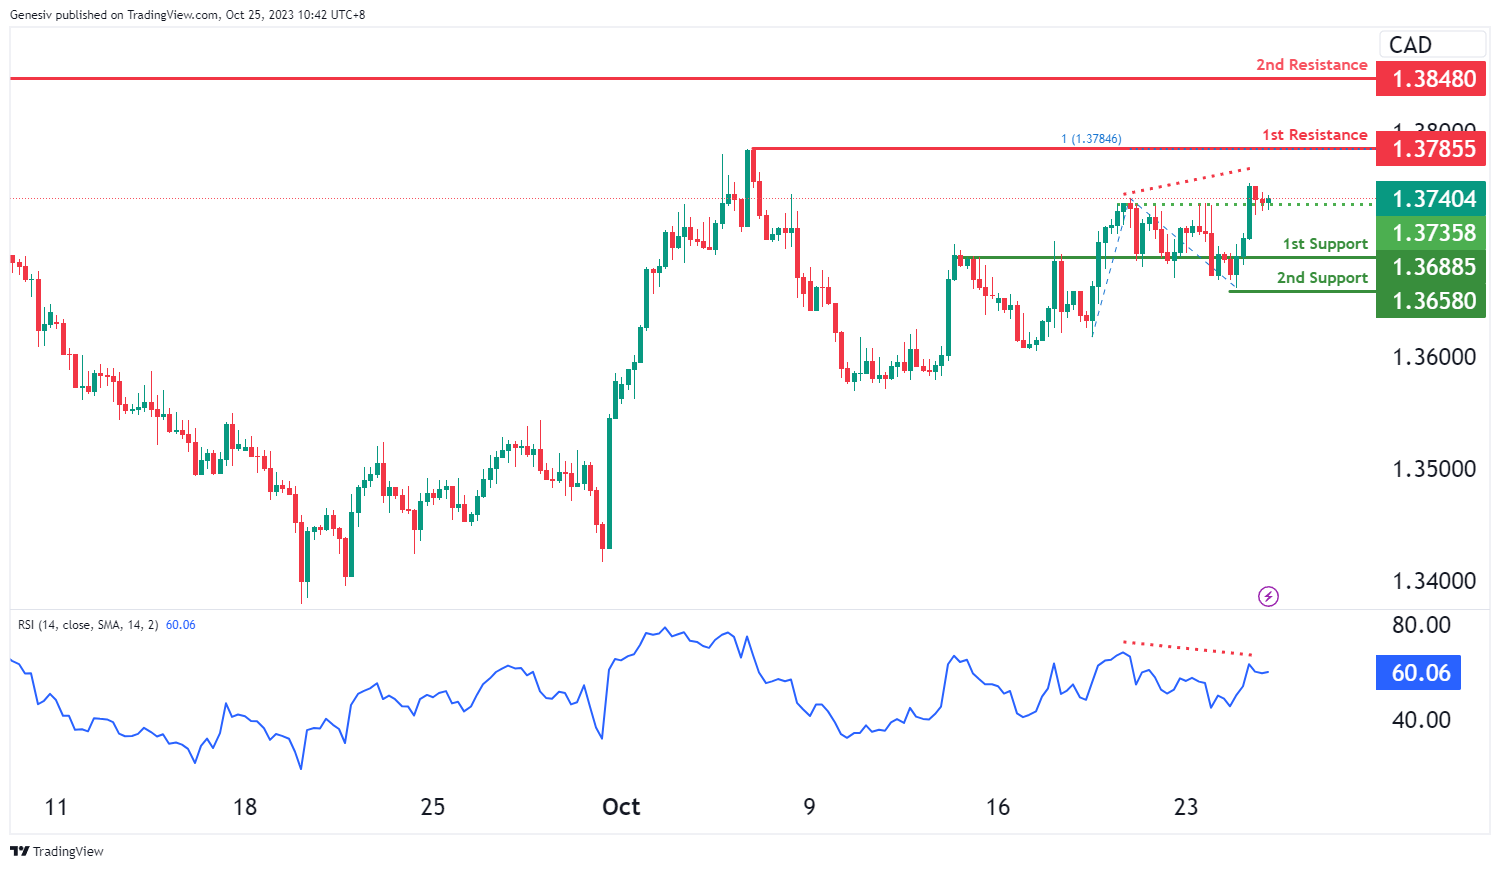
USD/CAD:
The USD/CAD chart currently exhibits an overall bullish momentum. However, the Relative Strength Index (RSI) is displaying bearish divergence versus price, indicating the likelihood of a bearish move towards the 1st support level, especially if price breaks below the intermediate support.
The intermediate support level at 1.3736 is identified as an overlap support while the 1st support level at 1.3689 is also marked as an overlap support. Further below, the 2nd support level at 1.3658 is noted as a pullback support, potentially acting as a strong support zone.
To the upside, the 1st resistance level at 1.3786 is identified as a swing-high resistance that aligns with the 100.00% Fibonacci projection level. Higher up, the 2nd resistance level at 1.848 is also marked as a swing-high resistance, potentially acting as a barrier to further bullish advances.
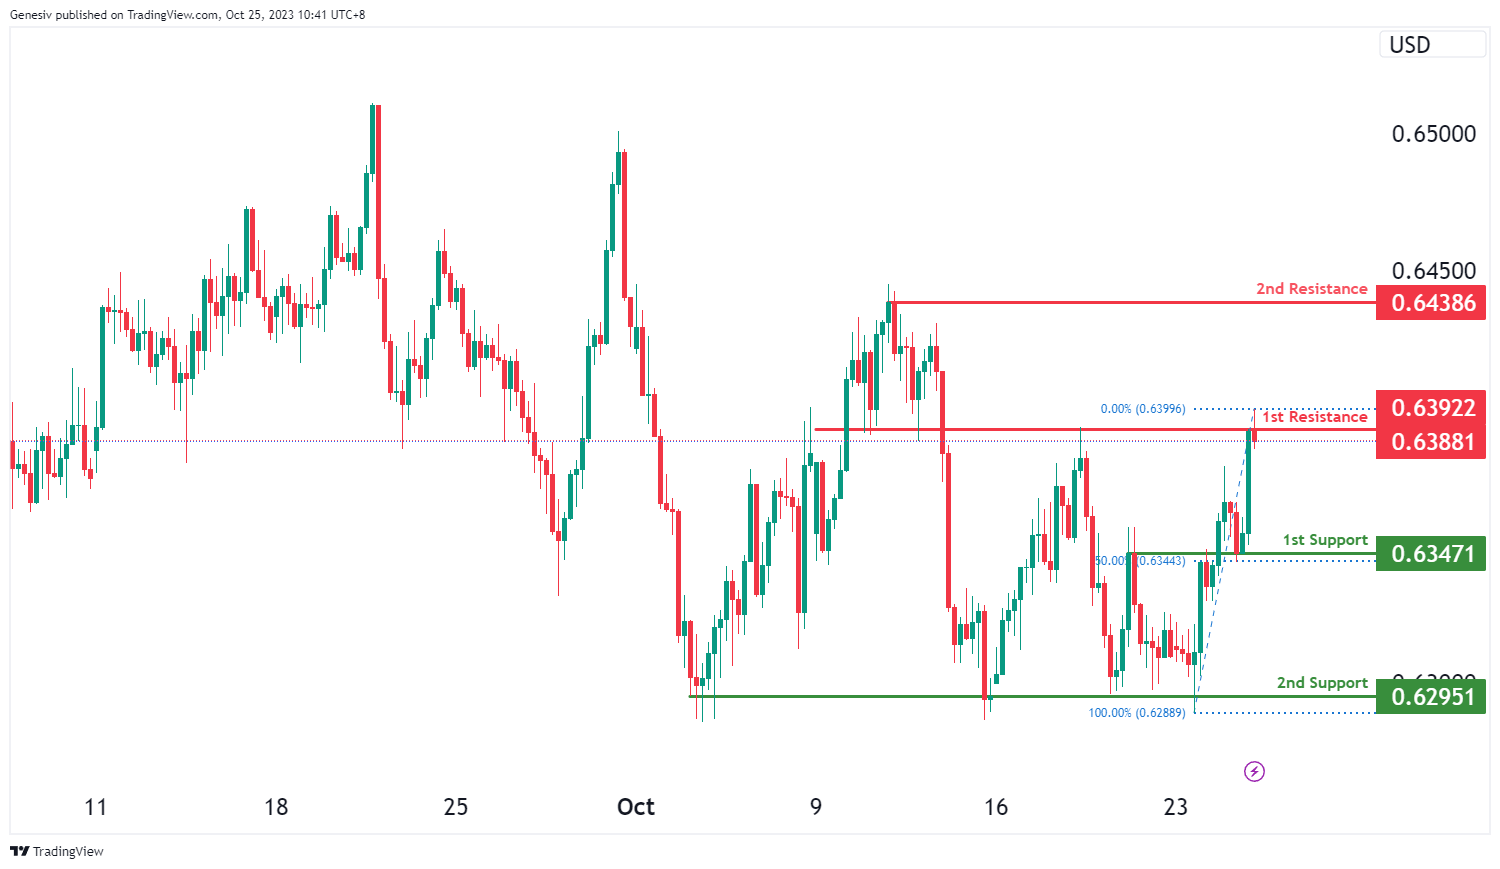
AUD/USD:
The AUD/USD chart currently exhibits a neutral momentum with price potentially making a bearish reaction off the 1st resistance level to drop lower towards the 1st support level.
The 1st resistance level at 0.6392 is identified as an overlap resistance. Higher up, the 2nd resistance level at 0.6439 is marked as a swing-high resistance, making it a potentially strong resistance level.
To the downside the 1st support level at 0.6347 is identified as an overlap support that aligns with the 50.00% Fibonacci retracement level. Additionally, the 2nd support level at 0.6295 is noted as a multi-swing-low support, further reinforcing its importance as a potential support area.
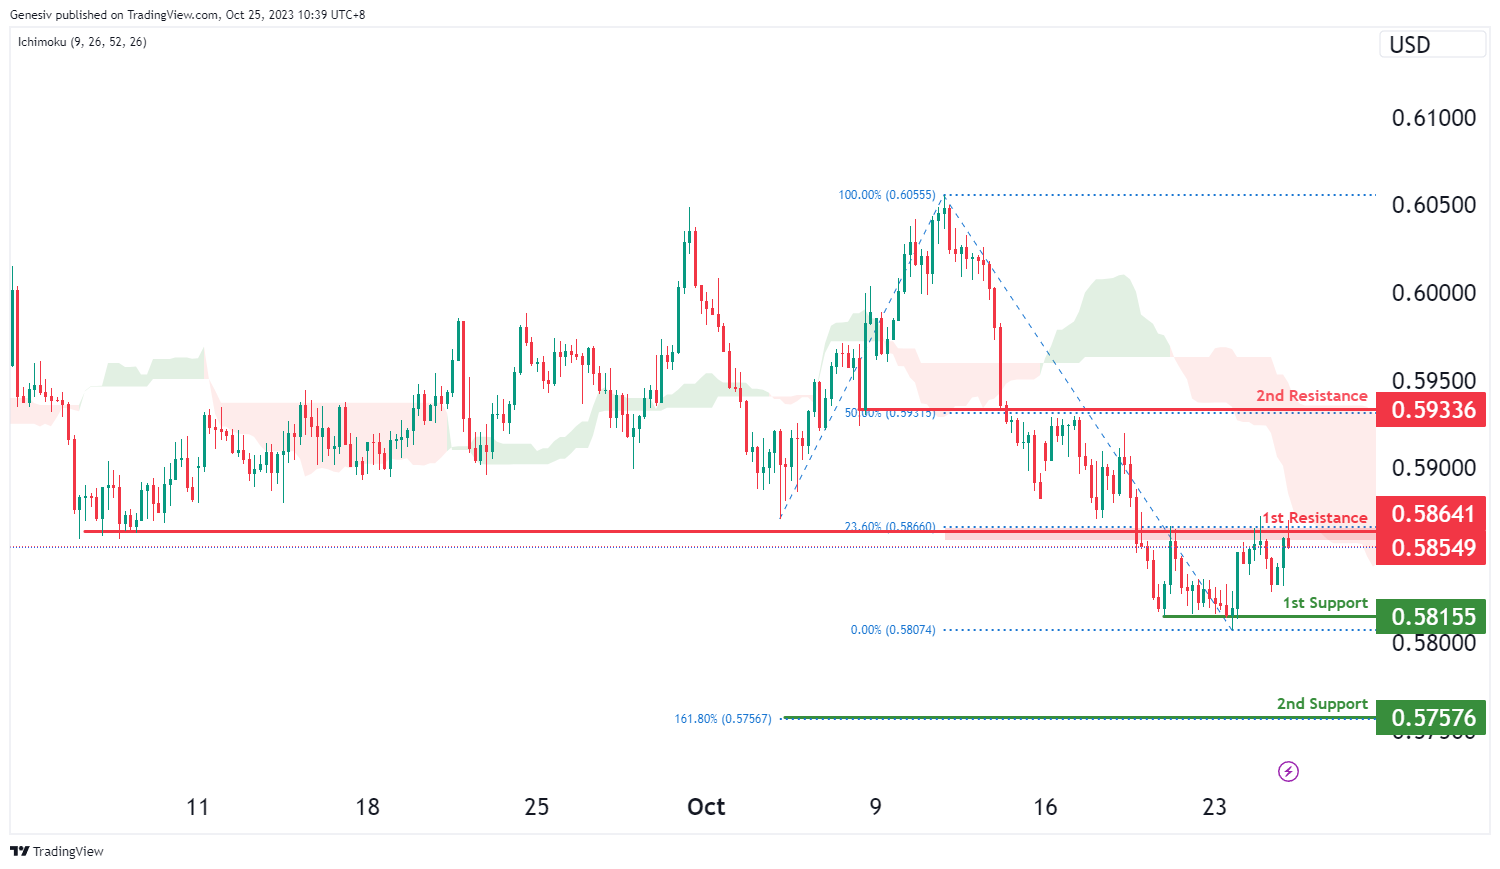
NZD/USD
The NZD/USD chart currently exhibits an overall bearish momentum with price potentially making a bearish reaction off the 1st resistance level to drop lower towards the 1st support level. In addition, price is also trading below the bearish Ichimoku cloud to reinforce the bearish momentum.
The 1st resistance level at 0.5864 is identified as an overlap resistance that aligns with the 23.60% Fibonacci retracement level. Higher up, the 2nd resistance level at 0.5934 is also marked as an overlap resistance that aligns with the 50.00% Fibonacci retracement level, making it a potentially strong resistance level.
To the downside the 1st support level at 0.5816 is identified as a pullback support. Additionally, the 2nd support level at 0.5758 is noted as a support level that aligns with the 161.80% Fibonacci extension level, further reinforcing its importance as a potential support area.
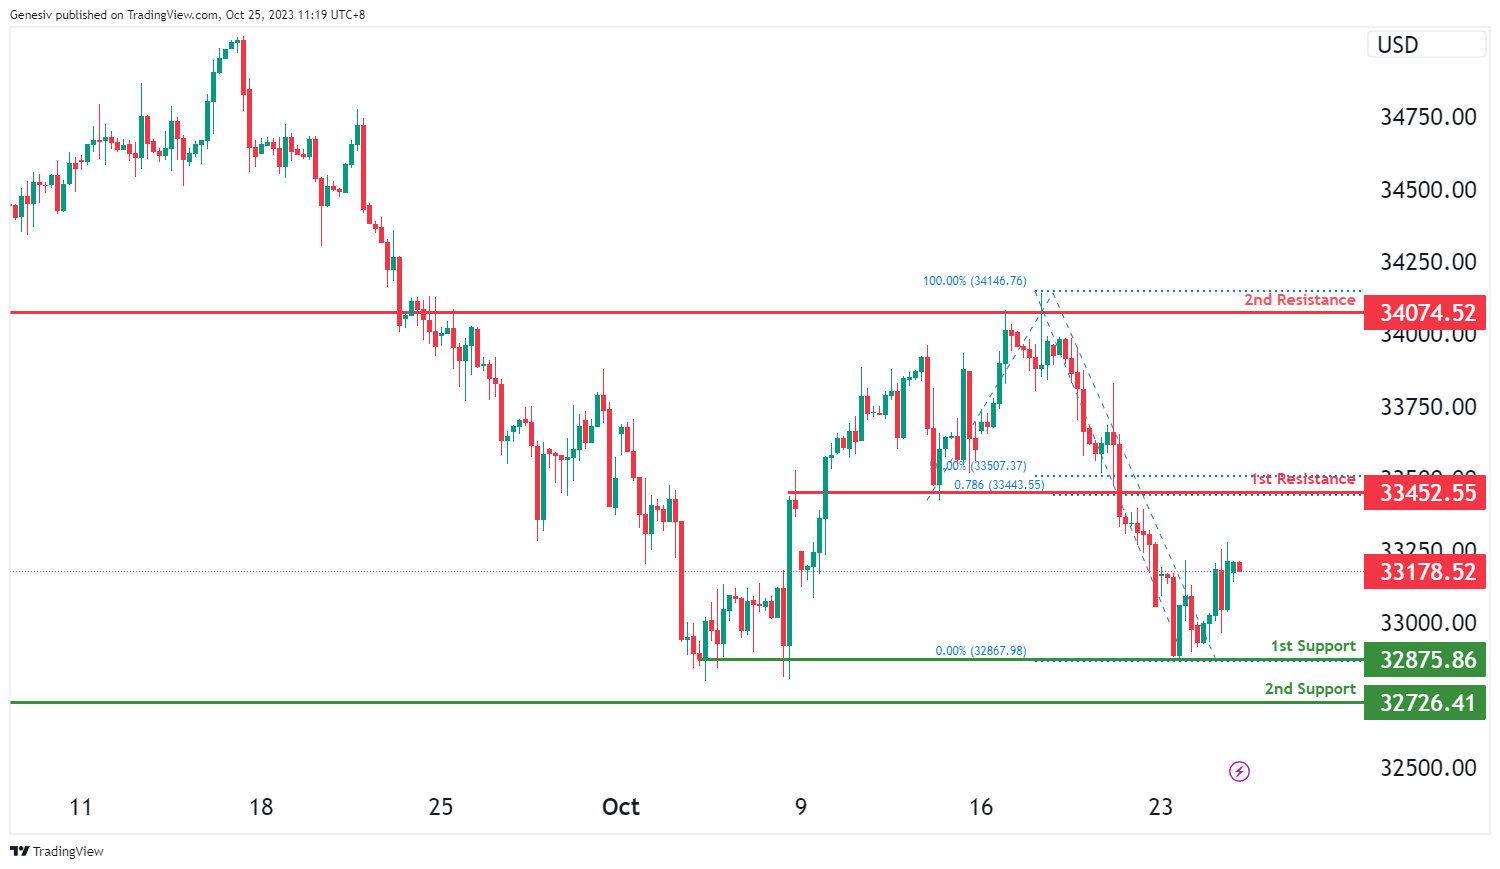
DJ30:
The Dow Jones (DJ30) chart currently exhibits an overall bearish momentum with price potentially making a bearish continuation towards the 1st support level.
The 1st support level at 32,875.86 is identified as a pullback support. Further below, the 2nd support level at 32,726.41 is also noted as a pullback support.
On the resistance side, the 1st resistance level at 33,452.55 is identified as an overlap resistance that aligns with a confluence of Fibonacci levels i.e.e the 50.00% retracement and the 78.60% projection levels. Higher up, the 2nd resistance level at 34,074.52 is marked as an overlap resistance.
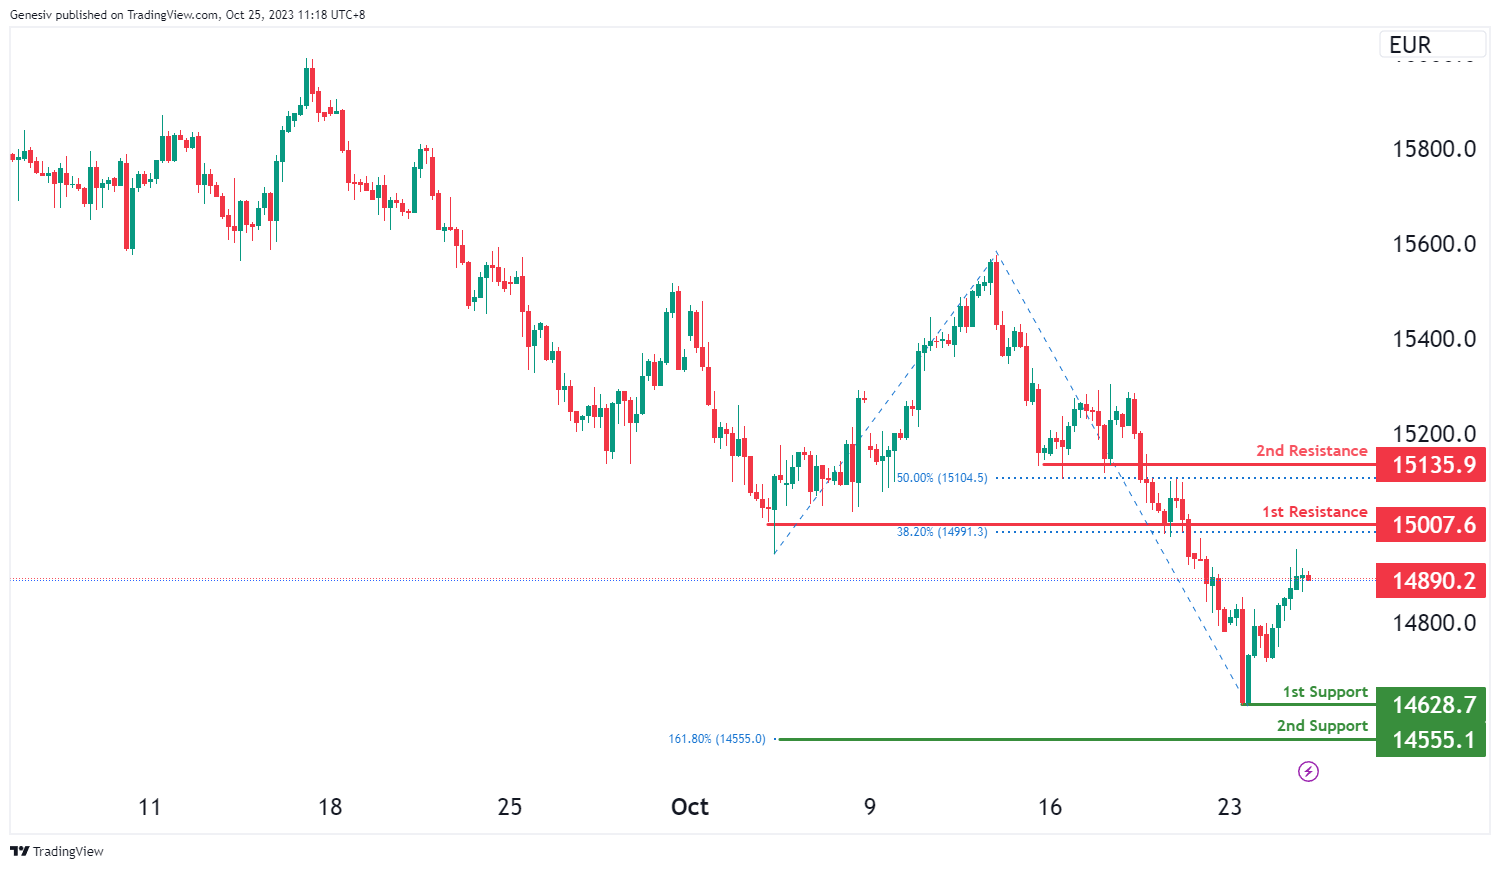
GER40:
The DAX (GER40) chart currently exhibits an overall bearish momentum with price potentially making a bearish continuation towards the 1st support level.
The 1st support level at 14,628.70 is identified as a swing-low support. Further below, the 2nd support level at 14,555.10 is marked as a level that aligns with the 161.80% Fibonacci extension level.
On the resistance side, the 1st resistance level at 15,007.60 is identified as a pullback resistance that aligns with the 38.20% Fibonacci retracement level. Higher up, the 2nd resistance level at 15,135.90 is noted as a pullback resistance that aligns with the 50.00% Fibonacci retracement level.
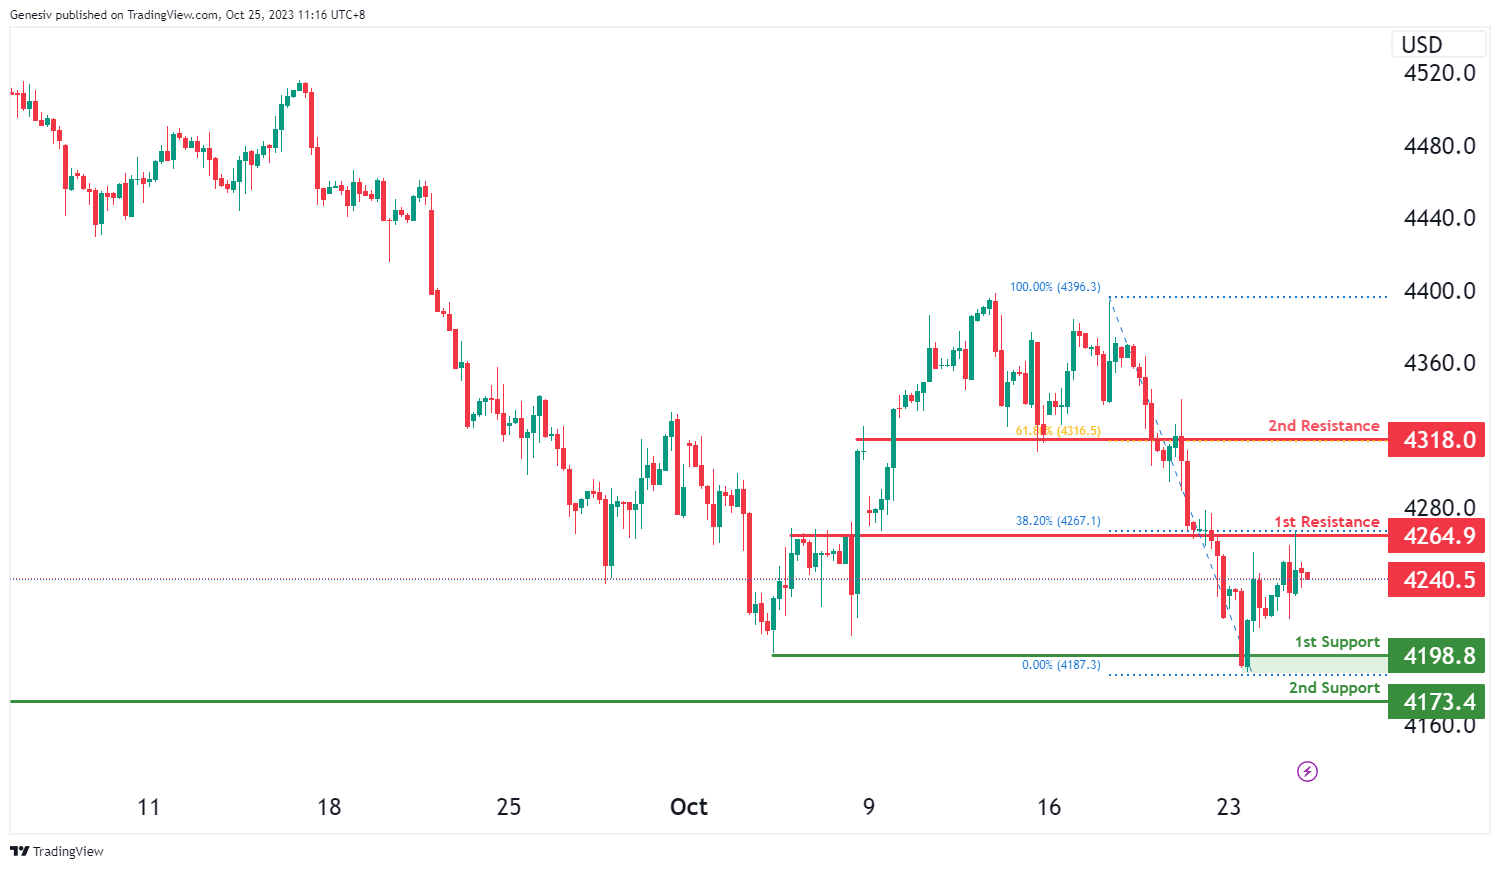
US500
The S&P 500 (US500) chart currently exhibits an overall bearish momentum with price potentially making a bearish continuation towards the 1st support level.
The 1st support level at 4,198.80 is identified as a pullback support. Further below, the 2nd support level at 4,173.40 is also marked as a pullback support.
On the resistance side, the 1st resistance level at 4,264.90 is identified as a pullback resistance that aligns with the 38.20% Fibonacci retracement level. Higher up, the 2nd resistance level at 4,318.00 is noted as an overlap resistance that aligns with the 61.80% Fibonacci retracement level.
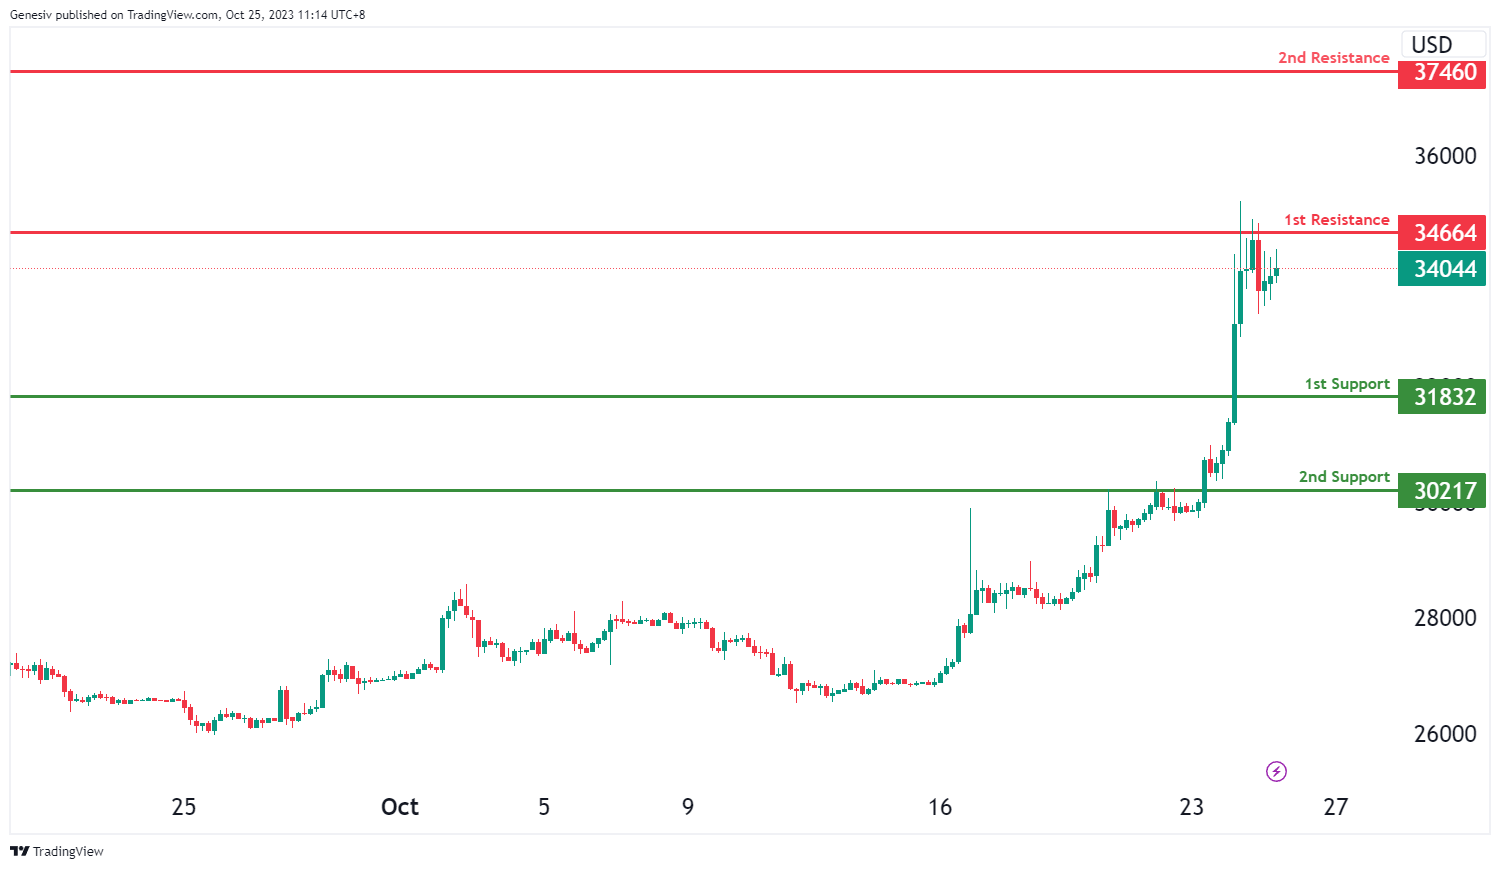
BTC/USD:
The Bitcoin (BTC/USD) chart currently exhibits an overall bullish momentum with price potentially making a bullish continuation towards the 1st resistance level.
The 1st resistance level at 34,664 is identified as an overlap resistance. Higher up, the 2nd resistance level at 37,460 is marked as a pullback resistance.
To the downside, the 1st support level at 31,832 is identified as a pullback support. Further below, the 2nd support level at 30,217 is also noted as pullback support.
ETH/USD:
The Ethereum (ETH/USD) chart currently exhibits an overall bullish momentum with price potentially making a bullish continuation towards the 1st resistance level.
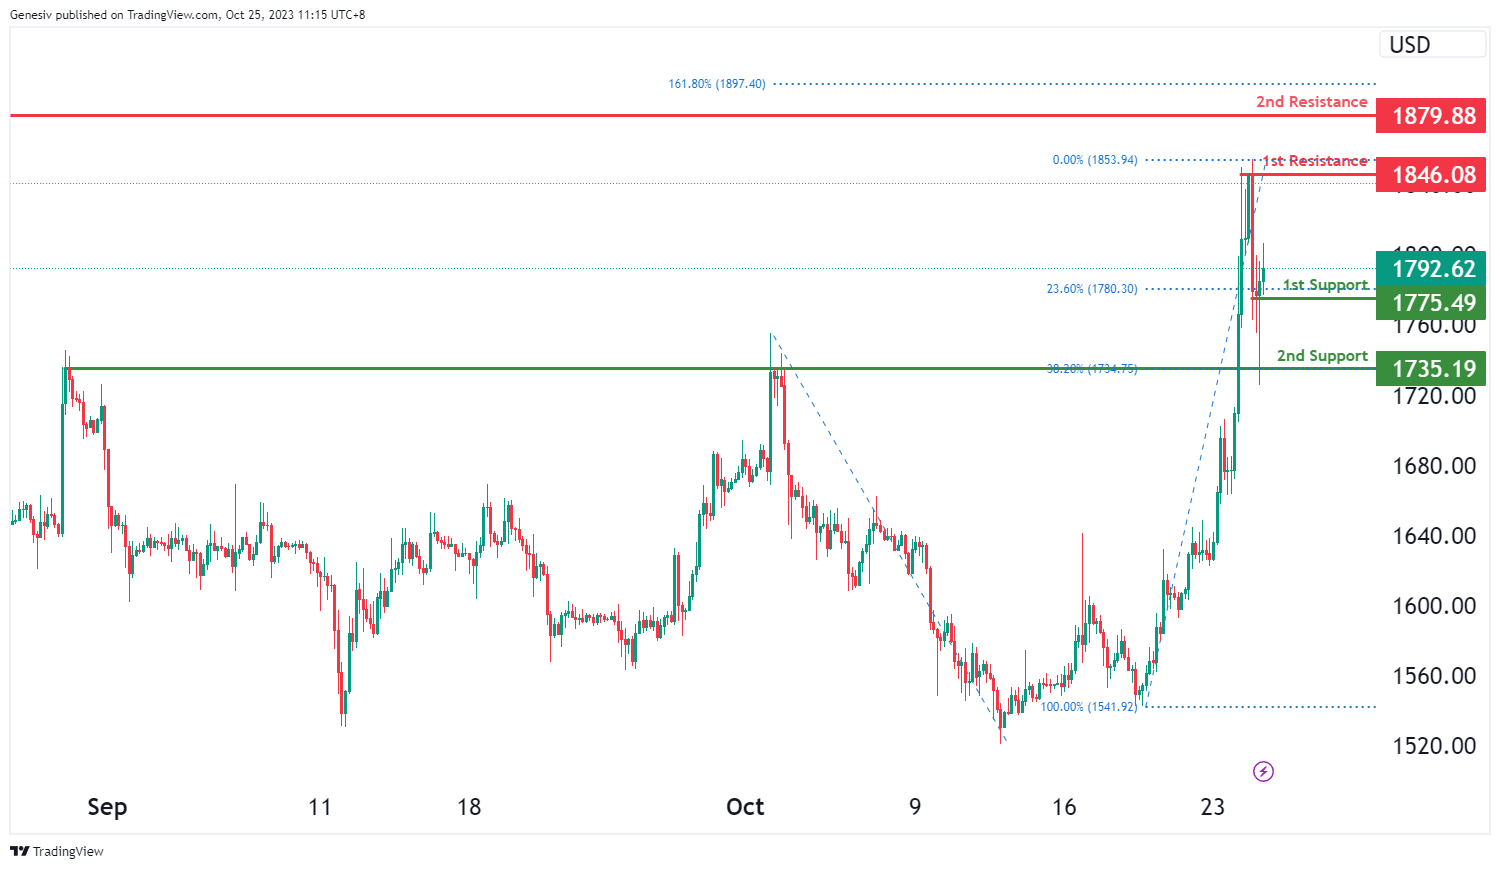
The 1st resistance level at 1,846.08 is identified as a pullback resistance. Higher up, the 2nd resistance level at 1,879.88 is also marked as a pullback resistance that aligns close to the 161.80% Fibonacci extension level.
To the downside, the 1st support level at 1,775.49 is identified as a pullback support that aligns with the 23.60% Fibonacci retracement level. Further below, the 2nd support level at 1,735.19 is also noted as pullback support that aligns with the 38.20% Fibonacci retracement level.
WTI/USD:
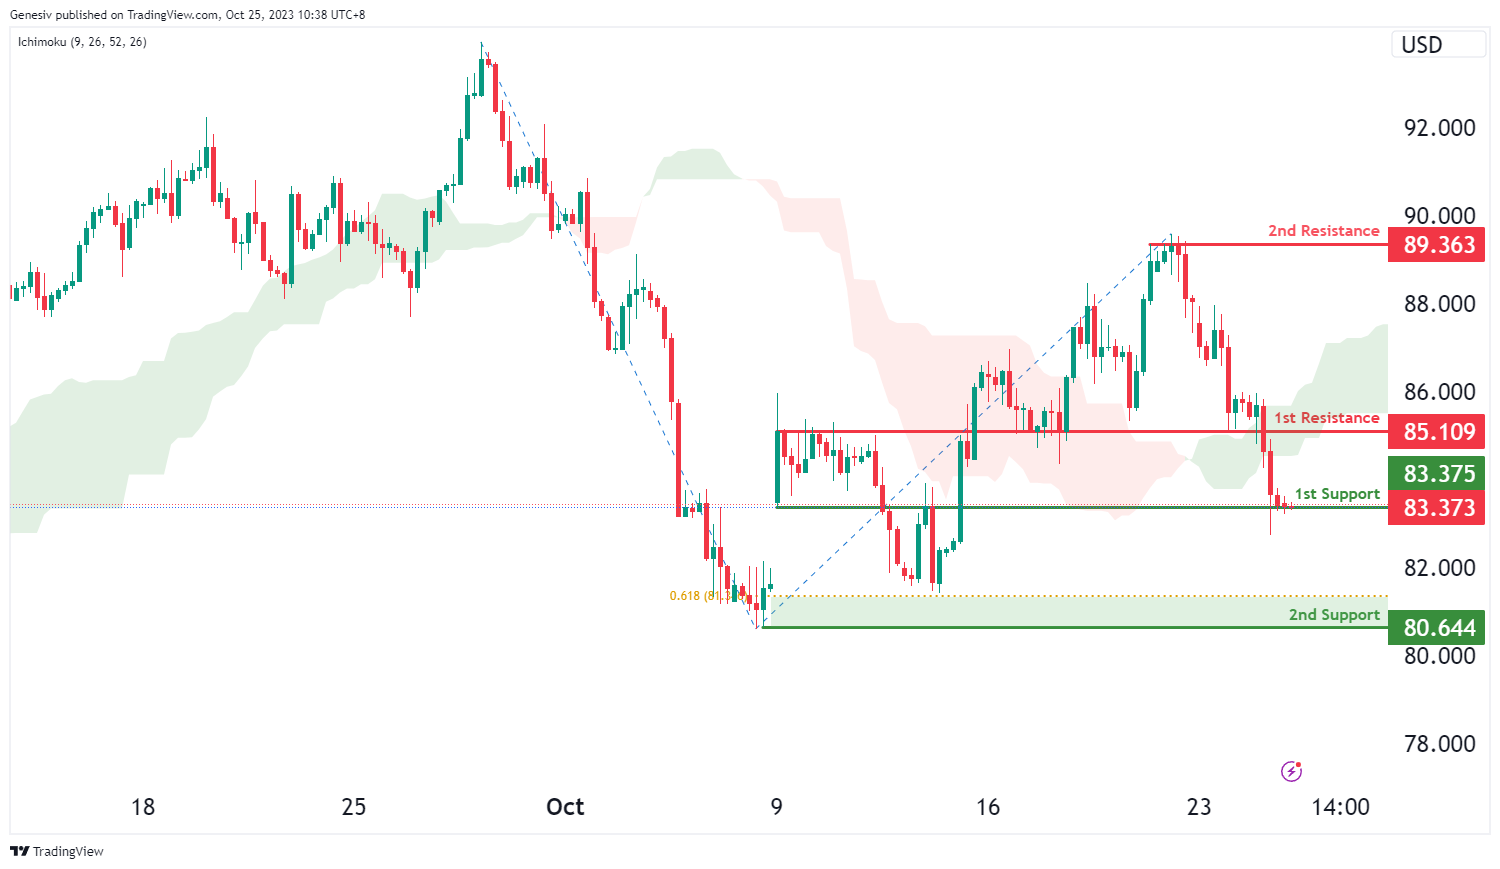
The WTI chart currently exhibits an overall bearish momentum, indicating a potential scenario for price to make a bearish continuation towards the 2nd support level should it break below the 1st support level. In addition, price has also broken below the bullish Ichimoku cloud to reinforce the bearish momentum.
The 1st support level at 83.38 is identified as an overlap support. Further below, the 2nd support level at 80.64 is also marked as a swing-low support that aligns with the 61.80% Fibonacci projection level, indicating a potential support zone.
To the upside, the 1st resistance level at 85.11 is identified as an overlap resistance. Beyond this, the 2nd resistance level at 89.36 is noted as a swing-high resistance, making it a potentially strong resistance level.
XAU/USD (GOLD):
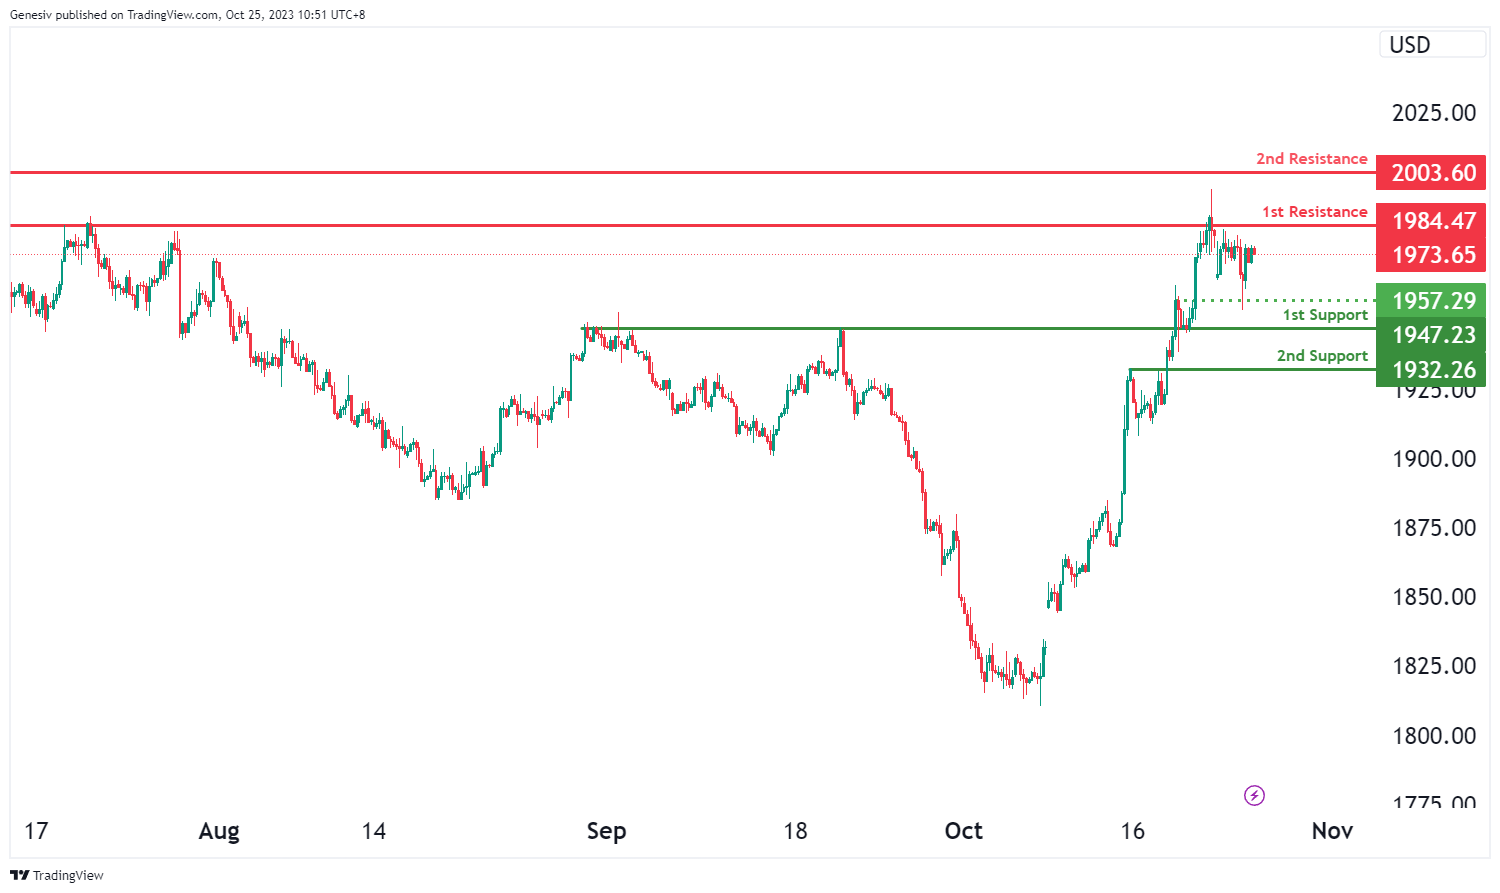
The XAU/USD (Gold/US Dollar) chart currently demonstrates a bearish overall momentum, suggesting the potential for a bearish continuation towards the 1st support level.
The 1st support at 1947.23 is considered significant as it aligns with an overlap support level, indicating its potential to serve as a substantial area of price support. Additionally, the 2nd support at 1932.26 is identified as a pullback support, further strengthening the potential for it to act as a support level.
On the resistance side, the 1st resistance at 1984.47 is characterized as a multi-swing high resistance level, implying that it could pose a significant obstacle to any notable upward price movement. Furthermore, the 2nd resistance at 2003.60 is identified as a swing high resistance, reinforcing the potential for resistance in this region.
Additionally, there is an intermediate support at 1957.29, which aligns with an overlap support, providing an additional level of potential support for price.
EUR/USD Daily Outlook
Daily Pivots: (S1) 1.0551; (P) 1.0623; (R1) 1.0662; More...
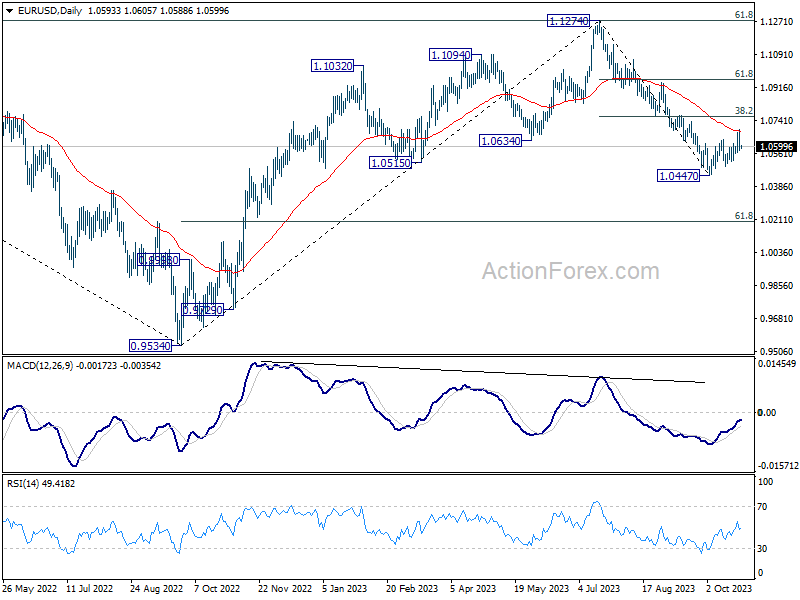
Intraday bias in EUR/USD stays neutral for the moment. On the upside, above 1.0693 will resume the rebound to 1.0764 cluster resistance (38.2% retracement of 1.1274 to 1.0447 at 1.0763). On the downside, break of 1.0522 support will retain near term bearishness for resuming the whole decline from 1.1274 through 1.0447 next.
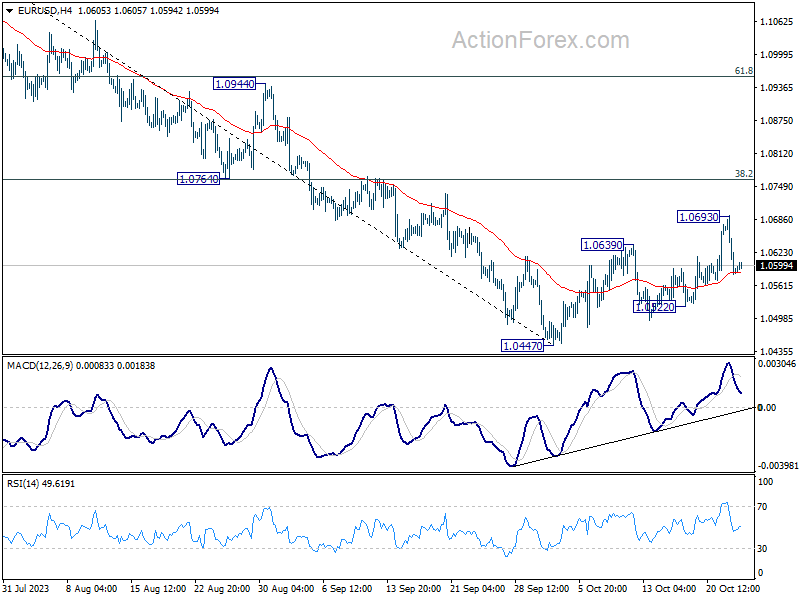
In the bigger picture, fall from 1.1274 medium term top could still be a correction to rise from 0.9534 (2022 low). But chance of a complete trend reversal is rising. In either case, current fall should target 61.8% retracement of 0.9534 to 1.1274 at 1.0199 next. For now, risk will stay on the downside as long as 55 D EMA (now at 1.0684) holds, in case of rebound.
GBP/USD Daily Outlook
Daily Pivots: (S1) 1.2113; (P) 1.2201; (R1) 1.2249; More
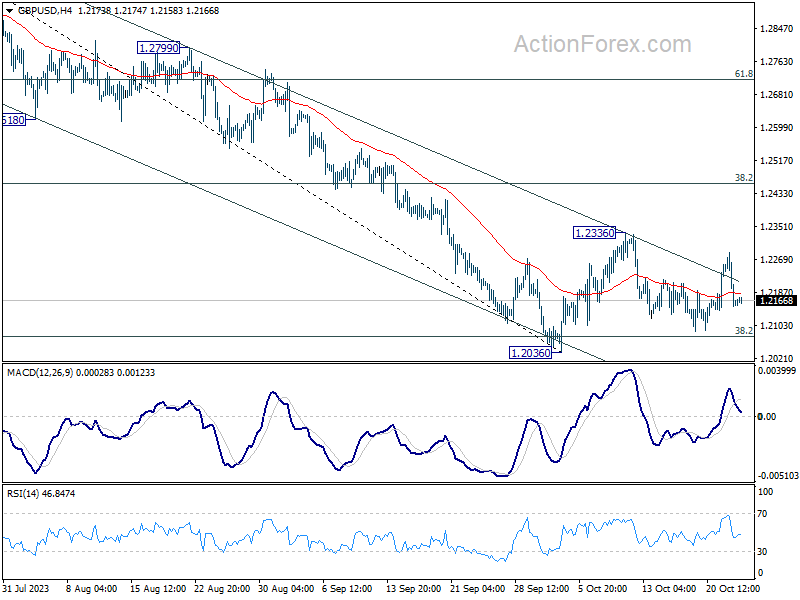
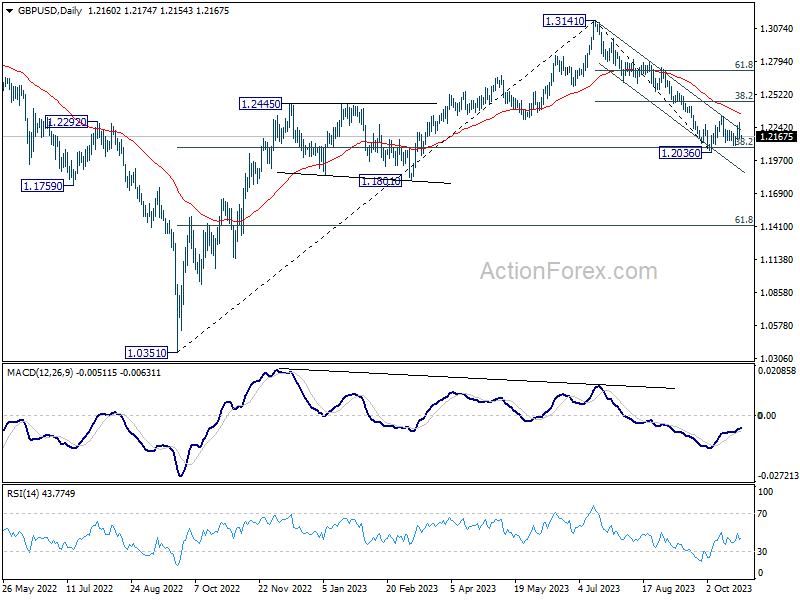
GBP/USD is extending the consolidation pattern from 1.2036 and intraday bias remains neutral. Downside breakout is still mildly in favor. On the downside, decisive break of 1.2036 will resume whole decline from 1.3141 for 1.1801 support next. However, break of 1.2336 will turn bias back to the upside for 38.2% retracement of 1.3141 to 1.2036 at 1.2458.
In the bigger picture, fall from 1.3141 medium term top could still be a correction to up trend from 1.0351 (2022 low) only. But risk of complete trend reversal is rising. Sustained break of 38.2% retracement of 1.0351 to 1.3141 at 1.2075 will pave the way to 61.8% retracement at 1.1417. For now, risk will stay on the downside as long as 55 D EMA (now at 1.2384) holds, in case of rebound.
USD/CHF Daily Outlook
Daily Pivots: (S1) 0.8895; (P) 0.8924; (R1) 0.8960; More....
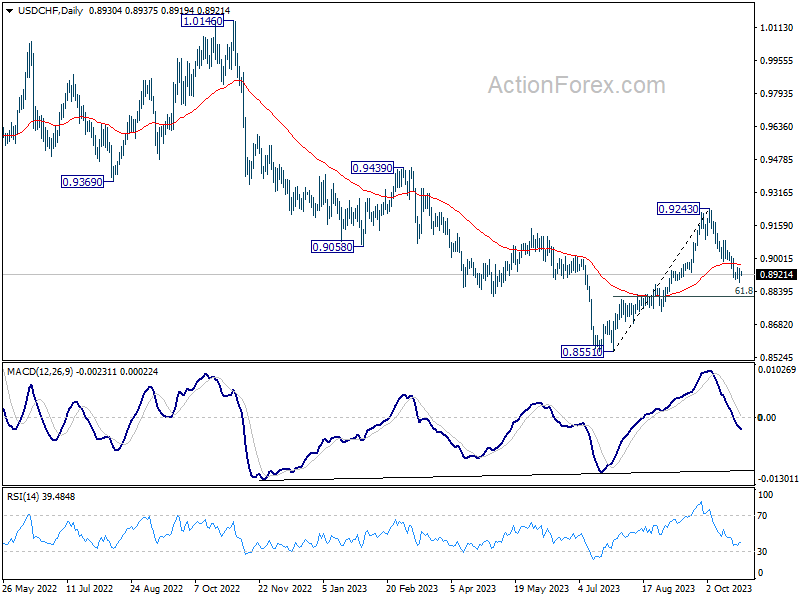
Intraday bias in USD/CHF remains neutral, and further decline is expected as long as 0.9000 resistance holds. Below 0.8886 will resume the fall from 0.9243 to 61.8% retracement of 0.8551 to 0.9243 at 0.8815 next. Sustained break there will pave the way to retest 0.8551 low. Nevertheless, break of 0.9000 will turn bias back to the upside for stronger rebound.
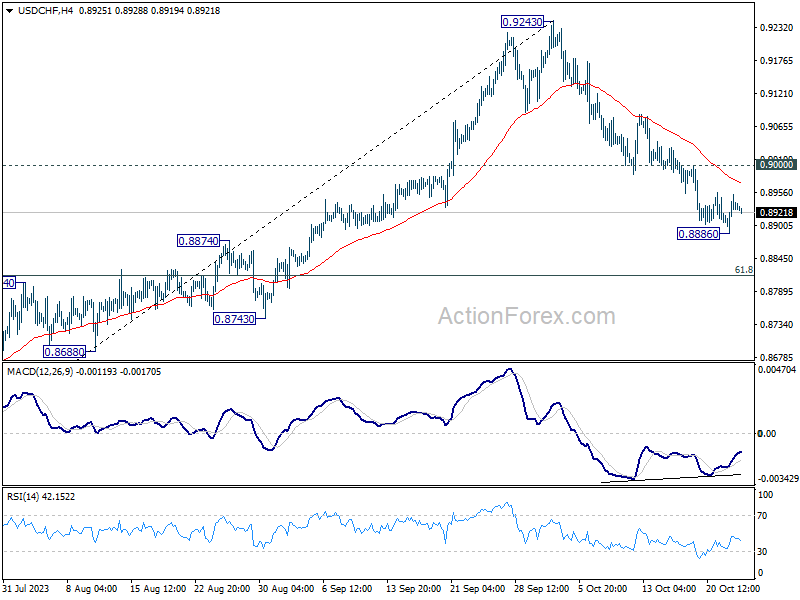
In the bigger picture, the firm break of 55 D EMA (now at 0.8974) argues that rebound from 0.8551 might be completed as a correction at 0.9243. In other words, larger fall from 1.0146 (2022 high) is possibly not over yet. Risk will now stay on the downside as long as 0.9243 resistance holds. Firm break of 0.8551 will confirm down trend resumption.
USD/JPY Daily Outlook
Daily Pivots: (S1) 149.51; (P) 149.72; (R1) 150.12; More...
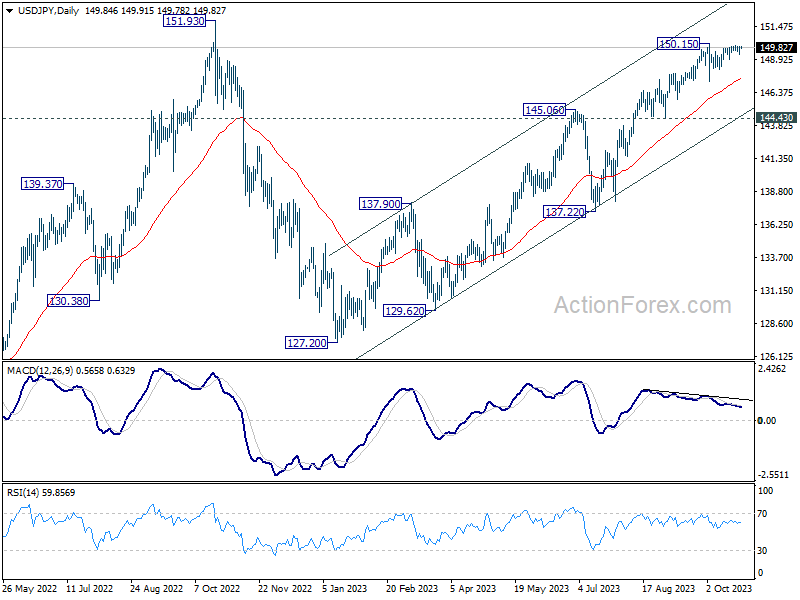
No change in USD/JPY's outlook as consolidation from 150.15 is extending. On the downside, below 148.94 minor support will turn bias to the downside for another down leg towards 147.28. On the upside, firm break of 150.15 will resume larger up trend to test 151.93 high.
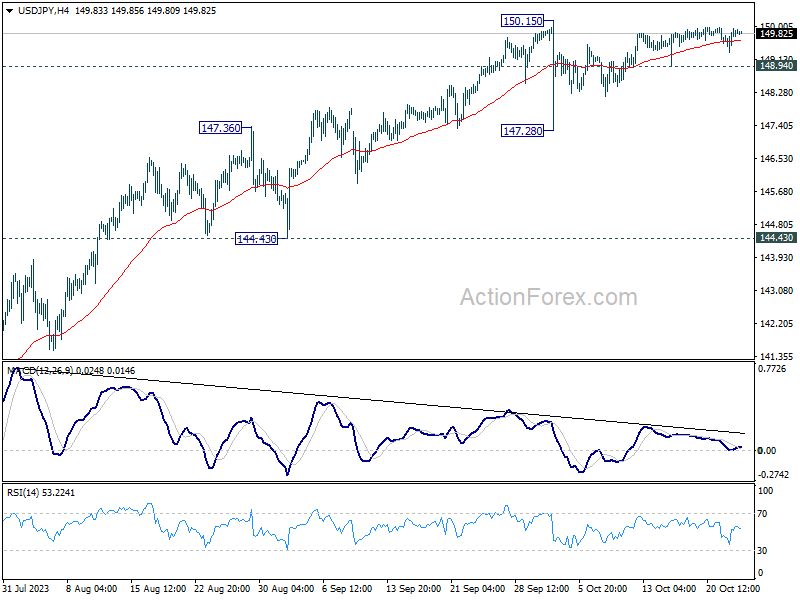
In the bigger picture, while rise from 127.20 is strong, it could still be seen as the second leg of the corrective pattern from 151.93 (2022 high). Rejection by 151.93, followed by sustained break of 145.06 resistance turned support will be the first sign that the third leg of the pattern has started. However, sustained break of 151.93 will confirm resumption of long term up trend.