

Sample Category Title
GBP/USD Weekly Outlook
GBP/USD's rebound from 1.2036 extended higher last week but was rejected by near term falling channel resistance, and fell notably since then. Initial bias remains on the downside this week for retesting 1.2036. Firm break will resume whole decline from 1.3141 for 1.1801 support next. On the upside, above 1.2224 minor resistance will turn intraday bias neutral first. But risk will stay on the downside as long as 1.2336 resistance holds.
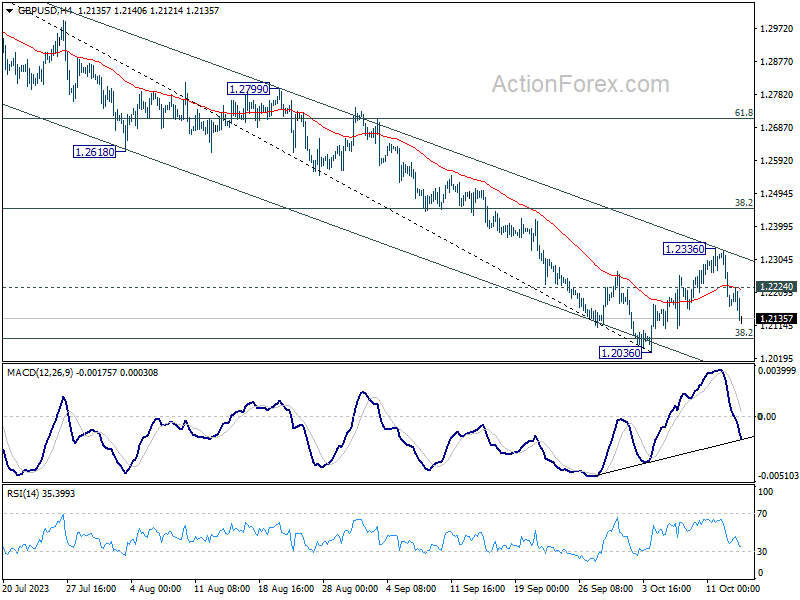
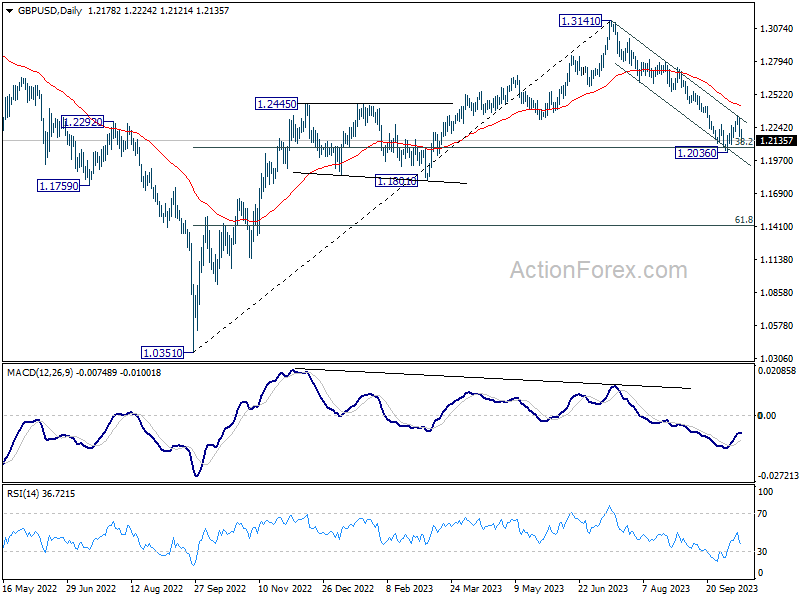
In the bigger picture, fall from 1.3141 medium term top could still be a correction to up trend from 1.0351 (2022 low) only. But risk of complete trend reversal is rising. Sustained break of 38.2% retracement of 1.0351 to 1.3141 at 1.2075 will pave the way to 61.8% retracement at 1.1417. For now, risk will stay on the downside as long as 55 D EMA (now at 1.2418) holds, in case of rebound.
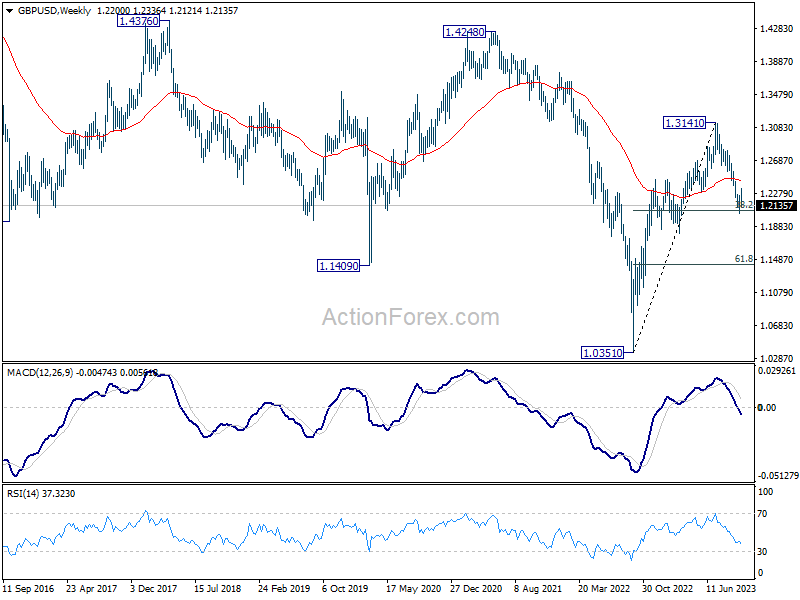
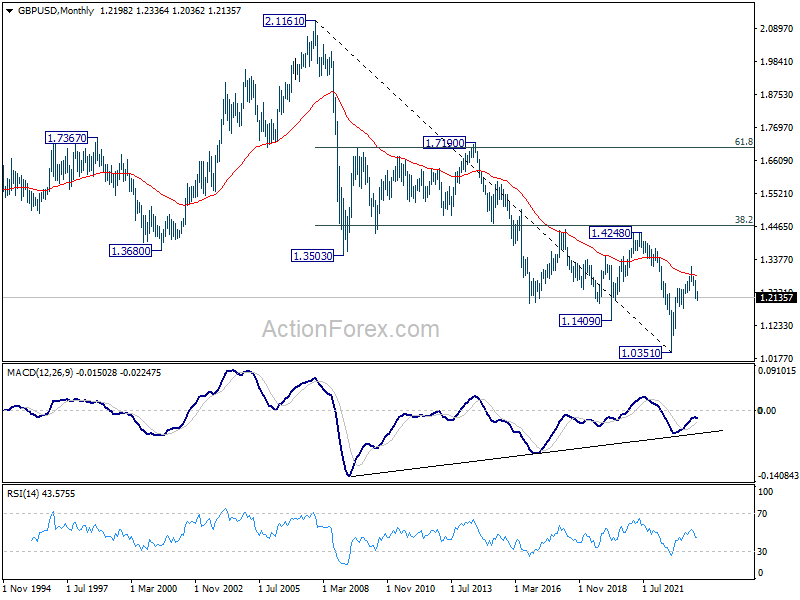
In the long term picture, there is no clear sign of trend reversal yet. Rise from 1.0351 could be part of a consolidation pattern to down trend from 2.1161 (2007 high). Rejection by 55 M EMA (now at 1.2900) will retain long term bearishness for extending the down trend at a later stage.
USD/CHF Weekly Outlook
USD/CHF recovered ahead of 38.2% retracement of 0.8551 to 0.9243 at 0.8979 last week. But upside was capped by 55 4H EMA (now at 0.9075). Initial bias remains neutral this week first. On the upside, firm break of 0.9086 will indicate that pull back from 0.9243 has completed, and turn bias to the upside for retesting this high. However, sustained break of 0.8979 will argue that deeper fall is under way to 61.8% retracement at 0.8815.
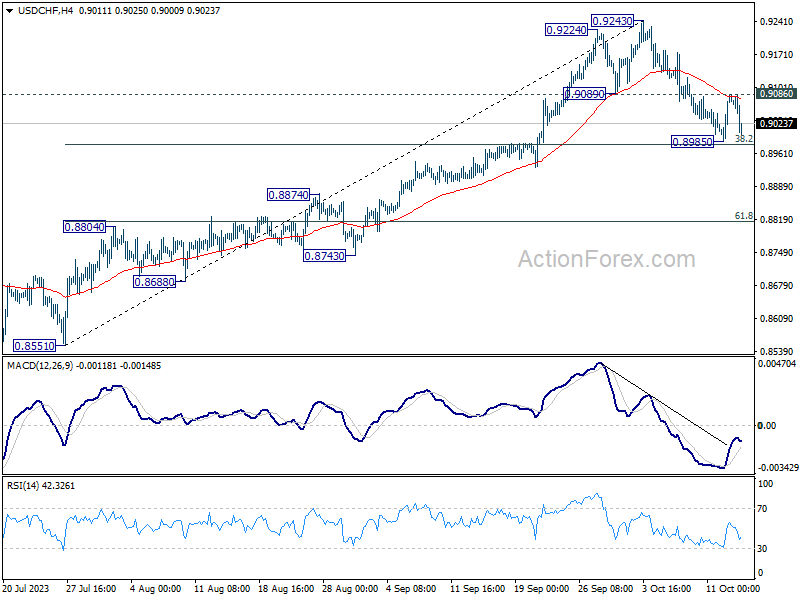
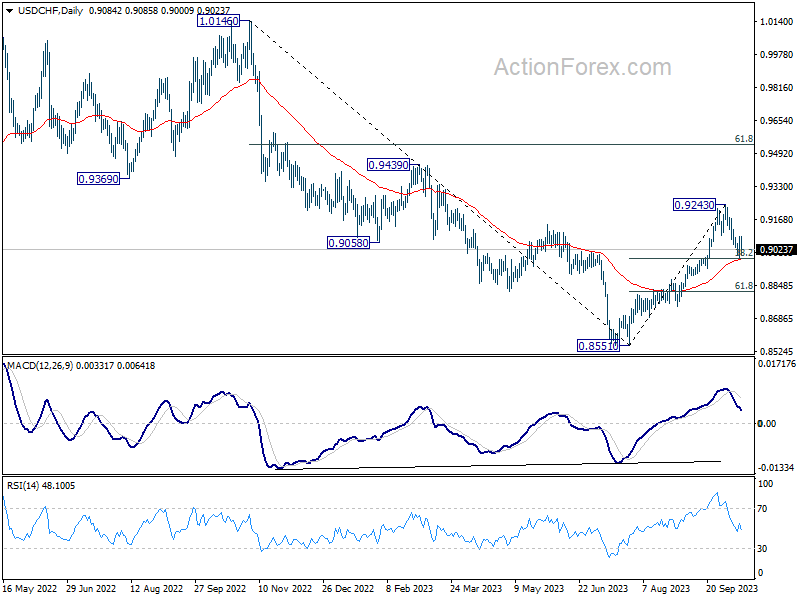
In the bigger picture, as long as 55 D EMA (now at 0.8976) holds rise from 0.8551 is viewed as reversing whole down trend from 1.0146 (2022 high). On resumption, further rise should be seen to 61.8% retracement of 1.0146 to 0.8551 at 0.9537 and above. However, sustained break of 55 D EMA will revive medium term bearishness, for retesting 0.8551 low at a later stage.
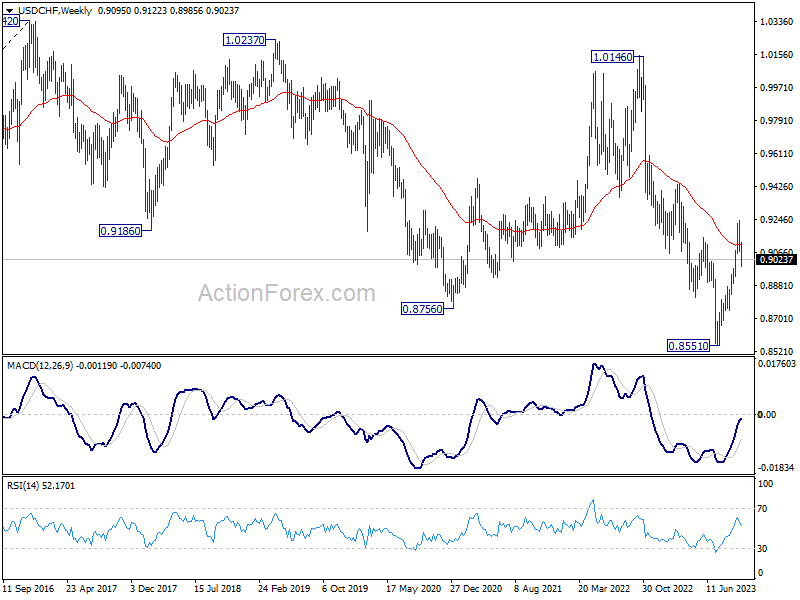
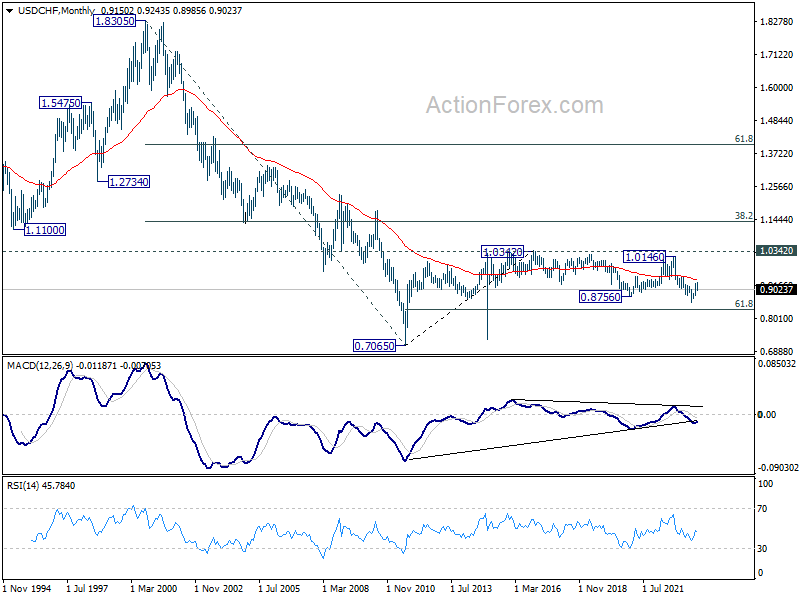
In the long term picture, there is no clear sign that down trend from 1.8305 (2000 high) has completed. With 38.2% retracement of 1.8305 to 0.7065 at 1.1359 intact, outlook is neutral at best.
AUD/USD Weekly Report
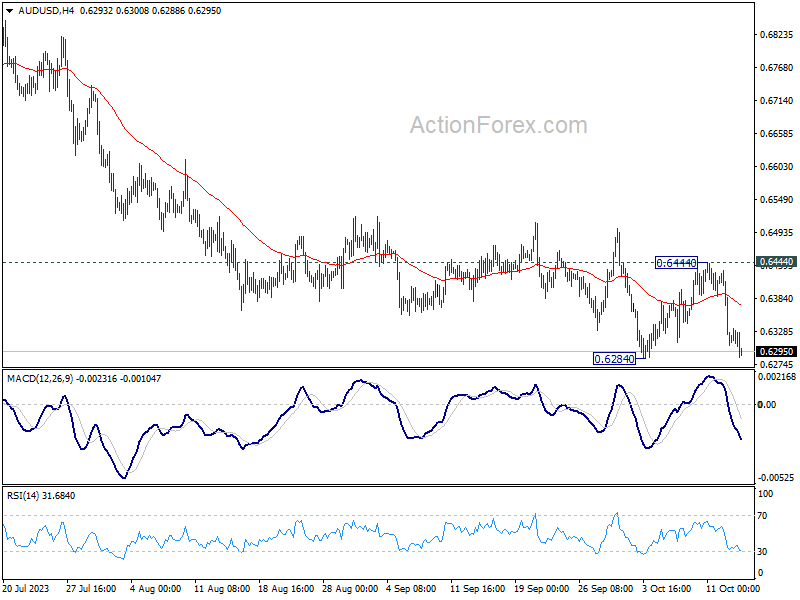
With the late decline last week, AUD/USD's recovery from 0.6284 should have completed at 0.6444 already. Decisive break of 0.6284 this week will resume whole fall from 0.7156. Next target is 100% projection of 0.7156 to 0.6457 from 0.6894 at 0.6195, which is close to 0.6169 medium term support. For now, outlook will stay bearish as long as 0.6444 resistance holds, in case of recovery.
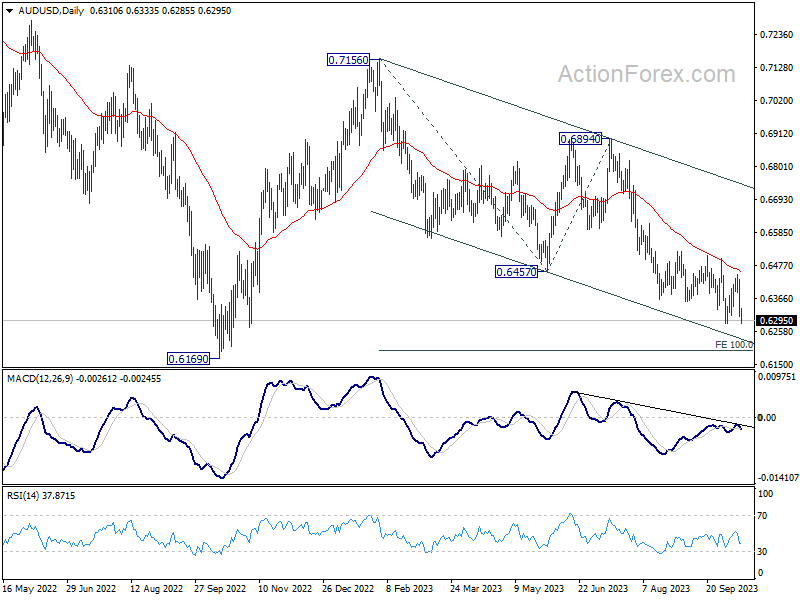
In the bigger picture, down trend from 0.8006 (2021 high) is possibly still in progress. Decisive break of 0.6169 will target 61.8% projection of 0.8006 to 0.6169 to 0.7156 at 0.6021. This will now remain the favored case as long as 0.6894, in case of strong rebound.
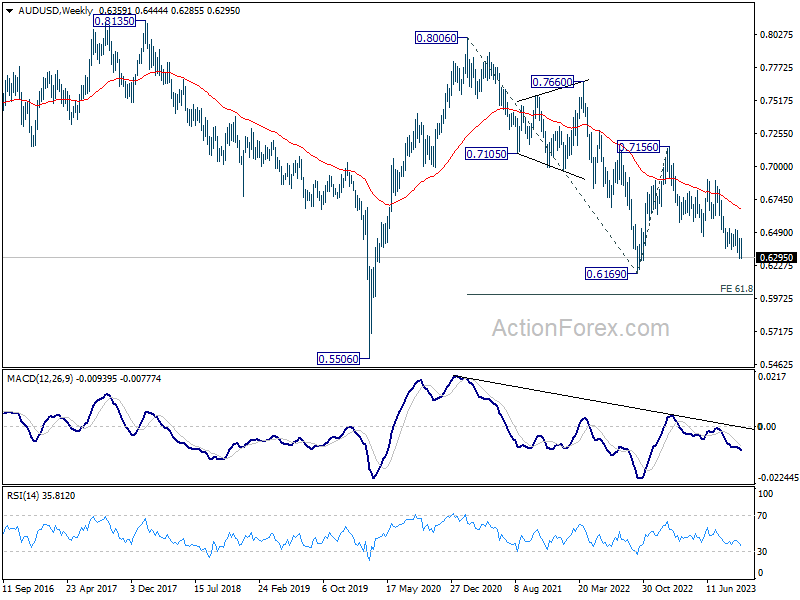
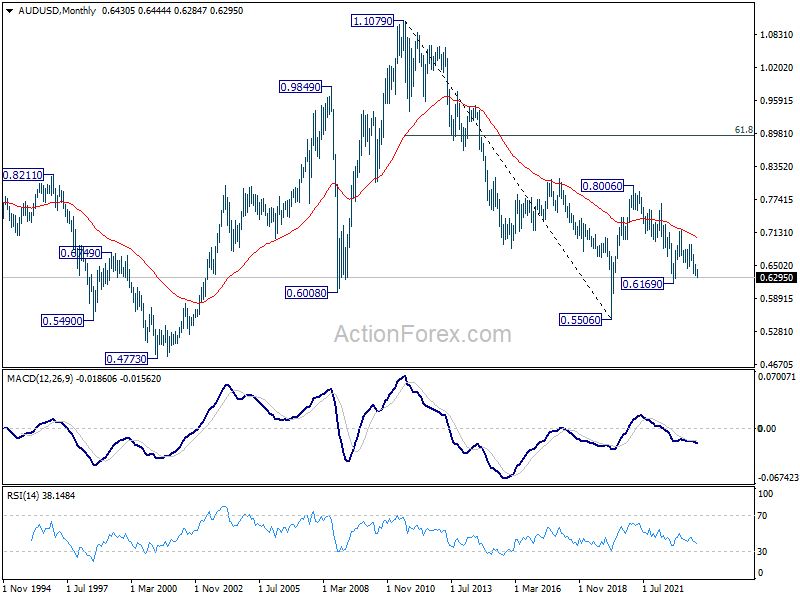
In the long term picture, while fall from 0.8006 might extend lower, the structure argues that it's merely a correction to rise from 0.5506 (2020 low). In case of downside extension, strong support should emerge above 0.5506 to bring reversal. But still, momentum of the next move will be monitored to adjust the assessment.
USD/CAD Weekly Outlook
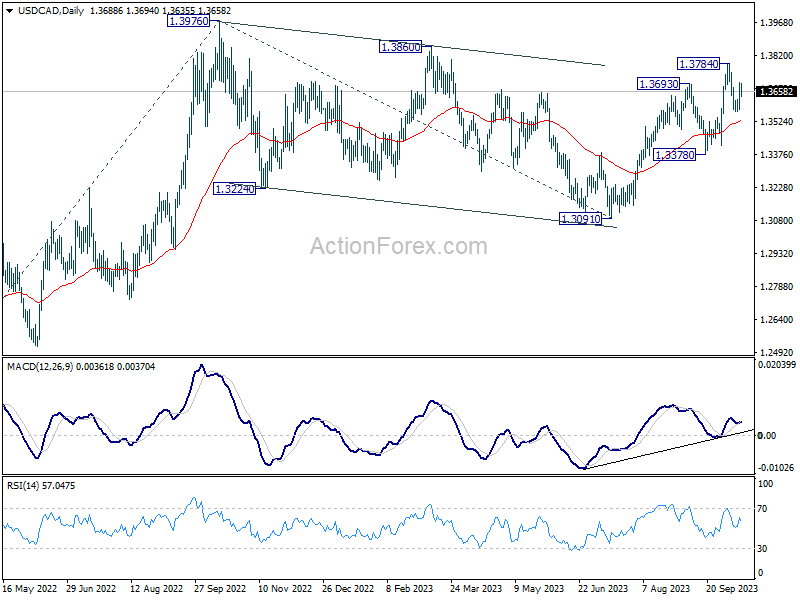
USD/CAD's rebound last week argues that pull back from 1.3784 has completed at 1.3568. Initial bias is mildly on the upside this week for retesting 1.3784. Firm break there will resume larger rise from 1.3091 to retest 1.3976 high. On the downside, below 1.3568 will bring another falling leg to extend the near term corrective pattern.
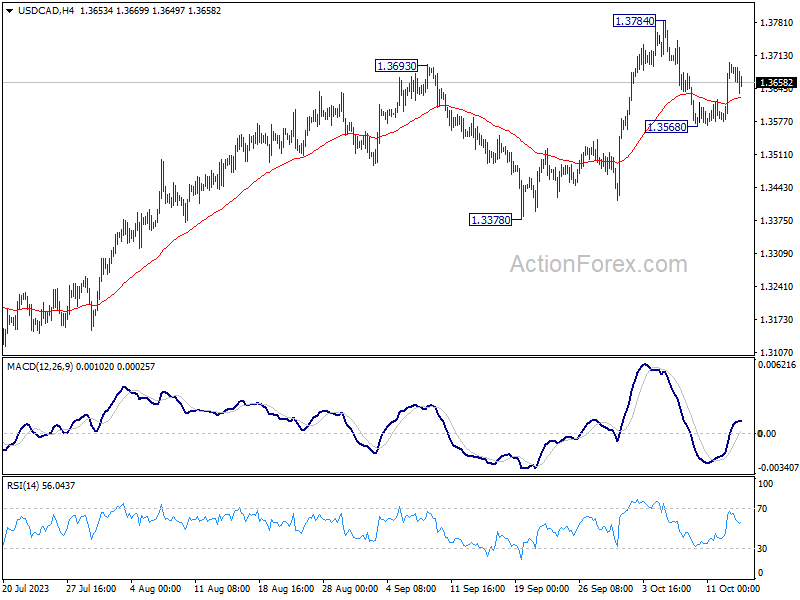
In the bigger picture, current development revives the case that corrective pattern from 1.3976 (2022 high) has completed with three waves down to 1.3091. Decisive break of 1.3976 high will confirm resumption of up trend from 1.2005 (2021 low). Next target will be 61.8% projection of 1.2401 to 1.3976 from 1.3091 at 1.4064. This will now remain the favored case as long as 1.3378 support holds.
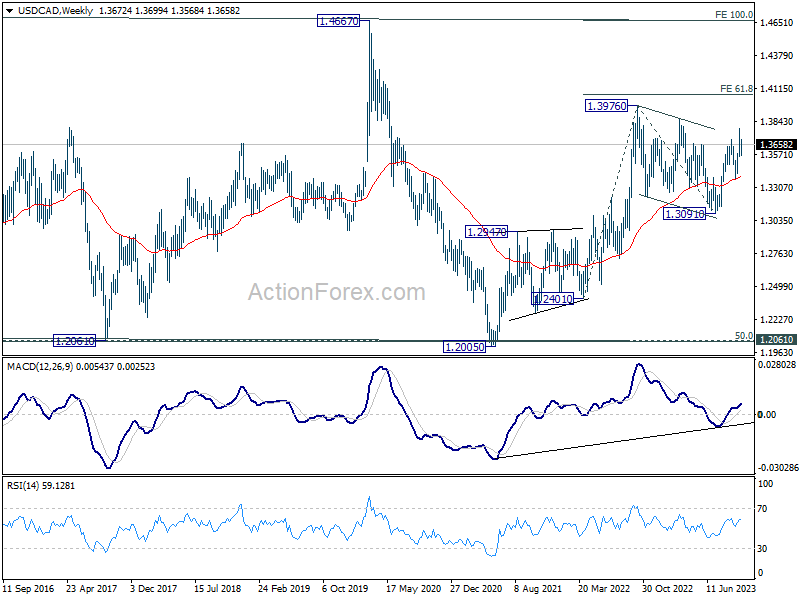
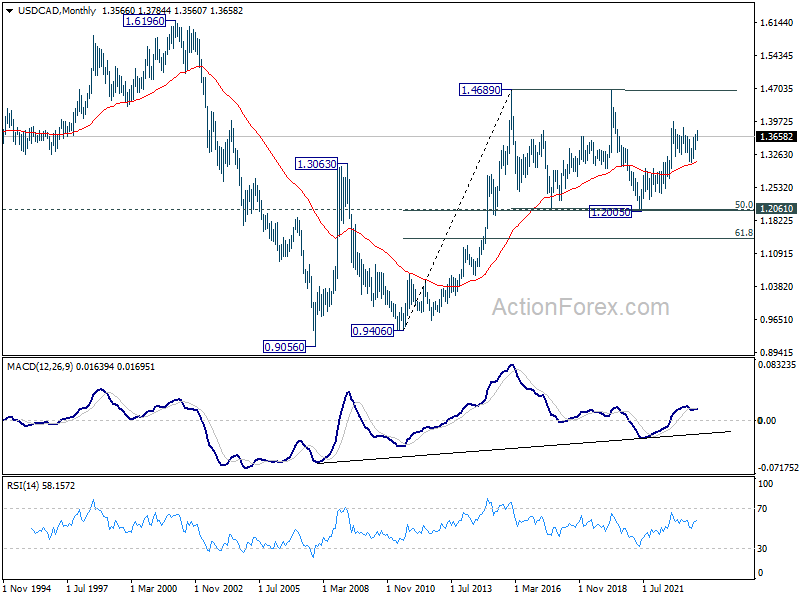
In the longer term picture, price actions from 1.4689 (2016 high) are seen as a consolidation pattern only, which might have completed at 1.2005. That is, up trend from 0.9506 (2007 low) is expected to resume at a later stage. This will remain the favored case as 55 M EMA (now at 1.3100) holds.
GBP/JPY Weekly Outlook
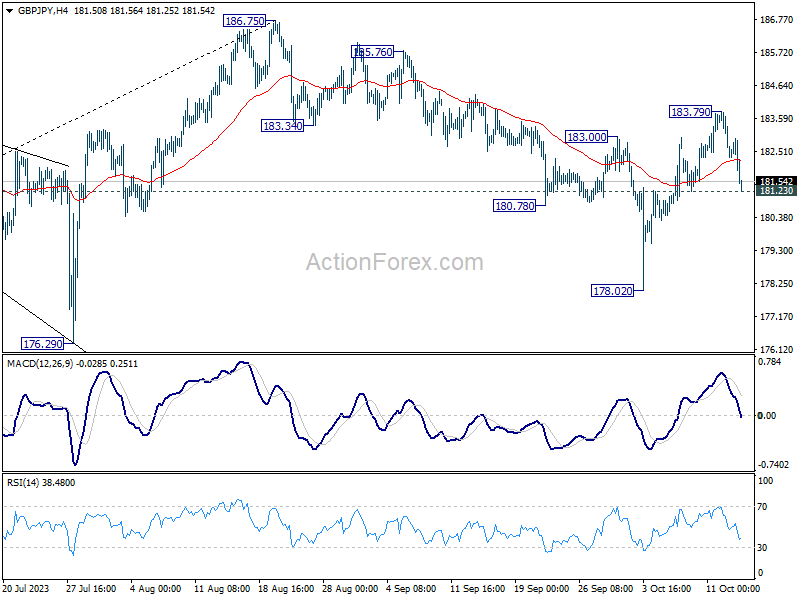
GBP/JPY rose to 183.79 last week but retreated notably since then. Initial bias remains neutral this week first. For now, the favored case is still that correction from 186.75 has completed at 178.02. Above 183.79 will resume the rise from 178.02 to retest 186.75 high. However, break of 181.23 will dampen this view, and turn bias back to the downside for 178.02 instead.
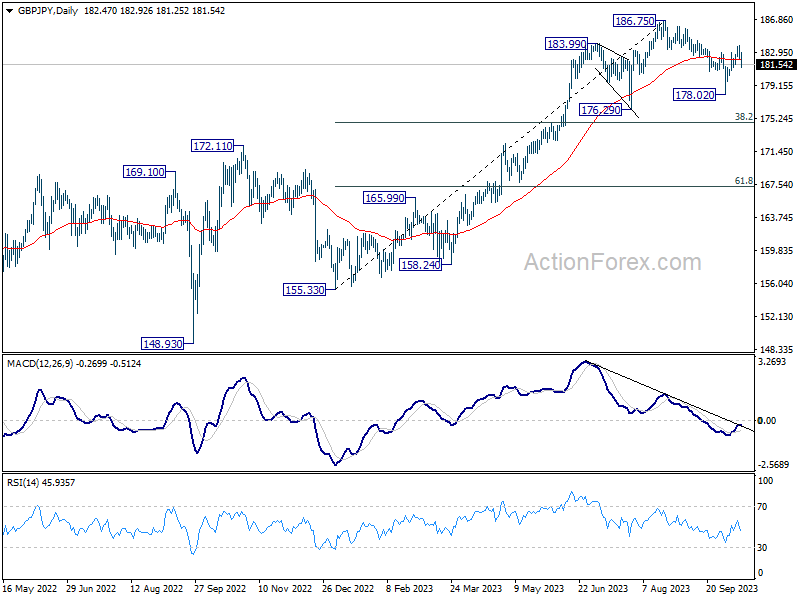
In the bigger picture, fall from 186.75 is seen as a corrective move only. As long as 176.29 support holds, larger up trend from 123.94 (202 low) should still be in progress. Break of 186.75 will target 195.86 (2015 high). Nevertheless, firm break of 176.29 will confirm medium term topping, and bring lengthier and deeper consolidations.
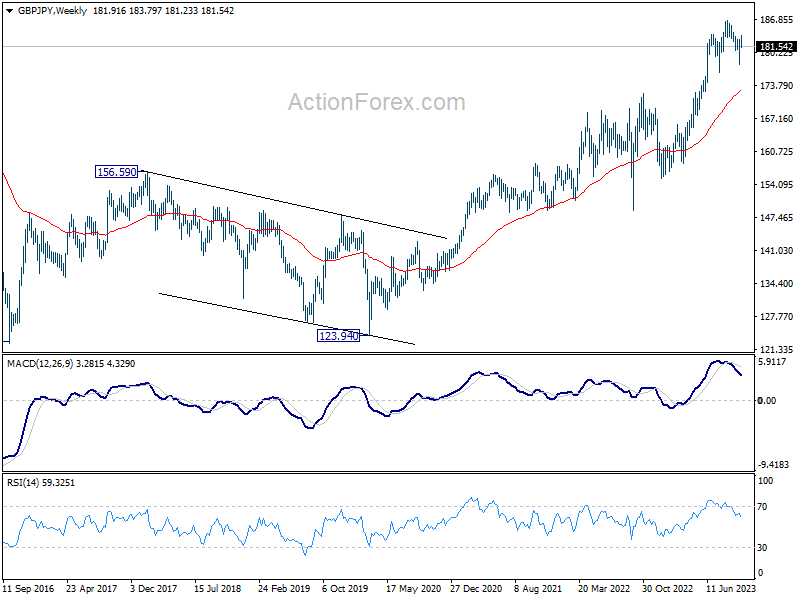
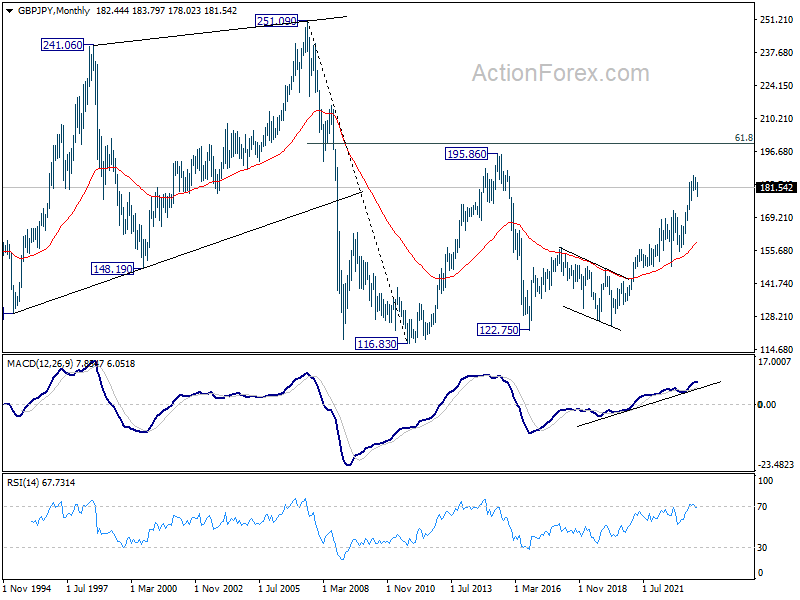
In the longer term picture, rise from 122.75 (2016 low) in still in progress but started losing upside momentum as seen in W MACD. Further rise will remain in favor, though, as long as 176.29 support holds, to retest 195.86 (2015 high).
EUR/JPY Weekly Outlook
EUR/JPY edged higher to 158.60 last week but retreated notably since then. Initial bias is neutral this week first. For now, the favored case is still that correction from 159.75 has completed at 154.32. Above 158.60 will resume the rise from 154.32 and target 159.75 high. However, break of 156.50 will dampen this view, and bring another fall to extend the corrective pattern from 159.75.
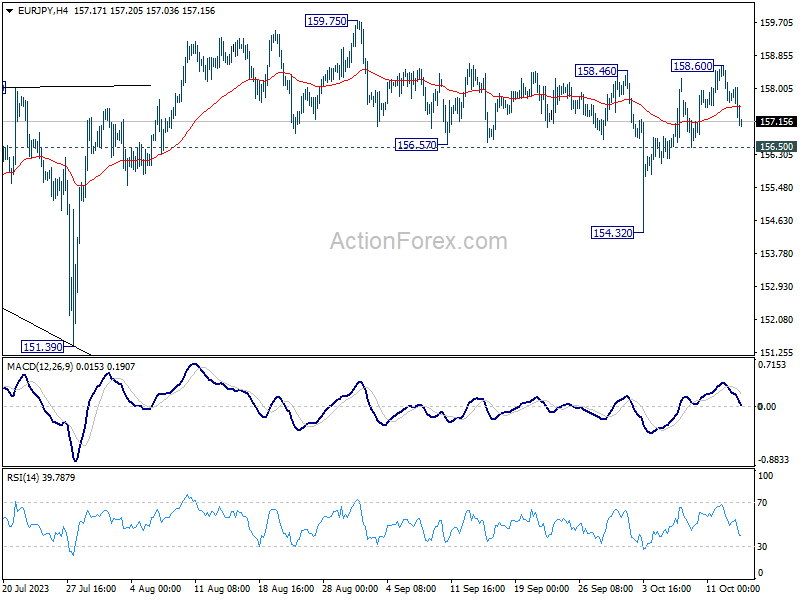
In the bigger picture, price actions from 159.75 are views as a corrective pattern. As long as 151.39 support holds, rise from 114.42 (2020 low) is expected to continue through 159.75 at a later stage. Nevertheless, firm break of 151.39 will confirm medium term topping, and bring lengthier and deeper correction.
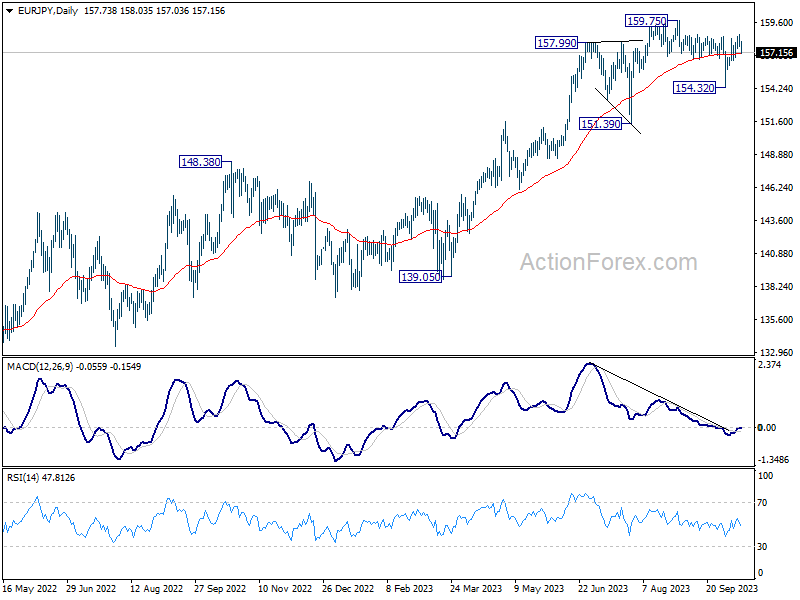
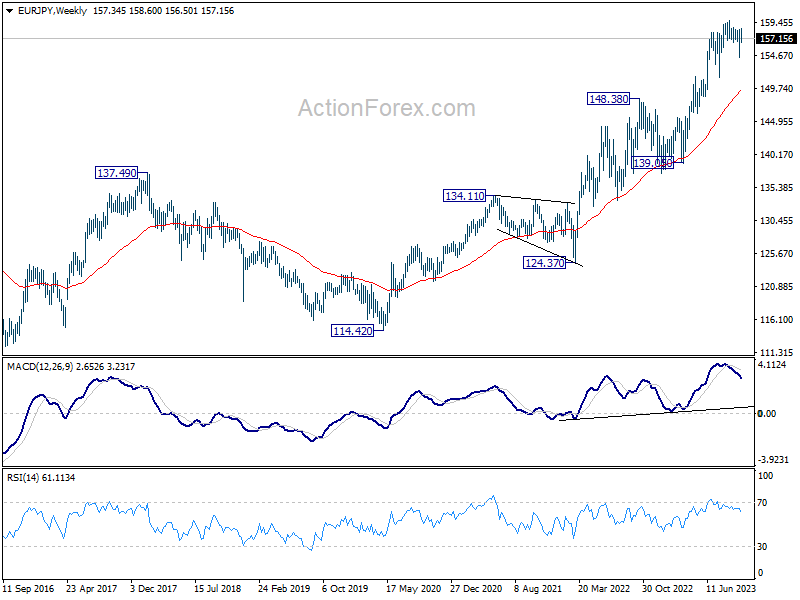
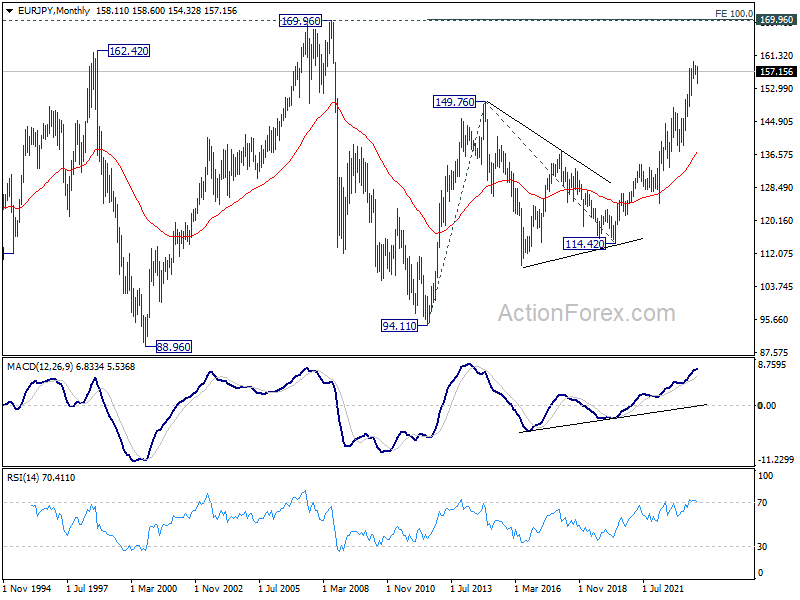
In the long term picture, rise from 109.03 (2016 low) is seen as the third leg of the whole up trend from 94.11 (2012 low). Next target is 100% projection of 94.11 to 149.76 from 114.42 at 170.07 which is close to 169.96 (2008 high).
EUR/GBP Weekly Outlook
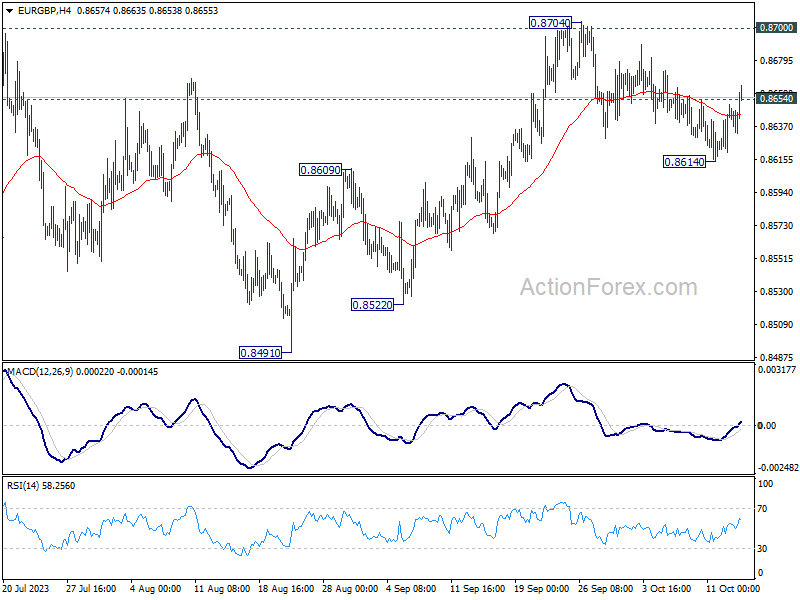
EUR/GBP rebounded strongly after initial dip to 0.8614 last week. Corrective pull back from 0.8704 could have completed, after drawing support from 55 D EMA (now at 0.8621). The development revives near term bullish ness that rise from 0.8491 is still in progress. Initial bias is back on the upside for retesting 0.8700/4 resistance zone. Decisive break there will carry larger bullish implications. Nevertheless, break of 0.8614 will turn bias to the downside to resume the fall from 0.8704 instead.
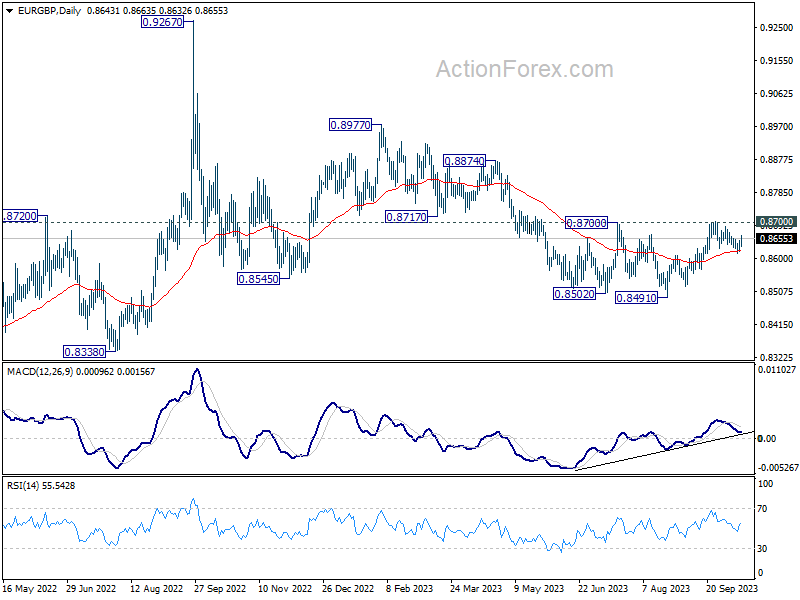
In the bigger picture, the down trend from 0.9267 (2022 high) is seen as part of the long term range pattern from 0.9499 (2020 high). Decisive break of 0.8700 resistance will argue that this decline has completed with three waves down to 0.8491. Rise from 0.8491 could then be another leg inside the pattern and targets 0.8977 and above. However, rejection by 0.8700 will keep the down trend alive for another fall through 0.8491 at a later stage.
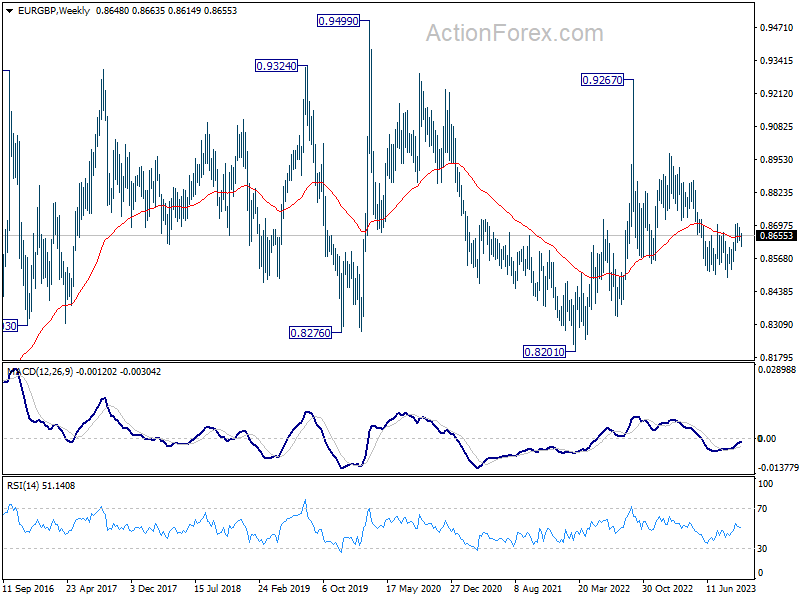
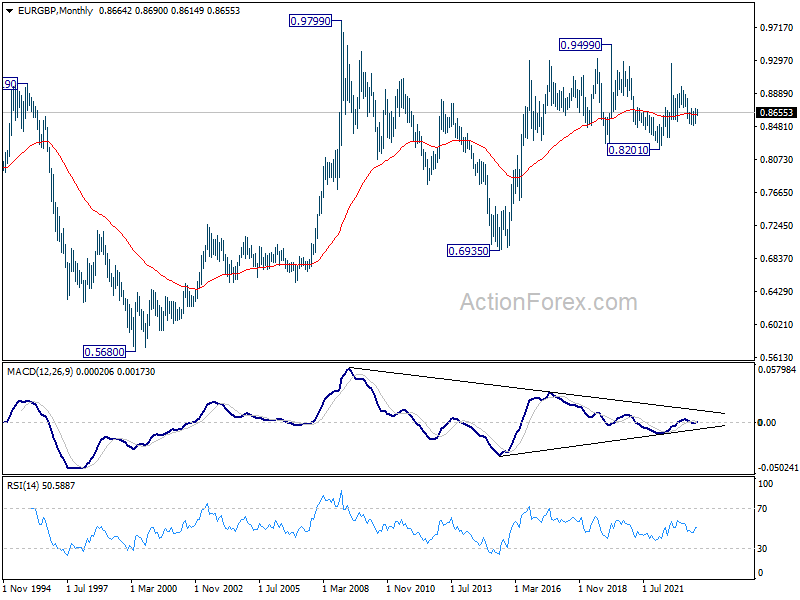
In the long term picture, long term range pattern is extending. But rise from 0.6935 (2015 low) is expected to resume at a later stage, to 0.9799 (2009 high).
EUR/AUD Weekly Outlook
EUR/AUD's rebound from 1.6319 resumed last week, and the development suggests that corrective fall from 1.7062 has completed, after drawing support from medium term trend line. Initial bias stays on the upside this week for retesting 1.7062 high. For now, risk will stay on the upside as long as 1.6442 support holds, in case of retreat.
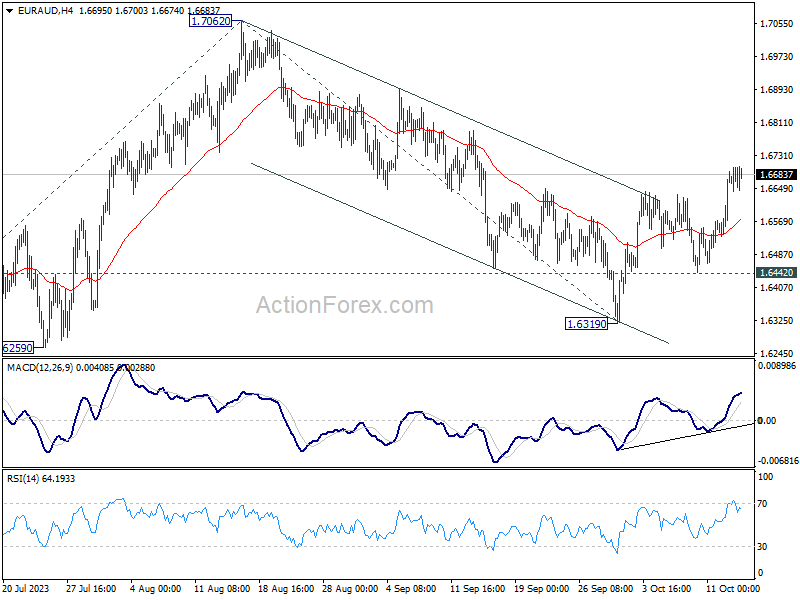
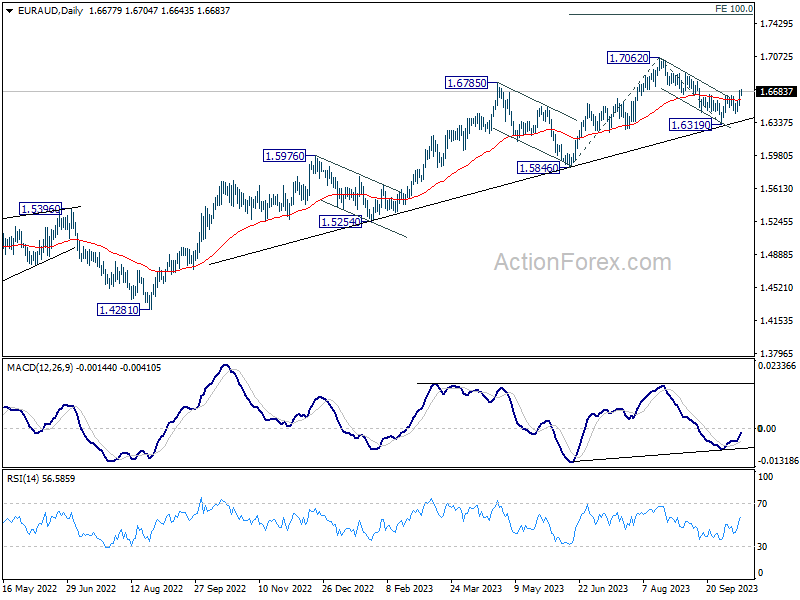
In the bigger picture, the strong support from medium term rising trend line indicates that rise from 1.4281 (2022 low) is still in progress. On resumption, next target is 100% projection of 1.5846 to 1.7062 from 1.6319 at 1.7353. In any case, outlook will stay bullish as long as 1.6319 support holds.
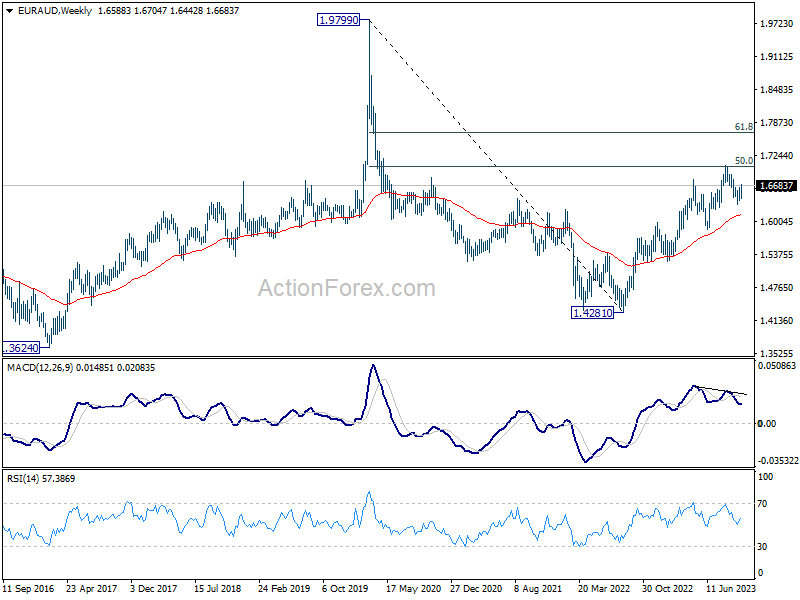
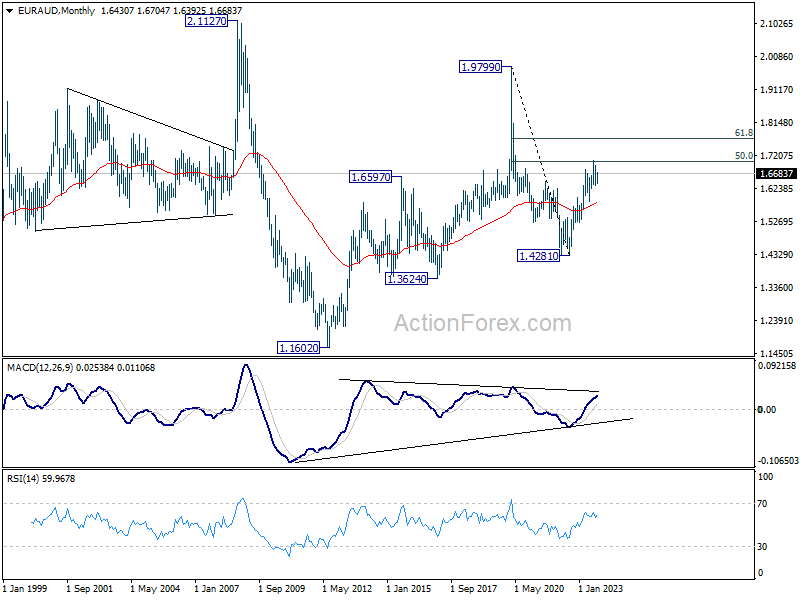
In the longer term picture, loss of upside momentum as seen in 55 W MACD at this stage argues that rise from 1.4281 (2022 low) is more likely a corrective move. Further rise could still be seen as long as 1.5846 support holds. But upside will likely be limited by 61.8% retracement of 1.9799 to 1.4281 at 1.7691. Firm break of 1.5846 support will argue that the rise has completed, and another medium term down leg has started.
EUR/CHF Weekly Outlook
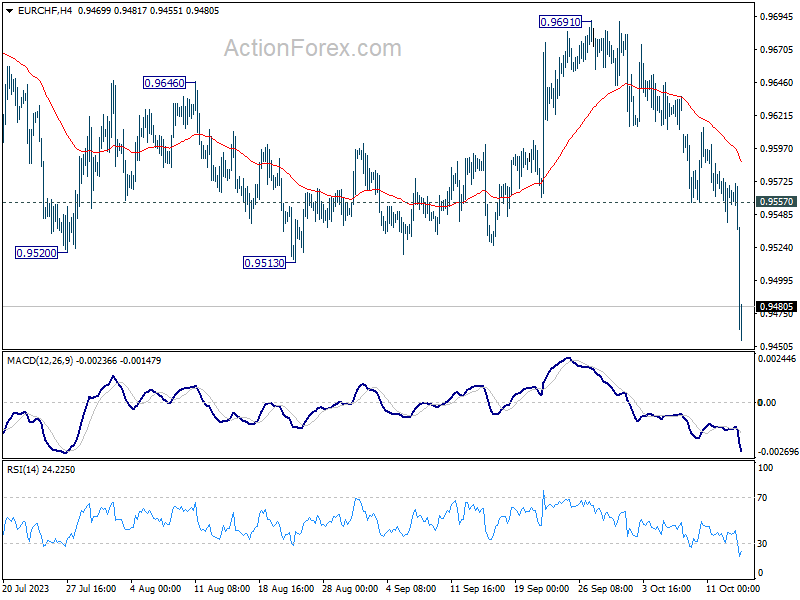
EUR/CHF's decisive break of 0.9513 support last week confirms resumption of whole down trend from 1.0095. Initial bias remains on the downside this week for retesting 0.9407 medium term bottom. On the upside, break of 0.9557 resistance is needed to be the first sign of short term bottoming. Otherwise, risk will stay on the downside in case of recovery.
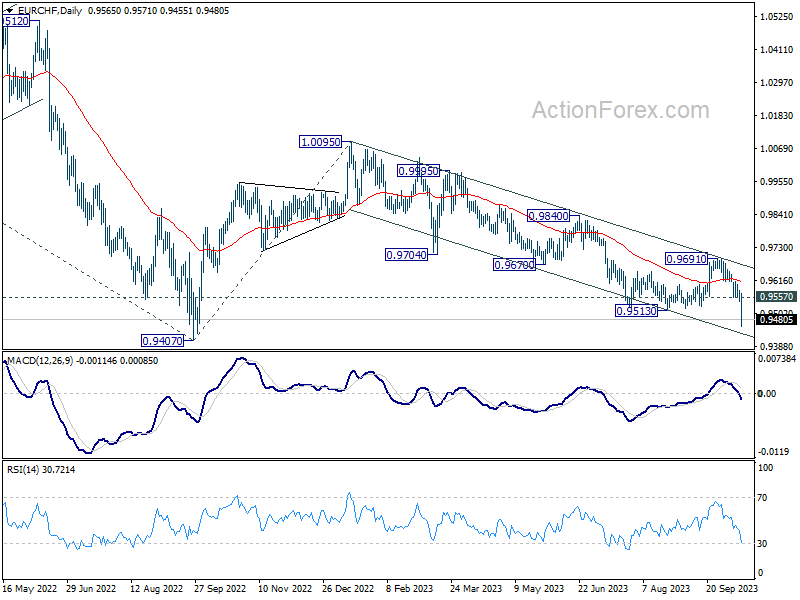
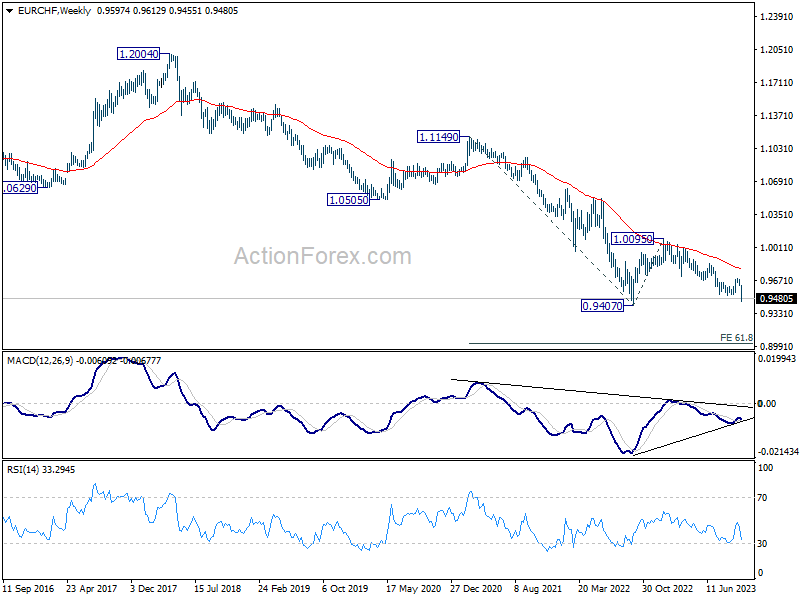
In the bigger picture, medium term outlook remains bearish with the cross capped well below falling 55 W EMA (now at 0.9782). Firm break of 0.9407 (2022 low) will confirm resumption of larger down trend from 1.2004 (2018 high). Next target will be 61.8% projection of 1.1149 to 0.9407 from 1.0095 at 0.9018. On the upside, break of 0.9691 resistance is needed to indicate medium term bottoming. Otherwise, outlook will stay bearish.
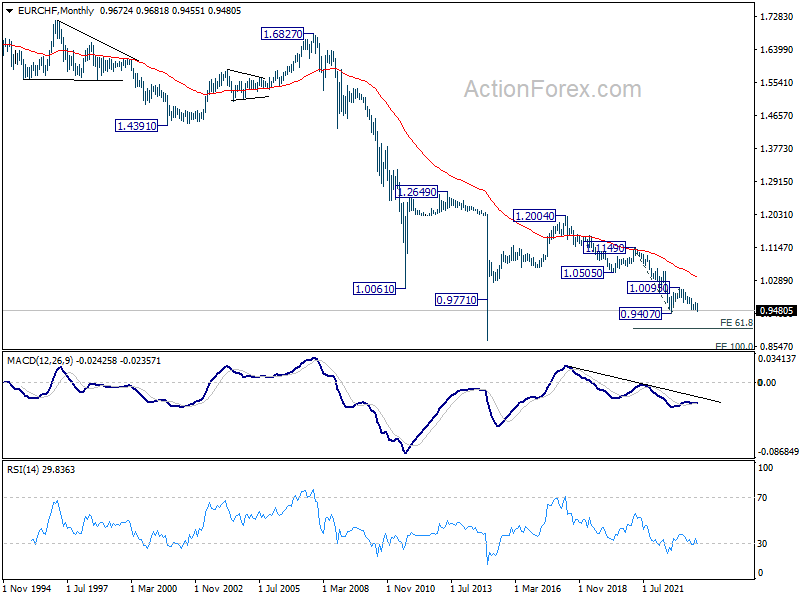
In the long term picture, outlook remains bearish as it's staying well below 55 M EMA (now at 1.0362). Break of 1.0095 resistance is needed to be the first sign of bottoming, or the multi-decade down trend is expected to continue.
The Weekly Bottom Line: Goodbye “How High”, Hello “How Long”
U.S. Highlights
- U.S. bond yields retreated from highs reached last week, as heightened geopolitical risks in the Middle East boosted investors demand for safe haven assets.
- However, the recent overall surge in yields has prompted some Fed members to pay closer attention to tightening financial conditions as they determine the most appropriate policy path for interest rate.
- Both producer prices and consumer prices suggest that the Fed still has some work to do to ensure inflation gets back to target, even as core prices continue to moderate.
Canadian Highlights
- The countdown to the Bank of Canada’s October 25th policy meeting is on, with recent data making the hike/no hike decision a close call.
- Investors are awaiting Canadian CPI data next week, which is unlikely to show much progress with the three-month rate of core inflation accelerating recently.
- The housing market continues to slide. With sales activity down and listing starting to jump, house prices continue to decline.
U.S. – Goodbye “How High”, Hello “How Long”
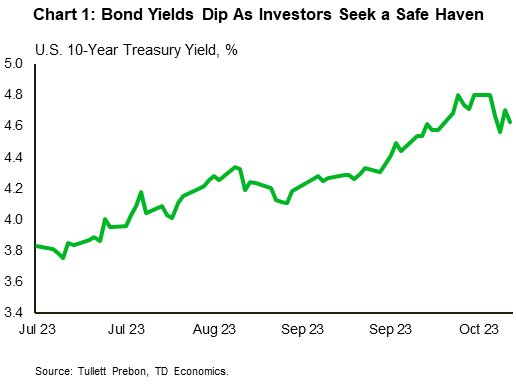
Last week’s tight financial conditions abated a bit this week, as conflict in the Middle East boosted demand for safe haven assets. As such, the 10-year Treasury yield took a reprieve from its upward trek and at the time of writing was down 17 basis points (bps) relative to the end of last week (Chart 1). Nonetheless, yields are still up 76 bps since July 26 when the Fed last raised the policy rate. Several factors have contributed to rising bond yields over the past few months including expectations of higher for longer interest rates and concerns about energy supply and prices.
The relatively higher yields have prompted some Fed officials to acknowledge that higher longer-term yields may be helping to achieve their policy objective. Dallas Fed President Lorie Logan remarked that “if long-term interest rates remain elevated because of higher term premiums, there may be less need to raise the fed-funds rate.” Similar sentiments were echoed by Fed governor Christopher Waller who said that “financial markets are tightening up and they are going to do some of the work for us”. Fed Vice Chair Philip Jefferson said that he would “remain cognizant of the tightening in financial conditions through higher bond yields” when assessing the path for interest rates. That sentiment was also echoed by Minneapolis Fed president Neel Kashkari.
The minutes released from the Fed’s September meeting revealed that, prior to the most recent run-up in bond yields, a “majority” of FOMC participants believed that another rate increase might be appropriate, while only “some” viewed no further increases as necessary. The tone of the minutes, economic projections and policy guidance was hawkish with Fed members expecting rates to be kept higher for even longer. This was reflected in a shallower path of expected rate cuts (FOMC commentary). Additionally, “several” participants commented that the Fed’s focus should be transitioning to how long to maintain restrictive policy, rather than how high to raise rates. Ultimately, all participants were in favor of maintaining restrictive policy for some time to ensure that inflation remains on a sustainable path downwards.
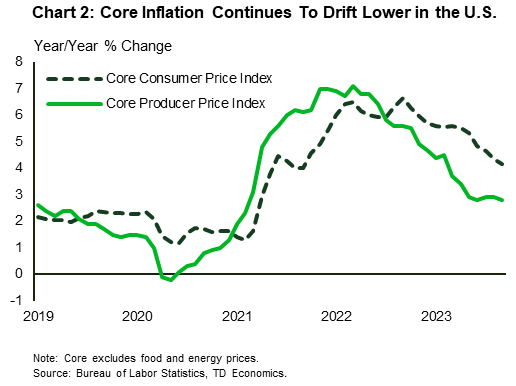
Both headline measures of producer prices (PPI) and consumer prices (CPI) show that the inflation battle is not quite over. On a yearly basis, PPI accelerated in September, while CPI held steady. The movements largely reflected gains in food and energy prices. Stripping out these volatile segments, core prices for both measures edged lower (Chart 2). While the downward tilt to core prices is sure to be welcomed by the Fed, rates are still too high for comfort given that near-term inflation expectations have inched higher in recent months and the labor market remains resilient.
American small businesses are also feeling less optimistic as expectations regarding the economic outlook and credit conditions deteriorated in September. Several firms noted that the Fed’s aggressive hiking campaign is weighing on credit with a net 26% of borrowers reporting paying higher interest rates versus three months ago. Nonetheless, the Fed will need to see a meaningful cooling in the jobs market and a sustained reduction in inflation, before shifting policy stance. As such, higher for longer may be around for some time.
Canada – Housing Slumps, With Inflation In Focus
The countdown to the Bank of Canada's (BoC's) October 25th policy meeting is on. While the Bank will be weighing the recent strength in the labour market alongside still stubbornly high inflation, the cracks forming in consumer spending and further weakness emanating from the housing market make the hike/no hike decision a tougher call. This had bond markets on a rollercoaster this week, as investors try to pin down what the BoC will do next.
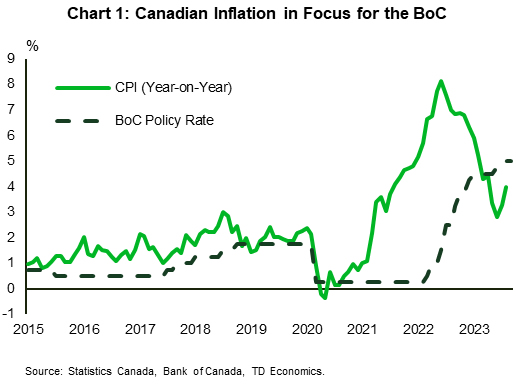
One report that could sway the BoC's hand is Canadian CPI released next week (Chart 1). The trend has not been a friend of the BoC lately. Consumer price inflation hit 4.0% year-on-year (y/y) in August, up from 3.3% y/y in July. While the headline number will get a lot of the media attention, the BoC will be looking at core inflation measures, which strip out more volatile price swings to get at underlying inflation trends. In August, the average of the Bank's trimmed mean and median inflation rates surprisingly increased to 4.0% y/y (from 3.8% y/y). The underlying trend here is also worrying. On a three-month annualized basis, the average of trimmed mean and median are clocking in at 4.5%. This signals that the annual core inflation rates might continue to show an upward bias in the coming months.
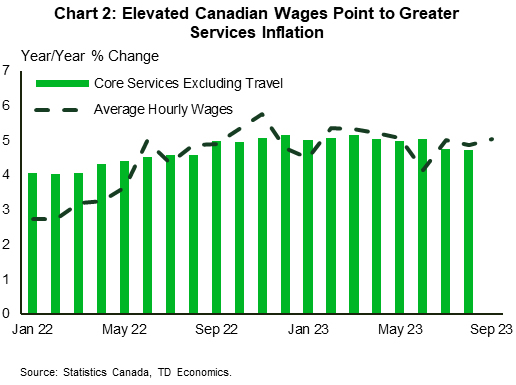
A mixture of services and goods inflation have been driving the momentum in core inflation recently. As our regular readers know, underlying services inflation (supercore) has been flying high on the back of persistently strong wage gains. Save for the discounting in airfares and travel relative services, supercore inflation has been running at an average pace of 5% for over a year now (Chart 2). With wages continuing to rise, services inflation is likely to remain elevated. More recently, we have seen core goods inflation starting to creep higher as well. Big purchase items like automobiles, sports/recreation, and household equipment, as well has personal care goods and clothing have seen prices rise once again. Combined with services, this has been a recipe for higher core inflation.
The one area of the economy that has been most responsive to the BoC's past rate hikes has been housing. Following the spring 2023 sales surge, the BoC's June and July rate hikes have pushed mortgage rates up by over 1 percentage point. This has not only forced many buyers to question whether to jump into the market, but has resulted in a large increase in the number of listings. Today's data have added to the negative trend, with sales down 9% since the June 2023 peak. With listings rising 35% since the spring, the sales-to-listings ratio is now at 51.4% (from 67.8% in April). The move away from a sellers' market has pushed house prices lower by 5.2% in the last four months.
For the BoC, the slowdown in the housing market shouldn't come as a surprise. This is the one area where the BoC's actions have the most impact. But as Governor Macklem said today, the BoC is "looking for clear signs that core inflation" is coming down. The issue here is that prior labour market strength will continue to push wages upwards, keeping inflation and the risk of another rate hike too high for comfort.