

Sample Category Title
Technical Outlook and Review
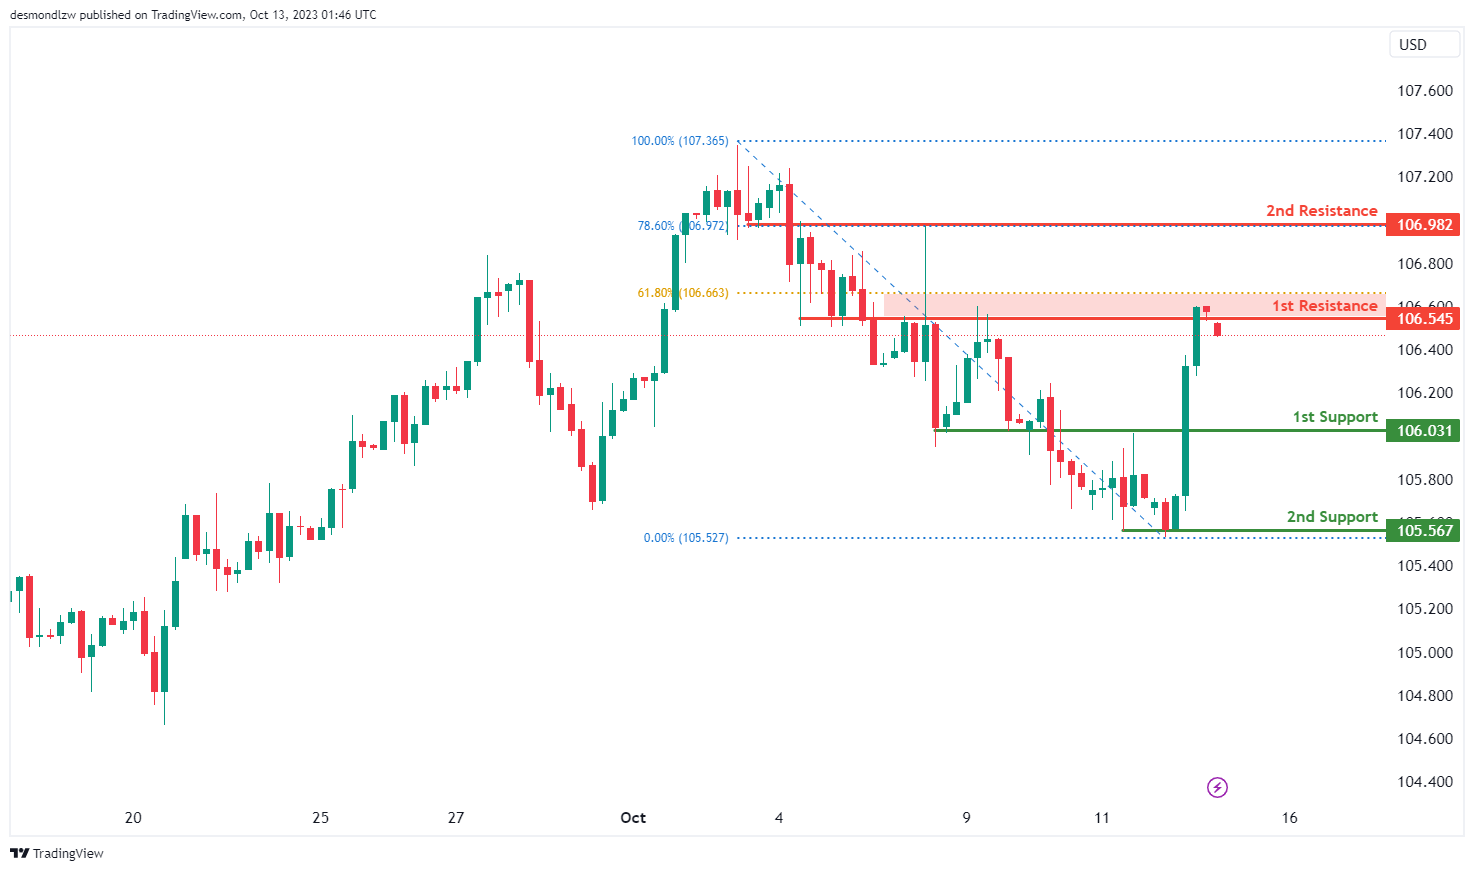
DXY:
The DXY chart currently exhibits a bearish overall momentum, suggesting the potential for a bearish continuation towards the 1st support level.
The 1st support at 106.03 is identified as a pullback support, signifying its historical relevance as a level where price has previously found buying interest. Additionally, the 2nd support at 105.56 serves as a swing low support, further reinforcing its potential significance in providing support to falling prices.
On the resistance side, the 1st resistance level at 106.54 is characterized as an overlap resistance. This level is notable for its historical role as a barrier to upward price movement. Furthermore, the 2nd resistance at 106.98 is another overlap resistance and coincides with the 78.60% Fibonacci Retracement level, indicating a potential area of strong resistance.
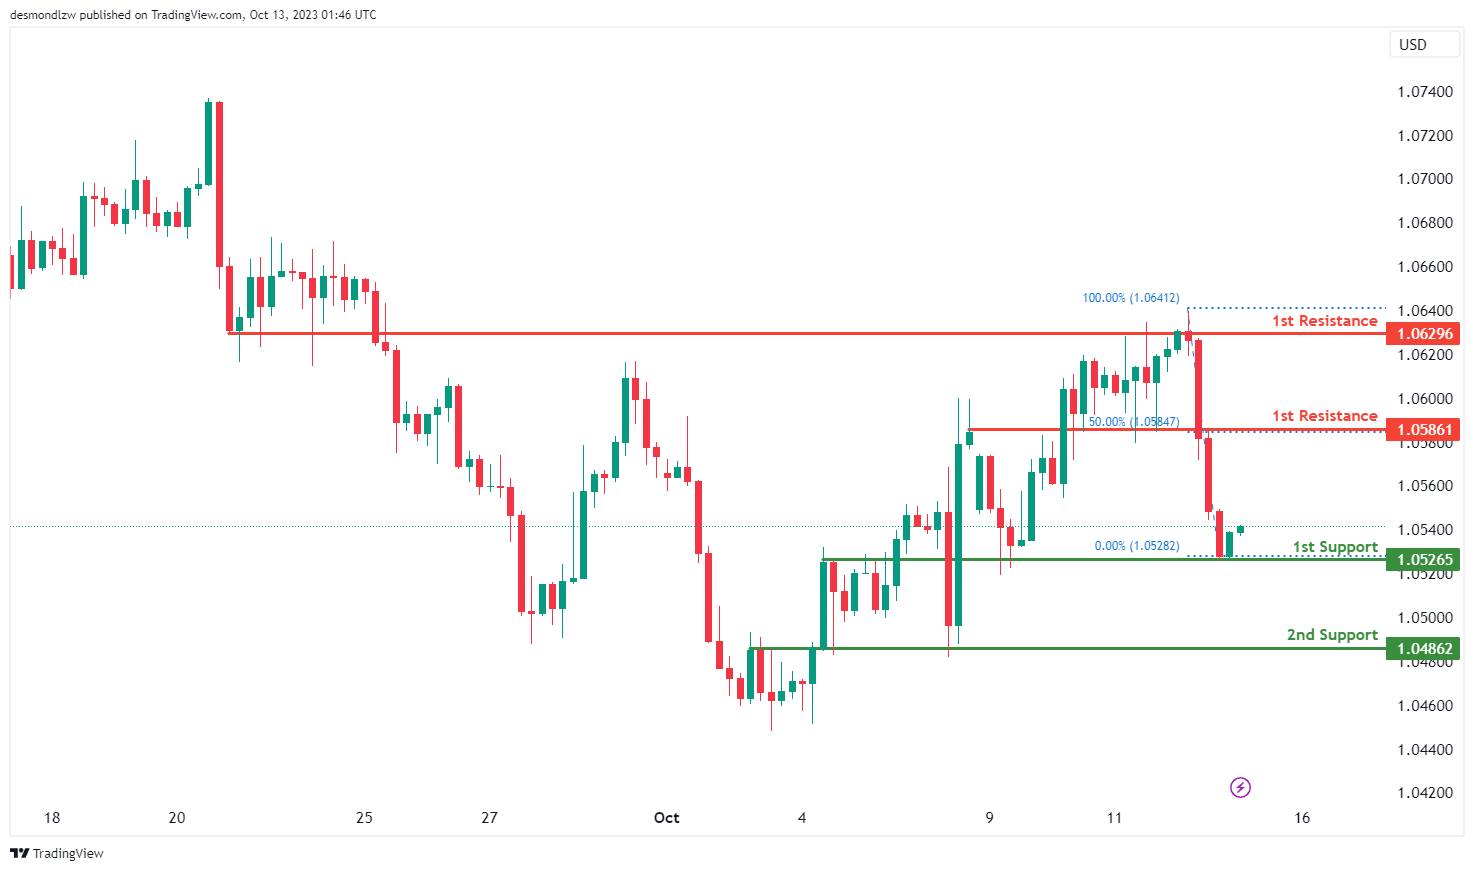
EUR/USD:
The EUR/USD chart is currently displaying a bullish overall momentum with the potential scenario of a bullish continuation towards the 1st resistance.
The 1st support at 1.0526 is characterized as an overlap support, signifying its historical significance as a level where buying interest has previously emerged. Adding to this support, the 2nd support at 1.0486 also serves as an overlap support, further reinforcing the potential for price support in this area.
On the resistance side, the 1st resistance level at 1.0586 is identified as an overlap resistance, which may act as a substantial barrier to further price advances. Additionally, the 2nd resistance at 1.0629 is another overlap resistance and aligns with the 50% Fibonacci Retracement level, making it an important level of potential resistance.
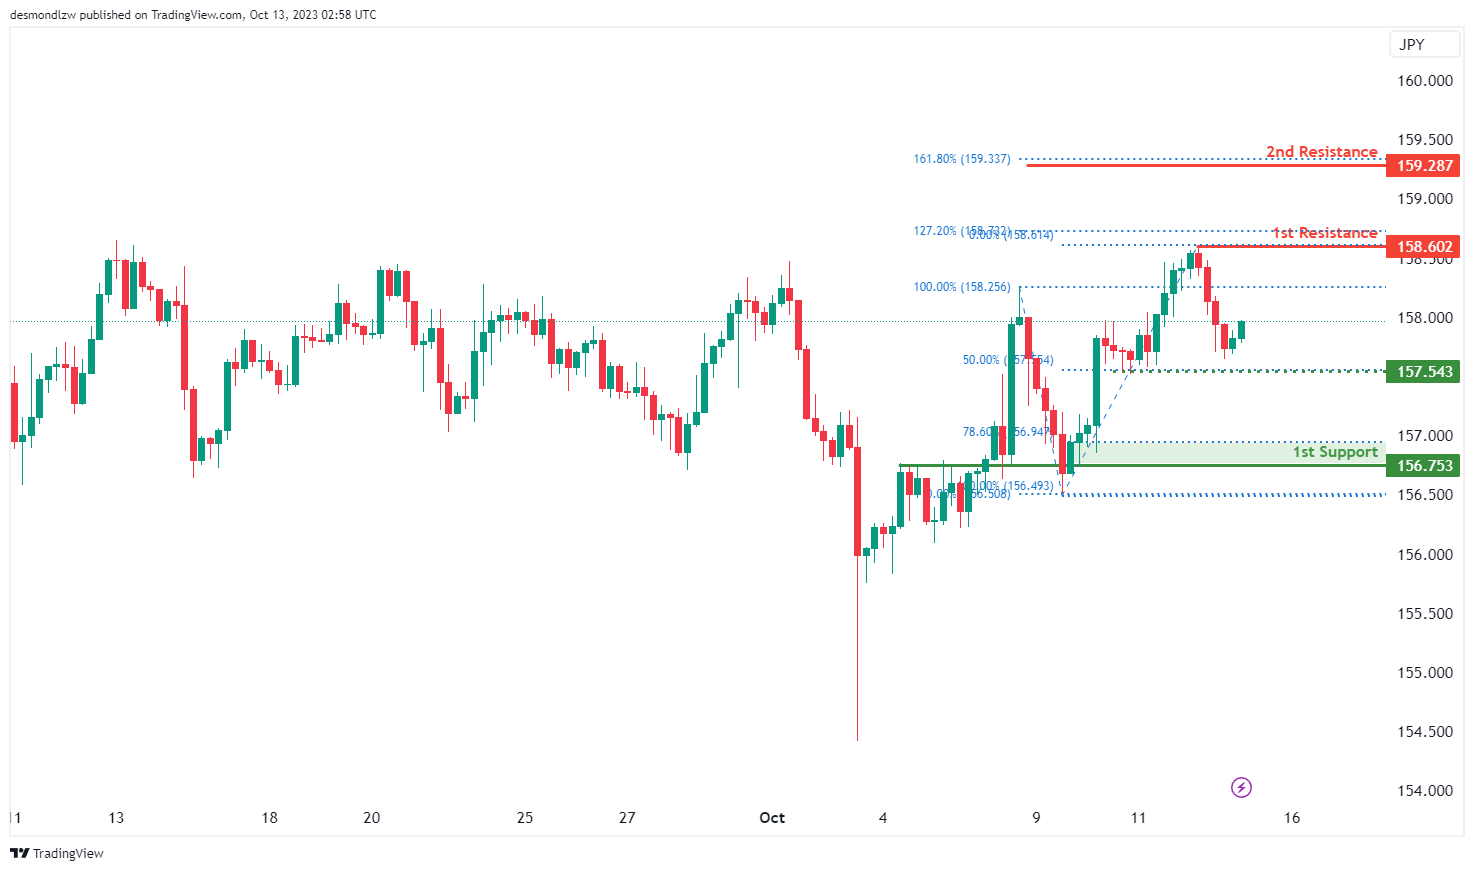
EUR/JPY:
The instrument we are analyzing is EUR/JPY, and the overall momentum of the chart suggests a bullish trend.
There is a possibility that the price may continue in a bullish direction, potentially reaching the resistance level.
The 1st support level is at 156.75, and it’s considered strong because it represents an overlap of support and aligns with a 78.60% Fibonacci Retracement.
There is also an intermediate support level at 157.54, which is significant due to its role as a multi-swing low support and aligning with a 50% Fibonacci Retracement.
On the resistance side, the 1st resistance level is at 158.60, and it’s noteworthy because it represents a swing high resistance and is accompanied by a 127.20% Fibonacci Extension.
The 2nd resistance level is at 159.28, and it’s significant as well, as it corresponds to a 161.80% Fibonacci Extension.
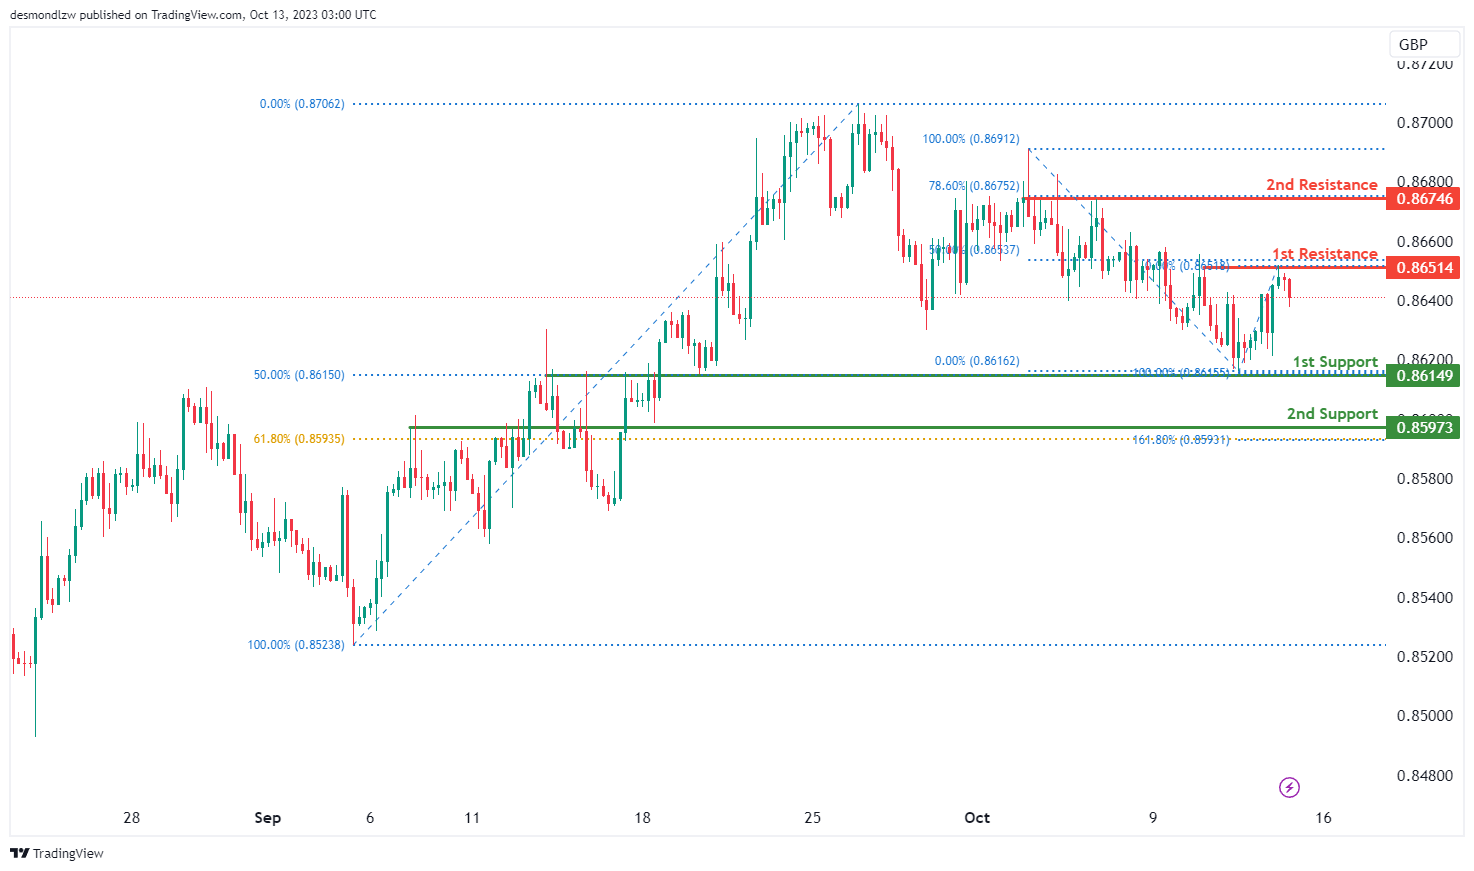
EUR/GBP:
The instrument we are examining is EUR/GBP, and the overall momentum of the chart indicates a bearish trend.
There is a possibility that the price may continue in a bearish direction, potentially reaching the support level.
The 1st support level is at 0.8614, and it’s considered strong because it represents an overlap of support and is associated with a 50% Fibonacci Retracement.
The 2nd support level is at 0.8597, and it’s also significant as it marks another overlap of support and coincides with a 61.80% Fibonacci Retracement and a 161.80% Fibonacci Extension, indicating a Fibonacci confluence.
On the resistance side, the 1st resistance level is at 0.8651, and it’s noteworthy because it represents a multi-swing high resistance and is accompanied by a 50% Fibonacci Retracement.
The 2nd resistance level is at 0.8674, and it’s significant as well, as it functions as a multi-swing high resistance and aligns with a 78.60% Fibonacci Retracement.
GBP/USD:
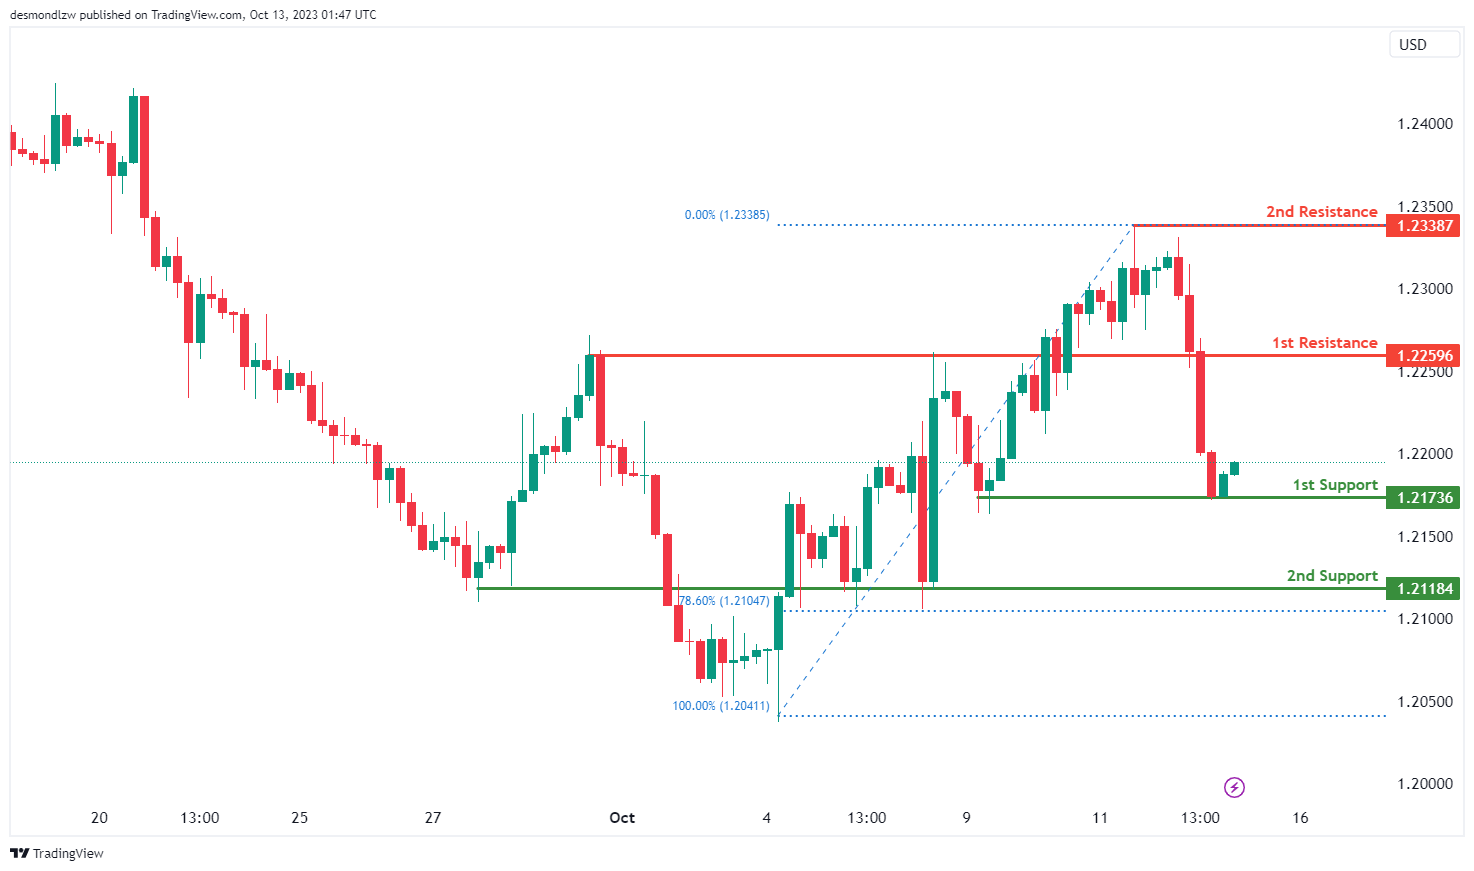
The GBP/USD chart currently maintains a bullish overall momentum, suggesting the potential for a bullish continuation towards the 1st resistance level.
The 1st support at 1.2173 is considered significant as it is identified as a multi-swing low support, indicating that it has previously acted as a level where buyers stepped in to support the price. Additionally, the 2nd support at 1.2118 holds significance as it coincides with the 78.60% Fibonacci Retracement level, further reinforcing its potential as a support level.
On the resistance side, the 1st resistance level at 1.2259 is characterized as a pullback resistance. This level is notable for its historical role as a barrier to upward price movement. Beyond this, the 2nd resistance at 1.2338 is identified as a swing high resistance, indicating a potential area where selling pressure may emerge.
GBP/JPY:
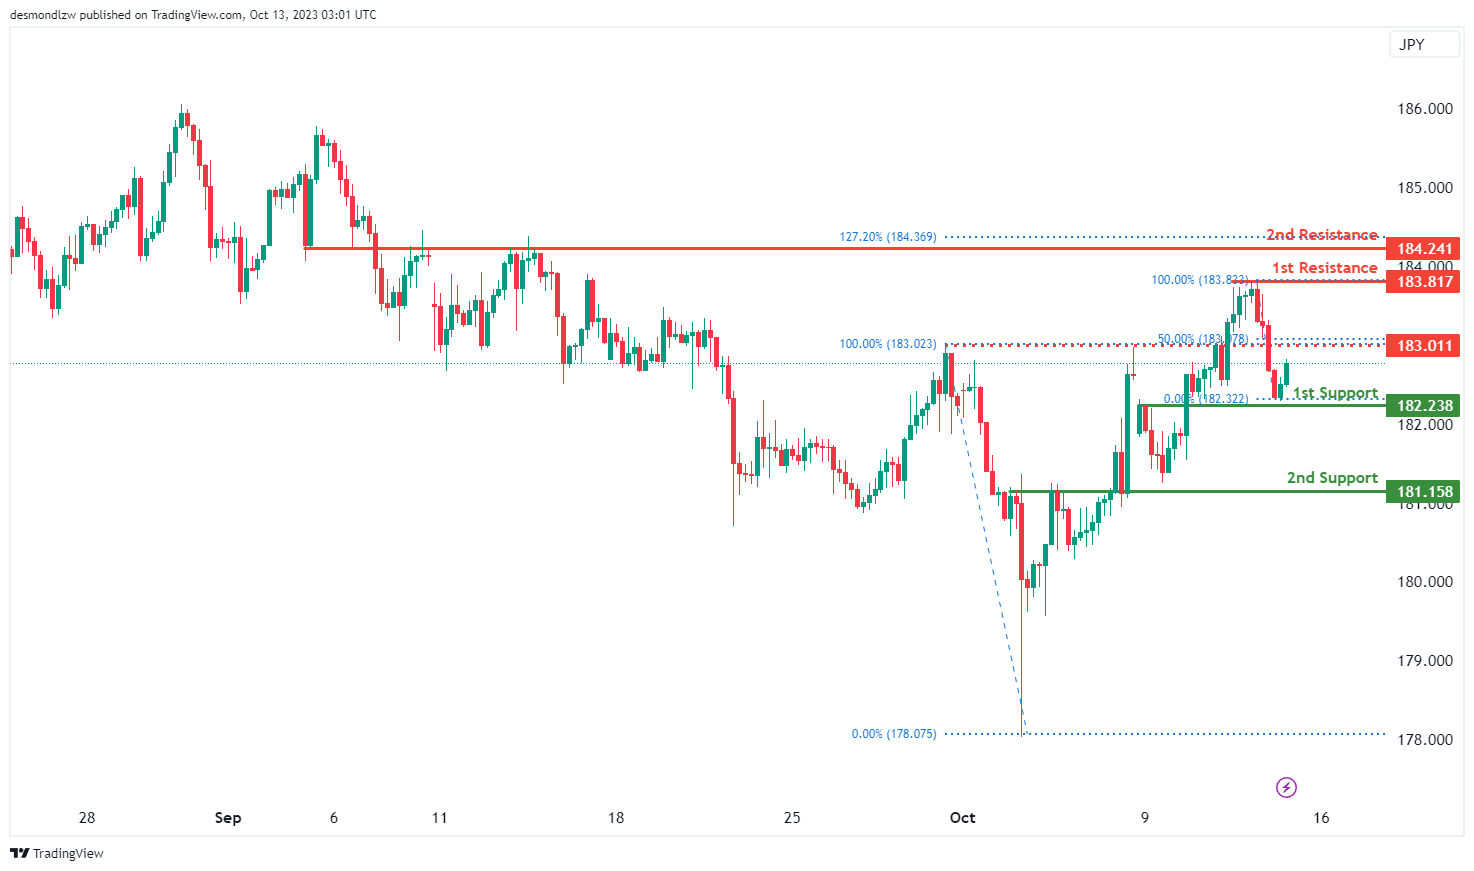
The instrument we are analyzing is GBP/JPY, and the overall momentum of the chart indicates a bullish trend.
There is a possibility that the price may continue in a bullish direction, potentially reaching the resistance level.
The 1st support level is at 182.23, and it’s considered strong because it represents an overlap of support.
The 2nd support level is at 181.15, and it’s also significant as it marks another overlap of support.
On the resistance side, the 1st resistance level is at 183.81, and it’s noteworthy because it represents a multi-swing high resistance.
The 2nd resistance level is at 184.24, and it’s significant as well, as it functions as an overlap resistance and aligns with a 127.20% Fibonacci Extension.
There is also an intermediate resistance level at 183.01, and it’s considered strong because it represents a pullback resistance and coincides with a 50% Fibonacci Retracement.
USD/CHF:
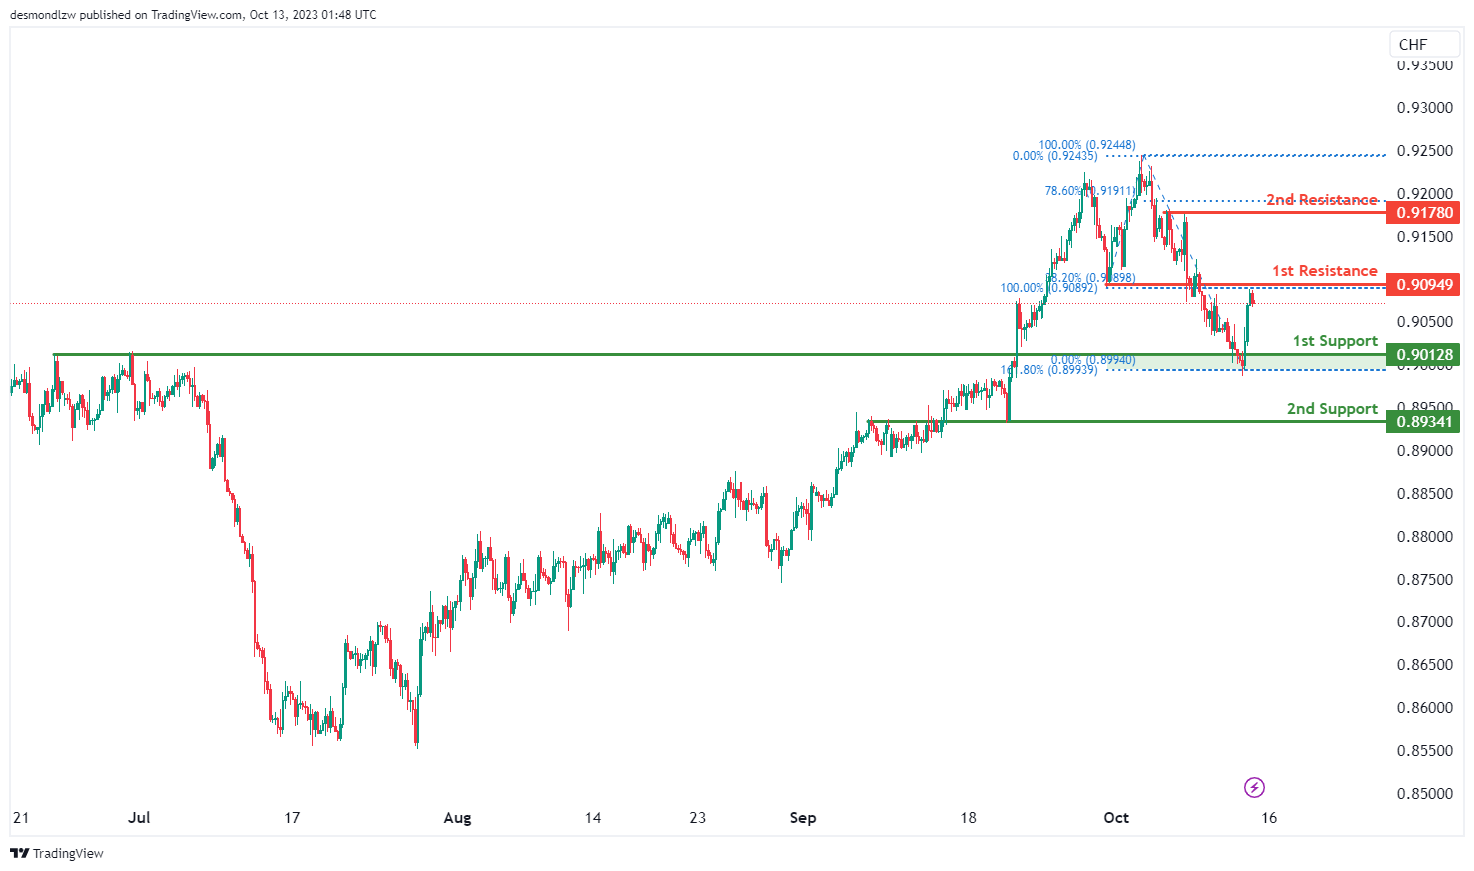
The USD/CHF chart currently exhibits a bearish overall momentum, suggesting the potential for a bearish reaction off the 1st resistance level with a subsequent drop towards the 1st support.
The 1st support at 0.9012 is considered significant as it is identified as an overlap support and coincides with the 161.80% Fibonacci Extension level. This level has the potential to act as a price floor, as it represents both historical support and a Fibonacci extension level.
The 2nd support at 0.8934 is also an overlap support level, further reinforcing its significance as a potential area where buyers might step in to support the price.
On the resistance side, the 1st resistance level at 0.9094 is characterized as an overlap resistance and coincides with the 38.20% Fibonacci Retracement level. This level is likely to pose a significant barrier to upward price movement. Beyond this, the 2nd resistance at 0.9178 is identified as a multi-swing high resistance, indicating a zone where selling pressure may intensify.
USD/JPY:
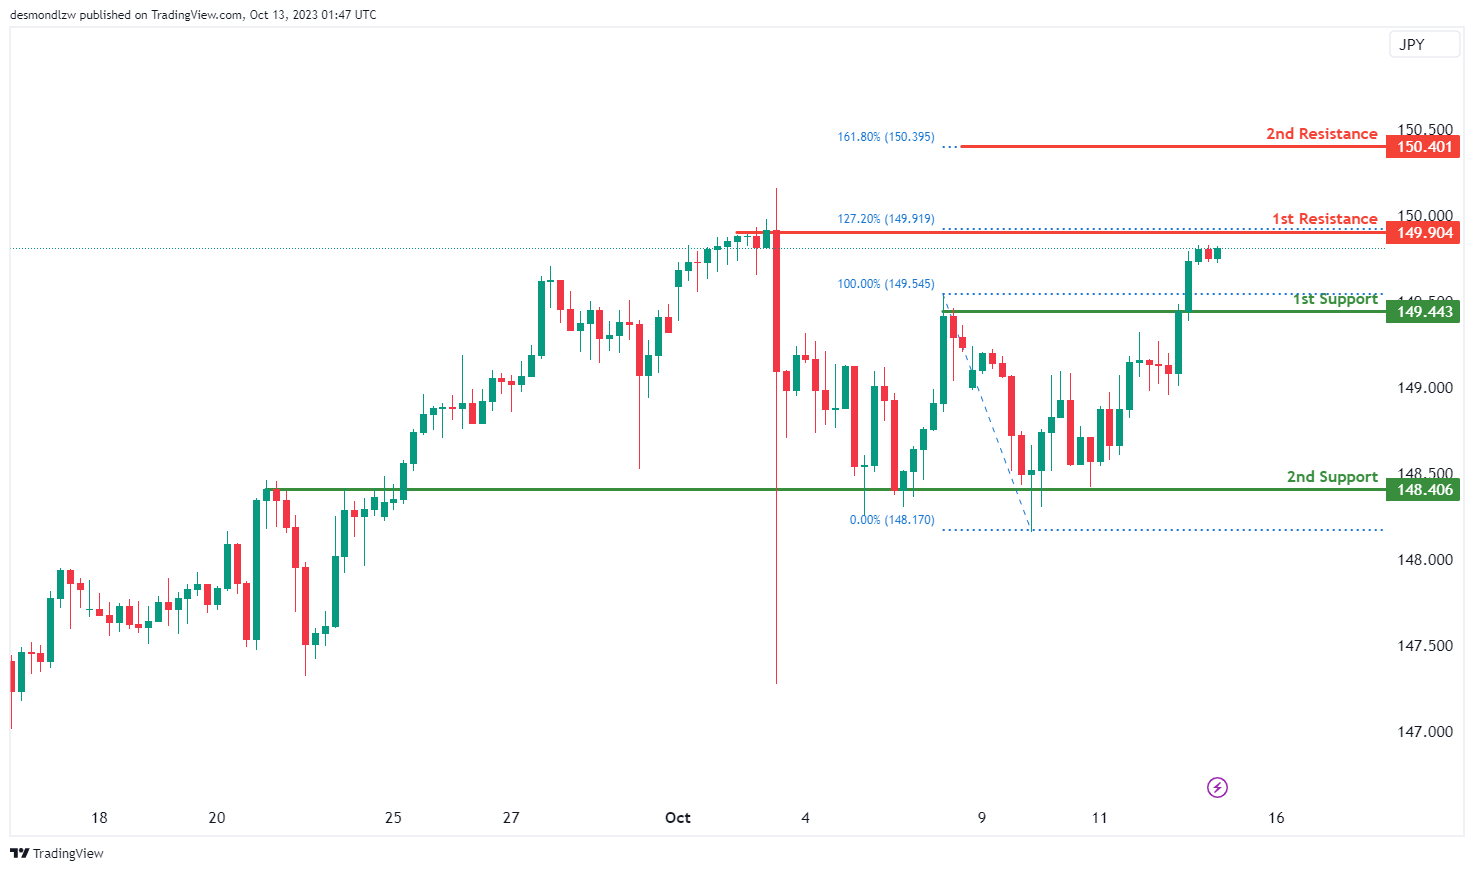
The USD/JPY chart currently reflects a bullish overall momentum, indicating the possibility of a bullish continuation towards the 1st resistance.
At 1st support, which stands at 149.44, we observe a substantial level of historical significance as a pullback support. This level has previously demonstrated its ability to provide support during pullback phases. The 2nd support, situated at 148.40, is equally noteworthy as an overlap support. Its presence reinforces the potential support zone and adds weight to its significance in price analysis.
On the resistance side, the 1st resistance level at 149.90 is notable due to its alignment with a multi-swing high resistance and the 127.20% Fibonacci Extension level. This convergence of resistance factors suggests that this level is likely to act as a formidable barrier to upward price movement. A breakthrough at this level could signal a bullish trend continuation.The 2nd resistance at 150.40 corresponds to the 161.80% Fibonacci Extension level, adding further confluence to this level as a critical resistance zone.
USD/CAD:
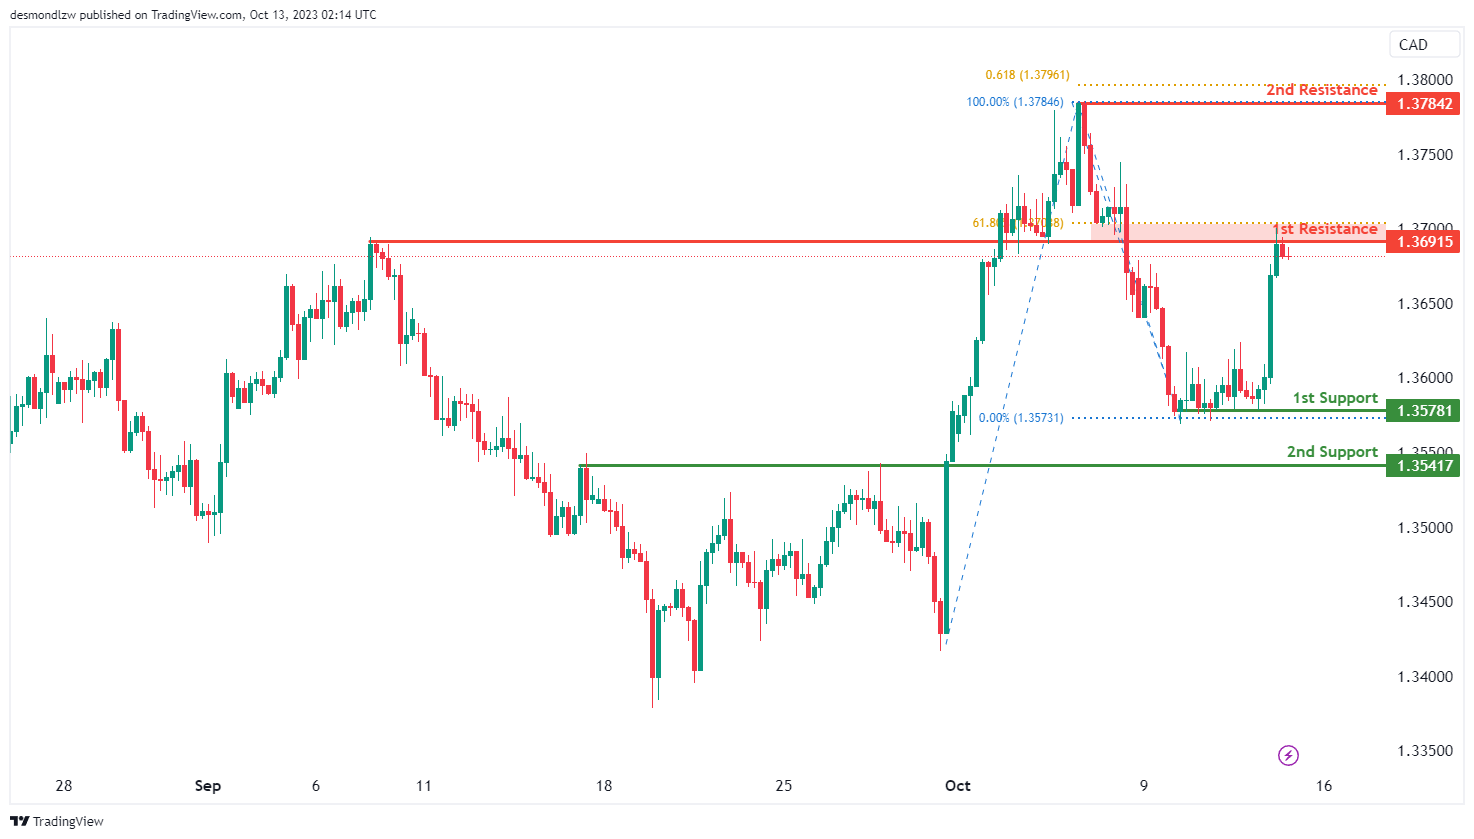
The USD/CAD chart is currently showing an overall bullish momentum with a potential scenario for price to make a bullish continuation towards the 1st resistance level.
The 1st resistance at 1.3692 is identified as an overlap resistance that aligns close to the 61.80% Fibonacci retracement level. Higher up, the 2nd resistance level at 1.3784 is marked as a swing-high resistance that aligns close to the 61.80% Fibonacci projection level, further emphasizing its significance as a barrier for future price increases.
To the downside, the 1st support level at 1.3578 is identified as a pullback support. Additionally, the 2nd support level at 1.3542 is also noted as a pullback support, further reinforcing its significance as an area where the price may find support.
AUD/USD:
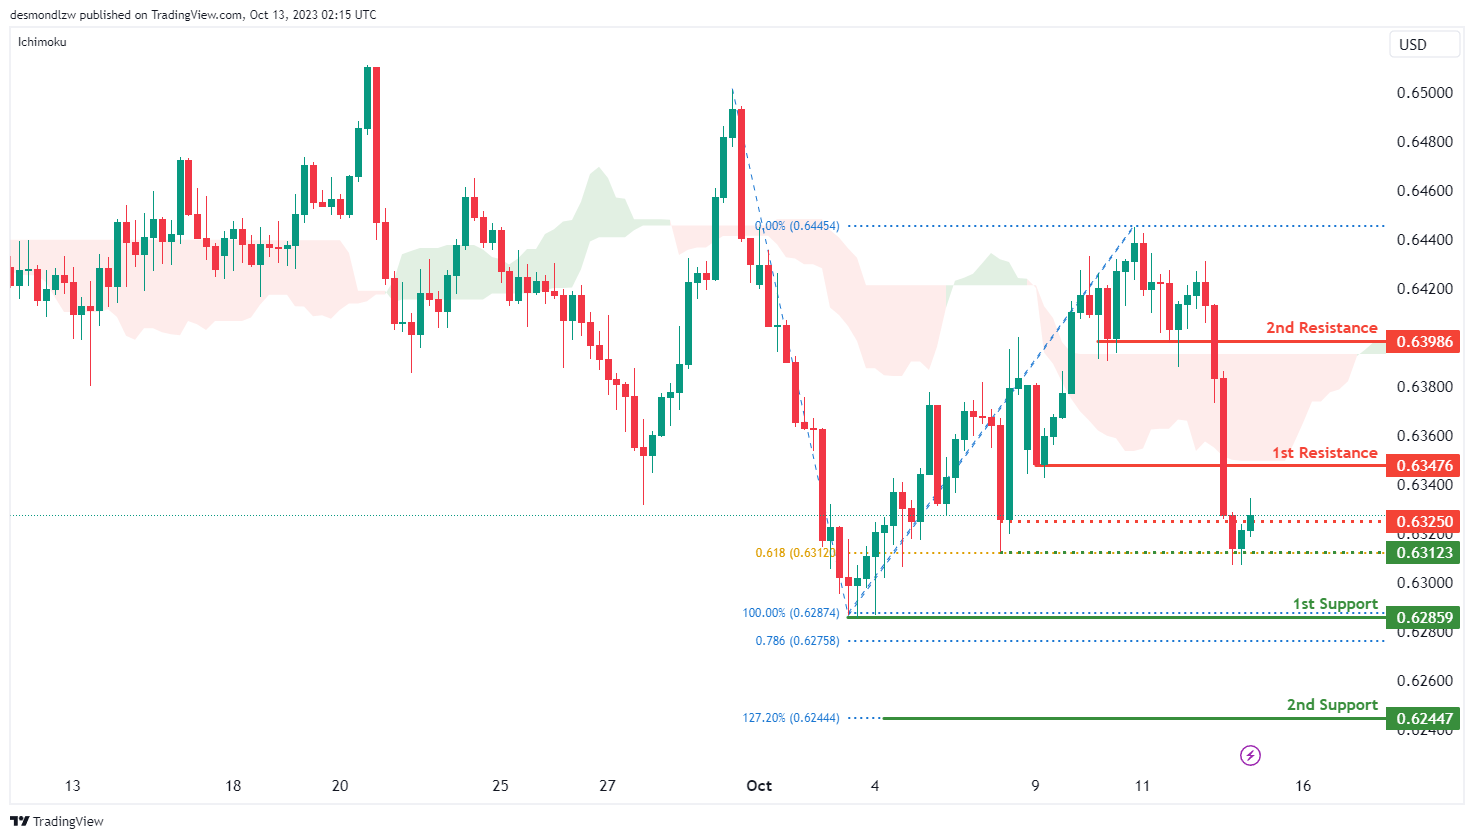
The AUD/USD chart currently exhibits an overall bearish momentum with a potential scenario for price to make a bearish continuation towards the 1st support level should price break below the intermediate support level.
The intermediate support level at 0.6312 is identified as a pullback support that aligns with the 61.80% Fibonacci projection level. The 1st support level at 0.6286 is noted as a swing-low support that aligns close to the 78.60% Fibonacci projection level. Further below, the 2nd support level at 0.6245 is marked as a support level that aligns with the 127.20% Fibonacci extension level, reinforcing its importance as a potential support level.
To the upside, the intermediate resistance level at 0.6325 is identified as a pullback resistance. The 1st resistance level at 0.6348 is also noted as a pullback resistance. Additionally, the 2nd resistance level at 0.6399 is marked as another pullback resistance, further emphasizing its significance as a barrier for future price increases.
NZD/USD
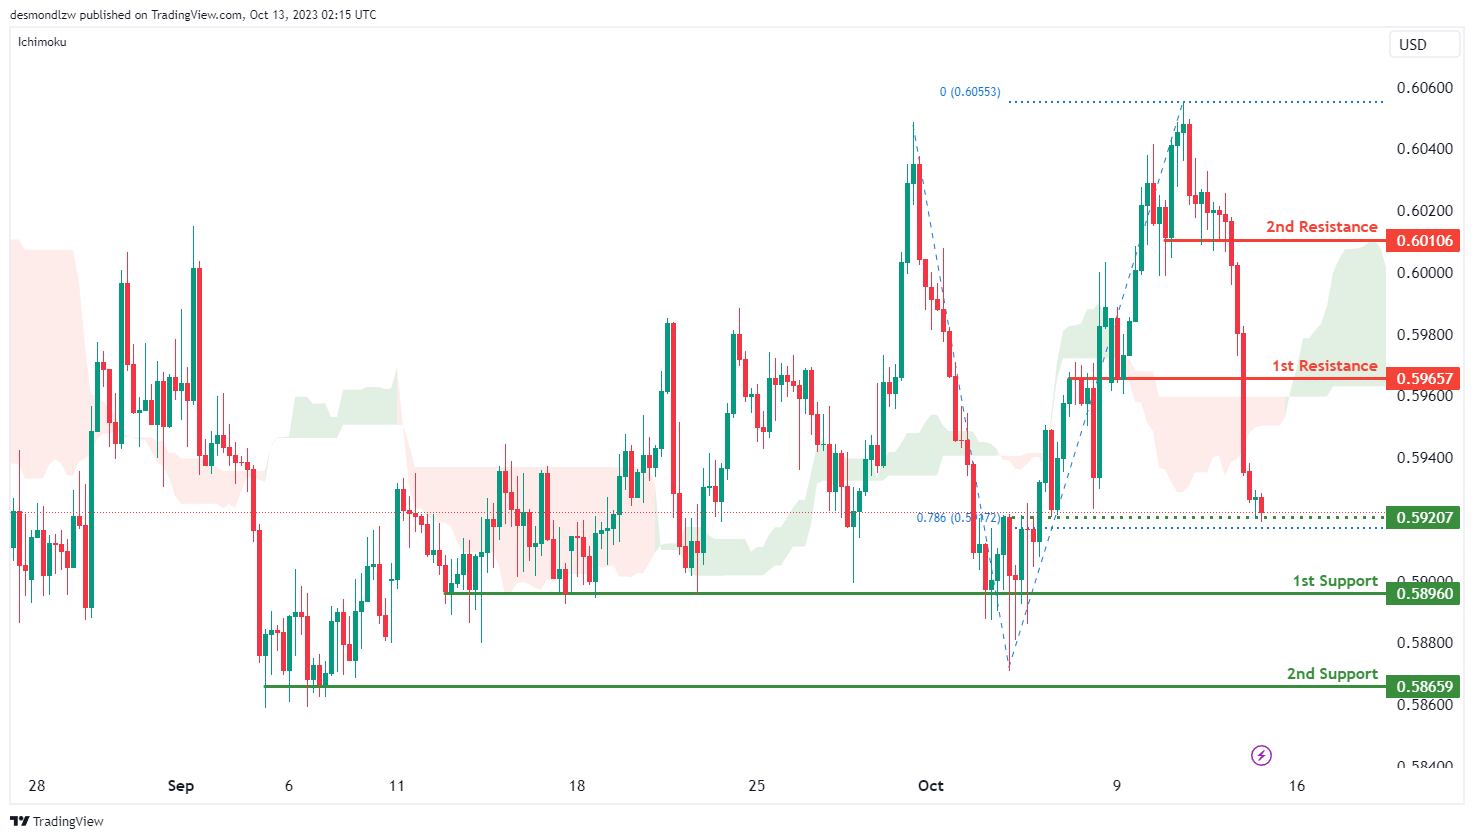
The NZD/USD chart currently exhibits an overall bearish momentum with a potential scenario for price to make a bearish continuation towards the 1st support level should price break below the intermediate support level.
The intermediate support level at 0.5921 is identified as a pullback support that aligns with the 78.60% Fibonacci projection level. The 1st support level at 0.5896 is also noted as a pullback support. Further below, the 2nd support level at 0.5866 is marked as another pullback support, further reinforcing its significance as an area where price may find support.
To the upside, the 1st resistance level at 0.5966 is identified as an overlap resistance. Additionally, the 2nd resistance level at 0.6011 is marked as a pullback resistance, further emphasizing its significance as a barrier for future price increases.
DJ30:
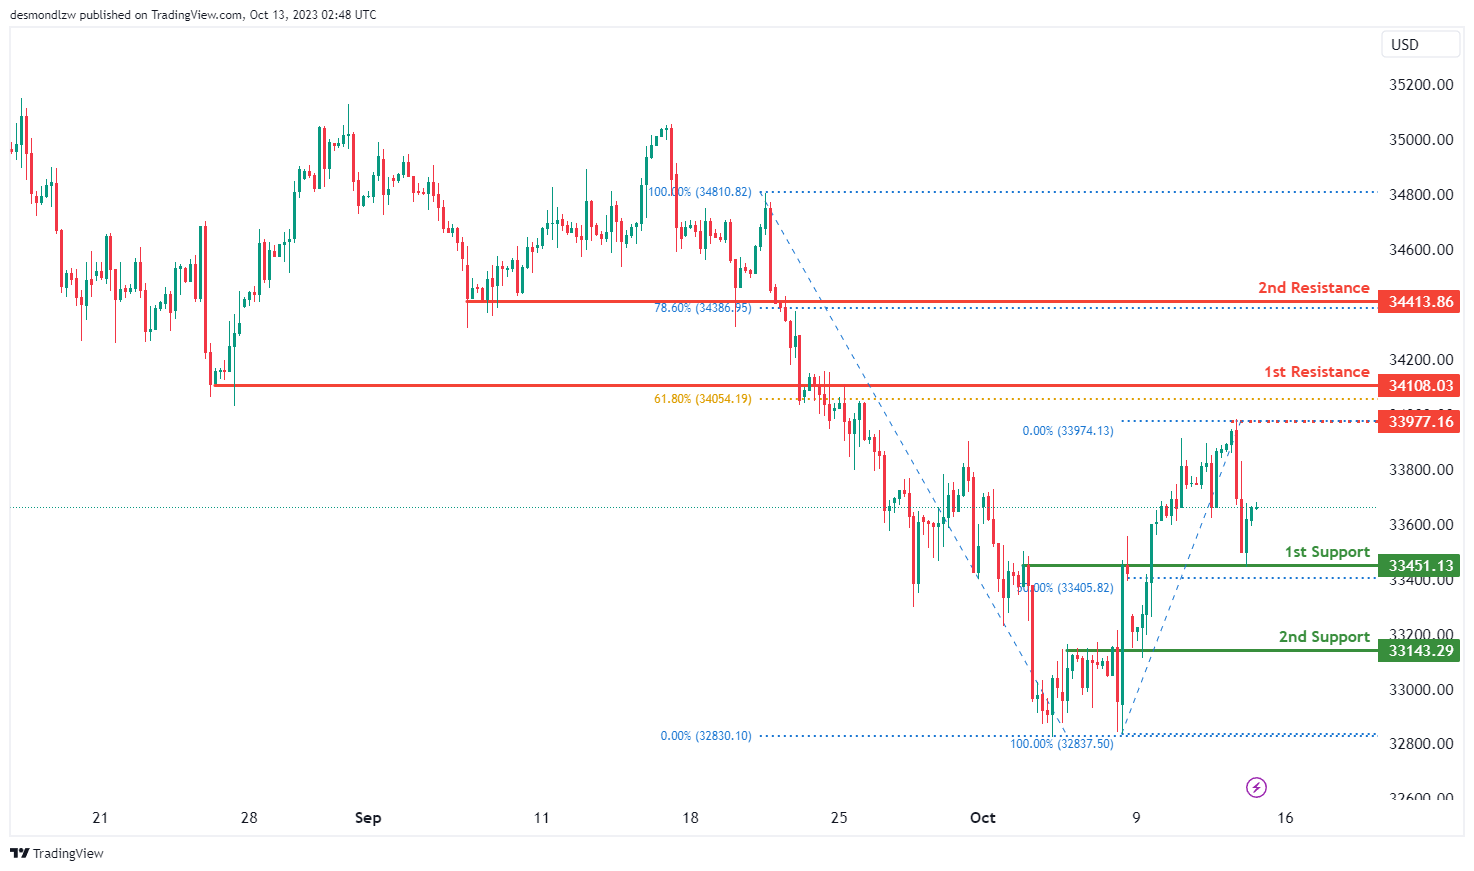
The instrument being analyzed is DJ30, and the overall momentum of the chart indicates a bullish trend.
There is a possibility that the price may continue in a bullish direction, potentially reaching the resistance level.
The 1st support level is at 33,451.13, and it’s considered strong because it represents an overlap of support and aligns with a 50% Fibonacci Retracement.
The 2nd support level is at 33,143.29, and it’s also significant as it marks another overlap of support.
On the resistance side, the 1st resistance level is at 34,108.03, and it’s noteworthy because it represents an overlap of resistance and is accompanied by a 61.80% Fibonacci Retracement.
The 2nd resistance level is at 34,413.86, and it’s significant as well, as it functions as a pullback resistance and coincides with a 78.60% Fibonacci Retracement.
There is also an intermediate resistance level at 33,977.16, and it’s considered strong because it represents a swing high resistance.
GER40:
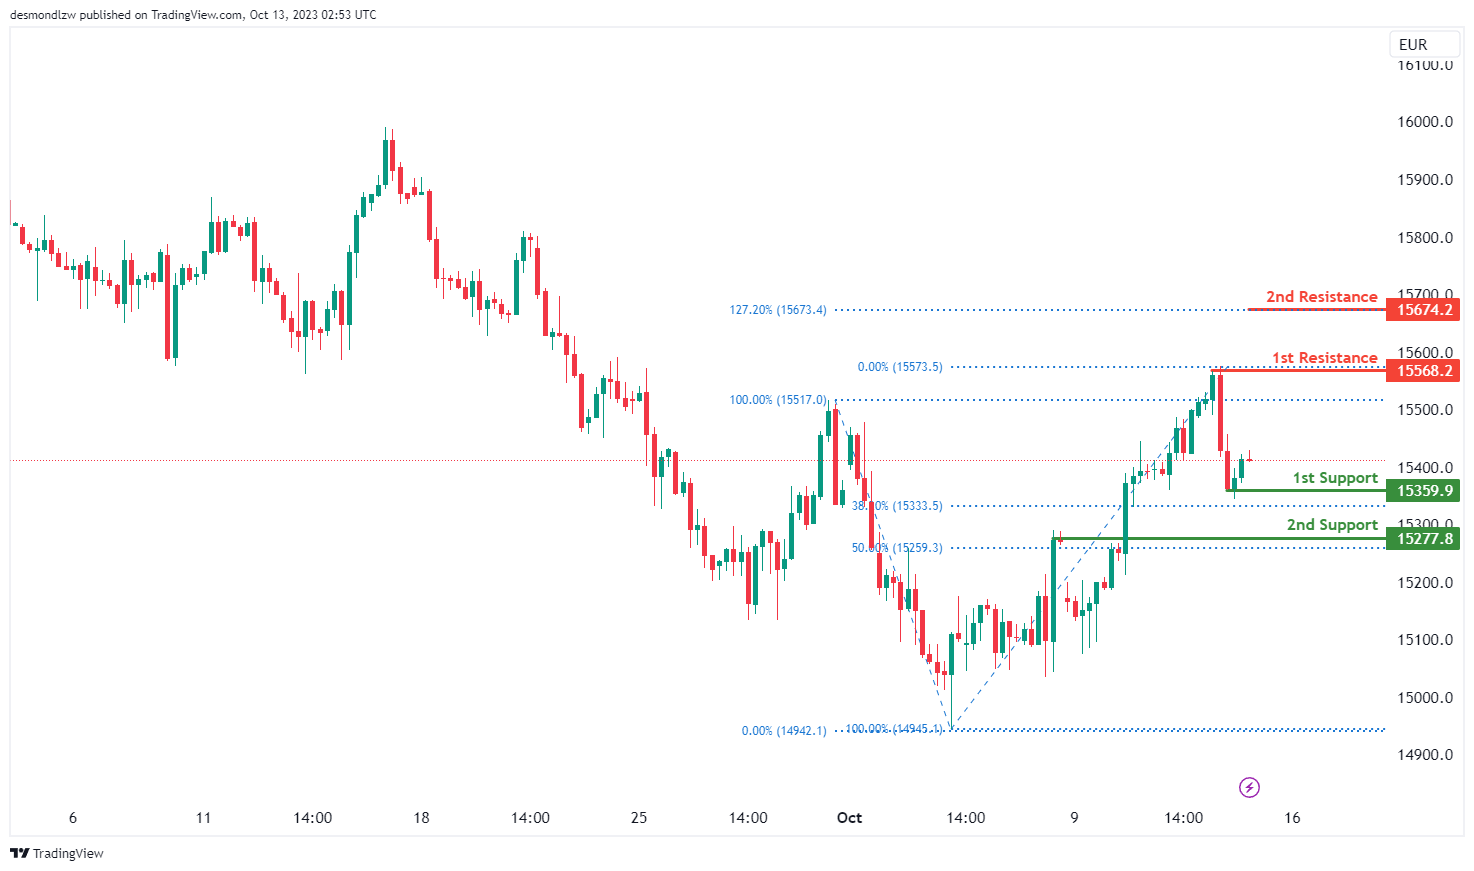
The instrument we are analyzing is GER40, and the overall momentum of the chart indicates a bullish trend.
There is a possibility that the price may continue in a bullish direction, potentially reaching the resistance level.
The 1st support level is at 15,359.90, and it’s considered strong because it represents a swing low support and aligns with a 38.20% Fibonacci Retracement.
The 2nd support level is at 15,277.80, and it’s also significant as it marks a pullback support and corresponds to a 50% Fibonacci Retracement.
On the resistance side, the 1st resistance level is at 15,568.20, and it’s noteworthy because it represents a swing high resistance.
The 2nd resistance level is at 15,674.20, and it’s significant as well, as it corresponds to a 127.20% Fibonacci Extension.
US500
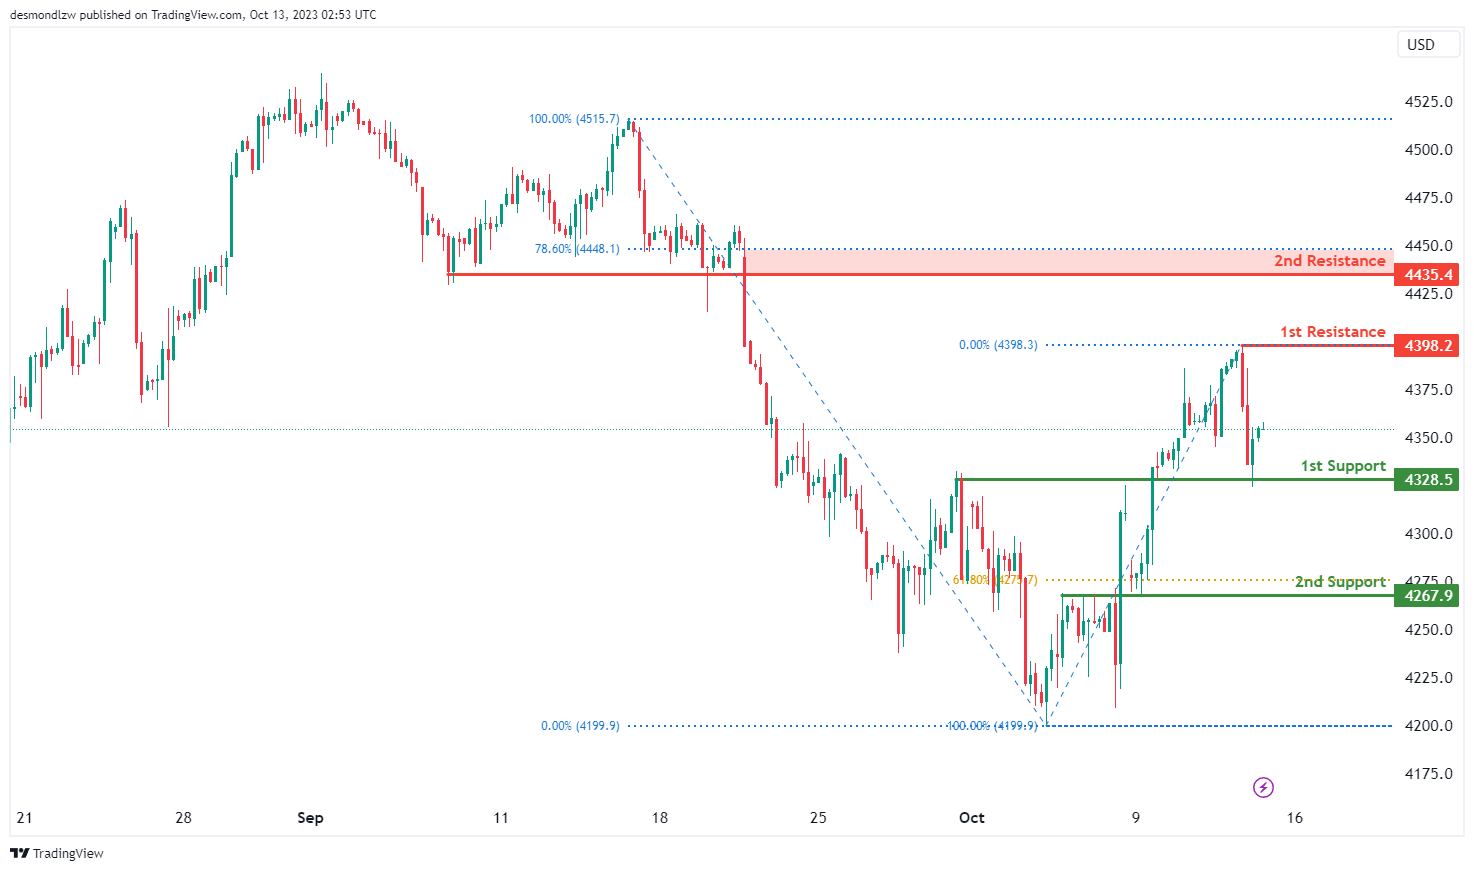
The instrument we are examining is US500, and the overall momentum of the chart indicates a bullish trend.
There is a possibility that the price may continue in a bullish direction, potentially reaching the resistance level.
The 1st support level is at 4,328.5, and it’s considered strong because it represents an overlap of support.
The 2nd support level is at 4,267.9, and it’s also significant as it marks another overlap of support and aligns with a 61.80% Fibonacci Retracement.
On the resistance side, the 1st resistance level is at 4,398.2, and it’s noteworthy because it represents a swing high resistance.
The 2nd resistance level is at 4,435.4, and it’s significant as well, as it functions as a pullback resistance and coincides with a 78.60% Fibonacci Retracement.
BTC/USD:
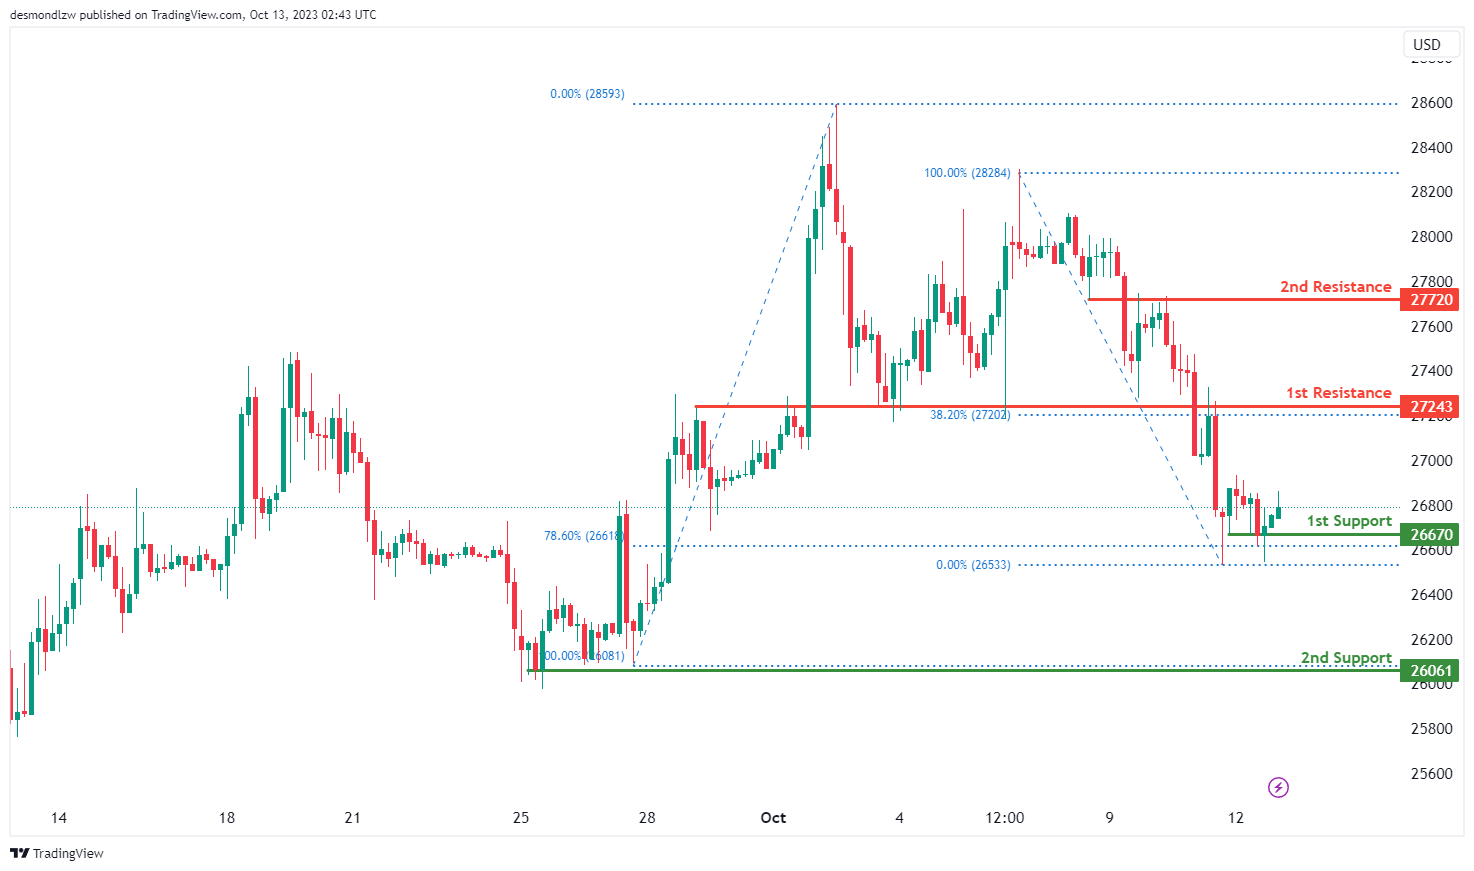
The instrument we are examining is BTC/USD, and the overall momentum of the chart indicates a bullish trend.
There is a possibility that the price may continue in a bullish direction, potentially reaching the resistance level.
The 1st support level is at 26,670, and it’s considered strong because it represents a multi-swing low support and aligns with a 78.60% Fibonacci Retracement.
The 2nd support level is at 26,061, and it’s also significant as it marks another multi-swing low support.
On the resistance side, the 1st resistance level is at 27,243, and it’s noteworthy because it represents an overlap of resistance and is accompanied by a 38.20% Fibonacci Retracement.
The 2nd resistance level is at 27,720, and it’s significant as well, as it functions as an overlap resistance.
ETH/USD:
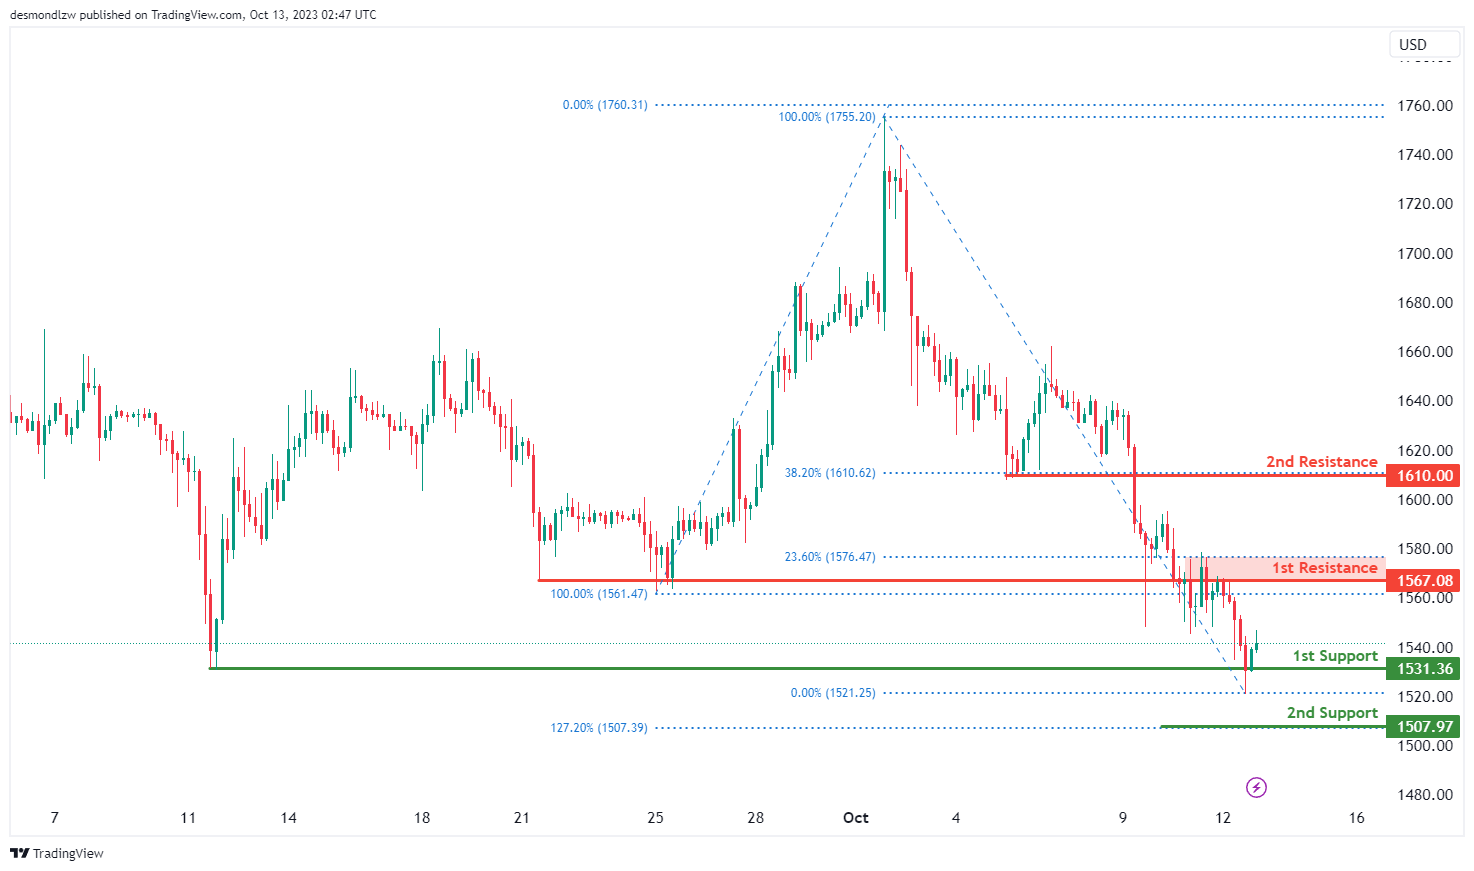
The instrument under consideration is ETH/USD, and the overall momentum of the chart indicates a bullish trend.
There is a possibility that the price may continue in a bullish direction, potentially reaching the resistance level.
The 1st support level is at 1,531.36, and it’s considered strong because it represents a multi-swing low support.
The 2nd support level is at 1,507.97, and it’s also significant as it aligns with the 127.20% Fibonacci Extension.
On the resistance side, the 1st resistance level is at 1,567.08, and it’s noteworthy because it represents an overlap of resistance and is accompanied by a 23.60% Fibonacci Retracement.
The 2nd resistance level is at 1,610.00, and it’s significant as well, as it functions as a pullback resistance and coincides with a 38.20% Fibonacci Retracement.
WTI/USD:
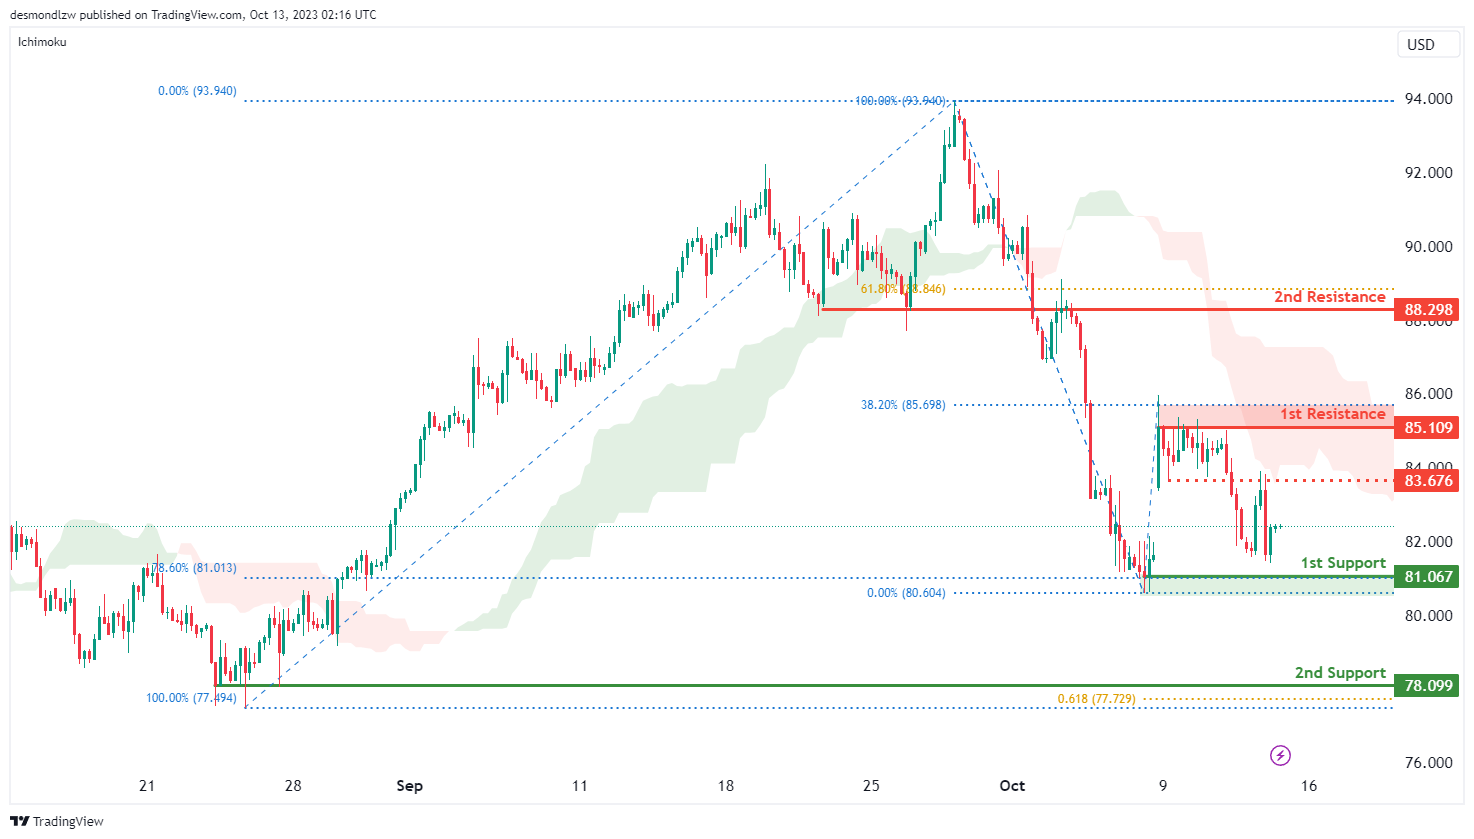
The WTI chart currently exhibits an overall bearish momentum with price trading under the bearish Ichimoku cloud. There is a potential scenario for price to make a bearish continuation towards the 1st support level.
The 1st support level at 81.07 is identified as a pullback support that aligns with the 78.60% Fibonacci retracement level. Additionally, the 2nd support level at 78.09 is also noted as pullback support that aligns close to the 61.80% Fibonacci projection level, further reinforcing its significance as an area where price may find support.
To the upside, the intermediate resistance level at 85.11 is identified as an overlap resistance. The 1st resistance level at 85.11 is noted as a pullback resistance that aligns close to the 38.20% Fibonacci retracement level. Higher up, the 2nd resistance level at 88.29 is marked as an overlap resistance that aligns close to the 61.80% Fibonacci retracement level, potentially acting as a barrier to further upward movement.
XAU/USD (GOLD):
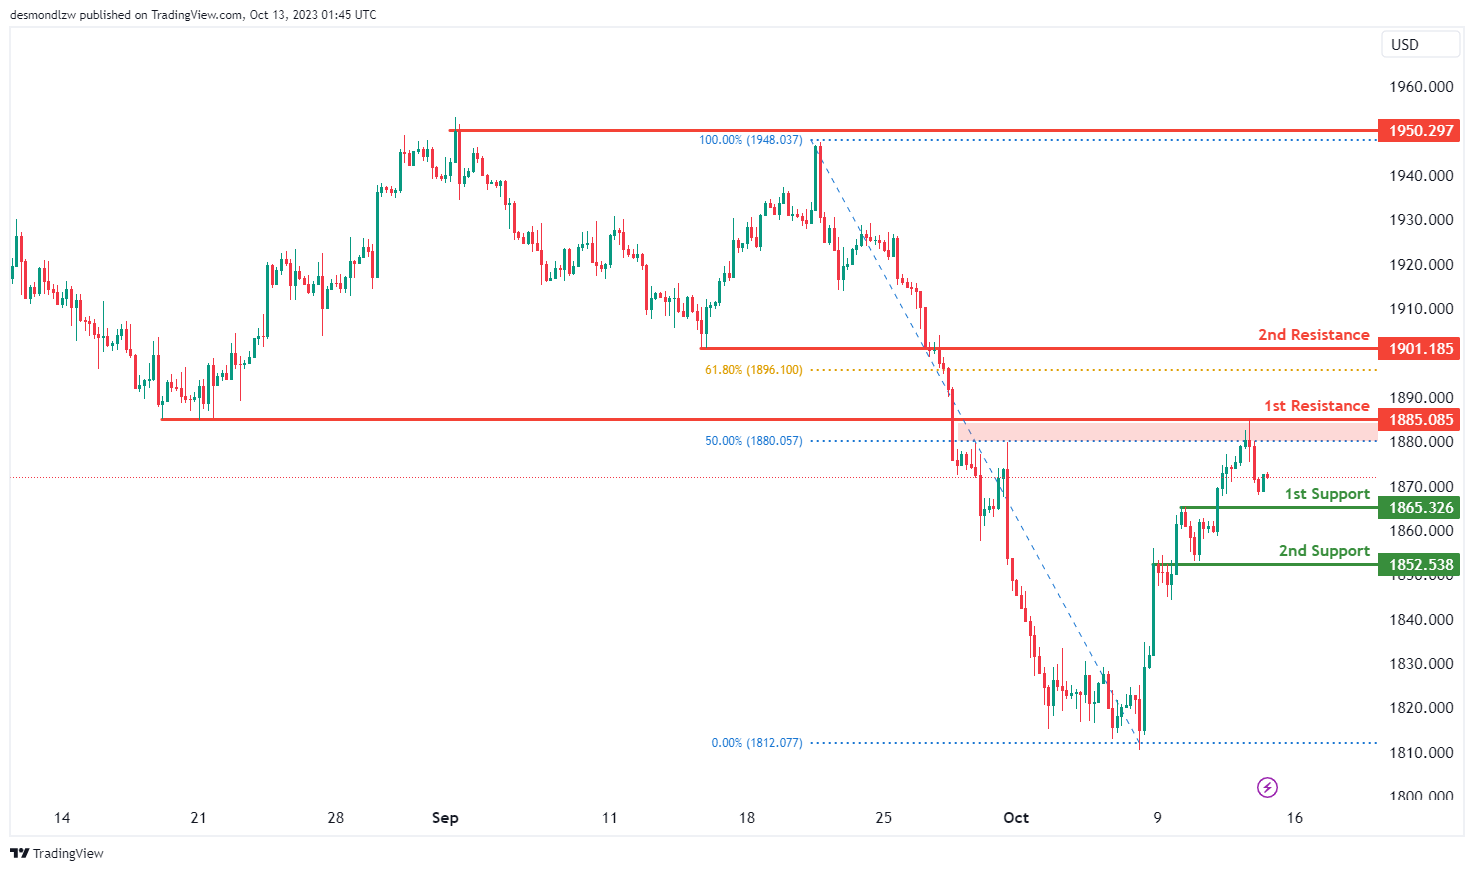
The XAU/USD chart currently exhibits bullish momentum, suggesting the potential for a bounce off the 1st support and a move towards the 1st resistance.
The 1st support level at 1865.32 has previously acted as a reliable area of price support. This level is considered significant for potential upward movements. The 2nd support level at 1852.53 is another level of support, reinforcing the strength of the support zone.
On the resistance side, the 1st resistance at 1885.08 is characterized as a pullback resistance. It is also closely aligned with the 50% Fibonacci Retracement level, making it a critical area where price movement may encounter resistance. The 2nd resistance, situated at 1901.18, is an overlap resistance, which could potentially act as a significant barrier to further upward price movement.
Bitcoin Price Weakens Amid War Escalation, US CPI Jumps 0.4%
Key Highlights
- Bitcoin price started a fresh decline amid the escalation of the Israel-Hamas war.
- BTC broke a major contracting triangle with support at $27,000 on the 4-hour chart.
- Gold prices tested the $1,880 resistance and oil prices found support at $83.00.
- The US CPI rose 0.4% in Sep 2023 (MoM) whereas the market forecast was 0.3%.
Bitcoin Price Technical Analysis
Bitcoin price started a fresh decline after it failed to stay above $28,000. BTC accelerated lower amid the Israel-Hamas war escalation, as Israeli airstrikes in the Gaza Strip displaced thousands from their houses. The market is a bit volatile with swing moves in gold, oil, VIX, and safe havens. Therefore, Bitcoin could face selling pressure and it might even accelerate lower toward $26,000 if the situation worsens.
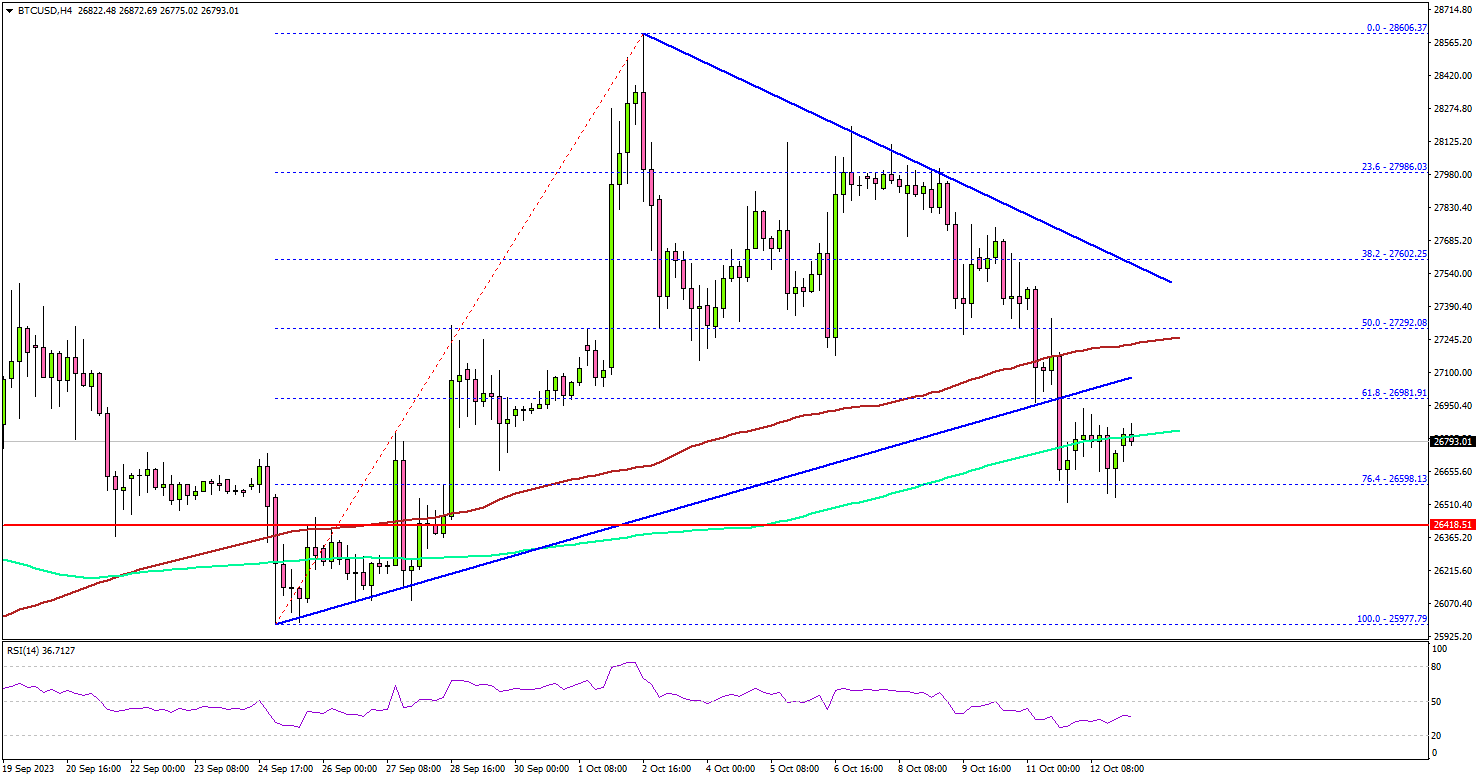
Looking at the 4-hour chart, the price there was a sharp bearish move below the $27,500 level. The price traded below a major contracting triangle with support at $27,000.
BTC/USD even spiked below the 76.4% Fib retracement level of the upward move from the $25,977 swing low to the $28,606 high. It seems like the bears could aim a move toward the $26,000 support zone in the coming sessions.
The next major support is near $25,500, below which the price could slide toward $24,200. If there is a recovery wave, the price might face resistance near $27,000.
The first major resistance is near $27,250 and the 100 simple moving average (red, 4 hours). A successful close above the $27,250 level might spark a decent increase. In the stated case, the price may perhaps rise toward the $27,800 level. The next stop for Bitcoin bulls may perhaps be near the $28,600 level.
Looking at gold prices, it did test the $1,880 resistance (as discussed in the previous analysis). More importantly, oil prices saw a downside correction to close the open-week gap at $83.00.
Economic Releases
- Michigan Consumer Sentiment Index for Oct 2023 (Prelim) – Forecast 67.4, versus 68.1 previous.
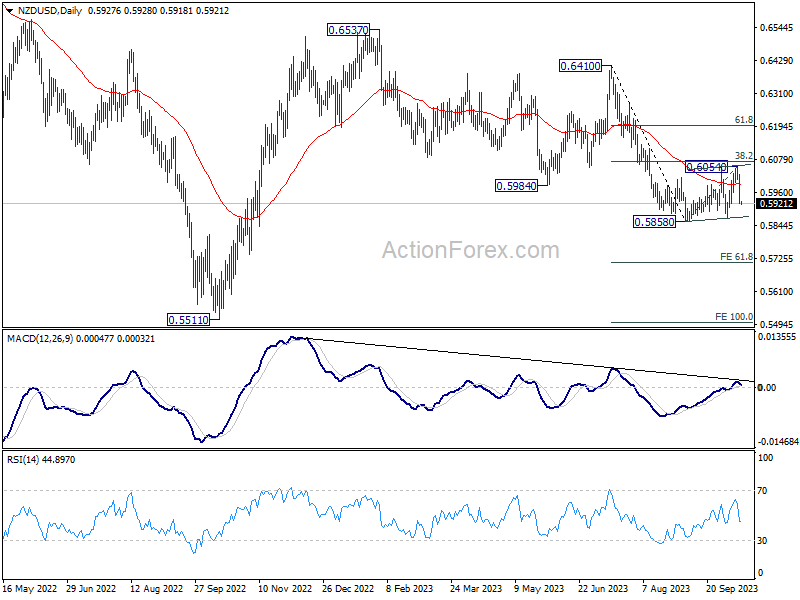
NZD/USD heads back to 0.5858 short term bottom
NZD/USD experienced a sharp decline overnight, attributed largely to a vigorous rebound seen in Dollar. Bearish momentum for the pair continued into Asian session, further weighed down by disappointing manufacturing data from New Zealand.
From a technical standpoint, price actions stemming from 0.5858 short term bottom appear to have a corrective structure. The pronounced drop seen today suggests the possibility that this corrective phase might have concluded at 0.6054, just shy of 38.2% retracement of 0.6410 to 0.5858 at 0.6069.
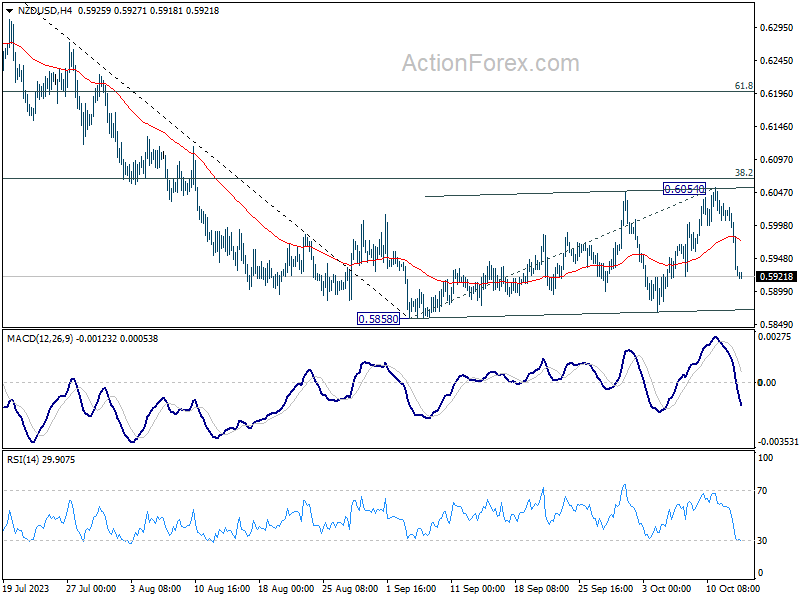
Near term focus is now turned to 0.5858 low. Decisive break there will confirm resumption of whole down trend from 0.6537. Next target is 61.8% projection of 0.6410 to 0.5858 from 0.6054 at 0.5713.
In the event of recovery, 0.6054 resistance remains pivotal. As it stands, unless this level is surpassed, any recovery attempts are likely to be short-lived, keeping the bearish bias intact.
Silver (XAGUSD) Pullback May See Buyers and Resume Higher
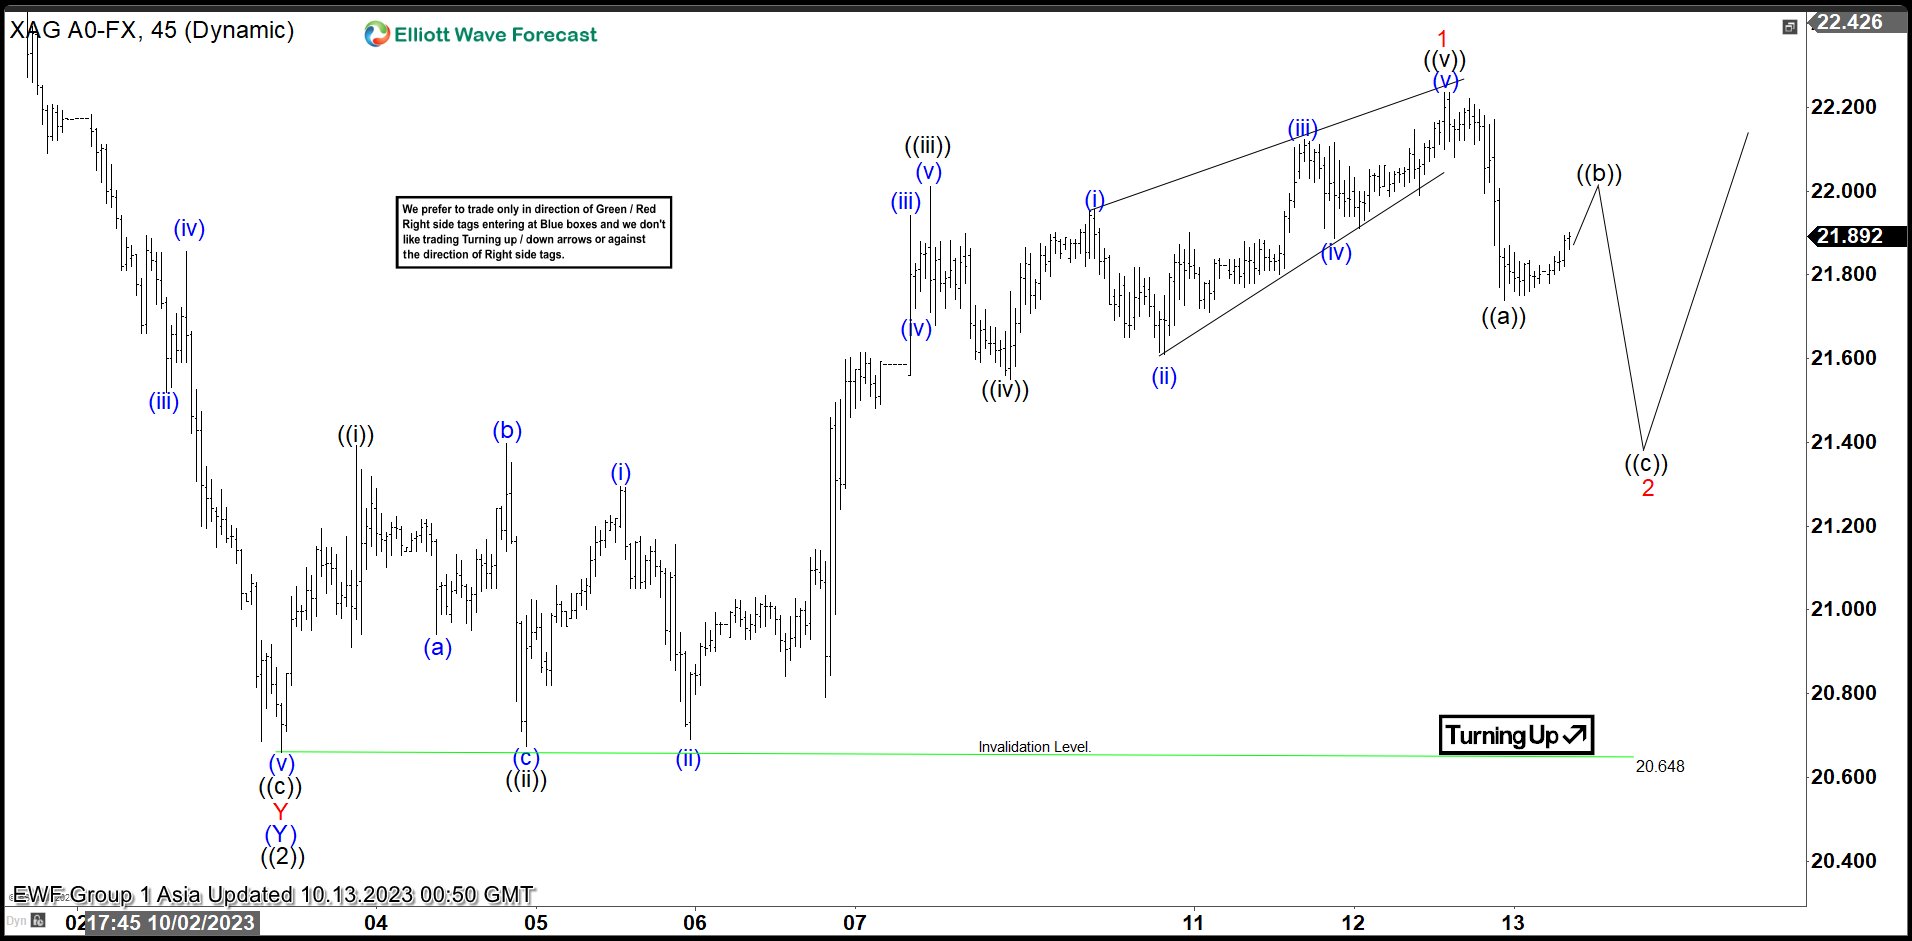
Short Term Elliott Wave in Silver (XAGUSD) suggests cycle from 5.5.2023 high ended with wave ((2)) at 20.65. Internal subdivision of wave ((2)) unfolded in a double three Elliott Wave structure. Down from 5.5.2023 high, wave (W) ended at 22.1 and wave (X) ended at 25.26. Wave (Y) ended at 20.65 which completed wave ((2)) as the 45 minutes chart below shows. The metal has turned higher in wave ((3)).
Up from wave ((2)), wave ((i)) ended at 21.39 and pullback in wave ((ii)) ended at 20.67. The metal resumes higher in wave ((iii)) towards 22 and dips in wave ((iv)) ended at 21.55. Final leg higher wave ((v)) ended as a diagonal at 22.23. This completed wave 1 in higher degree. Wave 2 pullback is now in progress to correct cycle from 10.3.2023 low before the metal resumes higher. Internal subdivision of wave 2 is unfolding as a zigzag structure. Down from wave 1, wave ((a)) ended at 21.74. Expect wave ((b)) to fail below 22.23 and the metal to turn lower in wave ((c)) before ending wave 2 correction. Near term, as far as pivot at 20.64 low stays intact, expect pullback to find support in 3, 7, or 11 swing for further upside.
Silver 45 Minutes Elliott Wave Chart
Silver (XAGUSD) Elliott Wave Video
https://www.youtube.com/watch?v=gLZZXhIb5pI
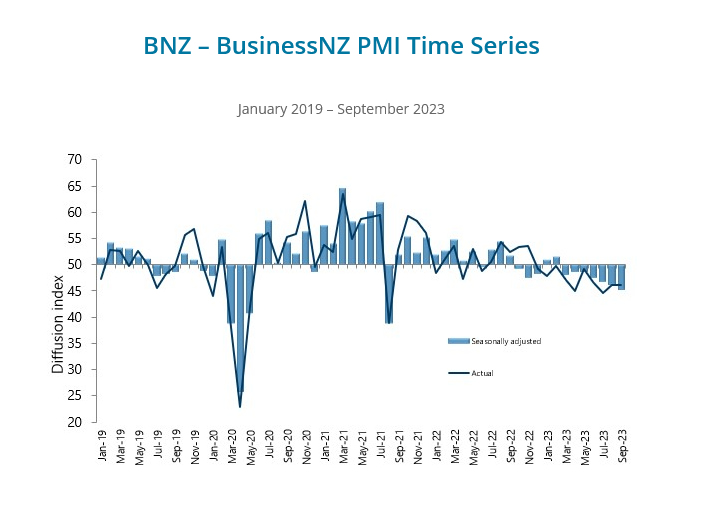
New Zealand BNZ PMI falls to 45.3, entrenched manufacturing downturn deepens
New Zealand manufacturing sector has further sunk into troubled waters, as evidenced by the continued and deepening contraction observed in recent data.
BusinessNZ Performance of Manufacturing Index for September highlighted this slowdown by dropping to 45.3, down from 46.1 the previous month. This marks its most dismal performance for a month unaffected by COVID-19 since May 2009 and sits notably below the long-term average activity rate of 52.9.
Delving into the specifics, there's a discernible decline across most metrics. While production saw a slight uptick, moving from 43.8 to 44.6, other areas weren't as fortunate. Employment indicators slid from 47.7 to 45.2, and new orders also receded from 46.6 to 44.9. Meanwhile, finished stocks dwindled, albeit marginally, from 52.0 to 51.6, and deliveries plunged from 47.8 to 44.3.
Catherine Beard, BusinessNZ's Director of Advocacy, highlighted the sustained downturn, pointing out that the sector "has now been in contraction for seven consecutive months, with little sign it is showing any improvement."
On the economic front, BNZ Senior Economist Doug Steel provided a bleak perspective, remarking, "the trend remains firmly downward." He also touched upon the challenges in discerning the exact causes of any PMI result but cited "falling sales, rising costs, and election uncertainty" as significant factors currently impacting the sector.
Fed’s Collins believes rates may have peaked in current cycle
Boston Fed President Susan Collins highlighted that recent rise in long-term yields implies some tightening of financial conditions. "If it persists, it likely reduces the need for further monetary-policy tightening in the near term," she noted in a speech yesterday.
Such market dynamics further bolstered Collins' perspective on the current tightening cycle led. "This reinforces my view that we are very near, and perhaps at, the peak federal funds rates for this tightening cycle," she stated, indicating that the cycle could be nearing its zenith.
However, Collins maintained a flexible stance on the future course of action, and clarified, "I would not take further tightening off the table yet."
Weighed in on yesterday's CPI data, which revealed that September's headline inflation held steady at 3.7% and core inflation eased to 4.1%. Collins said, "Today's CPI release is a reminder that restoring price stability will take time."
USD/JPY: Surging Treasury Yields Bring Back Pressure onto Japanese Officials
- Dollar holds onto gains as projected rate hike bets hold firm
- Treasury 30-year auction sees soft demand as concerns grow over rising deficits
- Yen’s October rally nearly completely erased as US growth exceptionalism remains in place
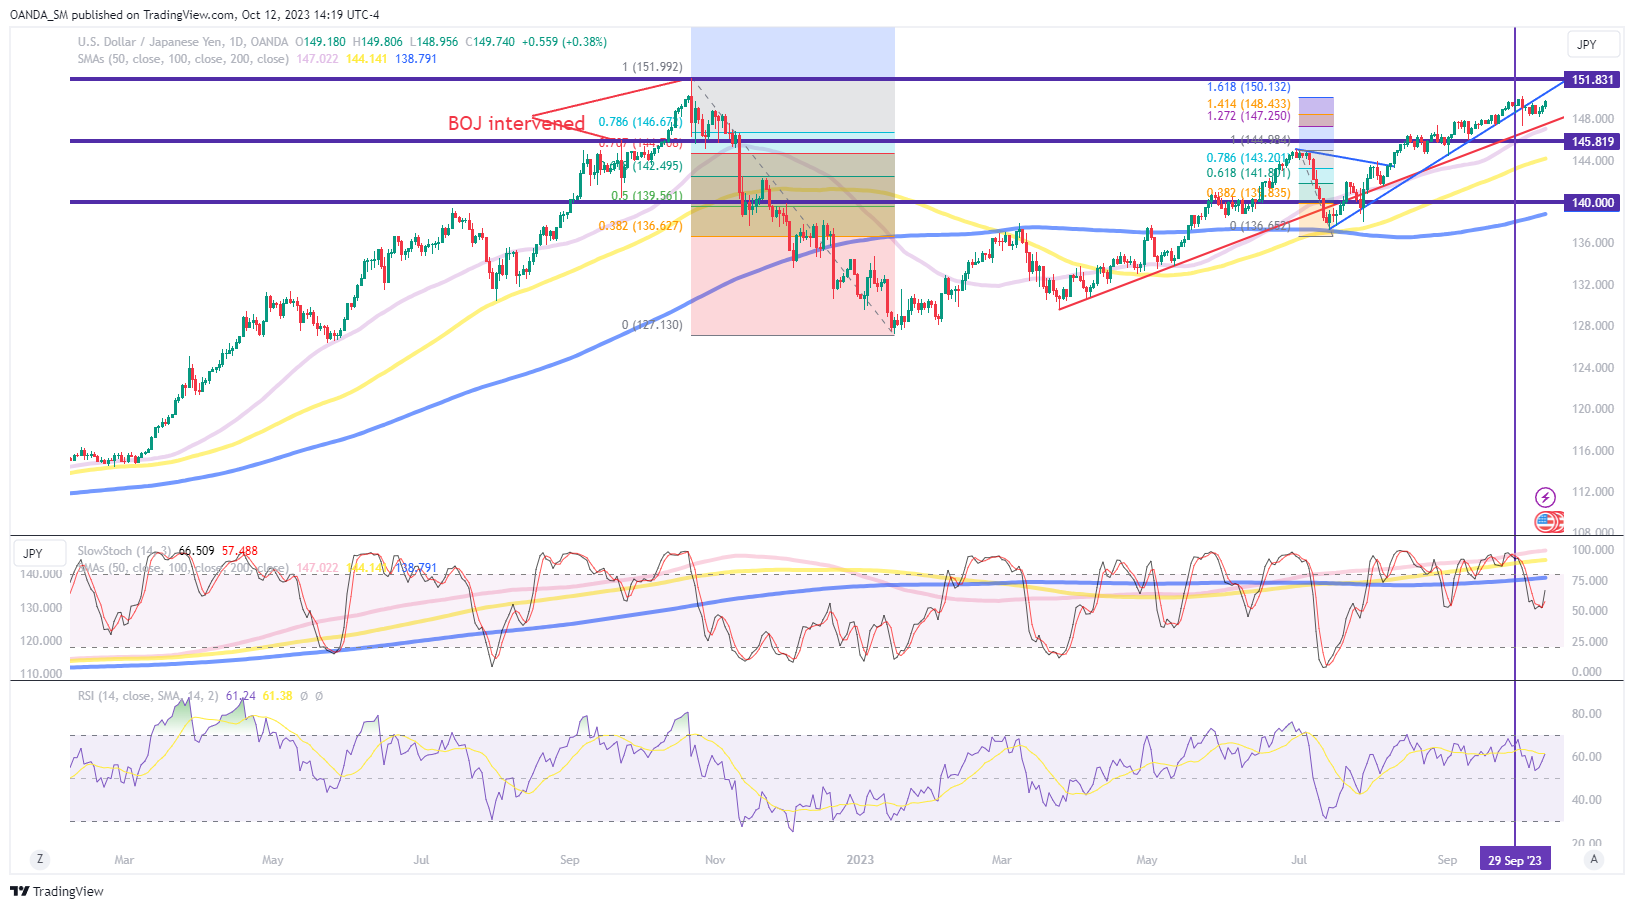
The BOJ must be frustrated that the yen’s rally at the start of the month has quickly evaporated. Pressure is growing for the Japanese officials to act otherwise, the yen could see another significant devaluation. Last night, Bank of Japan board member Noguchi noted that yield curve control is difficult to maintain without acting early when changes are needed. The pressure is building for the BOJ to do something and if the yen weakens beyond the 150 level, an abrupt action might need to occur.
The US dollar initially rallied after a hot CPI report and steady jobless claims data. The dollar’s rally extended after tepid demand for 30-year Treasuries. Too much supply could become an issue, which is why the 30-year Treasury yield rose 18.7bps to 4.880%.
It seems like currency traders are going to have to buckle up and see what happens when USD/JPY crosses the 150 level again. If we get more bad auctions that could really drive this bond market into a frenzy.
USD/JPY daily chart
The bullish trend clearly remains intact will likely be tested as Japanese officials will resume with verbal intervention. Market forces won’t be letting up anytime soon, so an intervention at these levels might see some traders looking to fade any action.
NZDUSD Wave Analysis
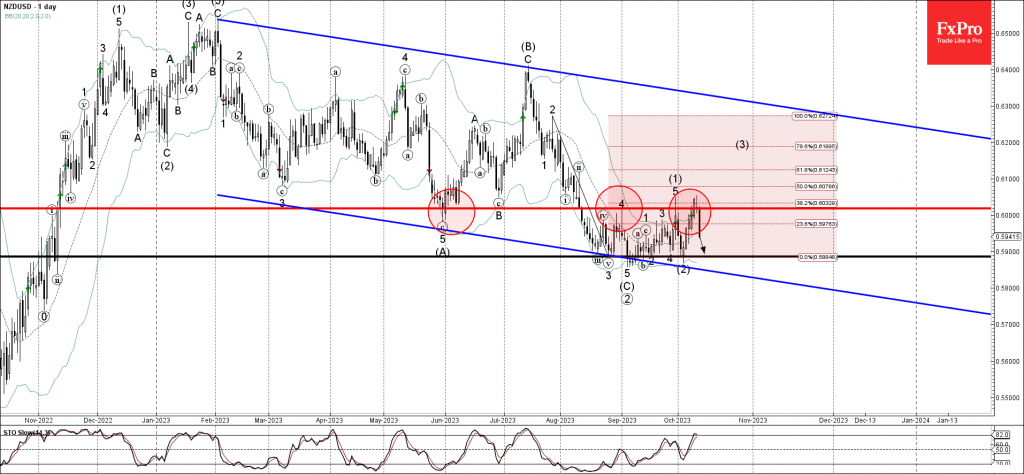
- NZDUSD reversed from key resistance level 0.6020
- Likely to fall to support level 0.5900
NZDUSD currency pair recently reversed down from the key resistance level 0.6020 (former strong support from June, which stopped the previous waves 4 and 1), intersecting with the upper daily Bollinger Band.
The downward reversal from the resistance level 0.6020 is currently forming the daily candlesticks reversal pattern Evening Star Doji.
Given the clear daily downtrend, overbought daily Stochastic and the continued NZD sales, NZDUSD can be expected to fall further toward the next support level 0.5900, which reversed multiple waves from August.
Germany: What Drives Recent Divergence Between Employment and GDP?
- The German labour market has remained remarkably strong despite weak economic activity overall. While GDP has fallen since 2022Q3 employment has increased continuously.
- We find that the major drivers behind strong employment growth in Germany is strong public sector employment growth and part-time employment.
- Also demographics, and a larger share of service sector employment drive the divergence between employment and GDP.
On the surface the German labour market has defied gravity by recording continuous increases in employment during the last year despite the slump in economic activity. Employment has increased with around 1.5% since 2019Q4 while GDP is broadly unchanged. However, beneath the surface we find that total hours worked has increased less than the number of employed persons since the share of part-time workers increased from 27.9% in 2019Q4 to 30.2% in 2023Q2. This reduction in average working time is one driver of the recent divergence between employment and GDP.
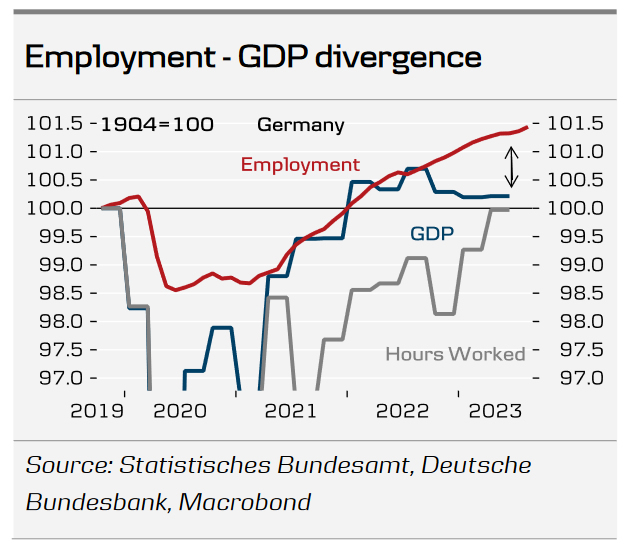
The reduction in average time worked per employee also happened during the global financial crisis as German companies have the option to reduce working time for employees instead of laying them off due to the so-called 'kurzarbeit' schemes.
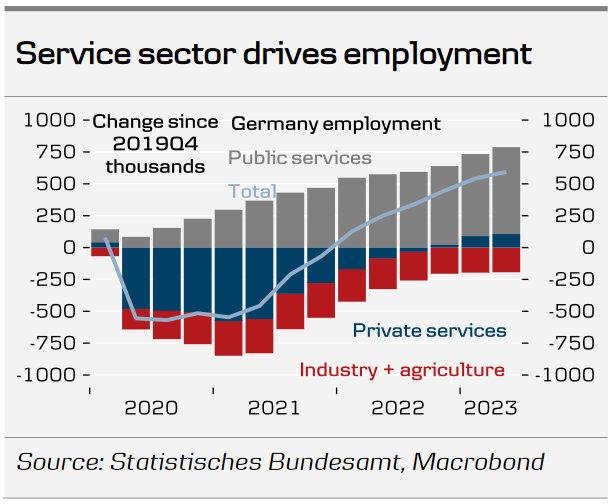
The rise in (public) service sector employment also explains why employment has been so strong compared to GDP. Employment in the public sector has increased each quarter since 2019Q4 except for one, and accounts for 115% of total employment growth. Private employment in the industry is still below pre-pandemic levels. The German industry has been in contraction since 2022Q3 and since then the private service sector has accounted for 80% of the employment increase in the private sector. Productivity is lower in both the public and private service sector compared to the industry as the industry has more capital per worker.
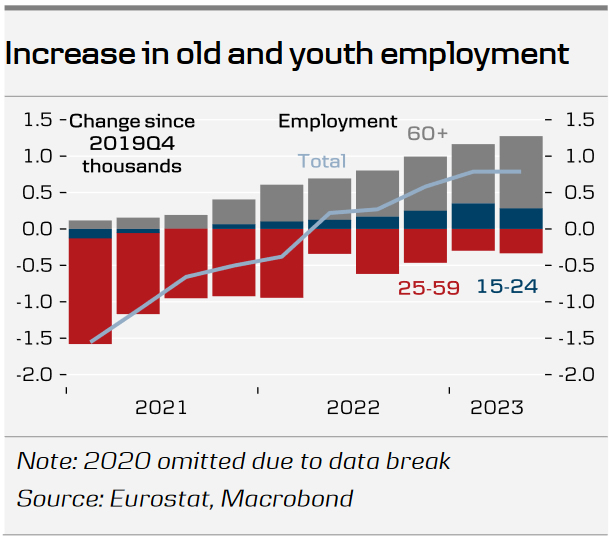
The recent labour market demographics is another explanation of the relatively strong aggregate employment figures. The German labour force is ageing and the number of employees above 60 years has increased with one million since 2019Q4. An ageing work force can affect productivity both positively and negatively but the majority of the effects are negative (see IMF - The Impact of Workforce Aging on European Productivity). Moreover, the share of part-time employment is larger for both old (23.3%) and young (25.7%) employees compared to prime working age employees (19.4%).
Taking stock of the current situation in the German economy high frequency indicators suggest that employment continued to increase in 2023Q3 driven by the service sector while GDP declined further. In the coming quarters, we expect employment to start declining as the monetary policy tightening works its' way through the economy to the labour market and economic activity becomes so weak that companies stop hoarding labour. Yet, we still foresee a tight labour market with the unemployment rate only marginally higher in 2024 as companies utilise the 'kurzarbeit' employment schemes.