

Sample Category Title
EUR/USD: Overall Picture Bearish But Headwinds Continue to Slow the Action
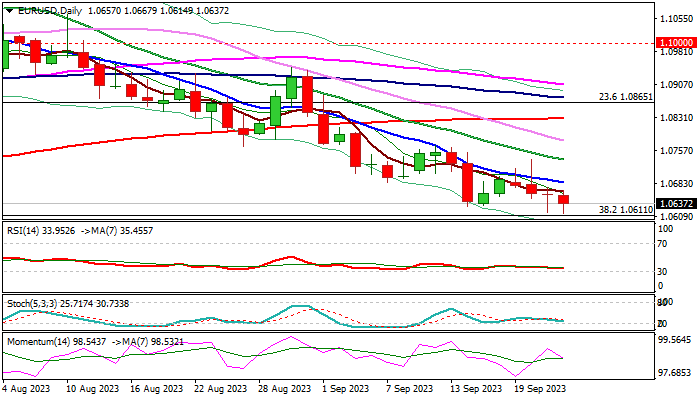
EURUSD keeps negative tone, but near-term action seems to be lacking firmer direction signals.
Wednesday’s strong upside rejection left a daily candle with long upper shadow and formed a bull-trap above 10 DMA, signaling strong bearish pressure, but long lower shadows on daily candles of Thursday / today, suggest that bears face headwinds from immediate support at 1.0611 (Fibo 38.2% of 0.9535/1.1275 uptrend and nearby top of thickening weekly Ichimoku cloud (1.0553).
Although the pair is on track for the tenth consecutive weekly close in red, the action of this week is shaped in Doji candle which signals indecision and may result in extended consolidation above 1.0611 Fibo support.
However, potential consolidation should not be long-lasting and likely limited as technical picture on daily chart is firmly bearish and negative outlook reinforced by bearish fundamentals as latest economic data added to signals that euro zone economy will likely contract in the third quarter, with unclear signs when the economy will return to growth.
This fuels expectations for bearish continuation scenario on break of 1.0611/1.0553 pivots and attack at next key target at 1.0516 (Mar 15 low) break of which would expose supports at 1.0405 (50% retracement) and 1.0295 (weekly cloud base).
Falling 10DMA offers initial resistance at 1.0686) which should ideally cap upticks and keep intact falling 20DMA (1.0736) violation of which would put larger bears on hold and unmask upper pivot at 1.0828 (200DMA).
Res: 1.0686; 1.0700; 1.0736; 1.0779.
Sup: 1.0611; 1.0553; 1.0483; 1.0405.
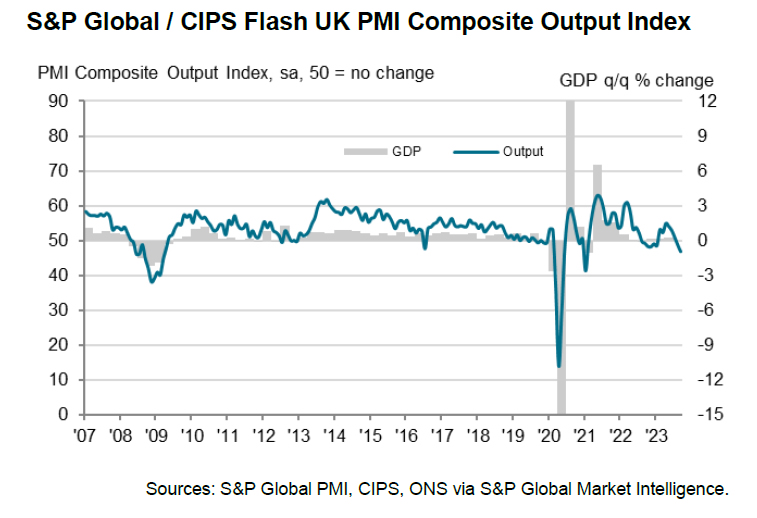
UK PMI composite fell to 46.0, heightened recession risk supports BoE pause
UK PMI Manufacturing sector had a slight uptick in September, moving from 43.0 to 44.2, surpassing expectations set at 43.0. Services PMI disappointed, recording a drop from 49.5 to 47.2, underperforming against the forecasted 49.0, marking a 32-month low. Consequently, PMI Composite followed suit, declining from 48.6 to 46.8, also registering a 32-month low.
Chris Williamson, Chief Business Economist at S&P Global Market Intelligence, stated, "The disappointing PMI survey results for September mean a recession is looking increasingly likely in the UK."
The current PMI data aligns with a potential GDP contraction of over -0.4% on a quarterly basis. Williamson mentioned, "September's downturn is the steepest since the height of the global financial crisis in early 2009 barring only the pandemic lockdown months."
A significant point of apprehension in the inflation framework remains wage growth. However, with the survey indicating the most significant employment decline since 2009, wage negotiation leverage appears to be dwindling swiftly.
Williamson believes the unsettling indications of heightened recession risk coupled with diminishing inflationary pressures are likely to have "added to calls to halt rate hikes" by BoE.
GBPJPY Recovers Some Ground after BoE Slump
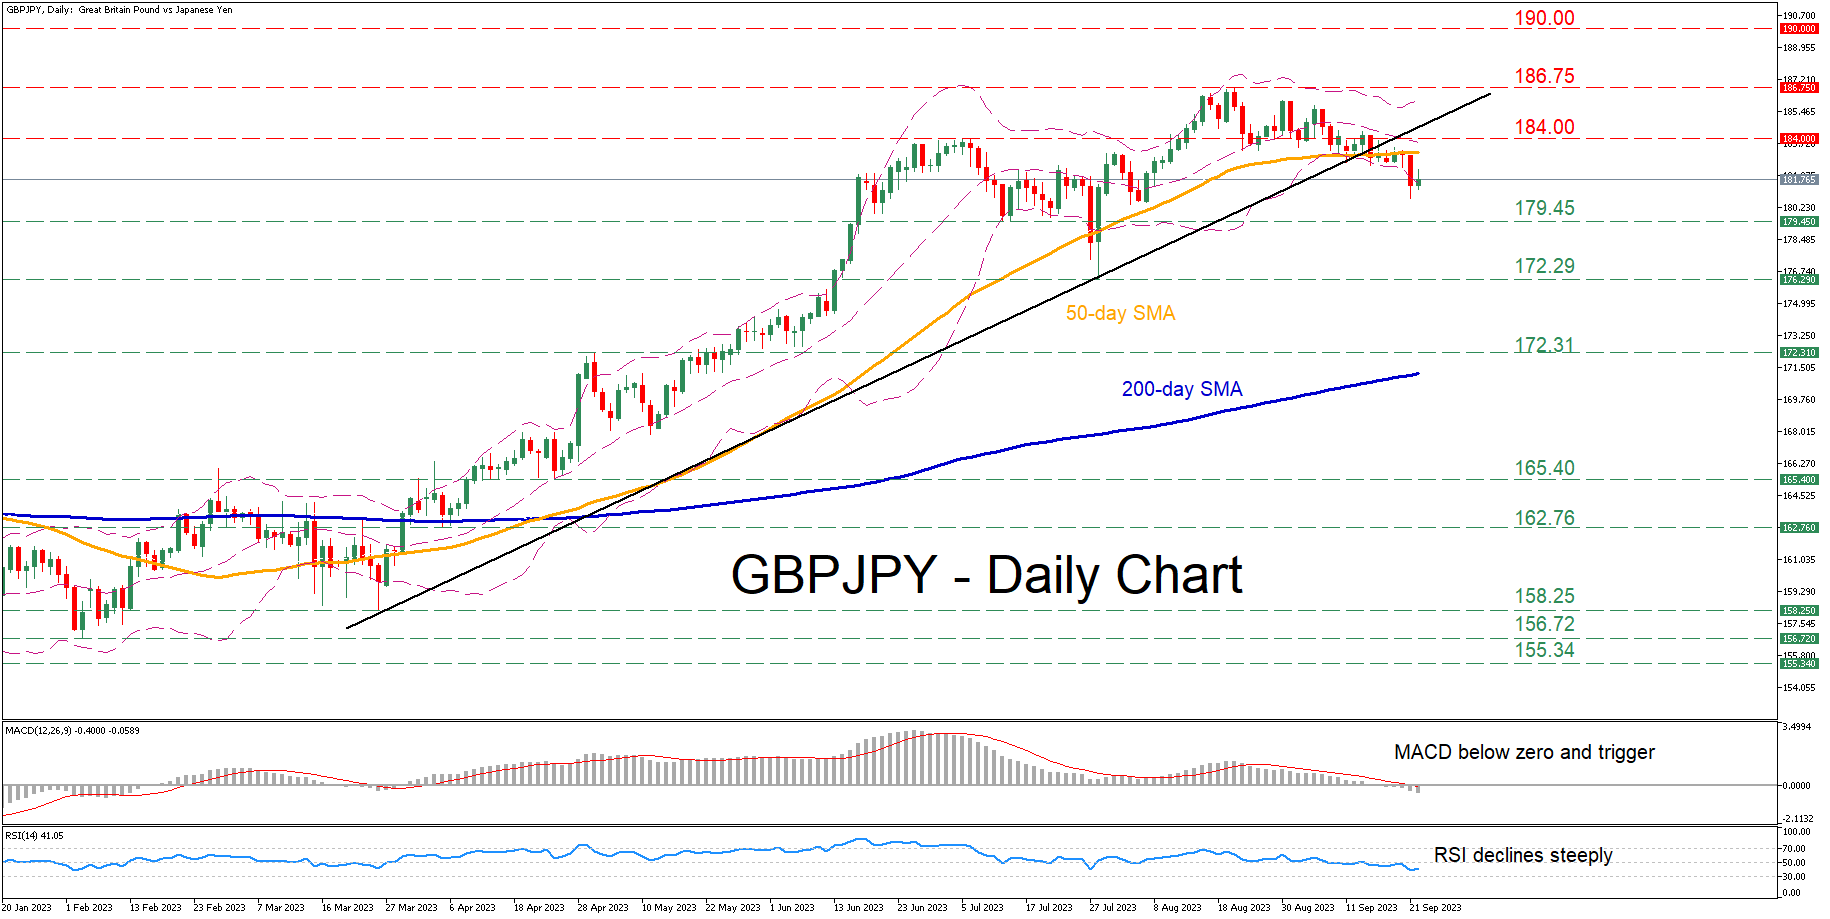
- GBPJPY slid below 50-day SMA after BoE surprise decision to hold rates steady
- Remains in a gentle downward path despite today’s bounce after BoJ leaves policy unchanged
- Will the short-term pullback extend?
GBPJPY had been stuck in a prolonged uptrend since the beginning of the year, posting an eight-year high of 186.75 on August 22. However, the pair has been experiencing a downside correction since then, with the momentum indicators suggesting more losses in the near term.
If selling interest persists, the July support of 179.45 could provide initial downside protection. Breaking below that zone, the price might face the July bottom of 172.29. A violation of that hurdle could open the door for the May resistance of 172.31, which could serve as support in the future.
Alternatively, should the price reverse back higher and reclaim its 50-day simple moving average (SMA), the bulls could attack the July peak of 184.00. Piercing through that wall, the pair could attempt to re-test its eight-year high of 186.75. If that barricade also fails, the price could ascend to fresh multi-year highs, where the 190.00 psychological mark might curb further upside attempts.
In brief, GBPJPY has been undergoing a strong pullback, which strengthened after the BoE’s dovish surprise. Nevertheless, traders should not rule out an impending bounce as the price is trading below the lower Bollinger band, hinting that the pair has reached oversold conditions.
USDCAD bears still in control
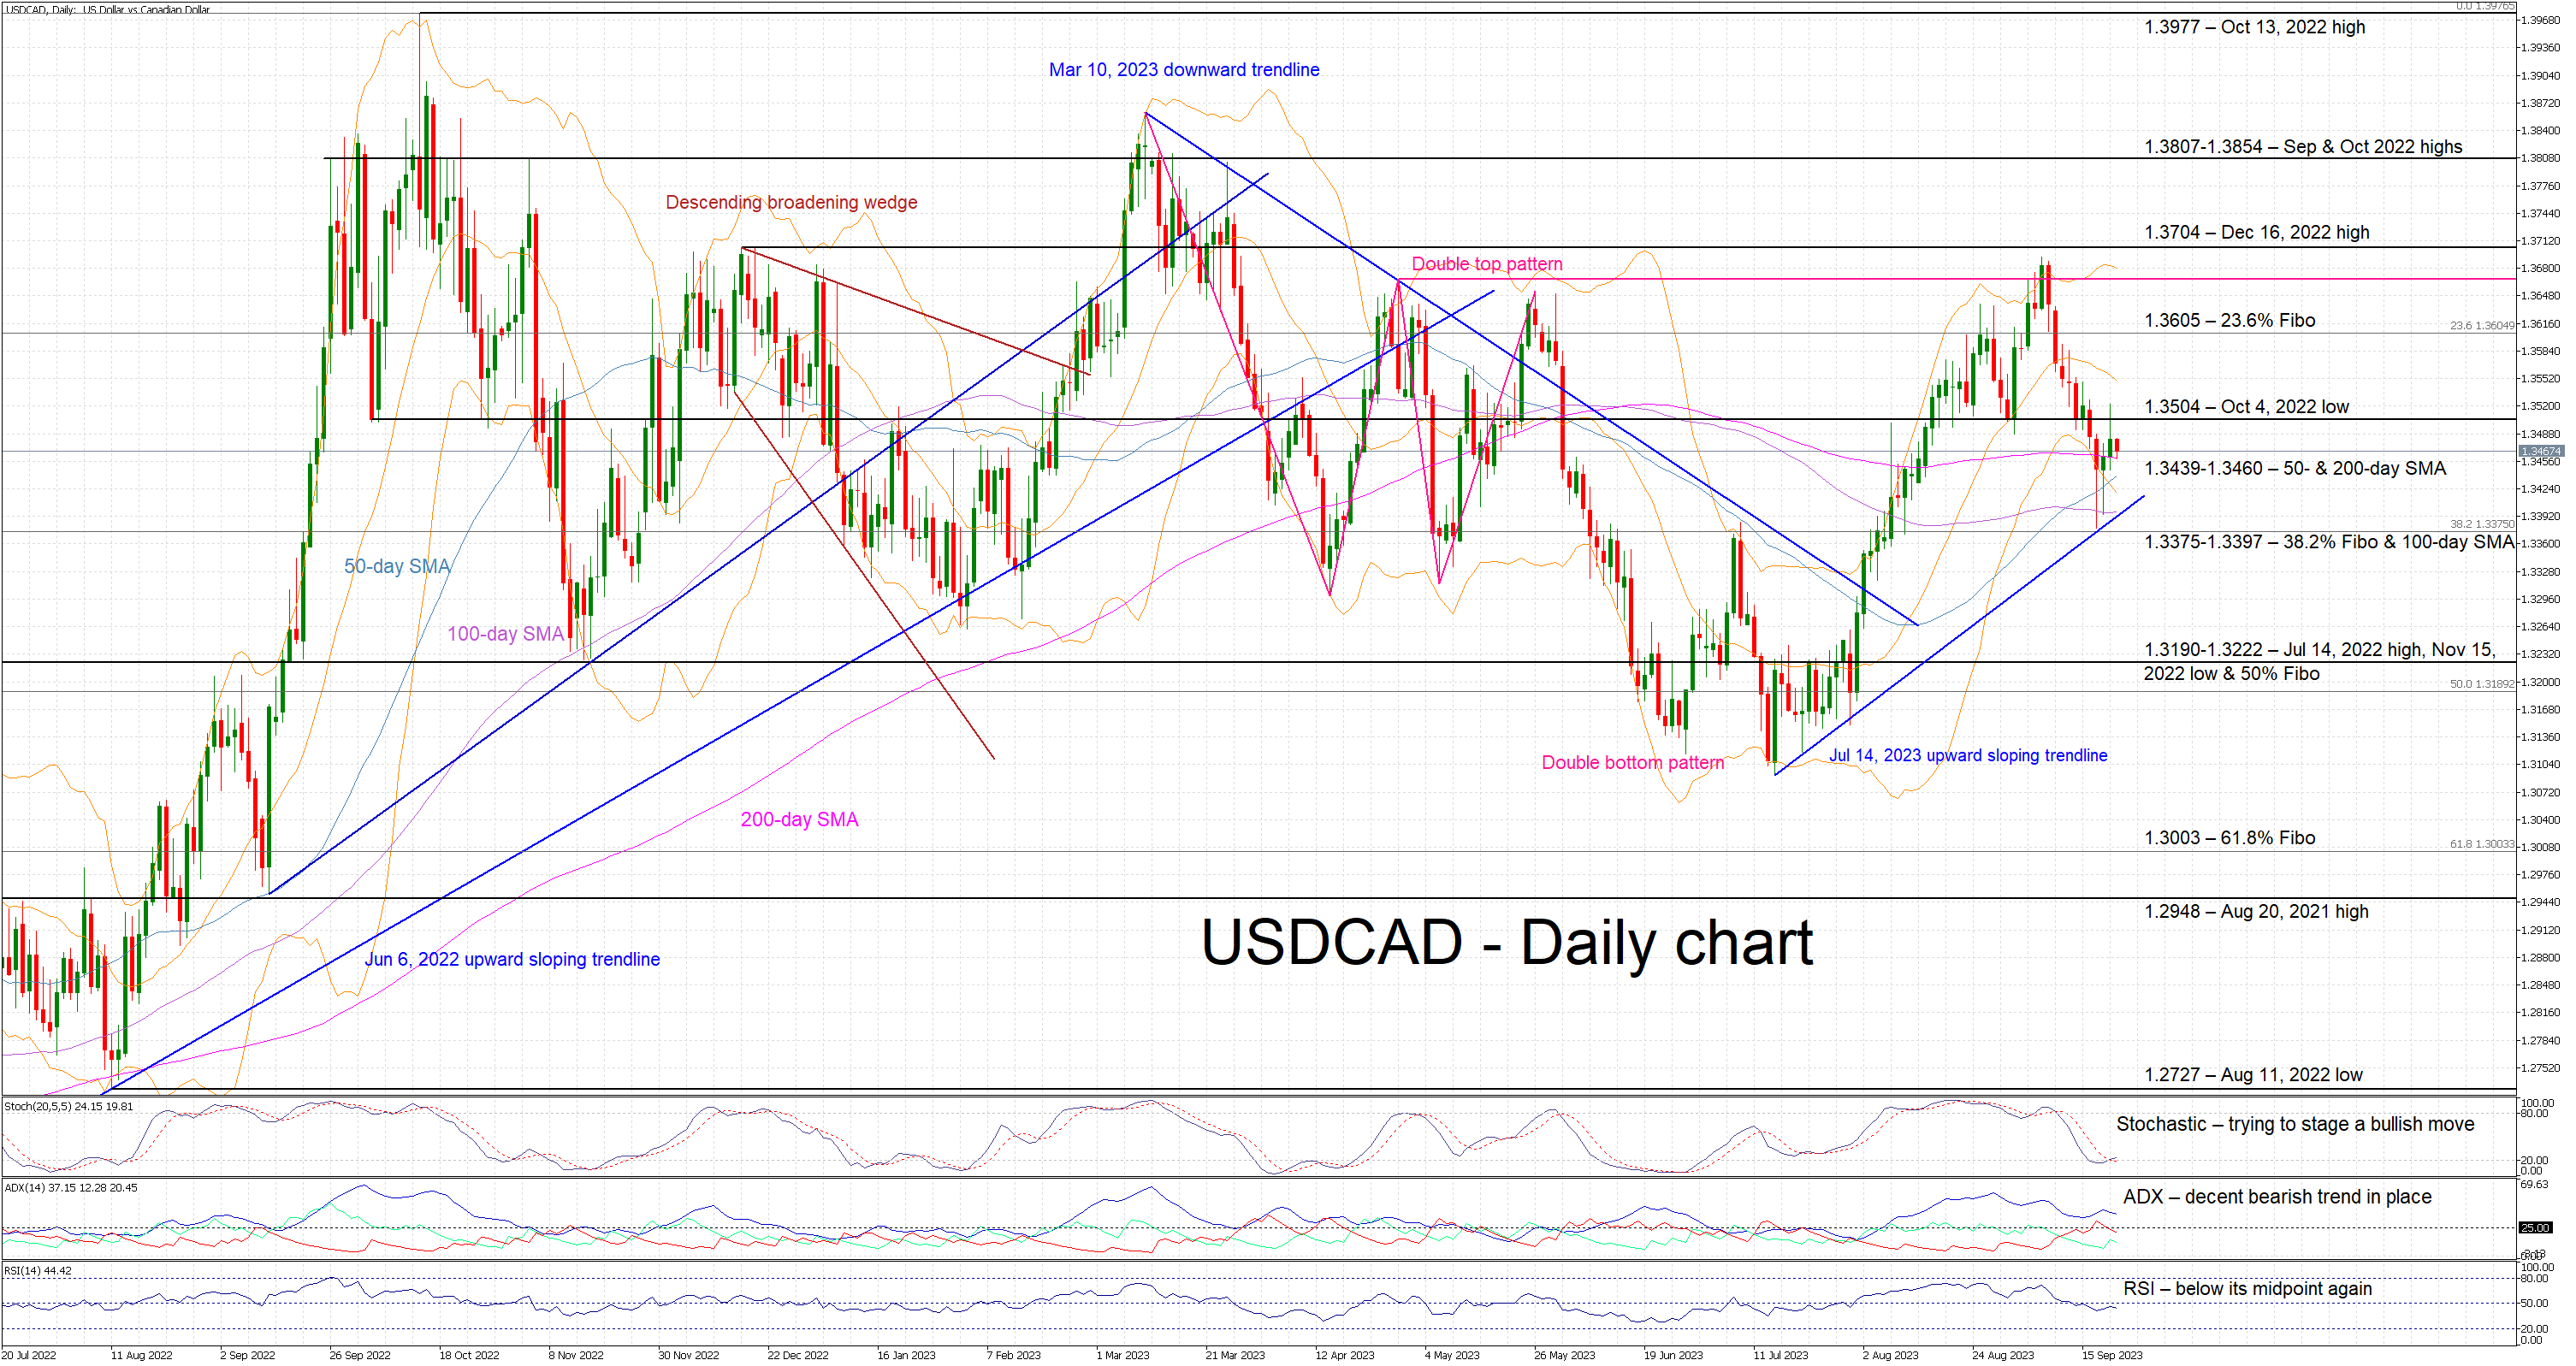
- USDCAD is in the red today, tests the support of the 200-day simple moving average
- The mixed momentum indicators complicate the outlook
- The SMAs’ convergence could open the door to a sizeable move ahead
USDCAD is moving lower today after bouncing off the July 14, 2023 upward sloping trendline. The downleg since the September 7, 2023 peak has been impressive but the path appears to be trickier at this stage, especially as the bulls have decided to react more forcefully. Interestingly, the convergence of the SMAs is probably opening the door to a sizeable move soon but it is also elevating the importance of the 1.3439-1.3460 region.
Amidst this price action, the momentum indicators are currently split. On the one hand, both the RSI and Average Directional Movement Index (ADX) confirm the current bearish tendency in USDCAD and therefore are supportive of the bears’ intentions. On the other hand, the stochastic oscillator is once again spoiling the bears’ party. It is trying to edge above both its oversold territory and moving average. If successful, it will send a strong bullish signal.
Should the bulls try to capitalize on a likely bullish signal, they would try to keep USDCAD above the busy 1.3439-1.3460 area that is populated by the 50- and 200-day SMAs. They could have a go at overcoming the October 4, 2022 low at 1.3504 and then potentially set their eyes on the 23.6% Fibonacci retracement of the April 5, 2022 – October 13, 2022 uptrend at 1.3605.
On the flip side, the bears are probably feeling confident and preparing to break the 1.3439-1.3460 area. They could then target the busy 1.3375-1.3397 area, defined by the 38.2% Fibonacci retracement and the 100-day SMA, and the July 14, 2023 upward sloping trendline. They could then have a look at pushing USDCAD even lower, towards the key 1.3190-1.3222 range.
To sum up, USDCAD bears are probably taking a breather but appear ready for another pullback. However, the mixed momentum indicators are complicating the outlook.
USD/JPY: Rises Towards 2023 High on Dovish BOJ
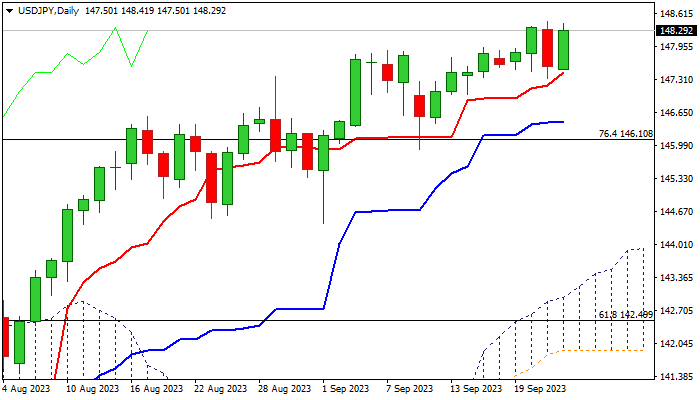
USDJPY bounced after BOJ policy decision, reversing Thursday’s loss and pressuring new 2023 high.
The Bank of Japan left its ultra-low interest rate unchanged, in line with expectations and kept its dovish stance in a forward guidance that put yen under fresh pressure.
Policymakers signaled they are so far not in rush to start tightening monetary policy and will continue to support economy until inflation, which is currently above BOJ’s target, returns to 2%.
The pair keeps full bullish stance, which was reinforced by the latest BOJ’s decision and remains on track for further gains, as recent talks about intervention also started to fade.
Rising daily Tenkan-sen (147.44) contained Thursday’s dip and continued to underpin the action, keeping near-term bias firmly with bulls for potential acceleration towards 150 target.
Daily Kijun-sen (146.45) and broken Fibo 76.4% (146.10) marks lower pivots, loss of which would sideline bulls and risk deeper correction.
Res: 148.45; 148.84; 149.70; 150.00.
Sup: 147.44; 147.01; 146.45; 146.10.
Eurozone PMIs point to -0.4% GDP contraction in Q3
Eurozone Manufacturing PMI was slightly disappointing in September, dipping from 43.5 to 43.4, failing to meet expectations set at 44.0. On the other hand, Services PMI indicated a slight revival, progressing from 47.9 to 48.4, surpassing the anticipated 47.5. Composite PMI reflected this marginal uplift, moving from 46.7 to 47.1.
Cyrus de la Rubia, Chief Economist at Hamburg Commercial Bank predicts a contraction for Eurozone in the third quarter, with a potential decrease of -0.4% relative to the previous quarter.
In services sector, "the heat on input prices shows that the risk of a wage-price spiral must remain very much on the radar of the ECB." Manufacturing continues to be a drag. But "destocking process" may bottom out over the next few months, which is crucial for the manufacturing sector's recovery for the beginning of next year.
Making a comparison between the two European giants, de la Rubia pointed out that while the French manufacturing sector "catching up" with Germany's weaknesses. When it comes to services, France's sector is "in a much worse state".
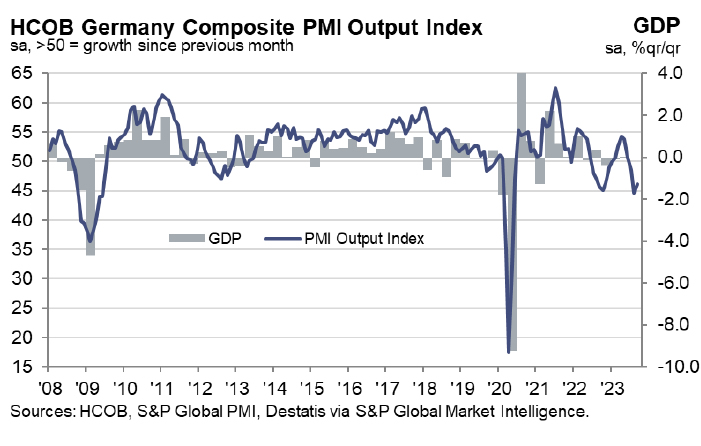
Germany PMIs improve, but points to economic contraction in current quarter
While Germany witnessed a modest improvement in its economic indicators for September, underlying concerns persist. PMI Manufacturing saw a slight climb from 39.1 to 39.8. Similarly, PMI Services edged up from 47.3 to just below the 50 mark at 49.8. Composite PMI experienced an uptick, moving from 44.6 to 46.2.
Cyrus de la Rubia, Chief Economist at Hamburg Commercial Bank, addressed the improvements, particularly noting, "The German services PMI stopped its slump and nudged up near 50 in September." Nonetheless, despite this upward nudge, the service sector remains virtually unchanged following the dip seen in August.
Encouragingly, recent PMI data suggests a deceleration in the decline of new orders and a slowdown in the reduction of purchasing activity in manufacturing. However, a closer look into the data indicates that manufacturing production might experience a drop surpassing 2 percent compared to the preceding quarter.
The broader picture is not particularly optimistic. "Germany has entered once again into contraction during the current quarter." Hamburg Commercial Bank's latest projections anticipate a sharp GDP decline of 1 percent relative to the prior quarter.
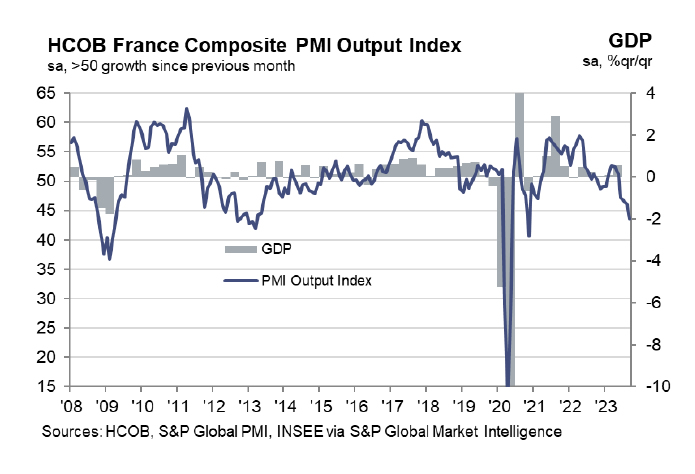
France PMI composite fell to 43.6, 40-mth low
France's economic indicators have signaled alarming trends as the country's PMI Manufacturing slumped to 43.6 in September, marking a 40-month low. PMI Services and Composite figures too painted a grim picture, both plummeting to a 34-month low, with values of 43.9 and 43.5, respectively.
Norman Liebke of Hamburg Commercial Bank expressed concerns regarding the sharp dip in business activity across the service and manufacturing sectors. Liebke's outlook for 2024 suggests an economic growth rate lower than earlier projections. This bleak forecast is mirrored by the manufacturing sector's sentiment, which has turned notably pessimistic. Manufacturers harbor "growth expectations [that] fell to their lowest since May 2020."
For the current quarter, Liebke's predictions are hardly optimistic. He said, "Economic growth for this quarter... points to growth of just 0.2%." Interestingly, he notes that any slight growth will predominantly be propelled by the public service sector, with the private service sector anticipated to contract, reflecting the PMI data.
Furthermore, the decline in unemployment witnessed recently is expected to be short-lived, with rates likely to surge in the upcoming months. On the inflation front, rising input costs and output charges remain a concern. Liebke anticipates a surge in inflation, predicting it "to have risen further in September to a rate of 5.5%" before it begins to taper off.
USD/JPY Technical: 148.40/85 Reached. What’s Next?
- BoJ Governor Ueda’s press conference is likely to be a pivotal moment in guiding market participants’ expectations toward monetary policy normalization away from negative interest rates.
- Bullish exhaustion elements were sighted as the USD/JPY rally hit the 148.40/85 key medium-term resistance.
- The 10-year JGB yield has continued to inch higher to a decade-high of 0.75% and August’s core-core Japan inflation rate remained elevated at 4.3% y/y, a 42-year high.
- The “drumbeat” has increased for a potential bearish reversal in USD/JPY, watch the key short-term support at 147.50.
The USD/JPY has continued to pierce higher despite a string of verbal interventions from Japan’s Ministry of Finance officials to negate the JPY weakness as well as Bank of Japan (BoJ) Governor Ueda’s “quiet exit from ultra-easy monetary policy” comment made earlier this month.
The primary driver of USD/JPY strength has been on the US side of the equation, with relentless upmove in the longer-term 10-year US Treasury yield that broke above a key medium-term resistance of 4.46% and closed yesterday, 21 September US session at 4.50%, its highest level since November 2007 reinforced by a “higher interest rate level for a longer-period” stance undertook by the US Fed after its latest FOMC that concluded on Wednesday.
Even though BoJ has kept its policy interest rate unchanged today at -0.1% which has been widely expected, there is now an increased chance that BoJ Governor Ueda may portray an upbeat view on the inflationary situation in Japan during his press conference later today after a Nikkei Asia news report published yesterday, 21 September that highlighted the potential change of tide in Japan’s more than a decade long of deflation battle as recent comments from BoJ and government officials have hinted that the Japanese economy has hit an inflection point where it can declare victory over sticky deflation.
In addition, the latest Japan’s core-core inflation rate (excluding fresh food and energy) for August came in at an elevated level of 4.3% y/y, unchanged from July, a 42-year high. Also, BoJ has allowed the 10-year Japanese Government Bond (JGB) yield to inch higher towards its implied upper limit of 1% after its new “flexible yield curve control” policy was introduced during July’s monetary policy meeting. So far, the 10-year JGB yield has rallied to 7.6% yesterday, a 10-year high.
All in all, these observations have drummed up the beat for a potential JPY floor to negate its current medium-term bearish trend since January 2023.
Let’s now look at the USD/JPY from a technical analysis perspective.
Bullish exhaustion sighted right at 148.40/85 key medium-term resistance
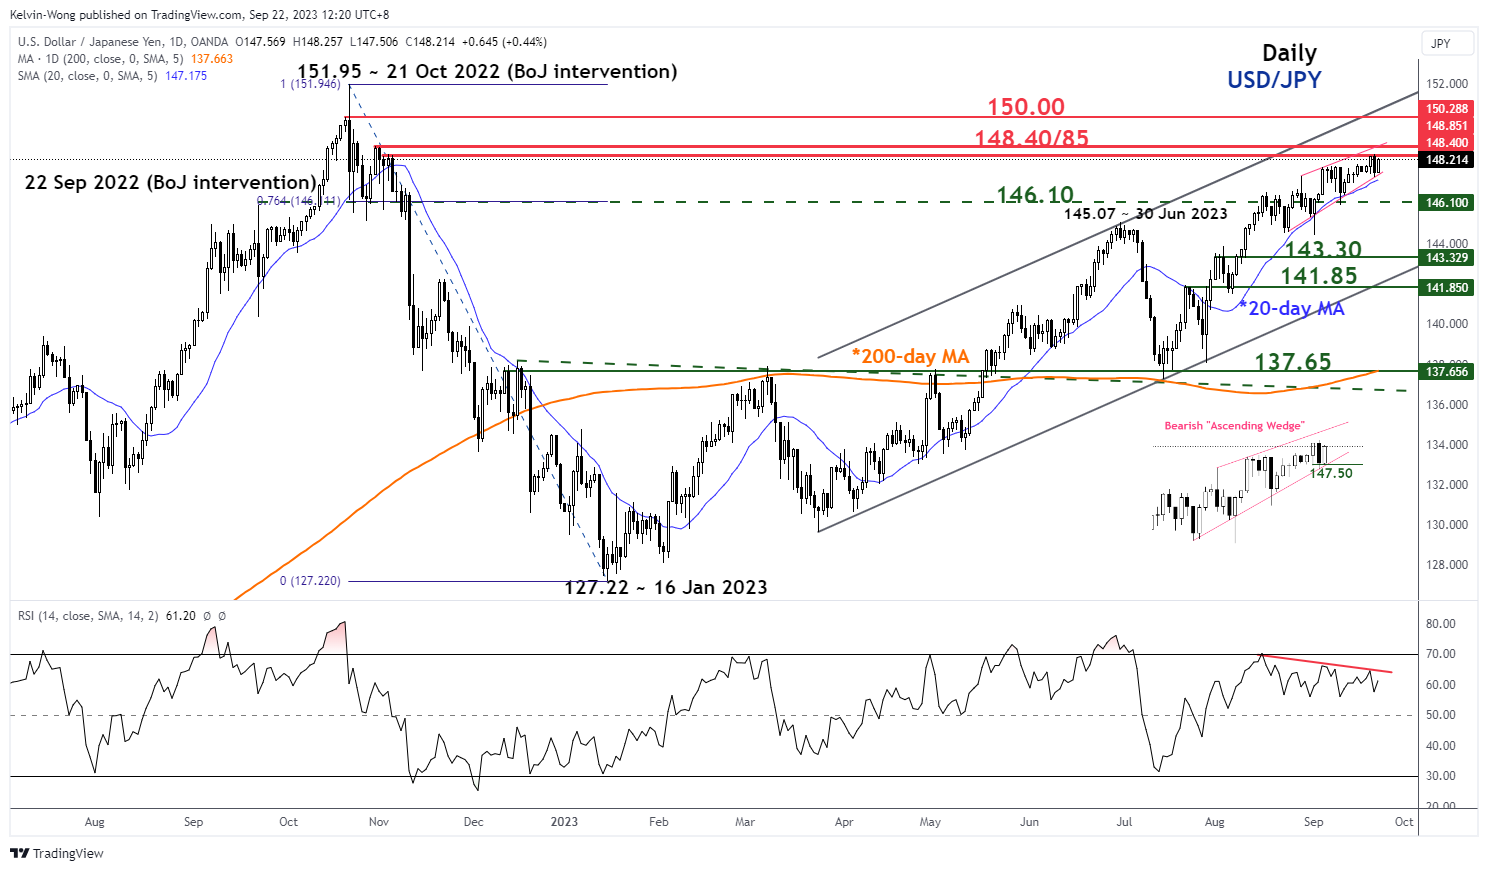
Fig 1: USD/JPY medium-term trend as of 22 Sep 2023 (Source: TradingView, click to enlarge chart)
Since its 23 August 2023 low of 144.54, the USD/JPY has been oscillating within an impending bearish “Ascending Wedge” configuration where its upper limit also coincides with the 148.85 key medium-term resistance (the highest level reached so far this week for USD/JPY was at 148.46 on Thursday, 21 September).
The “Ascending Wedge” is considered a potential bearish reversal configuration because the “higher highs” in price actions have a lesser magnitude than the “lower lows” as indicated by the slopes of the upper and lower limits of the “Ascending Wedge”.
In conjunction, the daily RSI in parallel since the start of the formation of the Ascending Wedge” on 23 August 2023 has traced out a bearish divergence condition after it hit its overbought region on 16 August 2023. These observations suggest that the medium-term upside momentum is waning which in turn supports the potential bearish reversal scenario in USD/JPY.
Watch the 147.50 key short-term support
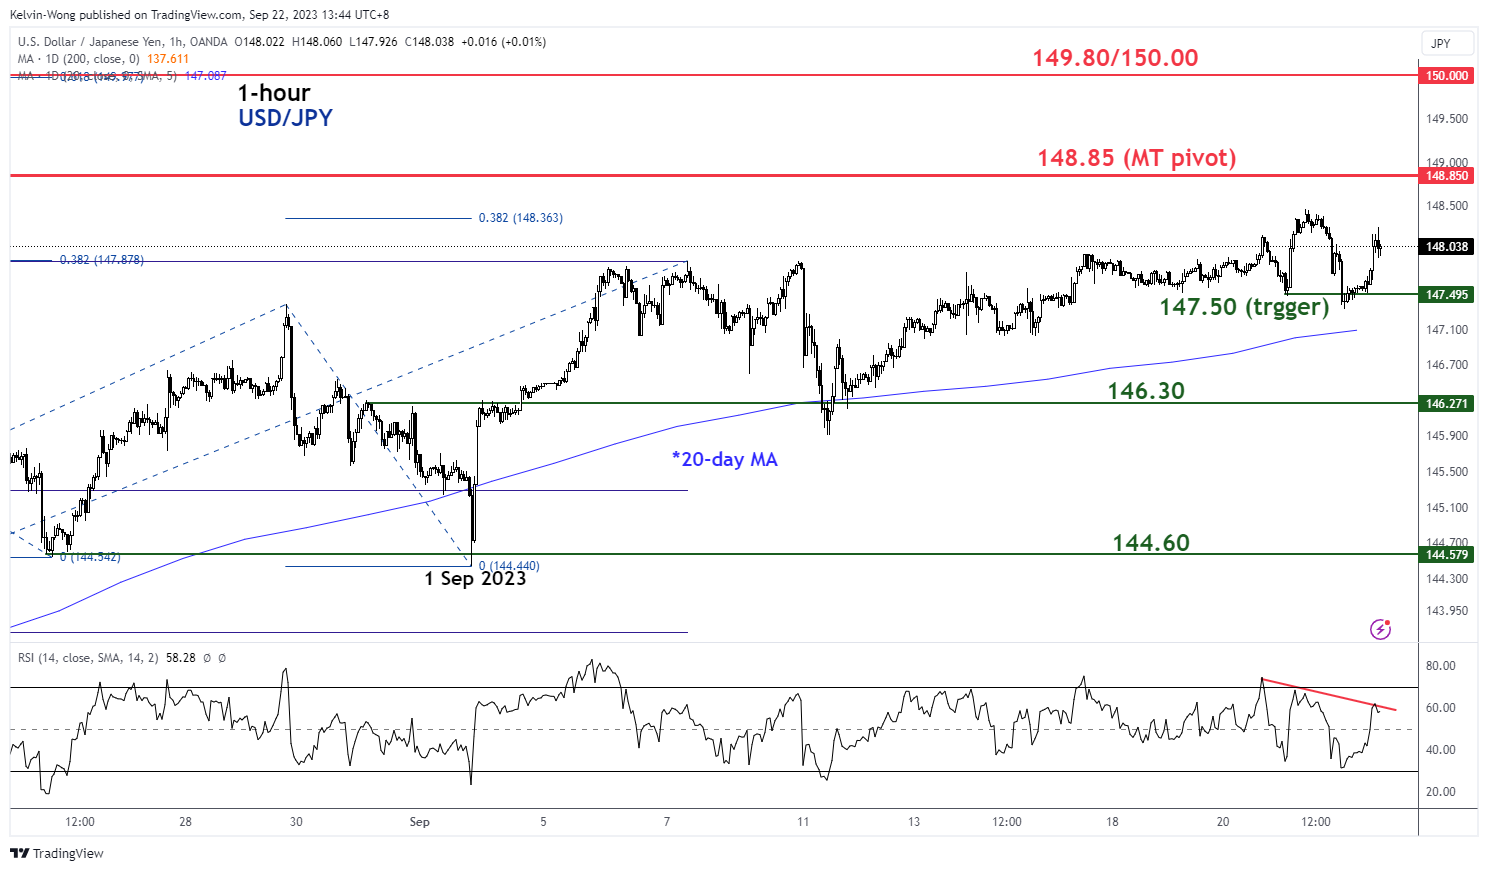
Fig 2: USD/JPY minor short-term trend as of 22 Sep 2023 (Source: TradingView, click to enlarge chart)
In the shorter term as seen on the 1-hour chart, the key support to watch will be at 147.50 which is defined by the lower limit of the bearish “Ascending Wedge” and close to the 20-day moving average.
A break below 147.50 is likely to trigger the potential bearish reversal to expose the next intermediate supports at 146.30 followed by 144.60 (minor swing lows 24 August/1 September 2023) in the first step.
On the flip side, a clearance above 148.85 invalidates the bearish reversal scenario for a squeeze up toward the major resistance of 149.80/150.00 (21 October 2022 swing high area & psychological).
Short Term S&P 500 ($SPX) Bearish Target
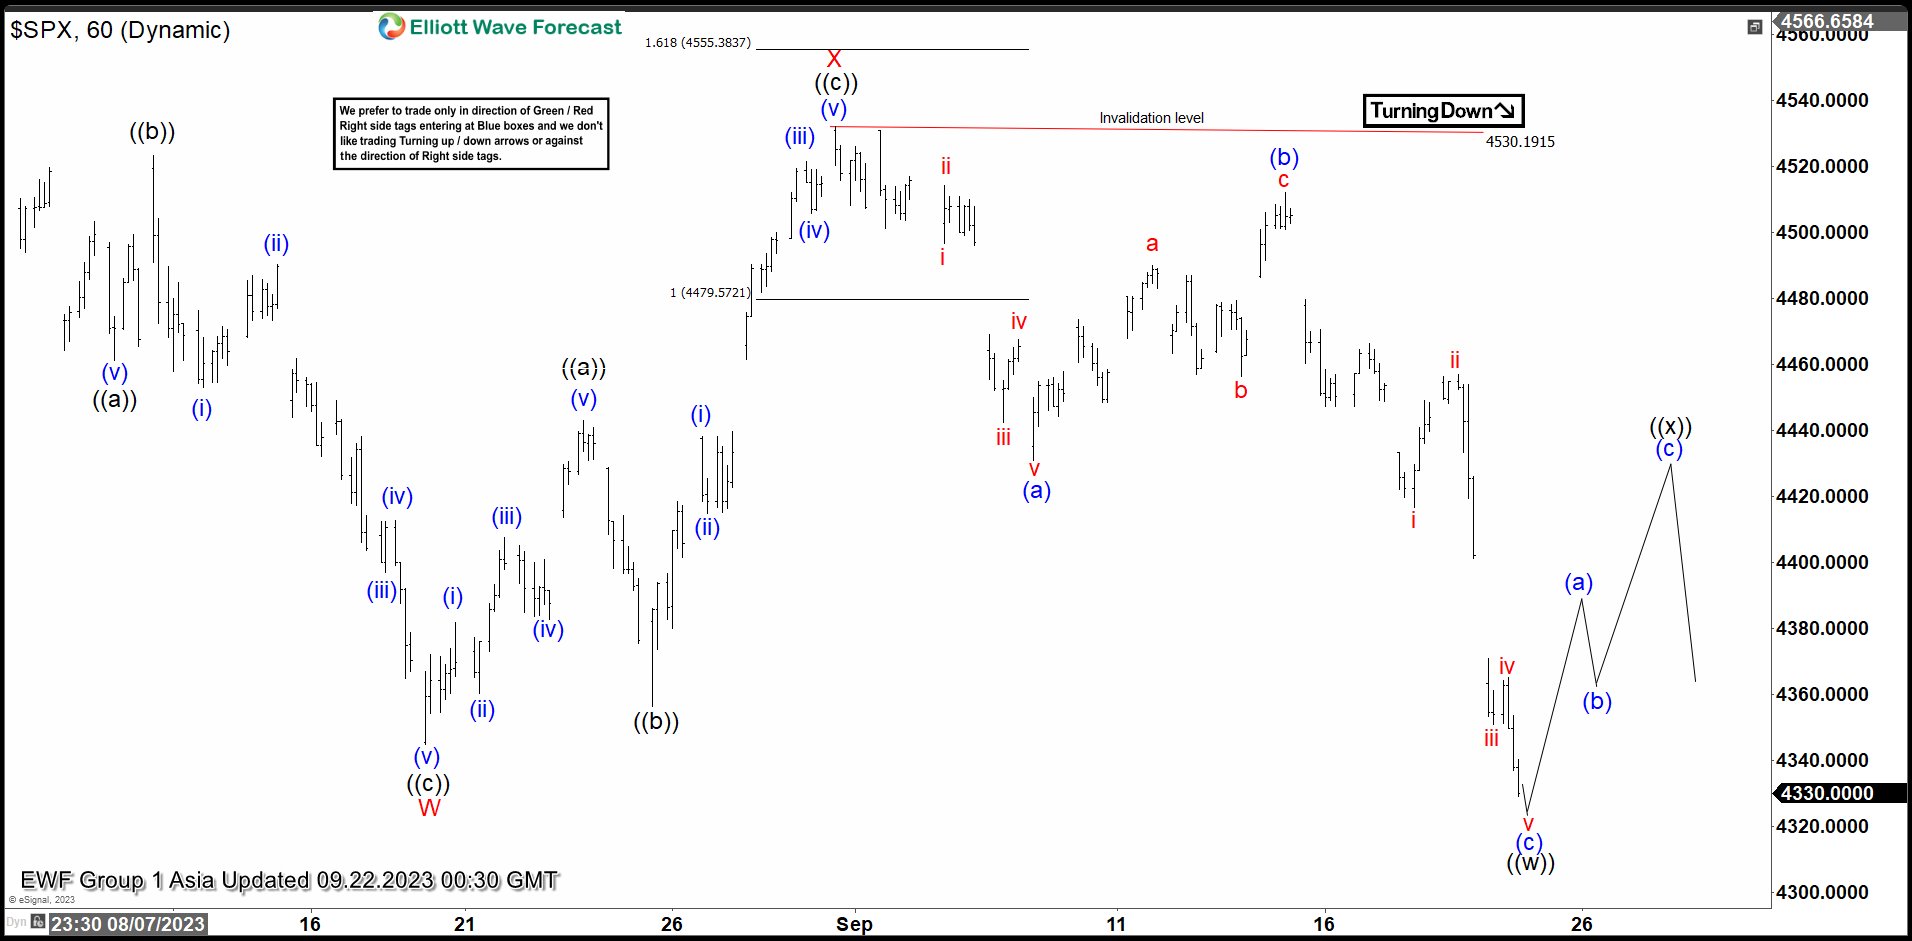
SPX shows a 5 swing sequence from July 27, 2023 high favoring further downside. 5 swing is an incomplete bearish sequence and the Index therefore likely extends lower. The drop from July 27 high unfolded as a double correction Elliott Wave structure. Down from July 27 high, wave ((a)) ended at 4461.33 and pullback in wave ((b)) ended at 4523.34 The Index extended lower again in wave ((c)) towards 4344.75 to complete wave W of the double correction. Wave X connector took the form of a zigzag. Up from wave W, wave ((a)) ended at 4443.18 and wave ((b)) correction ended at 4346.29. Wave ((c)) higher ended at 4532.26 which completed wave X.
The Index turned lower and broke below wave W, confirming the fifth swing lower is in progress. Down from wave X, wave (a) ended at 4430.83 and wave (b) ended at 4511.99 The index dropped further in wave (c) that should be near to end which completed wave ((w)). Once wave ((w)) is finished, the market should begin a wave ((x)) corrective rally in 3, 7 or 11 swing before it resumes to the downside. Near term, as far as pivot at 4532.26 high stays intact, expect further bearish movement in the index to find support in 3, 7, or 11 swing for further upside. Potential short term bearish target lower is 100% – 161.8% Fibonacci extension of wave W. This area comes at 4100 – 4269.
SPX 60 Minutes Elliott Wave Chart
SPX Elliott Wave Video
https://www.youtube.com/watch?v=PcMBCOMrekk