Sample Category Title
USD/JPY Mid-Day Outlook
Daily Pivots: (S1) 159.70; (P) 160.05; (R1) 160.65; More...
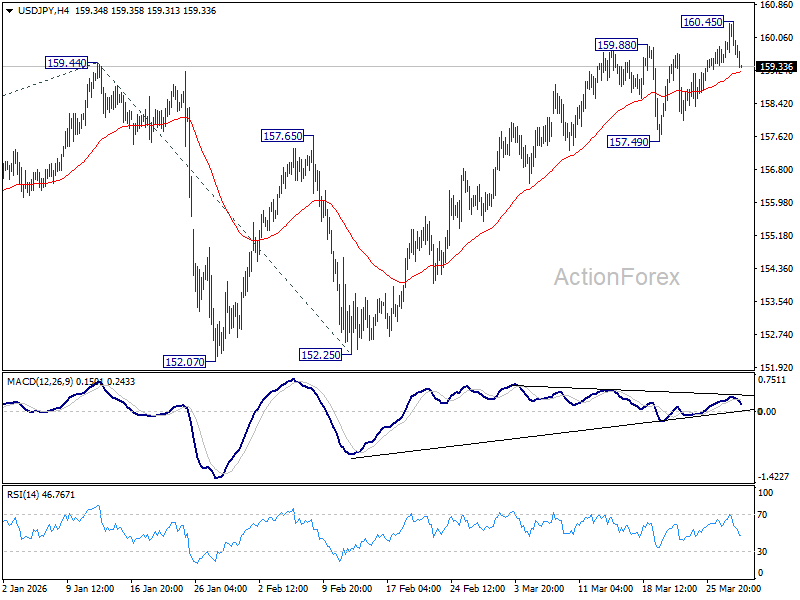
Intraday bias in USD/JPY stays neutral for the moment. Some consolidations would be seen but further rally is still in favor. Above 160.45 will bring retest of 161.94 high. Nevertheless, considering bearish divergence condition in 4H MACD, sustained break of 55 4H EMA (now at 159.20) will indicate short term topping, and turn bias to the downside for 157.94 support instead.
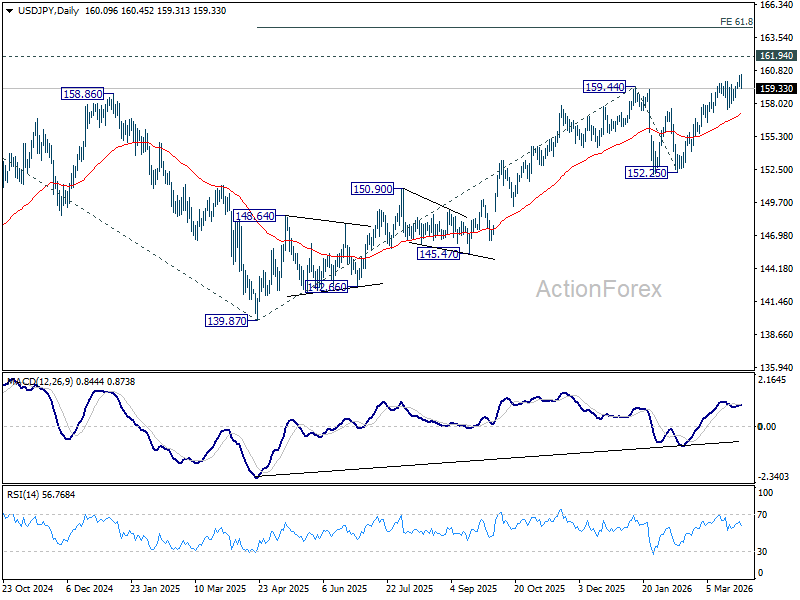
In the bigger picture, outlook is unchanged that corrective pattern from 161.94 (2024 high) should have completed with three waves at 139.87. Larger up trend from 102.58 (2021 low) could be ready to resume through 161.94. This will remain the favored case as long as 55 W EMA (now at 152.97) holds. Firm break of 161.94 will pave the way to 61.8% projection of 102.58 to 161.94 from 139.87 at 176.75.
EUR/JPY Mid-Day Outlook
Daily Pivots: (S1) 184.00; (P) 184.34; (R1) 184.81; More...
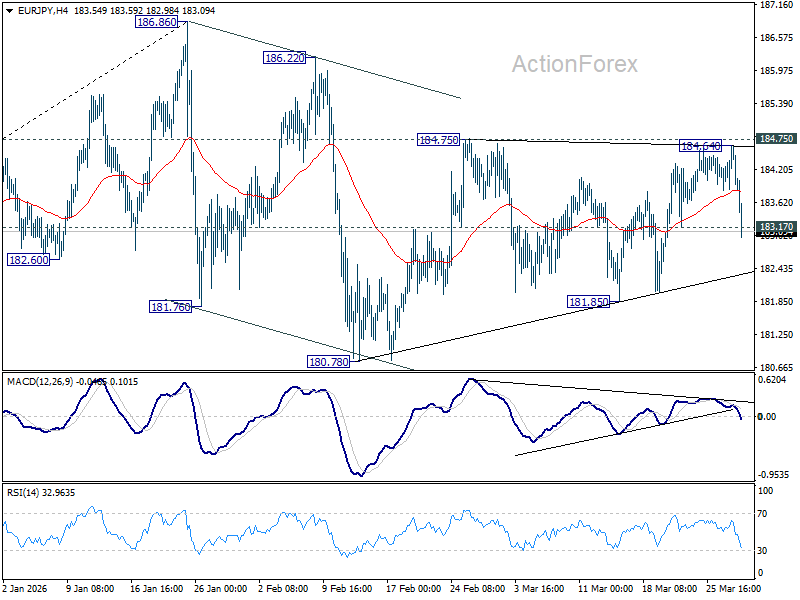
EUR/JPY's accelerated decline and break of 183.17 minor support should confirm rejection by 184.75 resistance. Intraday bias is back on the downside for 181.85 support. Firm break there will argue that the correction from 186.86 is already in the third leg, and should target 180.78 and below. For now, risk will be on the downside as long as 184.64 holds, in case of recovery.
In the bigger picture, a medium term top could be in place at 186.86 and some more consolidations would be seen. Nevertheless, as long as 55 W EMA (now at 175.93) holds, the larger up trend from 114.42 (2020 low) remains intact. Firm break of 186.86 will pave the way to 78.6% projection of 124.37 (2022 low) to 175.41 (2025 high) from 154.77 at 194.88 next.

Dollar Strengthens After Trump Threat to Kharg Island; Yen Gains on “Final Warning”
Dollar strengthened broadly as markets reacted to a sharp escalation in rhetoric from U.S. President Donald Trump, who warned that Iran’s key energy infrastructure could be “completely obliterated” if the Strait of Hormuz is not reopened and a peace deal is not reached “shortly.” In particular, Trump explicitly named Kharg Island—along with Iran’s electric generating plants, oil wells, and desalination facilities—as targets, signaling a shift from targeted strikes toward comprehensive economic disruption.
Kharg Island is central to Iran’s oil exports, handling the vast majority of its crude shipments. Targeting it would effectively remove a significant share of Iranian supply from global markets, intensifying concerns over supply disruption. This explicit threat has heightened fears of a direct hit to global energy flows, reinforcing demand for the Dollar through both safe-haven and energy-linked channels.
The tone of Trump’s comments also suggests a shift in strategy. His reference to a possible extended “stay” in Iran implies more than short-term strikes, raising the prospect of a sustained presence aimed at controlling or disabling key energy hubs. Reports that the Pentagon is preparing to deploy additional ground troops further support the view that markets must now price in a longer-duration conflict.
Meanwhile Yen strengthened as Japanese authorities intensified verbal intervention following USD/JPY’s move toward the 160 threshold. The Ministry of Finance issued what markets interpret as a “final warning,” signaling readiness to act against excessive currency moves "soon". The rebound was further supported by expectations that BoJ policy normalization may come sooner than previously anticipated, after Governor Kazuo's Ueda comment at the parliament.
However, Yen gains remain constrained by the broader strength of the Dollar. Rather than triggering a reversal in USD/JPY, intervention rhetoric is acting as a cap on further upside. As a result, Yen strength is being expressed more clearly in crosses.
Elsewhere, expectations for further tightening are building. Economists are increasingly calling for a more aggressive response from the Reserve Bank of Australia, with forecasts now pointing to consecutive rate hikes in May, June, and August. This reflects growing concern over second-round inflation effects, as higher energy costs are feeding through to wages and services, pushing the RBA from a monitoring stance toward a more proactive tightening phase.
In Europe, markets are also shifting toward a more hawkish outlook for the ECB. Rate hike expectations have firmed, with investors pricing three increases this year, potentially beginning as early as April or June. Policymakers are seen as moving earlier in the cycle, in part to avoid a repeat of the delayed response seen during the previous inflation surge. The overall tone remains cautious, shaped by escalating geopolitical risks and shifting policy expectations.
In currency markets, Yen is the strongest performer so far, followed by Dollar and Swiss Franc, while risk-sensitive currencies such as Aussie and Kiwi remain under pressure.
Gold Rebound From 4100 Suggests “Wyckoff Accumulation,” With Two Key Tests Ahead
Gold’s rebound from 4100 is raising the possibility of a Wyckoff accumulation phase, following a potential selling climax and liquidity flush. However, confirmation still depends on two key tests: a successful secondary test above 4100 and a breakout through the 4600–4800 resistance zone. Until then, the structure remains a developing range rather than a confirmed reversal. Read More.
Japan Issues Intervention “Final Warning” as USD/JPY Breaks 160, but Dollar Strength Prevents Reversal
Japan escalated intervention rhetoric after USD/JPY broke above 160, issuing what markets see as a “final warning.” However, strong Dollar momentum continues to limit the impact, turning intervention into a ceiling rather than a reversal trigger. Yen strength is instead showing more clearly in crosses such as AUD/JPY, where downside has extended. Read More.
BoJ Warns of “Behind the Curve” Risk as Yen Depreciation Amplifies Inflation Pressure
BoJ flagged the risk of falling “behind the curve” as yen depreciation amplifies inflation pressure and raises concerns over second-round effects. Policymakers signaled readiness to accelerate rate hikes if needed, especially if wage growth and cost pass-through persist. The shift highlights growing sensitivity to currency-driven inflation and strengthens the tightening bias. Read More.
Eurozone Sentiment Weakens Further as ESI Falls to 96.6
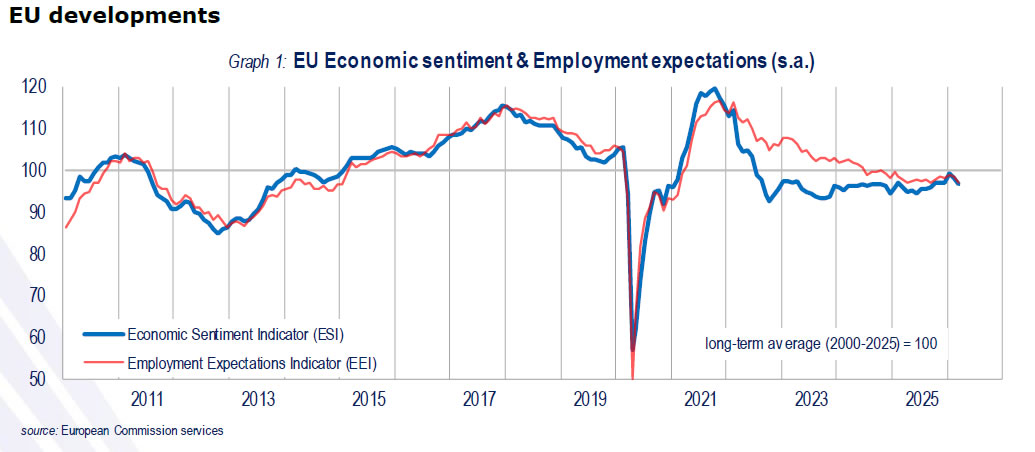
Economic sentiment in the EU and euro area weakened again in March, driven by sharp declines in consumer and retail confidence. Employment expectations also softened, signaling weaker demand and cautious hiring outlook. Growth momentum appears to be fading. Read More
Swiss KOF Barometer Drops Sharply to 96.1, Signals Broad-Based Economic Weakness
Switzerland’s KOF Economic Barometer dropped sharply to 96.1 in March, missing expectations and signaling a broad slowdown. Weakness across manufacturing, exports, and foreign demand highlights growing external headwinds. The data point to softer growth momentum ahead. Read More
EUR/JPY Mid-Day Outlook
Daily Pivots: (S1) 184.00; (P) 184.34; (R1) 184.81; More...
EUR/JPY's accelerated decline and break of 183.17 minor support should confirm rejection by 184.75 resistance. Intraday bias is back on the downside for 181.85 support. Firm break there will argue that the correction from 186.86 is already in the third leg, and should target 180.78 and below. For now, risk will be on the downside as long as 184.64 holds, in case of recovery.
In the bigger picture, a medium term top could be in place at 186.86 and some more consolidations would be seen. Nevertheless, as long as 55 W EMA (now at 175.93) holds, the larger up trend from 114.42 (2020 low) remains intact. Firm break of 186.86 will pave the way to 78.6% projection of 124.37 (2022 low) to 175.41 (2025 high) from 154.77 at 194.88 next.
Gold Rebound From 4100 Suggests “Wyckoff Accumulation,” With Two Key Tests Ahead
Gold’s current resilience in the face of the broad-based Dollar rally is raising the possibility that the recent decline has transitioned into a “Wyckoff Accumulation” phase. The sharp drop to 4,100 last week, followed by a swift recovery toward 4,600, suggests that what initially appeared to be a breakdown may instead have been a liquidity-driven flush, where supply was absorbed rather than expanded.
From a Wyckoff perspective, the move to 4100 can be interpreted as a potential “Selling Climax” (SC) after failing for a month from 5,419. Panic selling and triggered stops provided the liquidity for larger players to accumulate positions. The lack of sustained follow-through selling after the initial drop supports the idea that supply may have been largely exhausted, with the rebound acting as an “Automatic Rally” (AR) within a developing trading range.
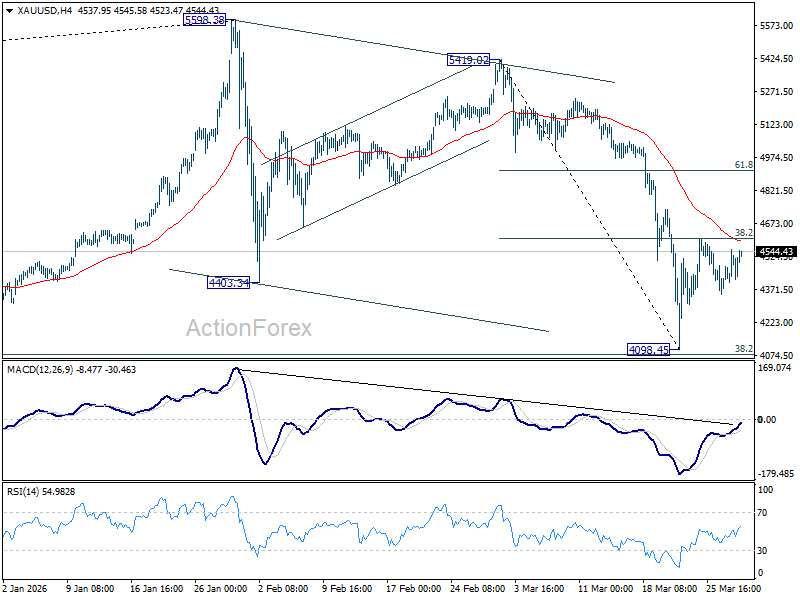
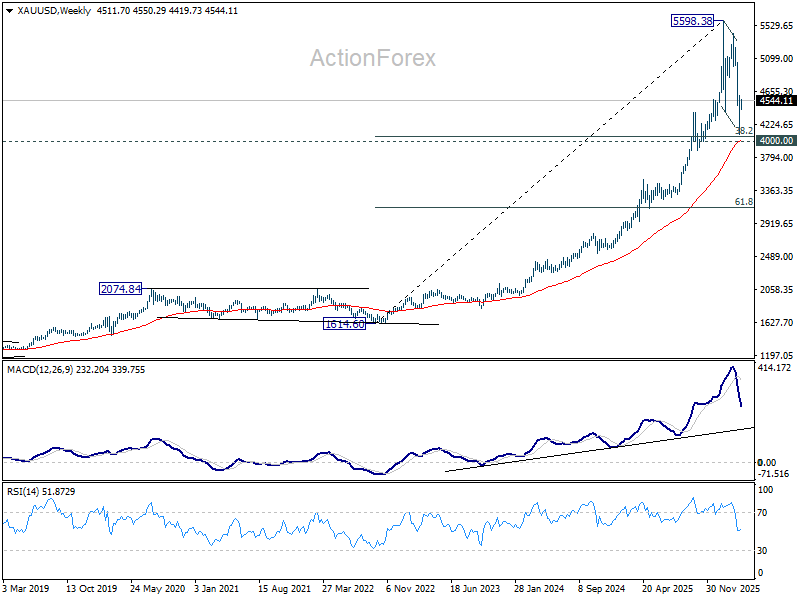
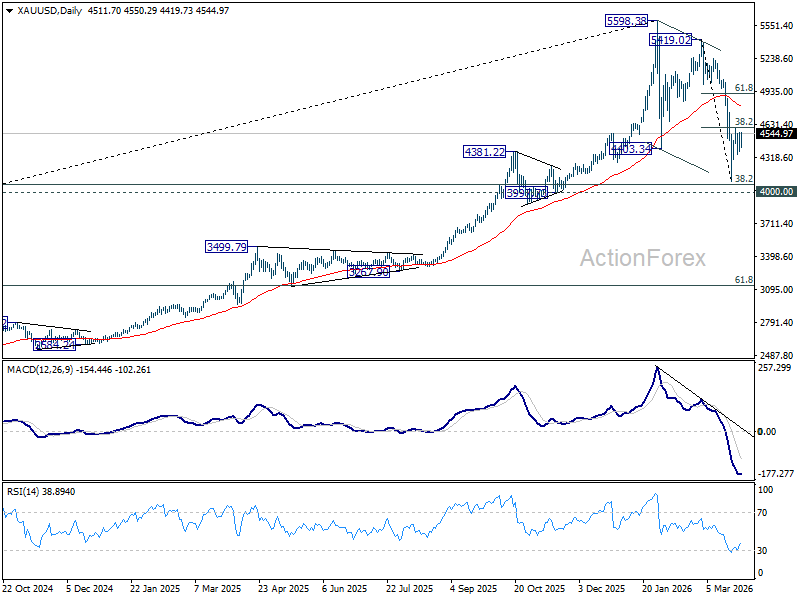
Technically, the importance of the 4000–4100 zone reinforces this interpretation. The area aligns with key structural support, including the 55 W EMA (now at 4,024.10) and 38.2% retracement of 1,614.60 to 5,598.38 at 4,076.57. The strong defense of this zone adds weight to the argument that the market may be attempting to establish a base rather than continue its prior downtrend.
However, the accumulation thesis remains conditional and requires confirmation through two key tests. First, any renewed dip must form a successful “Secondary Test” (ST), ideally on lower volume, holding above the 41,00 region. Such price action would indicate that selling pressure has diminished and that demand is capable of absorbing residual supply.
Second, Gold must break through the resistance zone between 4,600 and 4,800. This area, defined by 38.2% retracement of 5419.02 to 4098.45 at 4602.90 and 55 D EMA (now at 4795.73), represents the upper boundary of the current range. A decisive move above this zone would signal a transition toward the “Markup” phase, confirming that accumulation has progressed sufficiently to support higher prices.
Until these conditions are met, the current structure remains a developing range rather than a confirmed reversal. Failure to hold above 4,100 on a retest would undermine the accumulation view and raise the risk that the broader decline from the March highs is still unfolding.
In the broader macro context, Gold’s ability to hold firm despite Dollar strength suggests that underlying demand is becoming more independent of traditional currency dynamics. This potential decoupling, if sustained, would further support the accumulation scenario, though it remains contingent on confirmation from both price structure and follow-through buying.
Eurozone Sentiment Weakens Further as ESI Falls to 96.6
Sentiment in Europe deteriorated further in March, with the Economic Sentiment Indicator falling from February to 96.6 in the Eurozone and to 96.7 in the EU, both moving further below the long-term average of 100. The Employment Expectations Indicator also declined to 97.3 and 96.4 respectively.
The decline in sentiment was driven primarily by a sharp drop in confidence among consumers and retailers, with services also contributing modestly to the downside. Construction offered a partial offset with some improvement, while industrial confidence remained broadly stable.
Across major economies, the deterioration was uneven but broadly negative. France (-3.7) and Spain (-2.4) saw the largest declines. The Netherlands (-1.5) and Italy (-1.3) also recorded notable drops. Germany and Poland were relatively stable, but not strong enough to offset broader regional weakness.
Three Forces Driving the Dollar Upwards
- Safe-haven demand, trade flows and shifting FOMC expectations are bolstering the DXY.
- The yen could benefit from capital repatriation.
The dollar index is approaching the highs of its 11-month range, whilst Donald Trump reports on successful negotiations with Iran. The US President has stated that Iran has met most of his 15 demands. There are rumours of a ground operation with various objectives, ranging from the capture of Kharg Island with its oil infrastructure to the seizure of 1,000 pounds of uranium belonging to Tehran.
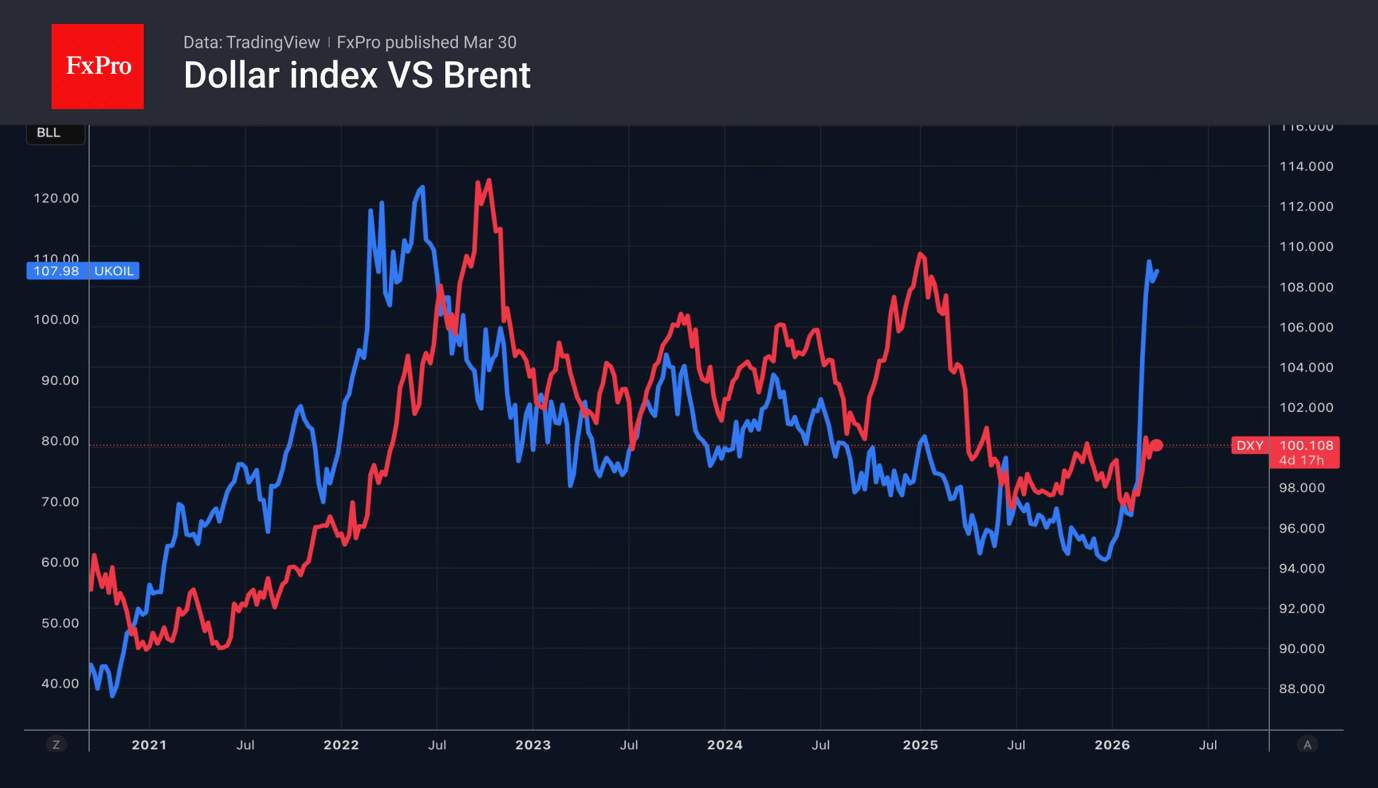
The White House’s intentions are increasingly only heightening investor jitters, forcing them to flee to the US dollar as a safe haven. At the same time, rising oil prices are boosting demand for the greenback, as the currency benefits from higher oil prices. A third supportive factor is the shift in the Fed’s stance from imminent rate cuts to a readiness to raise rates to combat inflation.
In such conditions, macroeconomic data and monetary policy are destined to take a back seat. Bloomberg experts expect US employment to rise by 60,000 in March following a decline of 92,000 in February. Unemployment, in their view, will remain at 4.4%. However, an increasing number of FOMC officials view inflationary risks as a more pressing threat than a cooling labour market. As a result, the futures market is pricing in a 92% probability that rates will not fall in 2026, compared with just 4% before the conflict in the Middle East.
Meanwhile, rumours of Japan’s activity in the oil market and the intensification of verbal interventions have contributed to the retreat of USDJPY, which has pulled back from the psychologically important 160 level.
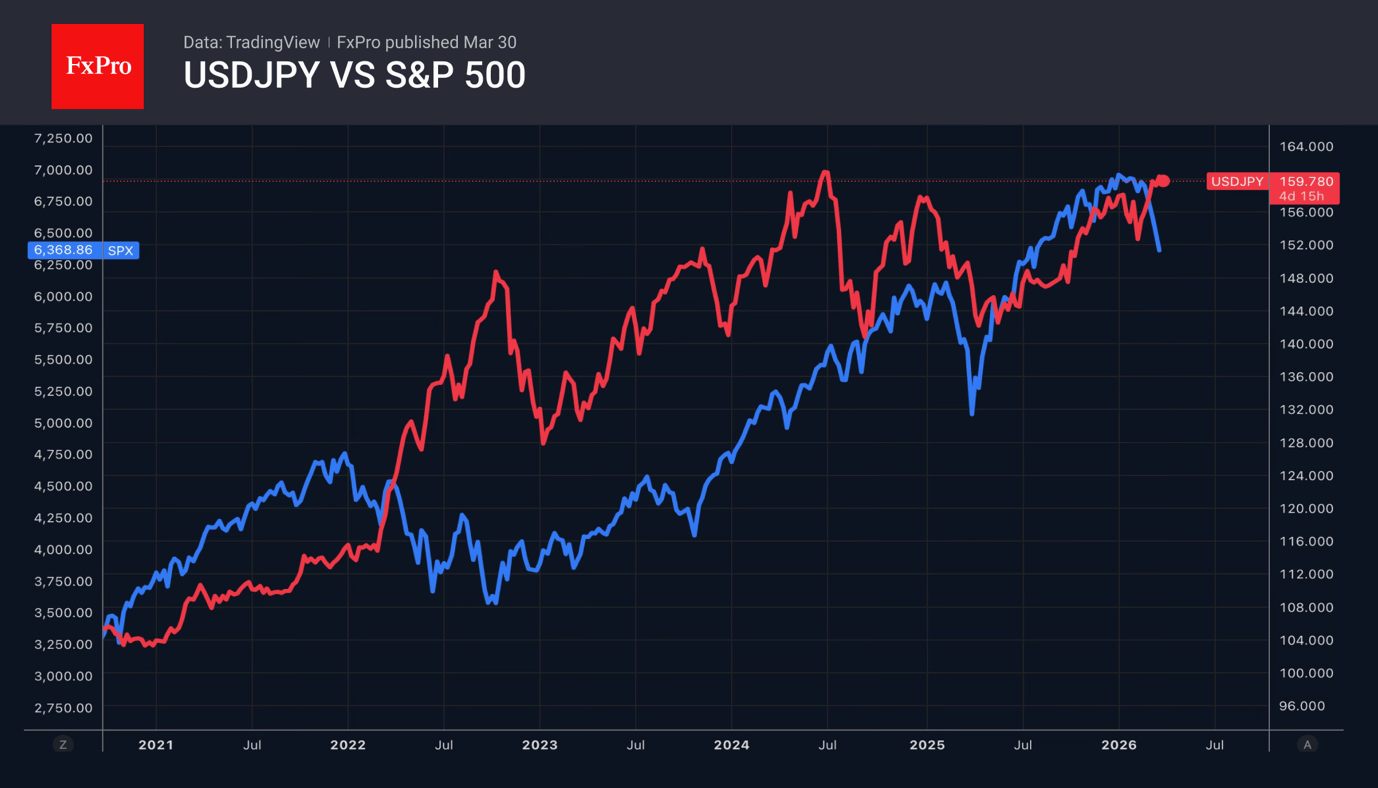
Eurizon SLJ Capital believes that as the conflict escalates, the US dollar will strengthen against most currencies, but not against the yen. The yen could benefit from capital repatriation amid a widespread decline in stock indices.
Despite attempts to rise, gold remains under pressure. The precious metal has transformed from a safe-haven asset into a source of liquidity. Investors are selling it to meet margin requirements on shares and bonds, whilst central banks are selling to support their economies and stabilise national currencies.
EUR/USD: Middle East Conflict Still Determines Sentiment
EUR/USD edged higher on Monday after earlier declines, reaching 1.1516. The US dollar continues to draw support from safe-haven demand amid the ongoing Middle East conflict, which has now entered its fifth week with no signs of resolution.
Tensions escalated following Donald Trump’s remarks regarding the possible confiscation of Iranian oil and control of the export hub on Kharg Island. At the same time, the US is increasing its military presence in the region and preparing for potentially prolonged operations. Iran-aligned forces, including the Houthis in Yemen, have also joined the conflict.
Rising oil prices in this environment are amplifying inflation risks and reinforcing expectations of tighter Federal Reserve policy. The market is increasingly pricing in the possibility of a rate hike this year, marking a notable shift from earlier expectations of rate cuts.
Investor focus now turns to US macroeconomic data. This week will see the release of labour market indicators, including JOLTS and ADP figures, as well as the key March employment report due on Friday.
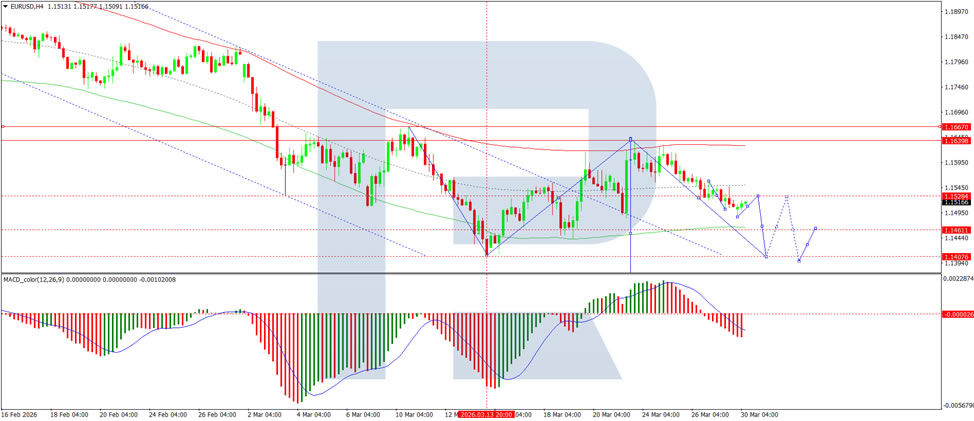
Technical Analysis
On the H4 chart, EUR/USD is forming a consolidation range around 1.1528. A downside breakout is expected, with a continuation wave to 1.1404 as a near-term target, followed by a subsequent rebound to 1.1528. Technically, this scenario is confirmed by the MACD indicator – its signal line is below zero and pointing firmly downwards, reflecting sustained bearish momentum and the potential for the downtrend to persist.
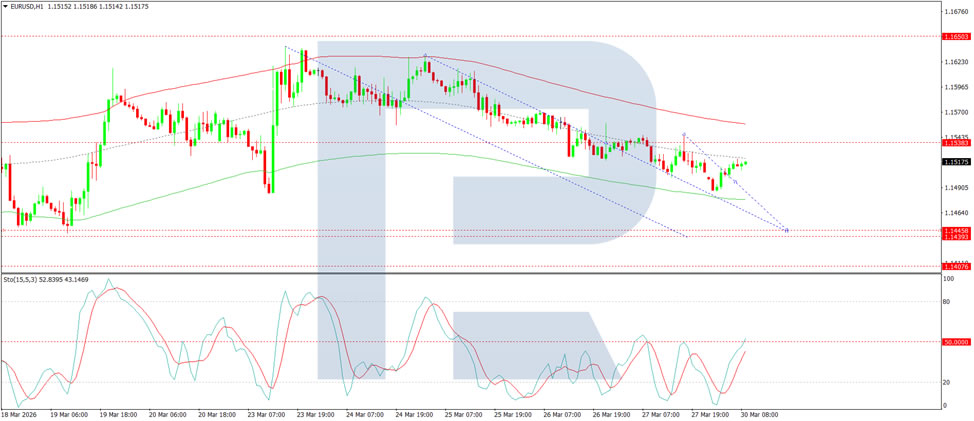
On the H1 chart, the market is forming the structure of the next downward wave towards 1.1440. After reaching this level, a rebound to 1.1535 is expected, potentially extending the move to 1.1647. Technically, this scenario is confirmed by the Stochastic oscillator – its signal line is below 50 and pointing firmly downwards towards 20.
Conclusion
EUR/USD remains firmly driven by geopolitical forces, with the Middle East conflict entering its fifth week and showing no signs of de-escalation. The US dollar’s safe-haven appeal continues to dominate, while escalating tensions and rising oil prices have shifted market expectations from rate cuts to the possibility of a Fed hike later this year. Technical indicators point to further near-term downside, although this week’s US labour market data could introduce volatility. Until there is a tangible shift in the geopolitical landscape, the euro is likely to remain under pressure.
GBP/JPY Daily Outlook
Daily Pivots: (S1) 212.15; (P) 212.65; (R1) 213.08; More...
GBP/JPY falls notably today but stays above 210.77 support. Intraday bias remains neutral first. on the upside, above 213.28/9 resistance will resume the rise from 207.20 to retest 214.98 high. However, firm break of 210.77 will argue that the pattern from 214.98 has entered its third leg already. Deeper decline should then be seen to 209.15 and then 207.20.
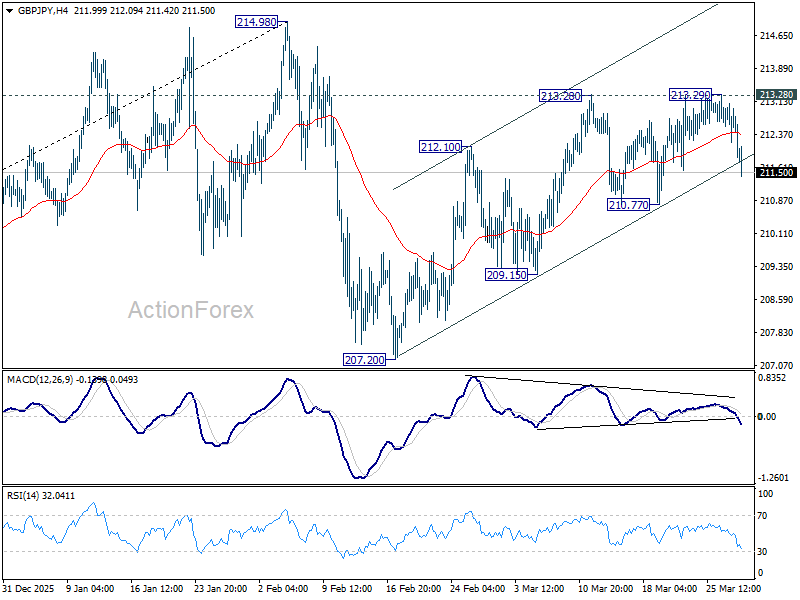
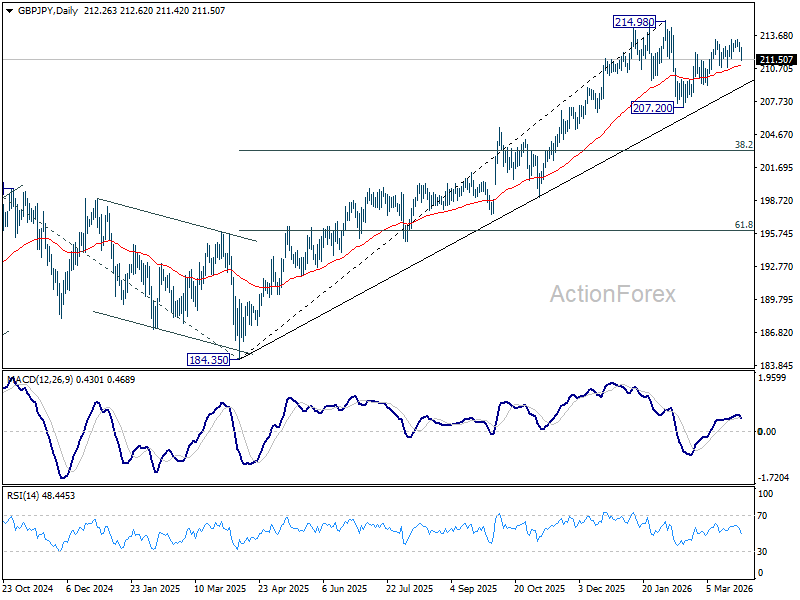
In the bigger picture, up trend from 123.94 (2020 low) is still in progress. Firm break of 214.98 will target 61.8% projection of 148.93 (2022 low) to 208.09 (2024 high) from 184.35 at 220.90. This will remain the favored case as long as 55 W EMA (now at 203.13) holds, even in case of another deep pullback.
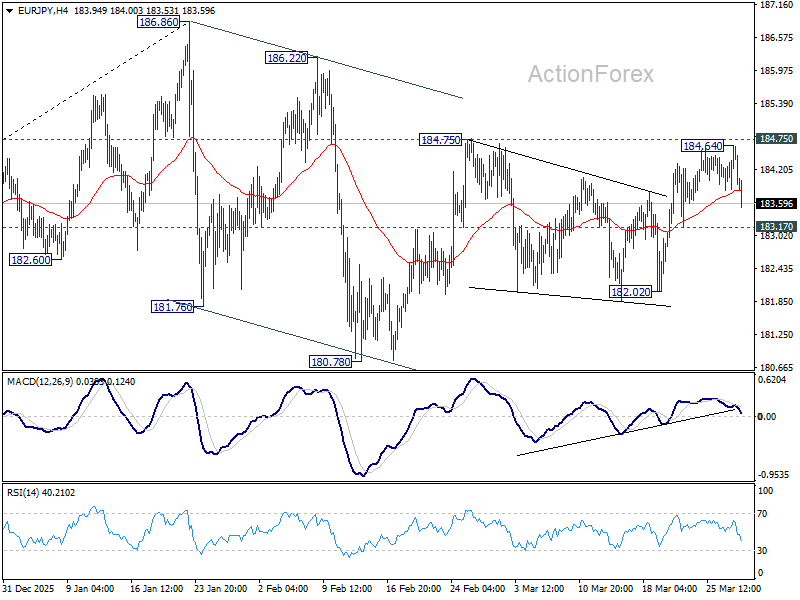
EUR/JPY Daily Outlook
Daily Pivots: (S1) 184.00; (P) 184.34; (R1) 184.81; More...
EUR/JPY falls notably today but stays above 183.17 minor support. Intraday bias remains neutral first. On the upside, break of 184.75 will resume the rise from 180.78 to retest 186.86 high. On the downside, however, below 183.17 minor support will turn bias back to the downside for 182.02 and below.
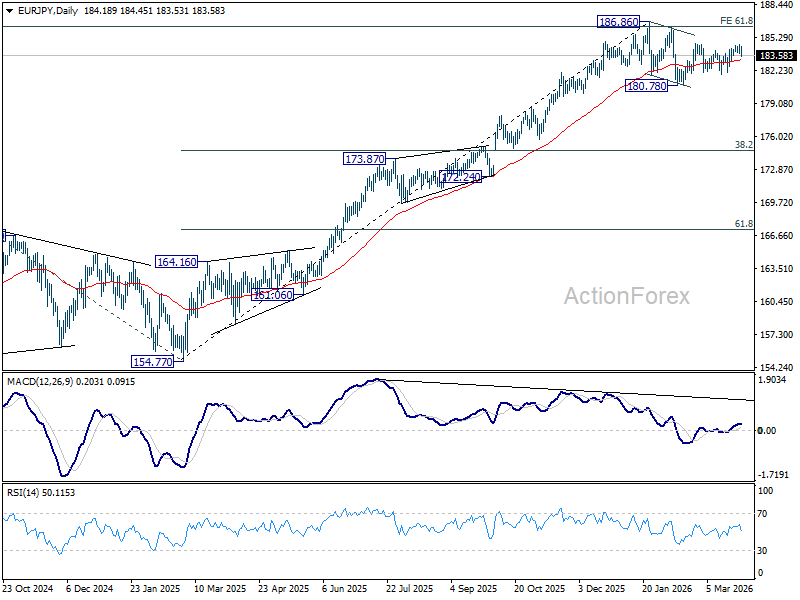
In the bigger picture, a medium term top could be in place at 186.86 and some more consolidations would be seen. Nevertheless, as long as 55 W EMA (now at 175.93) holds, the larger up trend from 114.42 (2020 low) remains intact. Firm break of 186.86 will pave the way to 78.6% projection of 124.37 (2022 low) to 175.41 (2025 high) from 154.77 at 194.88 next.
EUR/GBP Daily Outlook
Daily Pivots: (S1) 0.8637; (P) 0.8650; (R1) 0.8664; More…
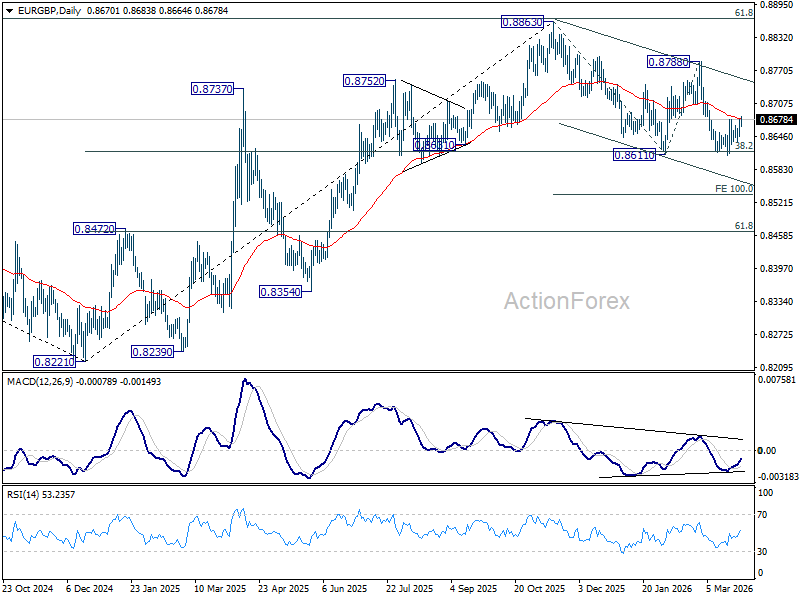
Intraday bias in EUR/GBP is mildly on the upside as rebound from 0.8610 resumes. Sustained trading above 55 D EMA (now at 0.8680) will confirm short term bottoming, and bring stronger rally back to 0.8788 resistance. However, rejection by 55 D EMA will set up another fall through 0.8611 to 100% projection of 0.8863 to 0.8611 from 0.8788 at 0.8536.
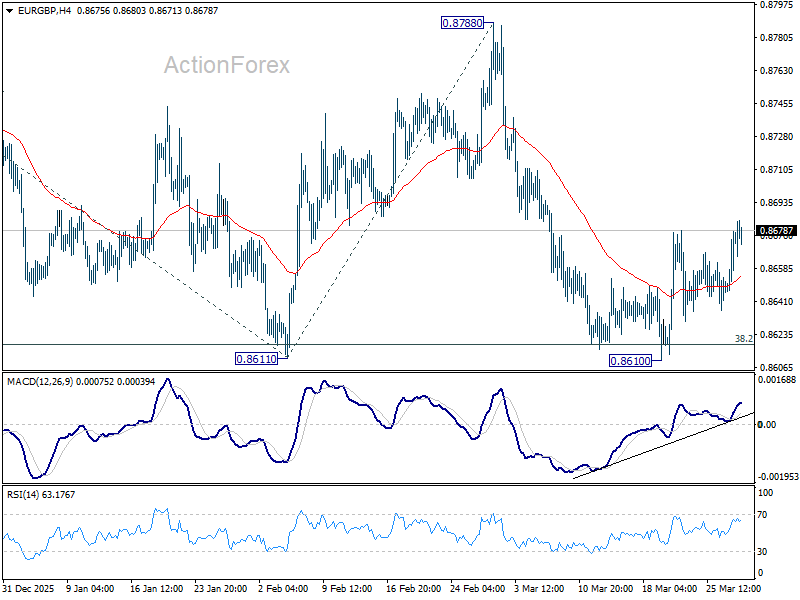
In the bigger picture, current development revived the case that whole rise from 0.8221 (2024 low) has completed at 0.8863, after rejection by 61.8% retracement of 0.9267 (2022 high) to 0.8221 at 0.8867. Sustained trading below 38.2% retracement of 0.8821 to 0.8863 at 0.8618 will confirm this case, and bring deeper fall to 61.8% retracement at 0.8466 at least. For now, medium term outlook is neutral at best as long as 0.8863 resistance holds.