Sample Category Title
USD/CHF Daily Outlook
Daily Pivots: (S1) 0.8956; (P) 0.8967; (R1) 0.8989; More....
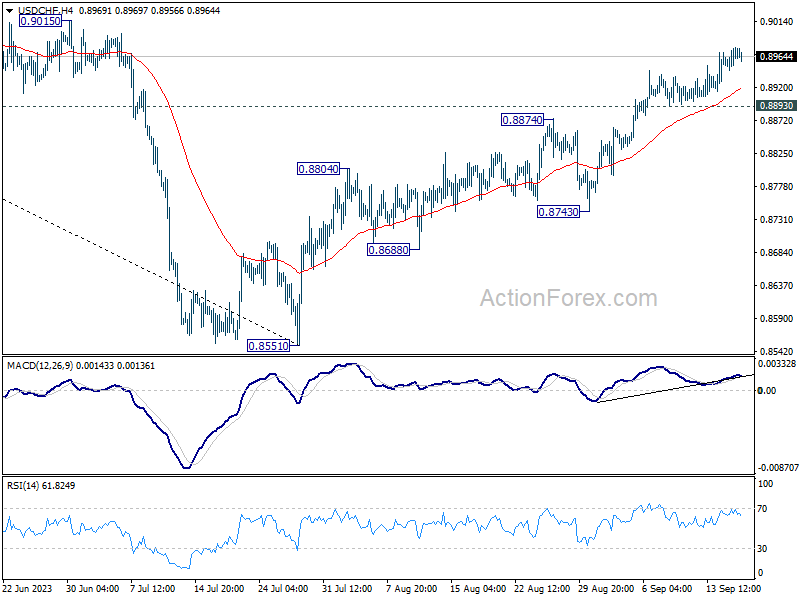
Intraday bias in USD/CHF remains on the upside for the moment. Current rise from 0.8551 is in progress for 0.9146 cluster resistance. On the downside, however, break of 0.8893 support will argue that a short term top is possibly formed, and turn bias back to the downside for 55 D EMA (now at 0.8854).
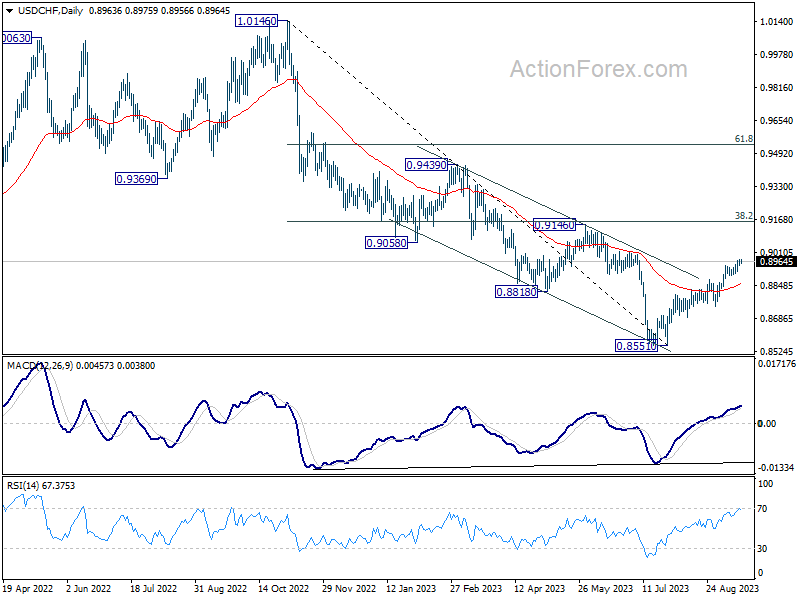
In the bigger picture, rebound from 0.8551 medium term bottom is currently seen as a correction to the downtrend from 1.0146 (2022 high). Further rally would be seen to 0.9146 cluster resistance (38.2% retracement of 1.0146 to 0.8551 at 0.9160). Strong resistance could be seen there to limit upside, at least on first attempt.
USD/CAD Daily Outlook
Daily Pivots: (S1) 1.3497; (P) 1.3524; (R1) 1.3553; More....
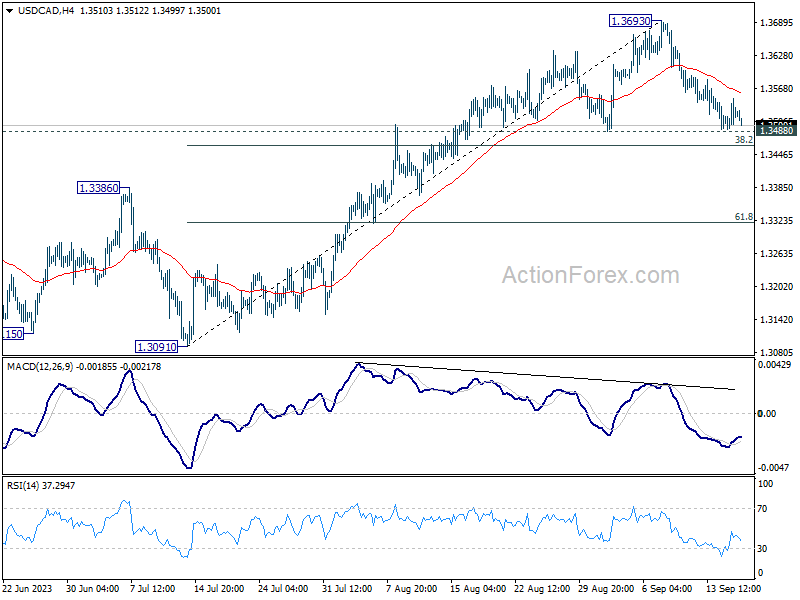
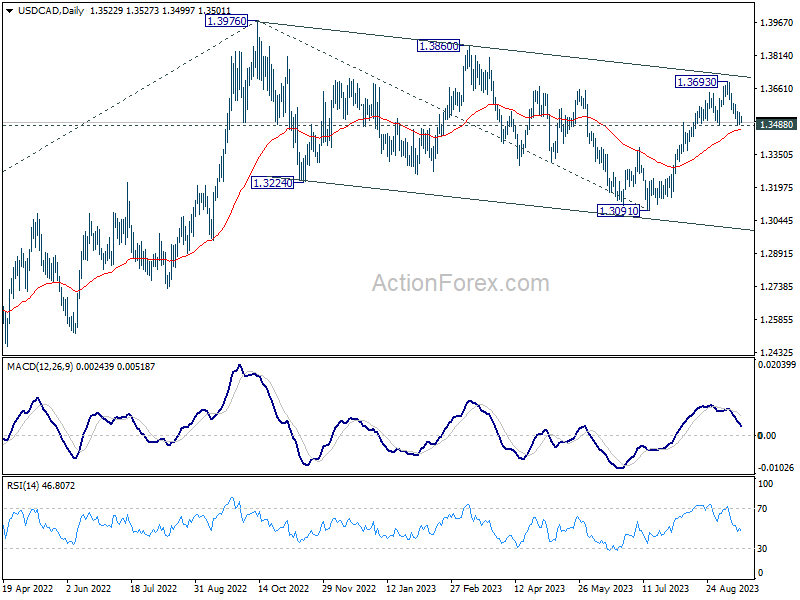
Intraday bias in USD/CAD stays neutral for the moment. Further rally is still expected as long as 1.3488 support holds. On the upside, break of 1.3693 will resume the rise from 1.3091 and target 1.3860 resistance next. However, firm break of 1.3488 will bring deeper fall to 61.8% retracement of 1.3091 to 1.3693 at 1.3321.
In the bigger picture, price actions from 1.3976 are viewed as a corrective pattern. Strong support from 55 D EMA (now at 1.3465) will solidify the case that it has completed with three waves down to 1.3091 already. Break of 1.3976 will target 61.8% projection of 1.2005 to 1.3976 from 1.3091 at 1.4309. However, sustained break of 55 D EMA will indicate that the pattern is extending with another falling leg before completion.
Canadian Dollar Strengthens Ahead of Inflation News
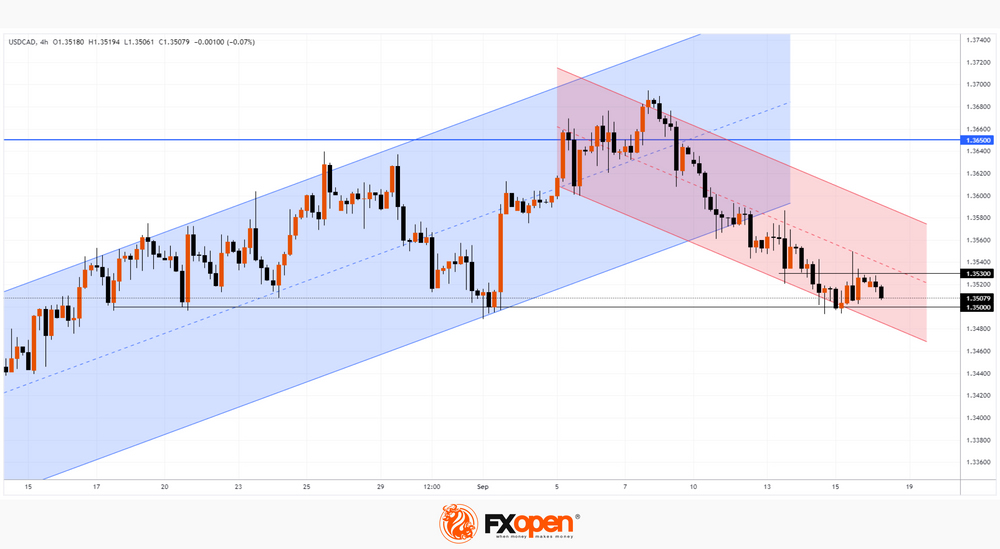
On September 7, we wrote that the level of 1.365 could serve as resistance, from which the price will form a bearish reversal.
As the USD/CAD chart shows, the rate dropped from this resistance to the psychological level of 1.3500, which served as support.
Wherein:
→ The bullish trend (shown by the blue channel) is broken. Facing resistance at 1.365, the bulls failed to reach the upper boundary of the channel, which was a sign of weakening uptrend. One could also observe bearish divergences on a number of indicators.
→ The price at the beginning of the week is in a downward trend, which is shown by the red channel.
→ The price formed a rebound from the psychological level of 1.3500 at the end of last week, but the momentum on the rebound quickly faded. And a return to support at 1.35 means the inability of the bulls to seize the initiative and the unrelenting pressure of the bears.
→ Level 1.353, which served as local support, now resists price growth. The long upper shadow on the September 15 candle confirms bearish pressure.
Thus, support 1.35 is in danger of being broken. And perhaps a successful bear attack will occur tomorrow at 15:30 GMT+3, when news on inflation in Canada will be published. It is expected to remain at 3.7%, however, given the significant increase in energy prices in August, surprises may occur that will affect the current balance of supply and demand in the USD/CAD market.
This article represents the opinion of the Companies operating under the FXOpen brand only. It is not to be construed as an offer, solicitation, or recommendation with respect to products and services provided by the Companies operating under the FXOpen brand, nor is it to be considered financial advice.
EUR/JPY Technical: Bulls May Have Reached a Key Bearish Reversal Zone
- The 9-month rally seen in the EUR/JPY has reached a key major resistance zone of 158.55/159.80.
- Several technical elements have started to hint at signs of bullish exhaustion where the next potential movement may be a multi-day to multi-week bearish mean reversion/counter-trend within a major uptrend phase.
- The short-term resistance and support will be at 158.55 and 155.90 respectively.
Since the start of the year, the EUR/JPY has rallied by 16.30% (2,239 pips) from its 2 January 2023 low of 137.39 to a recent high of 159.77 printed on 30 August 2023 within a major uptrend phase in place since March 2022 low of 124.39.
In the lens of technical analysis, directional price movements do not move in a vertical fashion forever, but instead, they oscillate within a longer-term trend. Also, such oscillations can be relatively more significant than the others because of the emergence of bearish momentum or bullish momentum at key resistance or support levels therefore in turn leading to potential significant mean reversion/counter-trend movements that go against the impulsive movements of the longer-term trend phases for a certain period.
The EUR/JPY is likely to be in transition to a potential multi-day to multi-week bearish mean reversion movement within a longer-term major uptrend phase that is still intact since the March 2022 low of 124.39.
Weekly indecisive price actions with bearish momentum
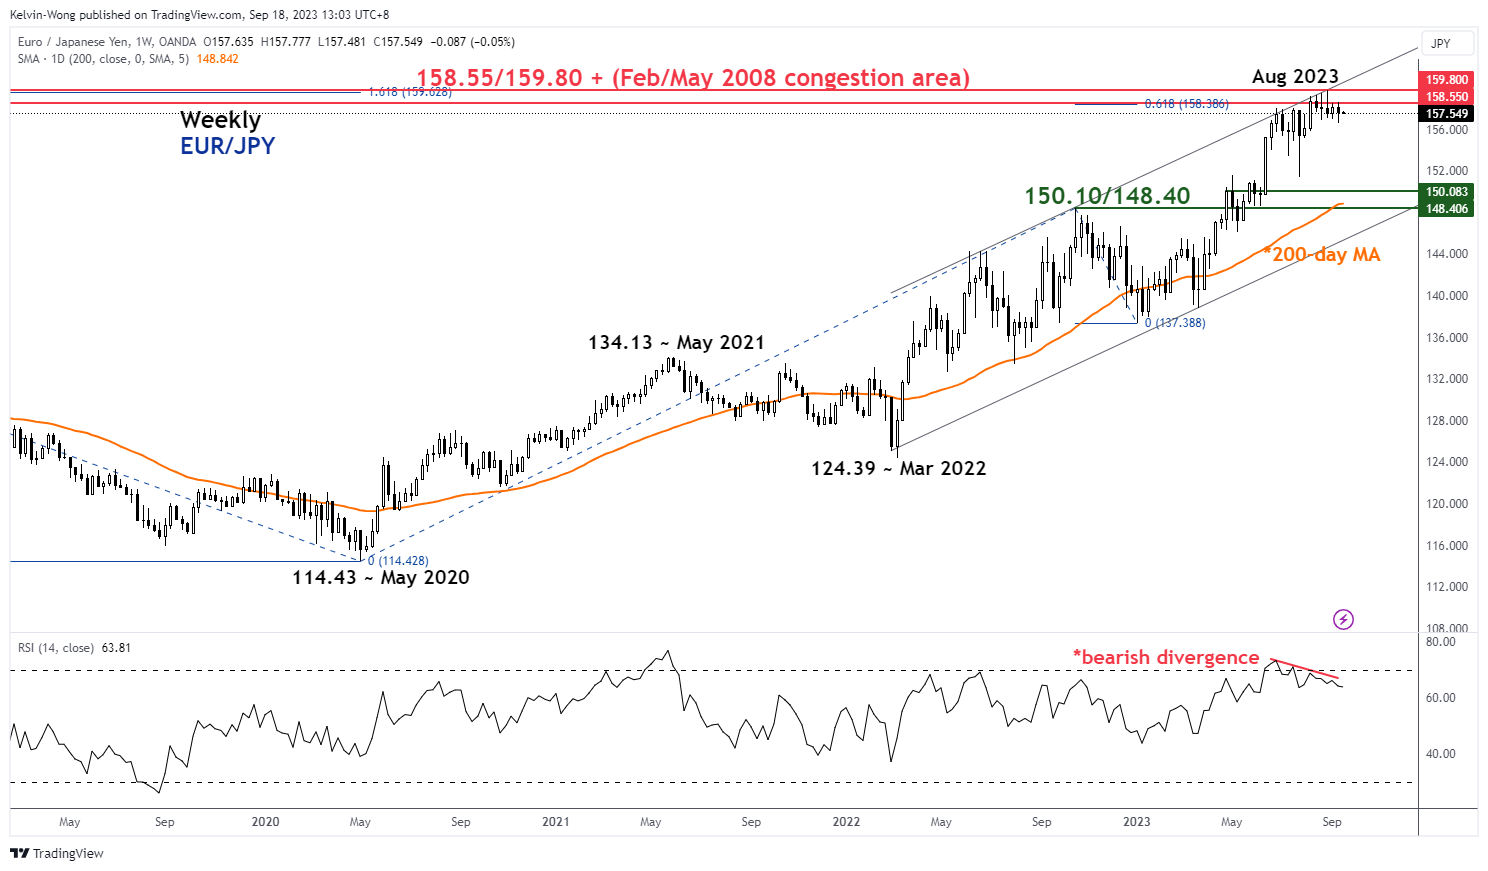
Fig 1: EUR/JPY major trend as of 18 Sep 2023 (Source: TradingView, click to enlarge chart)
As seen in the weekly chart of EUR/JPY, the recent price actions since the middle of August 2023 have formed a series of “Spinning Top” candlestick patterns which has implied some form of hesitancy by the prior bullish tone.
This set of “indecisive” behaviour has taken place right at a key resistance zone of 158.55/159.80 which is defined as the upper boundary of the major ascending channel in place since March 2022, the February/March 2008 congestion area, and a Fibonacci extension cluster.
In addition, the weekly RSI has formed a bearish divergence condition at its overbought zone which indicates a potential emergence of medium-term bearish momentum.
Shorter term price actions have broken below the 20-day moving average
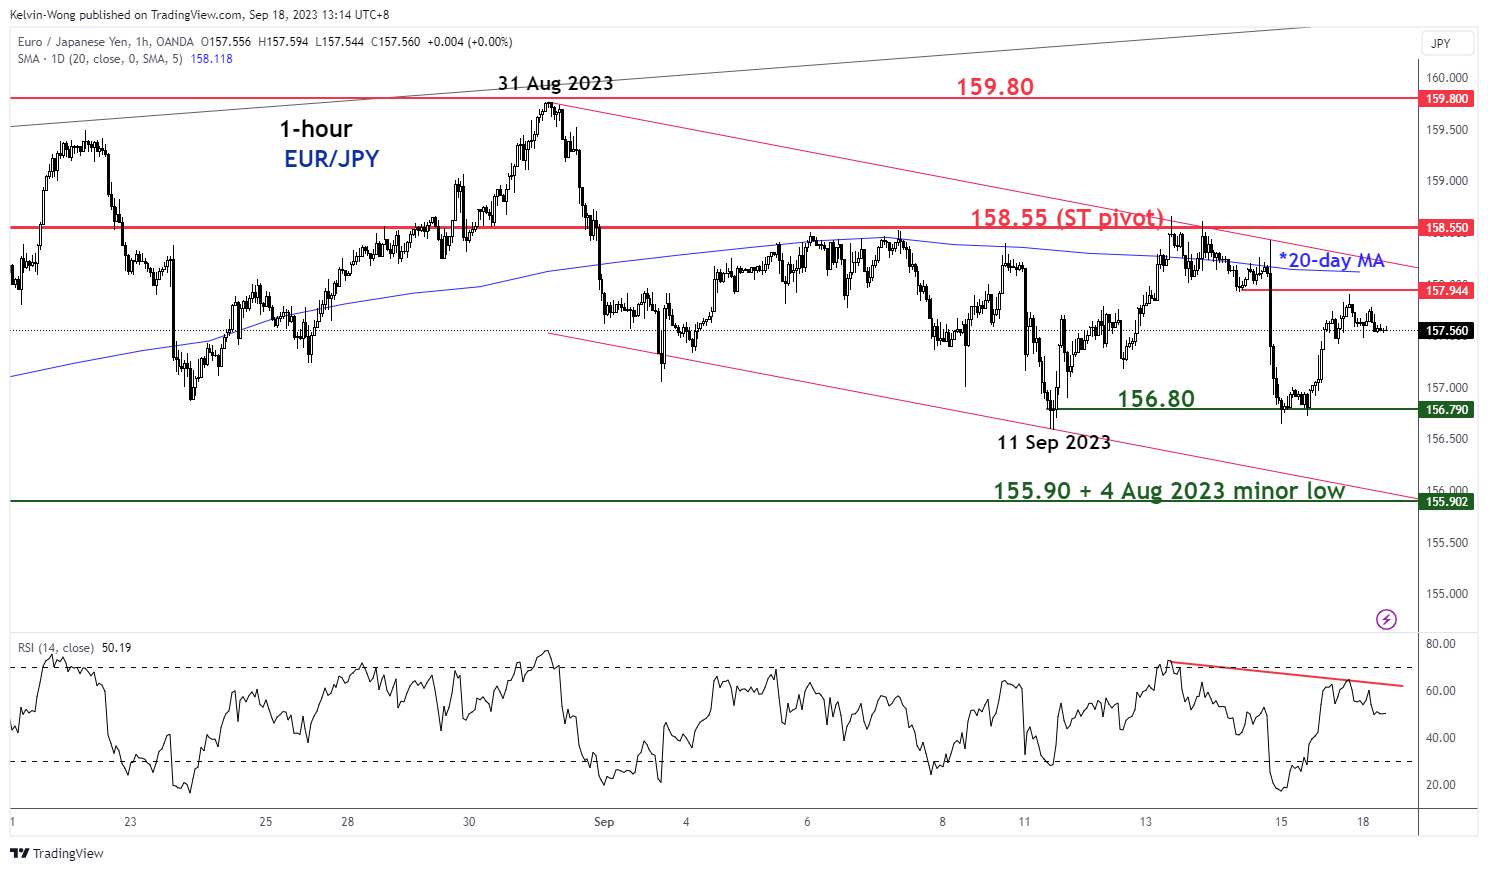
Fig 2: EUR/JPY minor short-term trend as of 18 Sep 2023 (Source: TradingView, click to enlarge chart)
In the shorter term as seen on the 1-hour chart, the EUR/JPY has started to oscillate within a minor descending channel and below the 20-day moving average since last Thursday, 14 September.
These latest set of short-term price movements have indicated that EUR/JPY is likely to be evolving within a minor downtrend. Watch the 158.55 key short-term pivotal support for a further potential slide to retest the 11/15 September minor swing low areas of 156.80 and a break below it exposes the next intermediate support at 155.90 (lower boundary of the minor descending channel, 4 August 2023 minor low, and a Fibonacci extension cluster).
However, a clearance above 158.55 invalidates the bearish tone for a squeeze up to retest the upper limit of the major resistance zone at 159.80.
GBP/USD Extends Losses While EUR/GBP Gains Strength
GBP/USD extended losses and traded below the 1.2465 support. EUR/GBP is rising and might climb above the 0.8615 resistance.
Important Takeaways for GBP/USD and EUR/GBP Analysis Today
- The British Pound is showing bearish signs below 1.2420.
- There is a key bearish trend line forming with resistance near 1.2465 on the hourly chart of GBP/USD at FXOpen.
- EUR/GBP is rising and trading above the 0.8600 zone.
- There was a break above a connecting bearish trend line with resistance near 0.8600 on the hourly chart at FXOpen.
GBP/USD Technical Analysis
On the hourly chart of GBP/USD at FXOpen, the pair attempted a fresh increase above 1.2500. However, the British Pound failed above 1.2540 and started a fresh decline against the US Dollar.
There was a clear move below the 1.2465 support and the 50-hour simple moving average. The pair even tested the 1.2380 support zone. A low was formed near 1.2378 and the pair is now consolidating losses.
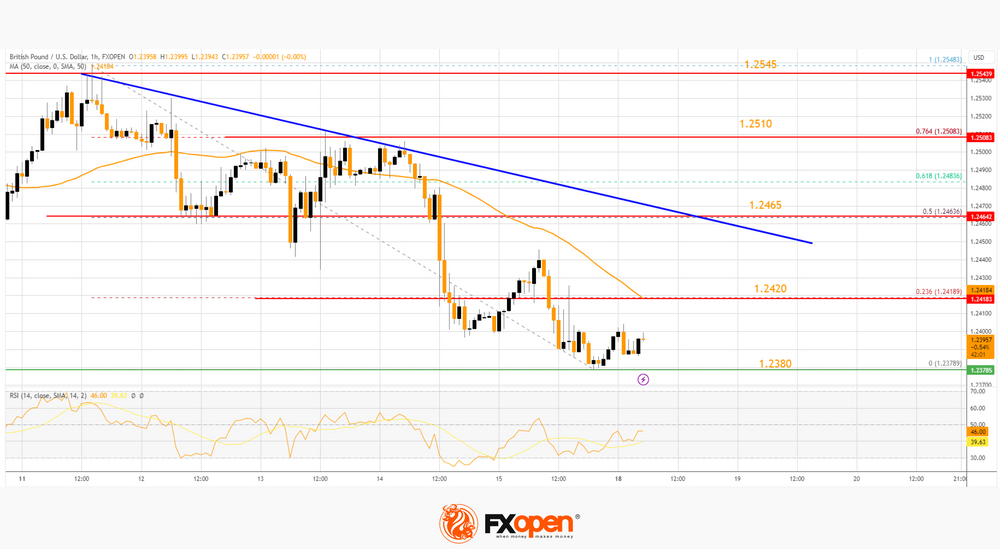
On the upside, the GBP/USD chart indicates that the pair is facing resistance near the 23.6% Fib retracement level of the downward move from the 1.2548 swing high to the 1.2378 low at 1.2420 and the 50-hour simple moving average.
The next major resistance is near a bearish trend line at 1.2465. It is close to the 50% Fib retracement level of the downward move from the 1.2548 swing high to the 1.2378 low.
A close above the 1.2465 resistance zone could open the doors for a move toward 1.2510. Any more gains might send GBP/USD toward 1.2545. On the downside, there is a key support forming near 1.2380. If there is a downside break below the 1.2380 support, the pair could accelerate lower.
The next major support is near the 1.2320 zone, below which the pair could test 1.2250. Any more losses could lead the pair toward the 1.2200 support.
EUR/GBP Technical Analysis
On the hourly chart of EUR/GBP at FXOpen, the pair started a steady increase from the 0.8570 zone. The Euro traded above the 0.8580 pivot level to enter a positive zone against the British Pound.
The EUR/GBP chart suggests that the pair settled above the 50-hour simple moving average and 0.8590. There was also a break above a connecting bearish trend line with resistance near 0.8600. A high is formed near 0.8615 and the pair is now consolidating gains.
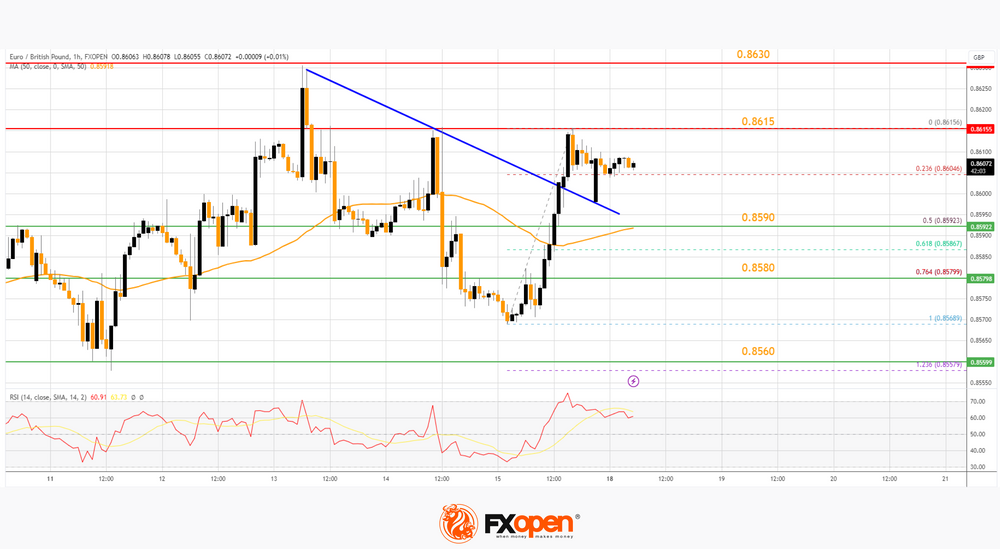
It tested the 23.6% Fib retracement level of the upward move from the 0.8568 swing low to the 0.8615 high. Immediate support sits near the 50-hour simple moving average at 0.8590.
The 50% Fib retracement level of the upward move from the 0.8568 swing low to the 0.8615 high is also near 0.8590. The next major support is near 0.8580. A downside break below the 0.8580 support might call for more downsides. In the stated case, the pair could drop toward the 0.8560 support level.
Immediate resistance is near 0.8615. The next major resistance could be 0.8645. A close above the 0.8645 level might accelerate gains. In the stated case, the bulls may perhaps aim for a test of 0.8680. Any more gains might send the pair toward the 0.8720 level.
This article represents the opinion of the Companies operating under the FXOpen brand only. It is not to be construed as an offer, solicitation, or recommendation with respect to products and services provided by the Companies operating under the FXOpen brand, nor is it to be considered financial advice.
EUR/USD Breaking Below 1.0633 Would Further Hurt the Technical Picture.
Markets
The ECB guided markets to a prolonged pause by saying that rates will be kept at the current level ‘for a sufficiently long duration, which will make a substantial contribution to a timely return of inflation to target’. However, with (core) inflation still substantially above target, the ECB thesis has to be validated. In this respect, several ECB members on Friday (and over the weekend) didn’t exclude an additional hike, with the December meeting (new projections) the next important point of evaluation (ECB’s Vasle). The debate on a faster run-off of the balance sheet also intensifies. All this on Friday resulted in a ‘logical‘ underperformance at the long end of the EMU/German curve with Bund yields adding 4.9 bps (2-y) to 9.0 bps (30-y). The German 30-y yield even touched a minor cycle top at 2.82%. US yields gains were more modest (3-4.5 bps across the curve). US August industrial production (+0.4%) and a sharp rebound in the NY Fed Empire manufacturing survey (1.9 from -19, including strong orders and shipments and ongoing high price index) confirmed the resilience of the US economy. Michigan consumer confidence was slightly disappointing with an unexpected easing of inflation expectations (1-y from 3.5% to 3.1%). US equities fell prey to quite aggressive end of week profit taking (S&P -1.22%; Nasdaq -1.56%), eroding a positive sentiment in Europe (Eurostoxx close +0.36%, after opening 1% higher). At $94/b, Brent oil closed at the highest levels since November last year. The USD showed a mixed picture, but basically kept recent gains (DXY 105.32). USD/JPY continues to attack the recent top just below 148. Higher EMU yields bought the euro some time (EUR/USD close at 1.0657 from 1.0643).
Asian equities join the WS decline this morning, but losses are more contained. China outperforms. The eco calendar today and tomorrow is thin with markets counting down to Wednesday’s Fed policy decision and multiple other CB decisions on Thursday (Bank of England, Norges Bank, Riksbank, Swiss National bank) and on Friday (Bank of Japan). US and EMU PMI’s on Friday give an update on activity. For now, markets aren’t inclined to fight the higher-for-longer mantra, which also the Fed is expect to maintain despite a widely expected pause. Combined with an ongoing rise in oil prices, this might protect EMU and US yields with the long end of the curve nearing cycle peak levels (10-y US 4.34%/4.36%; 10-y Germany 2.74%/2.77% area). The dollar took a breather on Friday, but remains in pole position. EUR/USD breaking below 1.0633 would further hurt the technical picture.
News and Views
The United Auto Workers on Friday started a walkout at the US’s three biggest, Detroit-based, car manufacturers, GM, Ford and Stellantis. It’s the first such triple action in the UAW’s 88-year-old history. They targeted three assembly plants in three different states with UAW’s top official Fain indicating that these guerilla tactics will keep the companies guessing. The union triggered the strike after two months of negotiations failed to yield new labour deals. Apart from wage raises, better pensions and rewinning some of the privileges lost after the 2008 financial crisis, the UAW also wants guarantees that union labour will still have jobs in the electric vehicle (EV) era where the south of the US is becoming center of gravity. Fain believes that his bottleneck approach can have a similar impact as an all-out strike while putting less members on the picket line. The National Association of Manufacturers already said that small and medium-sized manufacturers across the country will feel the brunt of this work stoppage, whether they are union shop or not.
UK property broker Hamptons’ letting index showed the largest annual rental growth (12%) since the start of the index in 2014. The average rent in Britain is now £1300/month. Rents are rising fastest in Greater London (17.1% Y/Y), catching up from a slump during the pandemic, followed by Scotland (13.4% Y/Y). In a separate report, property portal Rightmove indicated that selling prices rose by 0.4% in September; the first increase since May. On an annual basis however, asking prices slid by 0.4%. Price reductions (36.6% of properties for sale) hit a level not seen since January 2011. The shaky UK housing market complicates the picture for the Bank of England who walks an extremely fine line between taming inflation and not letting the economy go bust. The central bank meets on Thursday with money markets discounting a high probability of another 25 bps rate hike (>80%).
AUD/USD Daily Report
Daily Pivots: (S1) 0.6413; (P) 0.6443; (R1) 0.6462; More...
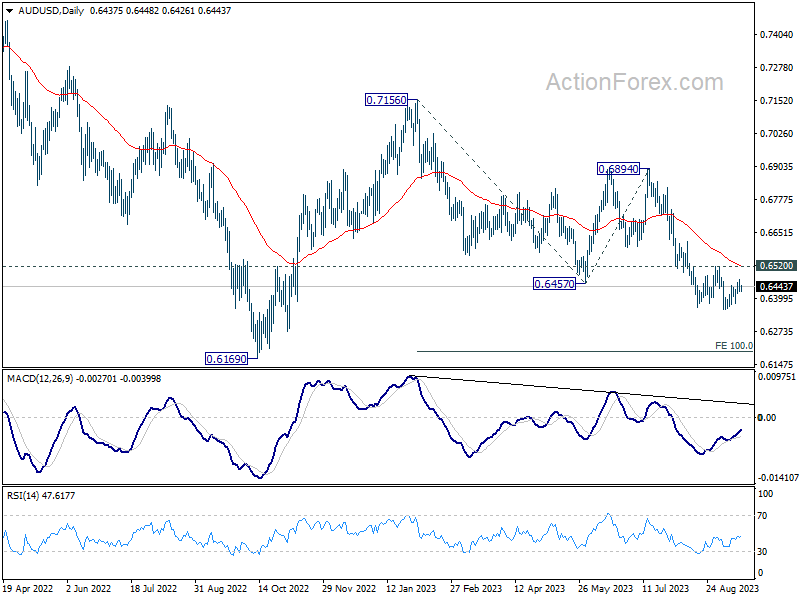
Outlook in AUD/USD is unchanged as corrective rise from 0.6356 might extend higher. Intraday bias stays neutral for the moment. Further decline is expected as long as 0.6520 resistance holds. Break of 0.6356 will resume larger down trend to 100% projection of 0.7156 to 0.6457 from 0.6894 at 0.6195.
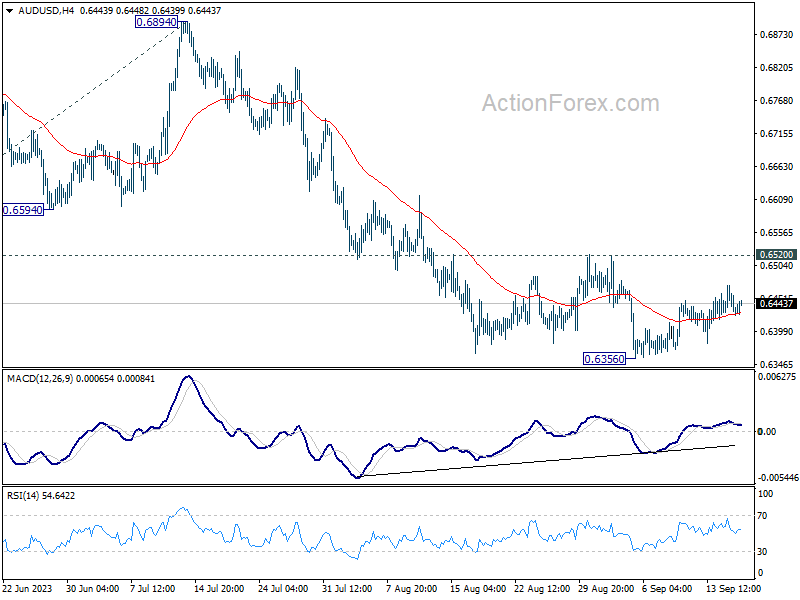
In the bigger picture, down trend from 0.8006 (2021 high) is possibly still in progress. Decisive break of 0.6169 will target 61.8% projection of 0.8006 to 0.6169 to 0.7156 at 0.6021. This will now remain the favored case as long as 0.6894, in case of strong rebound.
Gold Pressing Near Term Resistance, Central Bank Meetings and Key Data Awaited
Today's Asian financial markets have shown signs of calmness, partly due to holiday in Japan that has likely tempered trading activities. Dollar and Euro were mildly softer, while Aussie, Kiwi, and Yen exhibited slight strength. However, the fluctuations were confined within the ranges observed last Friday, pointing to the low-volatility environment in currency markets. The quietude is expected to continue throughout the day owing to a light economic calendar
Yet more vibrant trading environment should emerge later in the week. Market participants are directing their attention towards the upcoming central bank meetings including Fed, BoJ, and SNB, alongside releases of crucial economic data such as CPI, retail sales, and PMIs from various countries and regions. These events hold the potential to infuse volatility into the markets as the week progresses.
Shifting the focus to the commodities market, Gold is capturing attention as it nudges close to a near-term resistance at 1930.56, following successful defense of 1900 level last week. Decisive breakthrough at this juncture could signal completion of the pullback from 1952.82, further suggesting resumption of its upward march started from 1884.83.
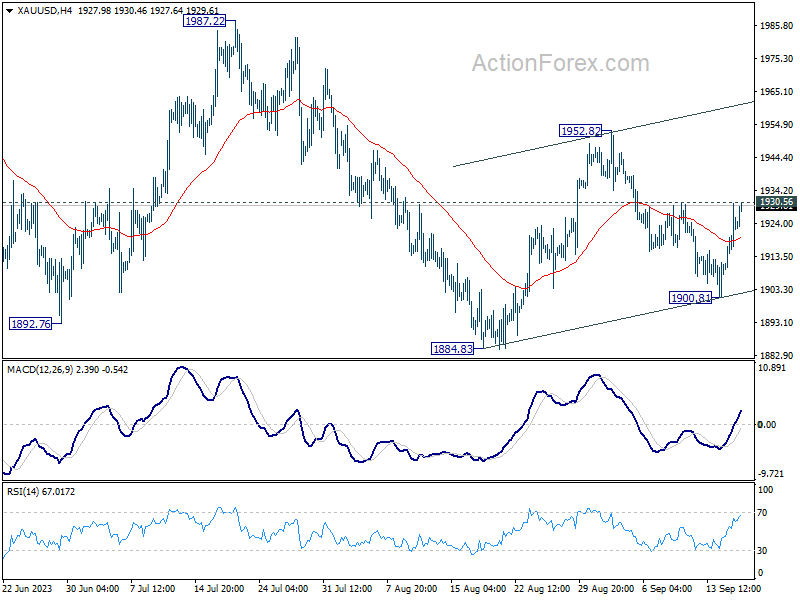
Such a development would strongly hint that the correction phase starting from 2062.95 has already reached its end at 1884.83. Breaking 1952.82 barrier would then steer momentum towards 1987.22 resistance for confirmation.
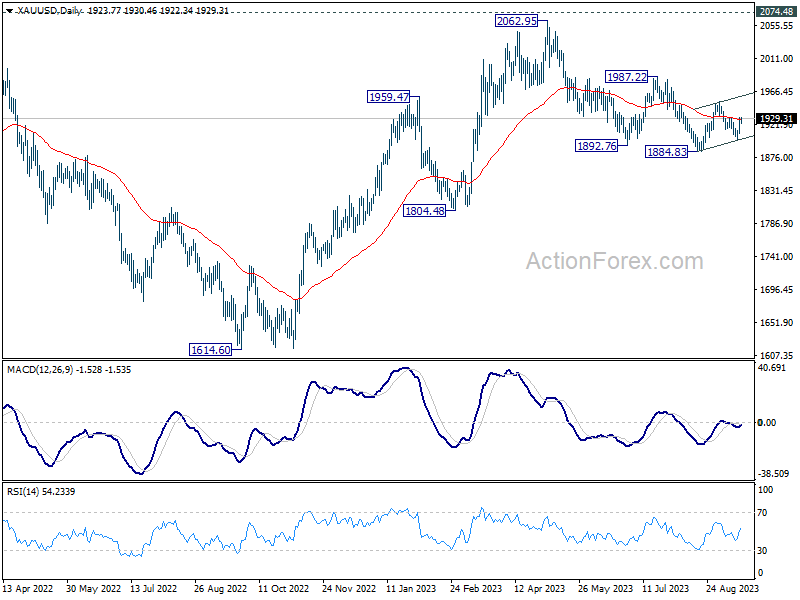
If these dynamics take shape, extended Gold rally might serve as an early sign of Dollar weakening against currencies like Euro. Investors will be keeping a close watch on these potential shifts, especially with so much scheduled for the week ahead.
ECB's Kazaks dismisses early rate cut speculations
In an interview over the weekend, ECB Governing Council member Martins Kazaks, chief of Latvia's central bank, sought to temper market expectations regarding rate cuts. He emphasized that any anticipations of rate cuts in the spring or early summer are "not really consistent with the macro scenario" that is currently envisioned.
Kazaks underscored his contentment with the present rate levels, expressing that they stand aptly. He clarified, "While I'm comfortable with where rates are at the moment, if necessary we will take the right decisions." However, he declined to affirm the notion that the rates have reached their peak, thus leaving room for more tightening based on future economic developments.
Stressing the urgency to effectively address the inflation issues in a decisive manner, he said, "I would like to see that we solve inflation in one attempt, that we are not forced to come back," to avoid a scenario necessitating "larger interventions" down the line.
Separately, another Governing Council member Yannis Stournaras, Greek central bank head, said, "I would have preferred to hold rates last week. But there were arguments in favor of both outcomes — hiking and holding — so I'm fine with the decision we took."
Last Thursday saw ECB raising the interest rates by 25bps, marking the tenth consecutive hike, thereby elevating deposit rate to a record 4%. Additionally, ECB signaled interest rates have probably peaked in the currency cycle.
New Zealand's services sector continues its descent, a deeper dive
New Zealand's BusinessNZ Performance of Services Index reported another slump in August, marking the third consecutive month of declining in the services sector. This downturn saw PSI slip from 48.0 in July to 47.1 in August, notably falling short of long-term average of 53.5.
Looking into the components, while there were marginal improvements in activity/sales, which climbed from 39.7 to 43.4, and employment, which rose from 49.1 to 50.9, other areas did not fare as well. New orders/business made a meager ascent from 44.5 to 47.3. Conversely, stocks/inventories dipped from 54.0 to 52.5, and supplier deliveries took a hit, declining from 52.0 to 49.2.
BusinessNZ's Chief Executive, Kirk Hope, offered a bleak perspective, highlighting that August's data provided little hope for a swift recovery.
This sentiment was further cemented by the proportion of negative comments received in the survey. In August, 63.9% of the comments were negative, a slight improvement from July's 67% but a significant jump from June's 55.6%. The cloud of uncertainty hanging over the upcoming General Election, combined with persisting challenging economic conditions, were predominant themes among these comments.
BNZ's Senior Economist Doug Steel noted that the PSI and PMI results resonate with RBNZ's projections of an impending recession rather than Treasury's more optimistic forecast of sustained, albeit moderate, growth in the near future.
NZ economic growth to remain subdued according to NZIER forecasts
Latest forecasts from New Zealand Institute of Economic Research anticipate a period of subdued economic growth over the next few years. The annual average GDP growth is expected to decline to 0.4% in the fiscal year ending March 2024, followed by modest growth of 1.1% in 2025.
This sluggish pace is partly attributable to the ripple effect of consecutive hikes in RBNZ's OCR, currently standing at 5.50%, which have started to curb demand in the broader economy. Moreover, diminishing demand for exports, spurred mainly by China's weaker growth outlook, poses downside risk to the nation's economic vitality.
Shifting focus to inflation sphere, there has been a notable upward revision for the projections as of March 2024, with annual CPI inflation predicted to retreat to 4.3% in 2024, and further dip to 2.4% in the subsequent year.
As for currency outlook, NZD Trade Weighted Index forecasts have undergone revisions, showing a downturn for the approaching year but portraying an uplift in 2025.
NZD has not encountered significant fluctuations against other currencies in recent times in terms of yield attractiveness. This steadiness, however, is anticipated to meet challenges due to reduced export demand from China.
The forecast encapsulates expectation of NZD TWI oscillating between 70.8 and 71.6 in the period spanning 2024 to 2027.
Central bank bonanza with Fed, BoE, SNB, BoJ, and more data
In a week filled with central bank meetings and releases of pivotal economic data, market participants remain on high alert, eager to grasp any cues that might illuminate the path central banks are inclined to tread in the near future.
Fed takes center stage with broad consensus aligning towards a decision to hold interest rates steady in the 5.25-5.50% bracket come Wednesday. Markets have all but confirmed, with a 98% probability priced in. While the prospect of a further rate hike this year remains a topic of conjecture, analysts and investors alike are leaning more towards discerning the potential timing of a rate cut. Insights into this might be gleaned from the fresh set of economic projections and dot plots Fed is slated to release, offering a gauge on the sentiments swirling amongst policymakers.
Crossing the Atlantic, BoE gears up for its Thursday meeting with anticipations steering towards a 25bps rate lift, setting the figures at 5.50%. UK economy manages has staved off a widely anticipated recession for now. At the same time, inflation in July was still more than triple BoE's 2% target. These mandate another almost compulsory response from the central bank. The discourse, however, splits when it comes to predicting the summit of this cycle, albeit a slight majority are banking on this hike being the peak. The voting pattern in the BoE council stands as a critical element warranting scrutiny in this context.
Simultaneously, SNB preps for a similar 25bps increase to attain 2.00% rate, operating under the central bank's anticipation of rising inflation post the current lull. Yet, it remains under wraps whether SNB will emulate ECB in signaling a sustained pause in rate hikes.
BoJ's decision on Friday will be closely watched also be interesting, especially given its penchant for springing surprises on the market. While speculations are rife about BoJ's potential shift away from negative rates next year, it's likely that the central bank will lay the groundwork for such a move in Q4, maintaining its dovish position for the time being. RBA is also in the fray, set to release the minutes from its September meeting.
However, the central banks are not sole actors in this week's economic theatre as a torrent of significant economic data is set to flood the market avenues. Spotlighting this release spree are the CPI figures from the UK, Canada, and Japan, coupled with retail sales data emanating from the UK and Canada. New Zealand joins the parade disclosing its GDP figures. A comprehensive view of economic health of major global economies will be portrayed through PMI flashes set to be unveiled.
Here are some highlights for the week:
- Monday: New Zealand BusinessNZ Services; Canada housing starts, IPPI and RMPI; US NAHB housing market index.
- Tuesday: RBA minutes; Swiss trade balance; Eurozone CPI core; Canada CPI; US building permits and housing starts.
- Wednesday: New Zealand current account; Japan trade balance; Germany PPI; UK CPI, PPI; Swiss SECO economic forecasts; BoC summary of deliberations; Fed rate decision.
- Thursday; New Zealand GDP; SNB rate decision; BoE rate decision; Canada new housing price index; US jobless claims, Philly Fed survey, current account, existing home sales.
- Friday: New Zealand trade balance; Australia PMIs; Japan PMIs, CPI; BoJ rate decision; UK Gfk consumer sentiment, retail sales, PMIs; Eurozone PMIs; Canada retail sales; US PMIs.
AUD/USD Daily Report
Daily Pivots: (S1) 0.6413; (P) 0.6443; (R1) 0.6462; More...
Outlook in AUD/USD is unchanged as corrective rise from 0.6356 might extend higher. Intraday bias stays neutral for the moment. Further decline is expected as long as 0.6520 resistance holds. Break of 0.6356 will resume larger down trend to 100% projection of 0.7156 to 0.6457 from 0.6894 at 0.6195.
In the bigger picture, down trend from 0.8006 (2021 high) is possibly still in progress. Decisive break of 0.6169 will target 61.8% projection of 0.8006 to 0.6169 to 0.7156 at 0.6021. This will now remain the favored case as long as 0.6894, in case of strong rebound.
Economic Indicators Update
| GMT | Ccy | Events | Actual | Forecast | Previous | Revised |
|---|---|---|---|---|---|---|
| 22:30 | NZD | Business NZ PSI Aug | 47.1 | 47.8 | 48 | |
| 23:01 | GBP | Rightmove House Price Index M/M Sep | 0.40% | -1.90% | ||
| 12:15 | CAD | Housing Starts Aug | 257K | 255K | ||
| 12:30 | CAD | Industrial Product Price M/M Aug | 0.50% | 0.40% | ||
| 12:30 | CAD | Raw Material Price Index Aug | 3.80% | 3.50% | ||
| 14:00 | USD | NAHB Housing Market Index Sep | 50 | 50 |
Busy Week for Central Banks Ahead
Market movers today
This will be a quiet week in terms of data releases. The key releases will be the September flash PMIs from euro area and the US on Friday.
Otherwise, the focus will remain on central banks, and the FOMC on Wednesday is the first in line. Despite last week's upside surprise in core inflation, we think the Fed is done hiking and will rather focus on 'higher for longer'.
Thursday will be packed with central bank meetings. We have Riksbank and Norges Bank, both expected to deliver their final hikes, albeit Riksbank may leave the door open for a November hike. The SNB is expected to hike by 25bp, also marking the end of their hiking cycle. Finally, we expect Bank of England to hike by 25bp to 5.5%, but for them, the August CPI print ahead of the rate decision could be critical. The Central Bank of Turkey will also meet on Thursday, and consensus expects a 500bp hike to 30%.
Finally, on Friday, Bank of Japan will announce their monetary policy decision. We do not expect any changes at this point but we do expect another tweak to YCC later this year.
The 60 second overview
Hawkish ECB comments: Global yields rose significantly on Friday putting pressure on risky assets following hawkish comments by ECB members on the outlook for rates. Slovenia's Vasle, Austria's Holzmann, Latvia's Kazaks and GC Muller have all signalled openness to hiking rates further and/or accelerating the balance sheet reduction in public remarks since Friday, which looks like a hawkish push-back to the easing of financial conditions after the ECB meeting. Even though we expect no further hikes, investors should not write off the possibility if the underlying inflation pattern continues to evolve too aggressively. We see the risk of further hikes primarily being attached to the December meeting or later, as the amount of new data at the next meeting in October will probably be too limited to justify hiking again.
US data mixed: In the US, the preliminary data for September released on Friday was a mixed bag with the volatile Empire Manufacturing Index coming in stronger than expected at 1.9 (vs -19 in August), while the University of Michigan sentiment index was down from 69.5 to 67.7 driven by a worsening of the current assessment among consumers. On inflation, there was significant decline in 5-10Y expectations (from 3% to 2.7% and 1Y expectations (from 3.5% to 3.1%). This should ease the pressure on the FOMC to keep hiking, as real interest rates are effectively edging higher with lower inflation expectations.
FOMC on hold: We expect the FOMC to stay on hold at its meeting on Wednesday as widely expected in the markets. Focus should be on how FOMC participants assess the need for later hikes, as economic data over the summer has clearly surprised to the upside. In June, 12 out of 18 'dots' looked for one more hikes this year, but we doubt it will materialize. With little need to pre-commit to any policy action, we expect Powell to deliver a balanced message, highlighting positive development in cooling labour demand and recovering supply, but underscoring that there is still some way to go before declaring victory over inflation. See Fed preview: Plotting the way forward, 15 September.
Sentiment: This morning, Asian markets are characterized by risk aversion following declines in US and European equities on Friday. Tech shares are especially hard hit. Chinese real estate developers are also in focus ahead of Country Garden's deadline today to pay dollar bond interest and the end of creditor voting on its request to extend payment on a local bond. Equity futures point towards a negative opening in Europe. Brent crude prices are up 0.3% to USD 94.3 per barrel, which is close to the highest level seen since November 2022.
Equities: Last week marked a trend shift with European equities largely outperforming US. Friday was no exception, as US fell south of -1% while Europe held on to slight gains. In total, this summed up to US being -0.5% lower for the week and Europe up 1.5%. The main reason for this reversal was the preference for value. Global value stocks outperformed growth by 2p.p. last week. Big tech and US homebuilders were the big drag while other cyclical sectors, particularly banks and consumer discretionary, performed well. Tech continues to underperform in Asia this morning, bringing most indices lower. US futures have turned positive though.
FI: Global yields rose across regions and tenors on Friday, reversing the declines following the ECB meeting on Thursday. 10Y Bund yields were up 8bp by the end of the day, while 10Y BTP yields rose 12bp. The 2s10s Bund curve bear steepened a bit throughout the day. Hawkish ECB comments lifted the expected peak ECB rate in ESTR markets, which are now pricing in an additional 12bp of rate hikes until March 2024. In the US, Treasuries also sold off despite visible risk aversion in equity markets. This week, the FOMC meeting on Wednesday and the euro area PMIs on Friday will be the highlights for FI markets.
FX: EUR/USD edged slightly higher on Friday but fell for a 9th straight week, following the ECB's dovish hike on Thursday. The Chinese yuan has gained some ground over the past week, partly driven by PBOC measures. EUR/SEK ended last in near 11.90, thus still within the range and was relatively stable while EUR/NOK rallied 10 figures just to close the US session around 11.50. This week, FX will take direction from major central bank decisions.
Credit: The credit markets ended last week on a relatively unworried note. During Friday, iTraxx Main was almost unchanged (+0.3bp) at 69.1bp while iTraxx Crossover moved +0.5bp to 387.2bp. Last week's positive development in the CDS market was also visible in the cash bond market, where secondary bond trading saw improving buying interests. Primary markets remained active most of the week with a healthy issuance pace of both investment grade and high-yield rated instruments.
Technical Outlook and Review
DXY:
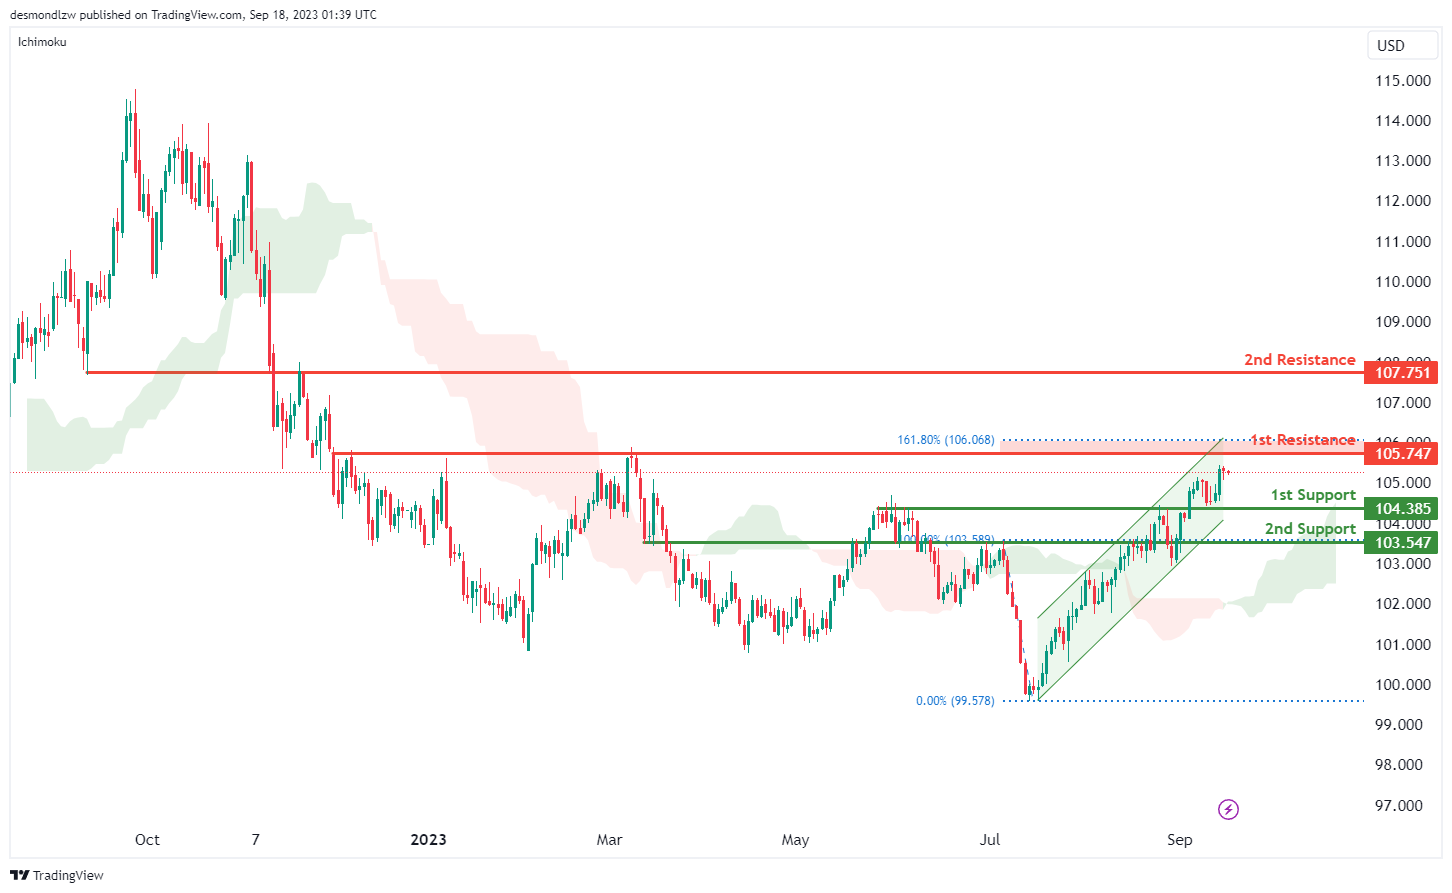
The DXY (US Dollar Index) chart is currently displaying a robust and sustained bullish momentum, with several compelling factors contributing to this positive outlook. At the core of this optimism is the DXY’s position within an ascending channel, providing a clear pathway for bullish continuation as price movements typically follow higher highs and higher lows within such channels. Understanding the critical support and resistance levels is vital when assessing potential price movements. The 1st support at 104.38 and the 2nd support at 103.54 both serve as robust safety nets, categorized as overlap supports with historical significance.
On the resistance side, the 1st resistance at 105.74 presents a formidable hurdle, noted for being a multi-swing high resistance, further bolstered by its alignment with the 161.80% Fibonacci Extension. Beyond this, the 2nd resistance at 107.75 adds another layer of challenge, classified as an overlap resistance with historical relevance. Overall, the DXY chart’s bullish momentum is unmistakable, with the ascending channel and strategically positioned support and resistance levels favoring further upward movement. However, prudent risk management is essential, as market conditions can shift rapidly.
EUR/USD:
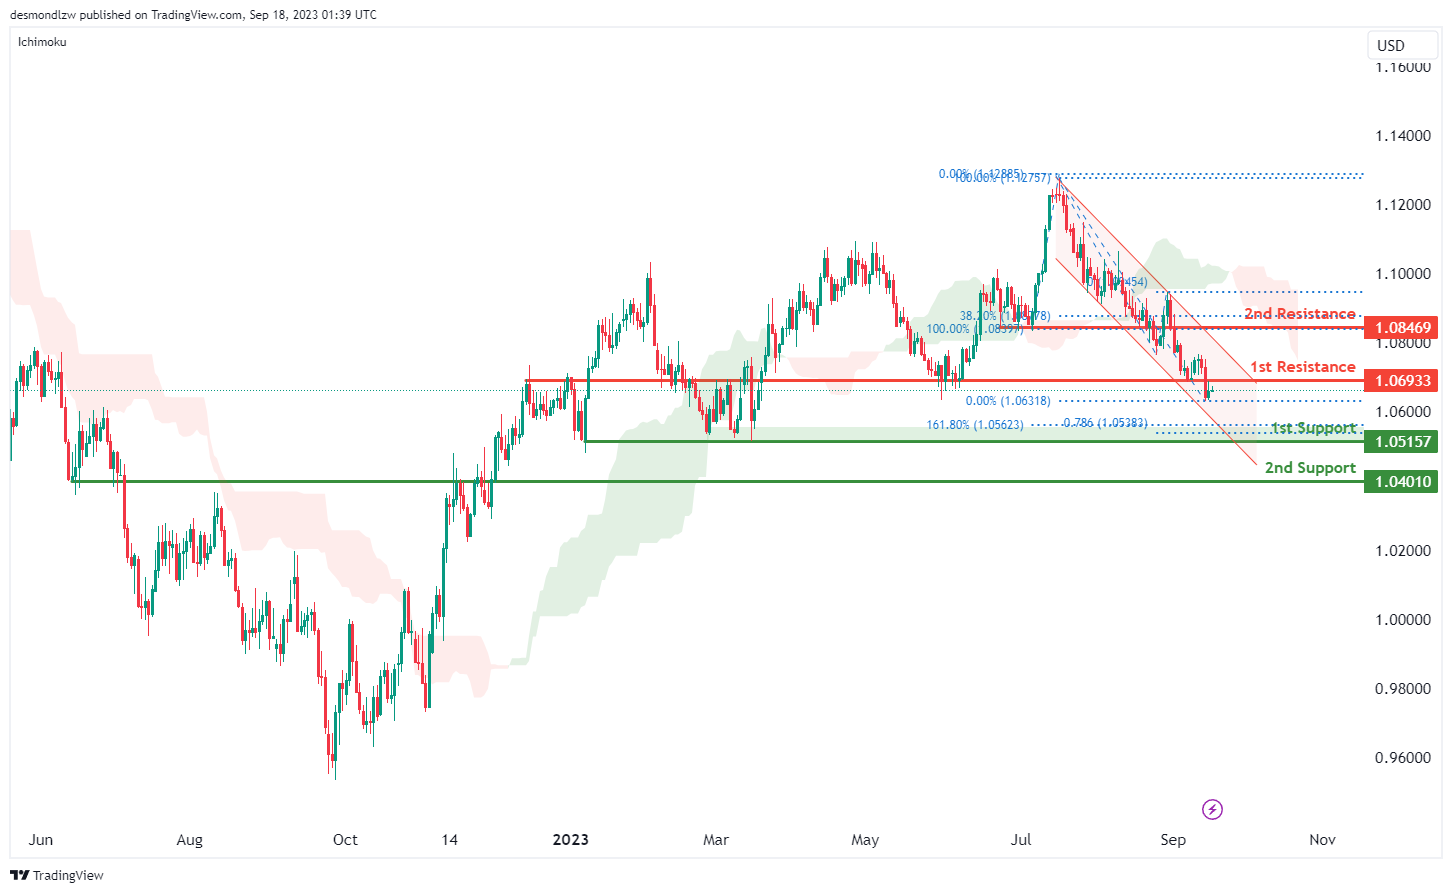
The EUR/USD chart currently reflects a sustained bearish momentum, driven by several key factors. Most notably, the price is confined within a bearish descending channel, a strong indicator of ongoing downward pressure. This suggests that the bearish momentum may persist, leading to potential further price declines.
Additionally, the chart is positioned below the bearish Ichimoku cloud, further confirming the bearish sentiment. In light of these factors, the price is likely to continue on a bearish trajectory. The anticipated movement points toward a bearish continuation, with the 1st support level at 1.0515 being a critical juncture. This support is reinforced by its classification as a multi-swing low support and its alignment with both the 161.80% Fibonacci Extension and the 78.60% Fibonacci Expansion, indicating a significant Fibonacci confluence.
Beyond the 1st support, the 2nd support at 1.0401 functions as a pullback support. On the resistance side, the 1st resistance at 1.0693 serves as a pullback resistance, while the 2nd resistance at 1.0845 is an overlap resistance, coinciding with the 38.20% Fibonacci Retracement. The overall chart momentum remains bearish.
EUR/JPY:
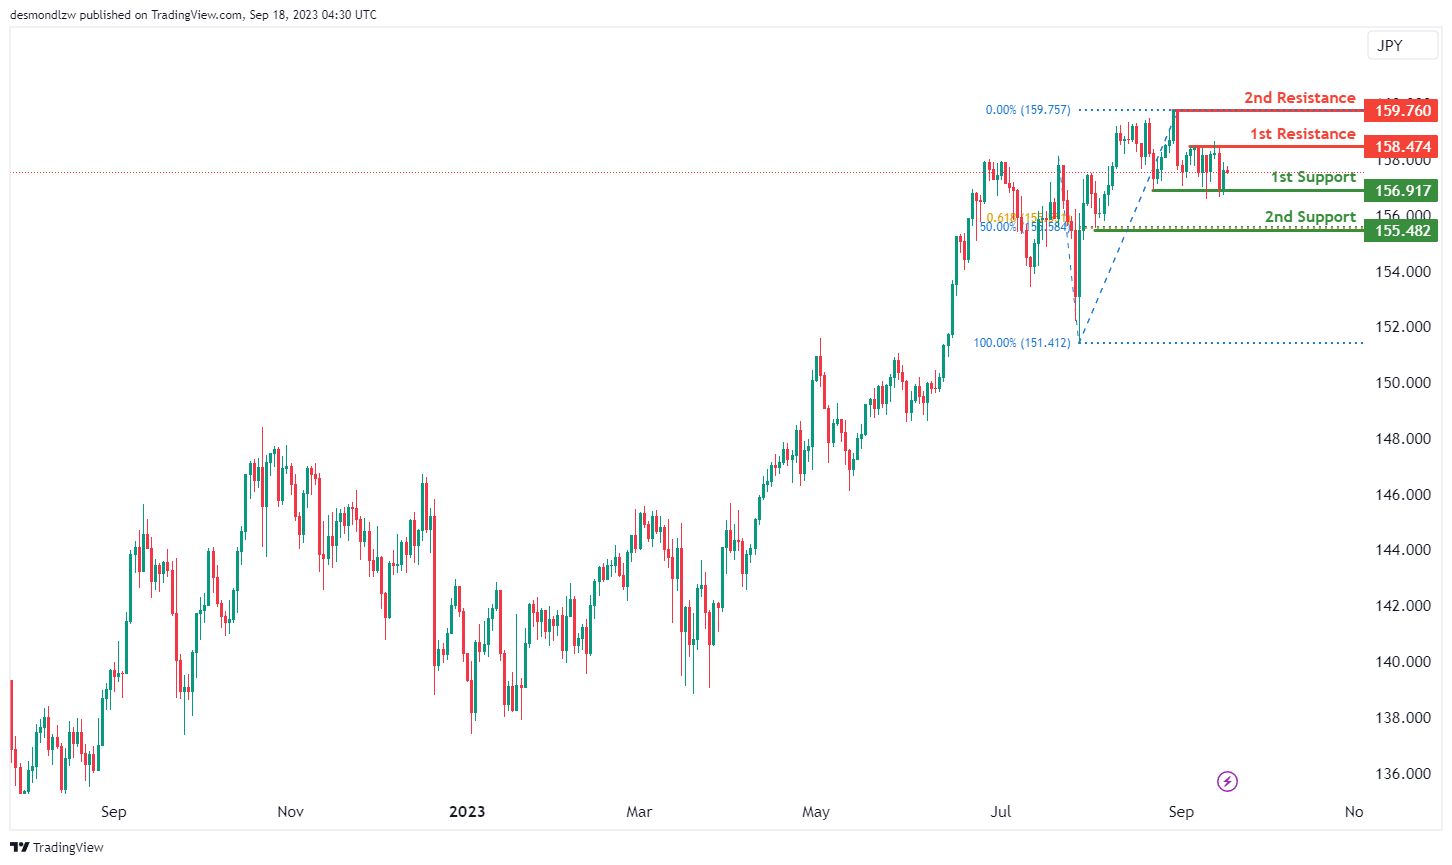
For EUR/JPY, the overall momentum of the chart is currently neutral, indicating a lack of a clear trend.
There is potential for the price to fluctuate between the 1st support level at 156.91 and the 1st resistance level at 158.47.
The 1st support at 156.91 is considered significant because it represents multi-swing low support, indicating potential stability around this level.
In case of a more significant drop, the 2nd support level at 155.48 is also noteworthy, as it represents a swing low support and aligns with both the 50% Fibonacci Retracement and the 61.80% Fibonacci Projection, indicating strong potential support and a potential area of Fibonacci confluence.
On the upper side, the 1st resistance at 158.47 is considered important due to its characteristics as multi-swing high resistance.
Further upward movement could face resistance at the 2nd resistance level of 159.76, characterized as swing high resistance. This level may act as a barrier to the bullish momentum within the observed range, keeping the overall momentum of the chart in a neutral state.
EUR/GBP:
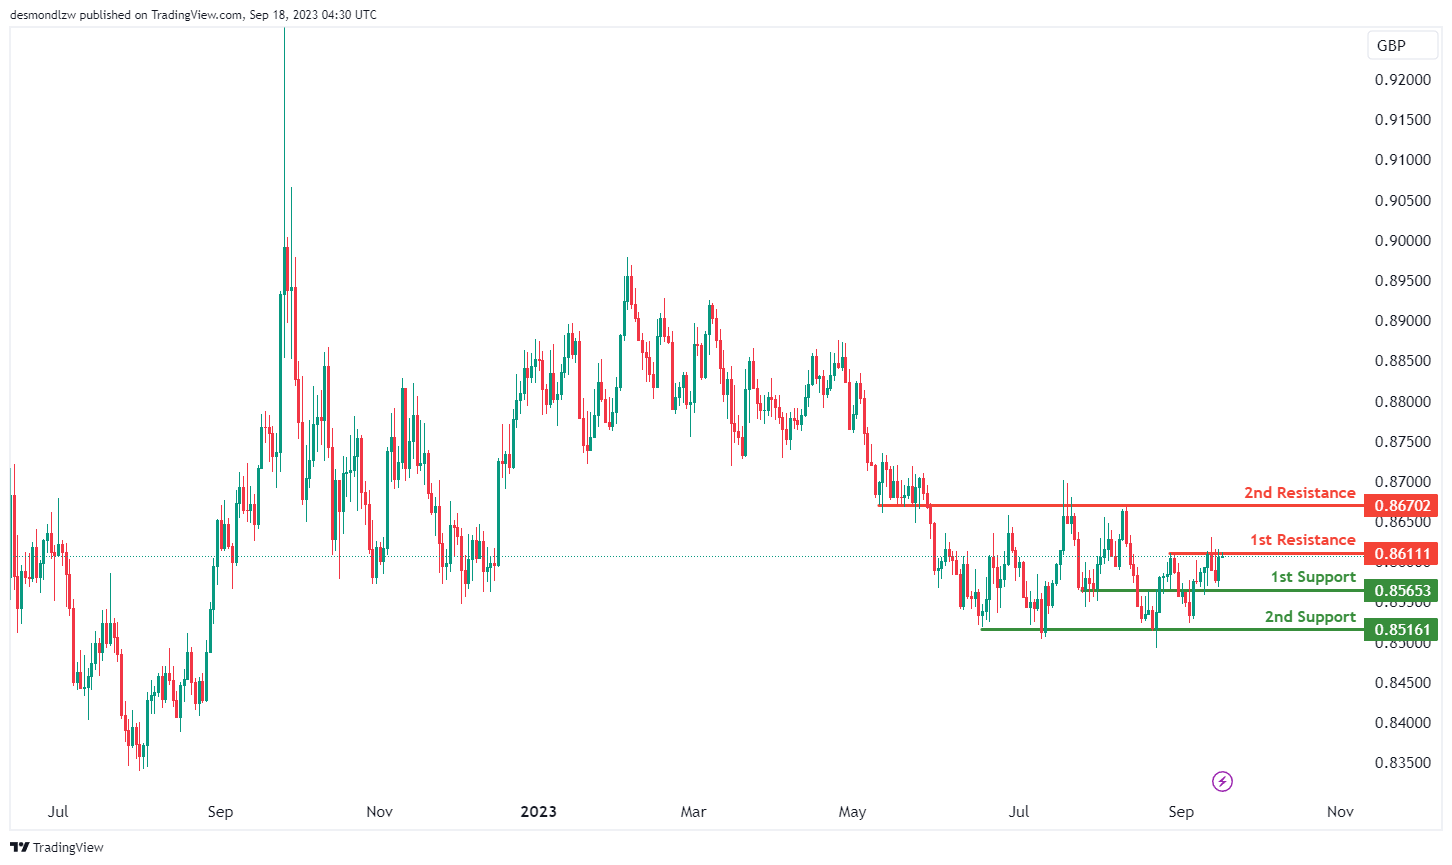
For EUR/GBP, the overall momentum of the chart is currently neutral, indicating a lack of a clear trend.
There is potential for the price to fluctuate between the 1st support level at 0.8516 and the 1st resistance level at 0.8611.
The 1st support at 0.8516 is considered significant because it represents multi-swing low support, indicating potential stability around this level.
In case of a more significant drop, the 2nd support level at 0.8565 is also noteworthy as it represents an overlap support, suggesting further potential support in this area.
On the upper side, the 1st resistance at 0.8611 is considered important due to its characteristics as multi-swing high resistance.
Further upward movement could face resistance at the 2nd resistance level of 0.8670, characterized as an overlap resistance. This level may act as a barrier to the bullish momentum within the observed range, keeping the overall momentum of the chart in a neutral state with potential price fluctuations between the identified support and resistance levels.
GBP/USD:
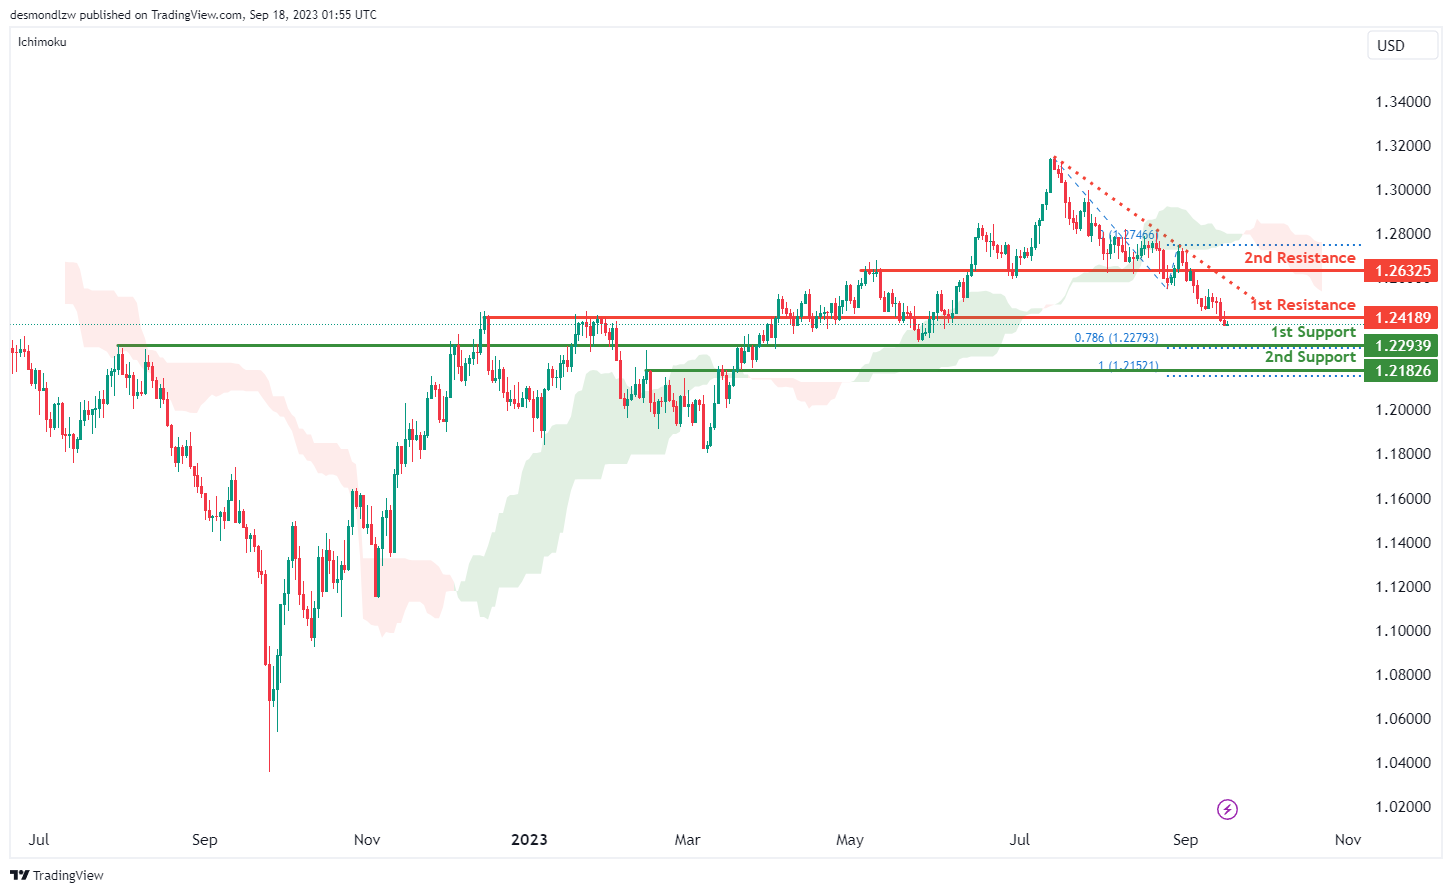
The GBP/USD chart maintains a persistent bearish momentum, influenced by critical factors contributing to its downward trajectory. Most notably, the price currently resides below the bearish Ichimoku cloud, signifying a dominant bearish sentiment. Furthermore, the chart exhibits a significant bearish bias by remaining beneath a major descending trend line, reinforcing expectations of continued downward pressure. Given these compelling indicators, the price is likely to pursue a bearish continuation, with the 1st support level at 1.2293 serving as a pivotal point. This support level holds significance as it is classified as an overlap support, further strengthened by the presence of the 78.60% Fibonacci Projection. Beyond the 1st support, the 2nd support at 1.2182 is identified as a swing low support, aligning with the 100% Fibonacci Projection.
On the resistance side, the 1st resistance at 1.2418 functions as a pullback resistance, while the 2nd resistance at 1.2632 is characterized as an overlap resistance
GBP/JPY:
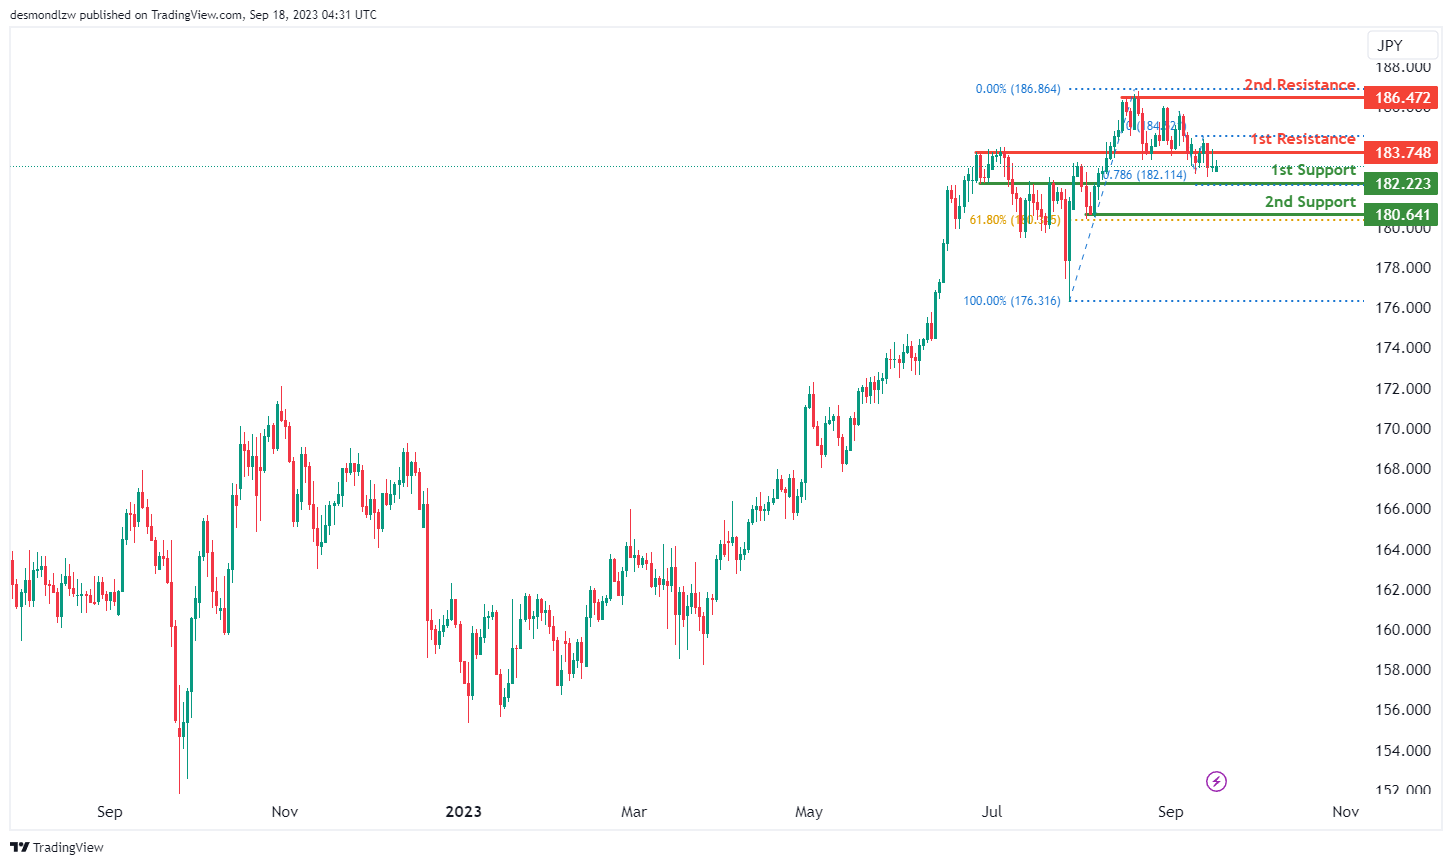
For GBP/JPY, the overall momentum of the chart is currently bullish, indicating an upward trend.
There is potential for the price to make a bullish move by bouncing off the 1st support level at 182.22 and heading towards the 1st resistance level at 183.74.
The 1st support at 182.22 is considered significant because it represents pullback support and aligns with the 78.60% Fibonacci Projection, indicating strong potential support and a potential area of Fibonacci confluence.
In case of a more significant pullback, the 2nd support level at 180.64 is also noteworthy as it represents a swing low support and aligns with the 61.80% Fibonacci Retracement, suggesting further potential support in this area.
On the upper side, the 1st resistance at 183.74 is considered important due to its characteristics as an overlap resistance.
Further upward movement could face resistance at the 2nd resistance level of 186.47, characterized as multi-swing high resistance. This level may act as a barrier to the bullish momentum within the observed range, but the overall chart momentum remains bullish with the potential for a bounce off the identified support level and a move towards resistance.
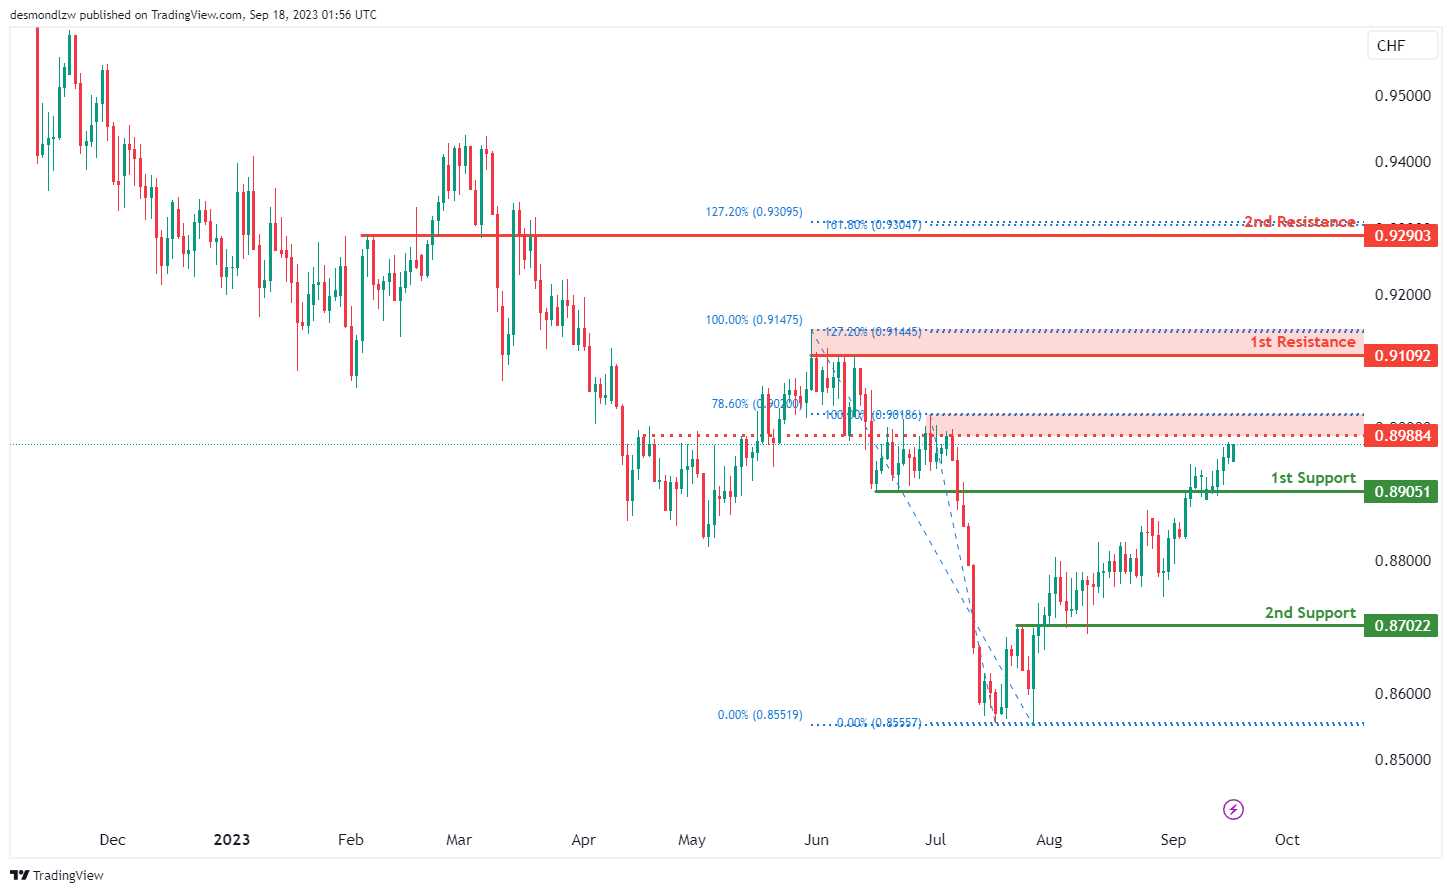
USD/CHF:
The USD/CHF chart currently demonstrates a strong bullish momentum, underpinned by several key factors that contribute to its favorable outlook. Notably, the price has been exhibiting resilience, and there’s a compelling scenario where this bullish trend could continue towards the 1st resistance level at 0.9109. This resistance level is particularly significant as it’s identified as a multi-swing high resistance and is reinforced by the presence of the 127.20% Fibonacci Extension, accentuating its importance. Beyond the 1st resistance, the 2nd resistance at 0.9290 is categorized as an overlap resistance, further underlining its relevance, particularly due to its alignment with the 161.80% Fibonacci Extension.
An intermediate resistance level at 0.8988 also comes into play, marked as an overlap resistance and coinciding with the 78.60% Fibonacci Retracement.
On the support side, the 1st support at 0.8905 is a critical level. It is classified as an overlap support, emphasizing its historical significance as a potential strong support zone. Similarly, the 2nd support at 0.8702 is recognized as an overlap support, reinforcing its importance as a key support zone. With the current bullish momentum in place,
USD/JPY:
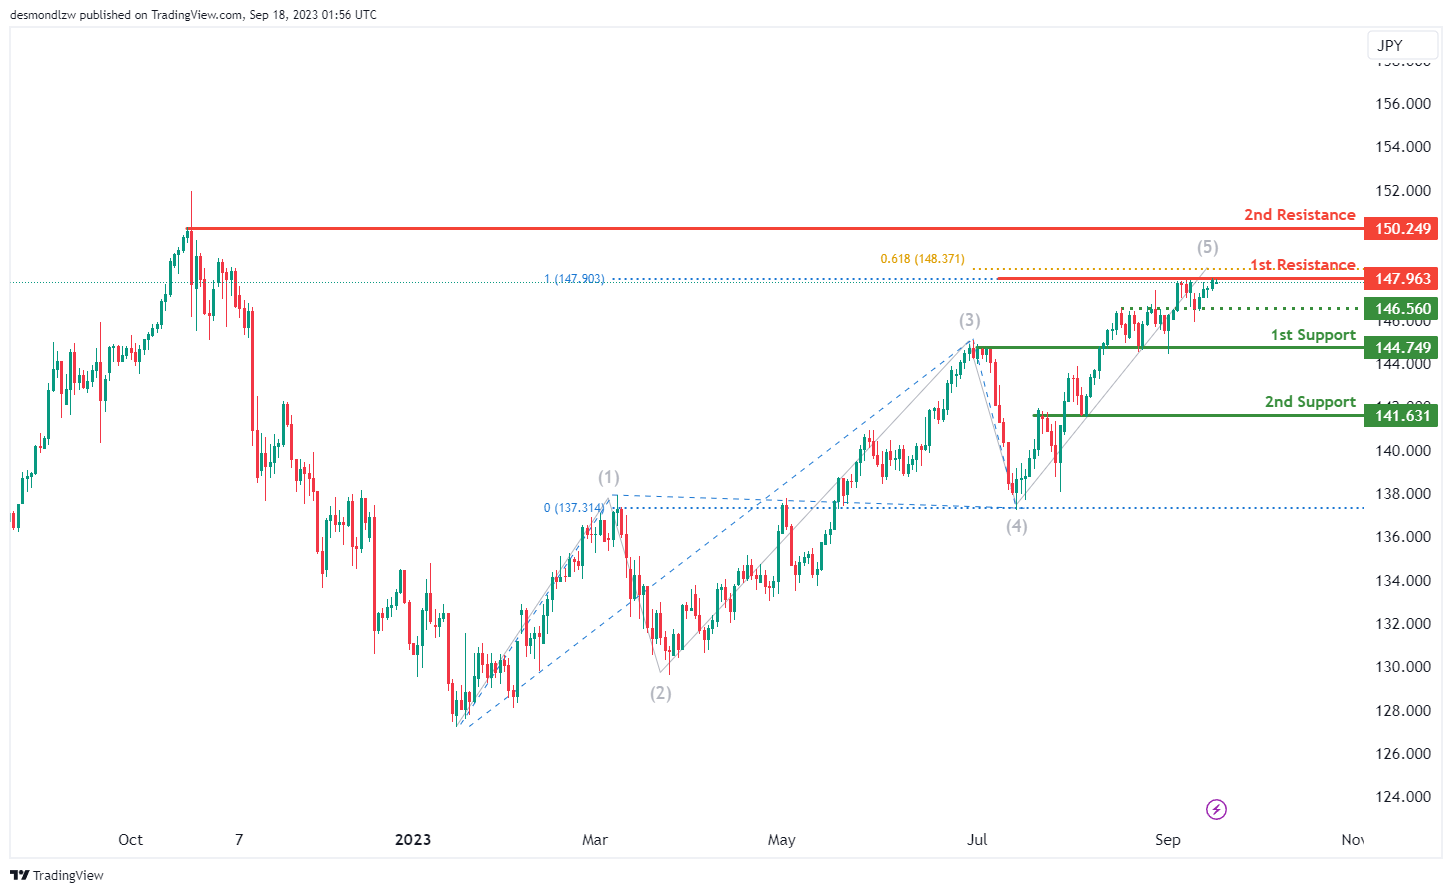
The USD/JPY chart currently exhibits a prevailing bearish momentum, marked by several key indicators that contribute to this downward trend. In this context, there’s a plausible scenario where the price may encounter a bearish reaction upon reaching the 1st resistance level at 147.96, subsequently retracing towards the 1st support at 144.74. The 1st support is of notable importance, classified as an overlap support, signifying its historical relevance as a potential strong support zone. Similarly, the 2nd support at 141.63 is identified as an overlap support, further accentuating its significance as a key support level.
On the resistance side, the 1st resistance level at 147.96 plays a pivotal role as a multi-swing high resistance, and it aligns with the presence of the 61.80% Fibonacci Projection, amplifying its importance as a potential barrier for further upward movement.
Beyond the 1st resistance, the 2nd resistance at 150.24 is categorized as a swing high resistance, underlining its role as a potential point of resistance. With the chart’s overall bearish momentum,
USD/CAD:
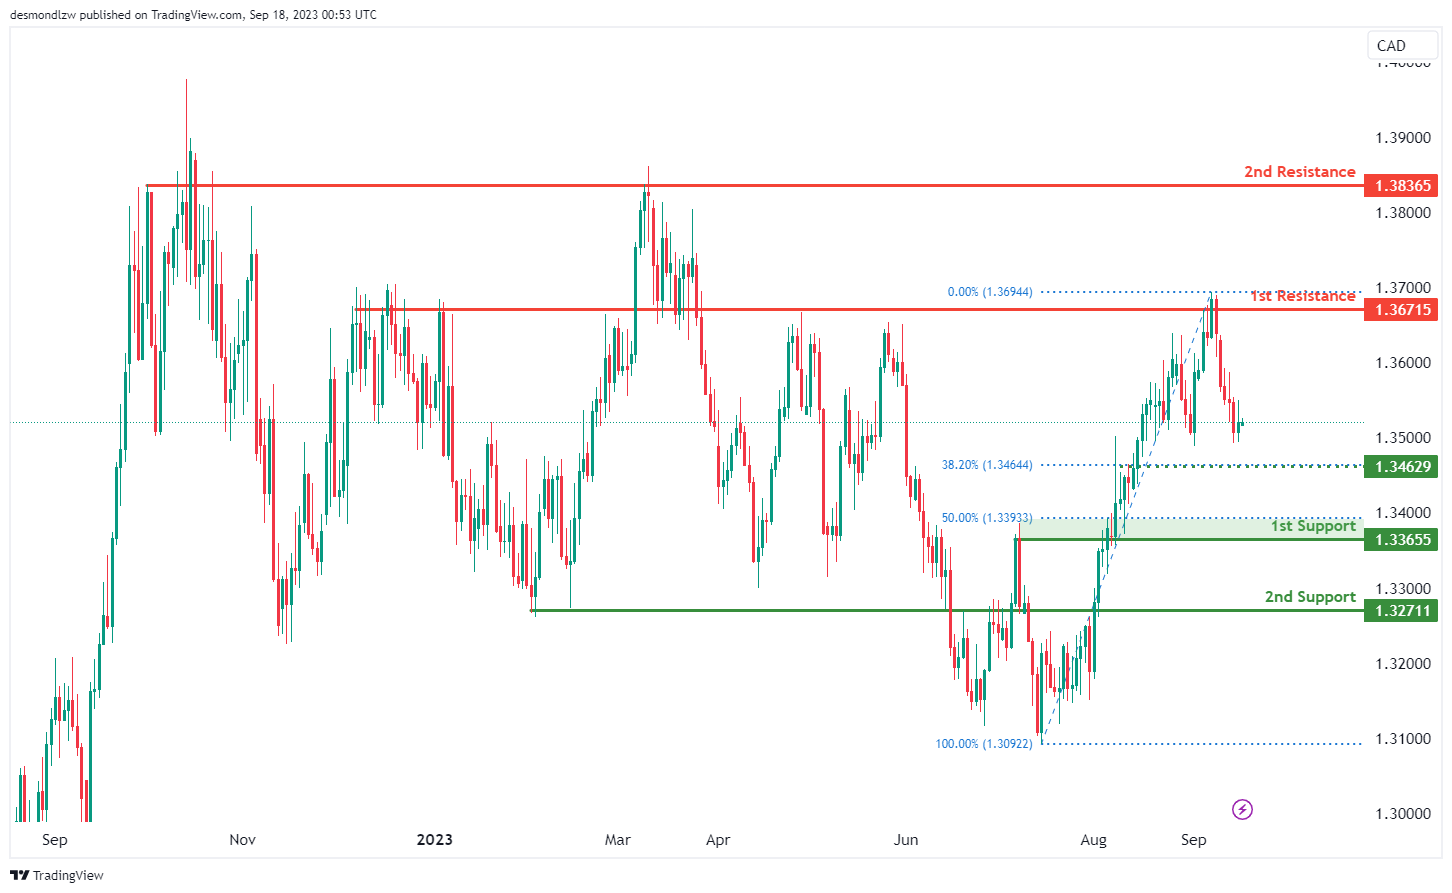
The USD/CAD chart currently shows an overall neutral momentum, suggesting a lack of a clear directional bias. Under this scenario, price could potentially fluctuate within a range defined by the 1st support and 1st resistance levels.
The 1st resistance level at 1.3672 is identified as an overlap resistance while the 2nd resistance level at 1.3837 is also marked as another overlap resistance that has a history of capping price increases.
To the downside, an intermediate support level at 1.3463 is marked as a pullback support that coincides with the 38.20% Fibonacci retracement level while the 1st support level at 1.3366 is marked as an overlap support that aligns with the 50.00% Fibonacci retracement level.
In addition, the 2nd support level at 1.3271 is also identified as an overlap support, further reinforcing its potential role as a support level.
AUD/USD:
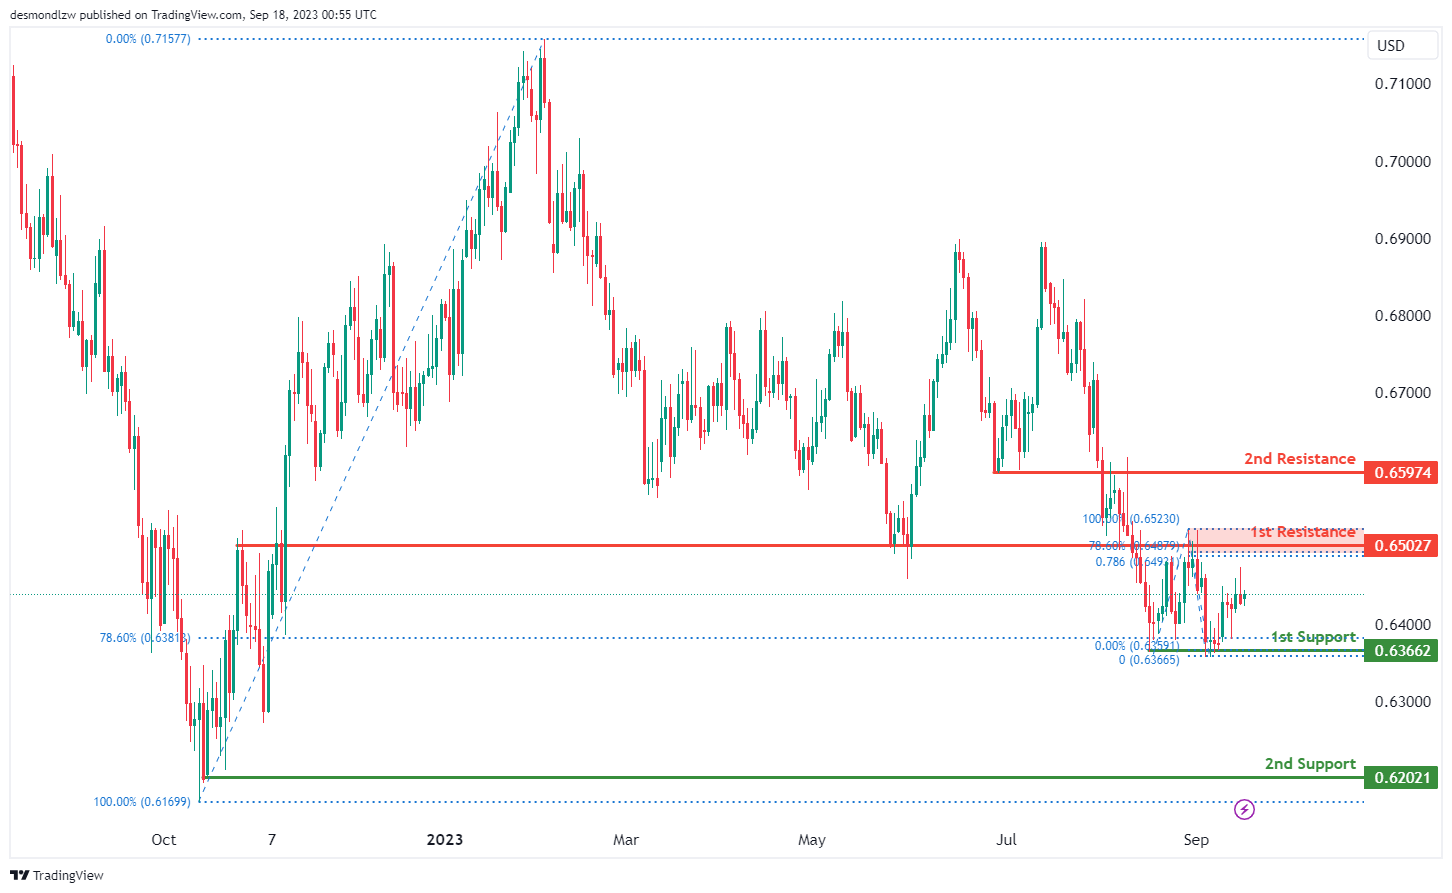
The AUD/USD chart currently presents an overall neutral momentum, suggesting that there’s no clear directional bias at the moment. In such situations, price could move within a defined range that is identified by the 1st support and the 1st resistance levels.
The 1st support at 0.6366 is identified as a pullback support that aligns with the 78.60% Fibonacci retracement level. Further below, 2nd support level at 0.6202 is marked as a swing-low support, making it a noteworthy level to monitor for potential reversals.
To the upside, the 1st resistance level at 0.6503 is marked as an overlap resistance that aligns with a confluence of Fibonacci levels i.e. the 78.60% retracement and the 78.60% projection levels, forming a robust technical zone of resistance.
In addition, the 2nd resistance level at 0.6597 is also identified as an overlap resistance level, which could potentially halt further upward movements in price.
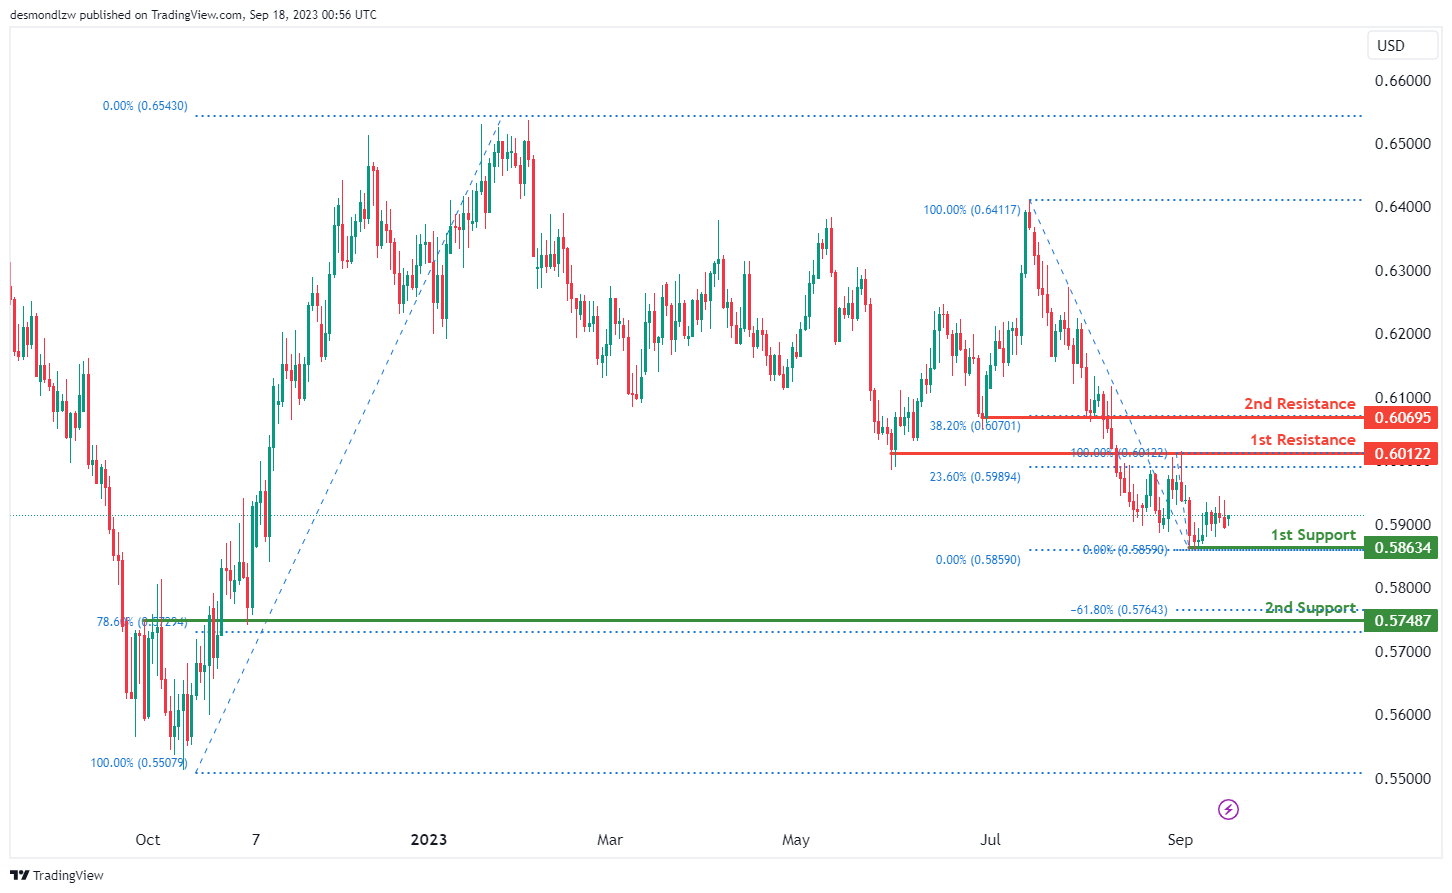
NZD/USD
The NZD/USD chart currently exhibits an overall neutral momentum, indicating a lack of a strong directional bias. In such situations, price movements could fluctuate within a range that is defined by the 1st support and the 1st resistance levels.
The 1st support level at 0.5863 is identified as a pullback support. Further below, the 2nd support level at 0.5749 is marked as an overlap support that aligns with a confluence of Fibonacci levels i.e. the 78.60% retracement and the -61.8% expansion levels, strengthening its significance as a potential support zone.
To the upside, the 1st resistance level at 0.6012 is identified as an overlap resistance that coincides with the 23.60% Fibonacci retracement level. Additionally, the 2nd resistance level at 0.6069 is marked as a pullback resistance that aligns with the 38.20% Fibonacci retracement level, reinforcing its role as a potential resistance area.
DJ30:
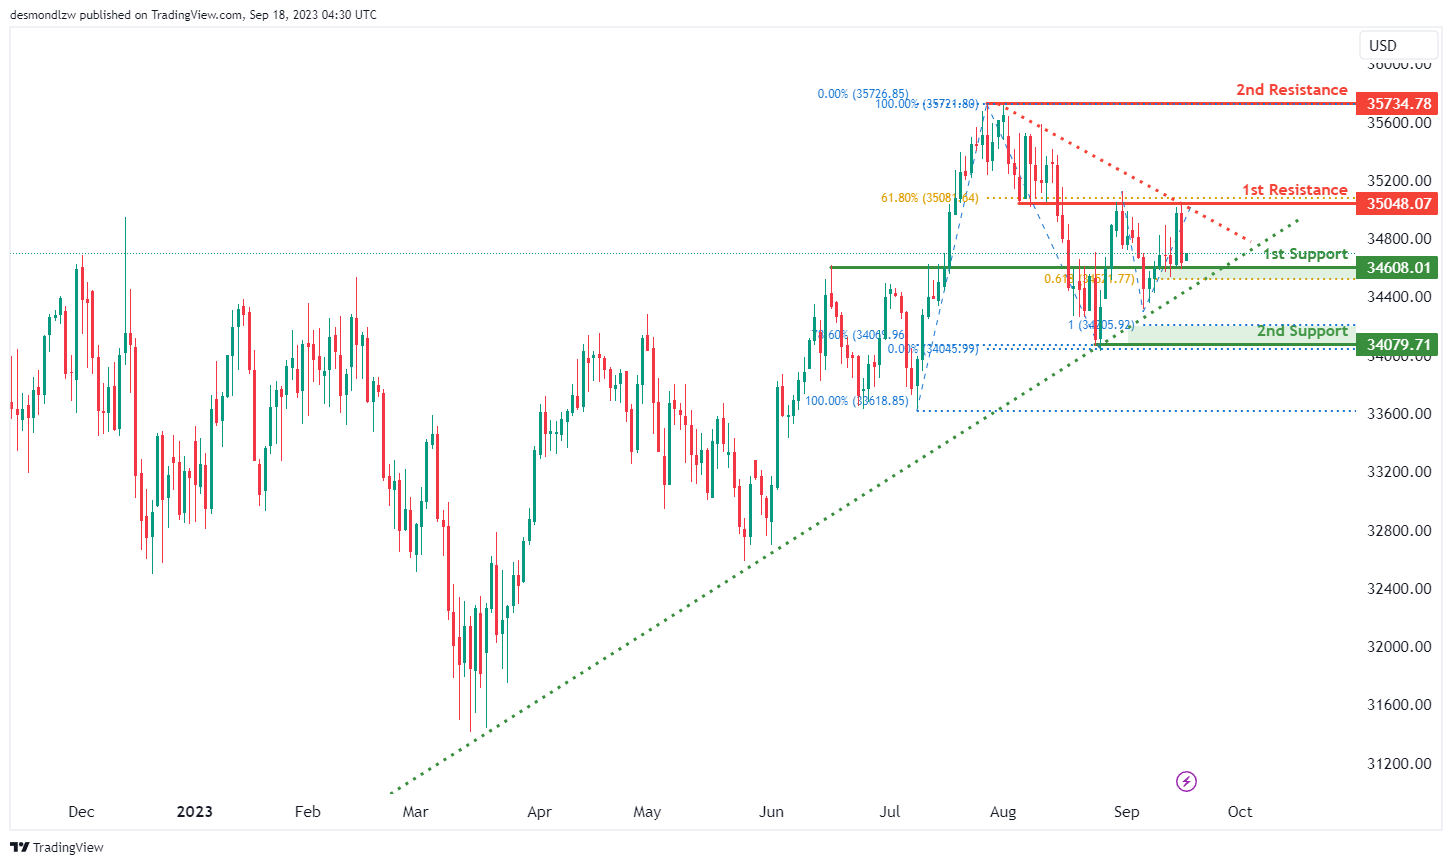
For DJ30, the overall momentum of the chart is currently bullish, indicating an upward trend.
There is potential for the price to continue its bullish movement towards the 1st resistance level at 35048.07.
The 1st support at 34608.01 is considered significant because it represents an overlap support and aligns with the 61.80% Fibonacci Projection.
In case of a more substantial pullback, the 2nd support level at 34079.71 is also noteworthy, representing a swing low support. It aligns with both the 78.60% Fibonacci Retracement and the 100% Fibonacci Projection, indicating strong potential support and a potential area of Fibonacci confluence.
On the upper side, the 1st resistance at 35048.07 is considered important due to its characteristics as an overlap resistance and its alignment with the 61.80% Fibonacci Retracement.
Further upward movement could face resistance at the 2nd resistance level of 35734.78, characterized as a swing high resistance, potentially acting as a barrier to the bullish momentum within the observed range.
GER30:
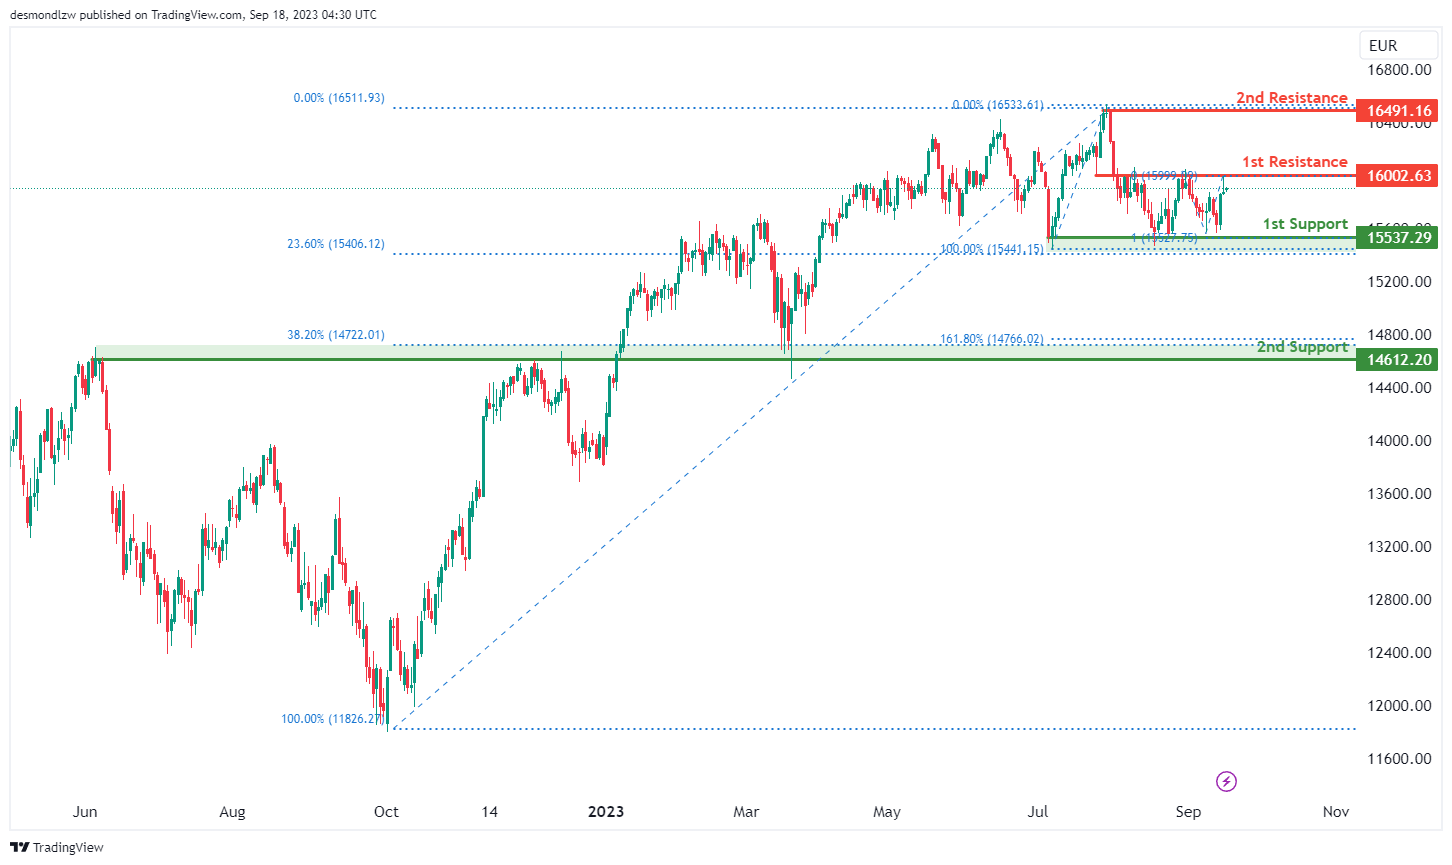
For GER30, the overall momentum of the chart is currently bearish, indicating a downward trend.
There is potential for the price to have a bearish reaction off the 1st resistance level at 16002.63 and drop to the 1st support at 15537.29.
The 1st support at 15537.29 is considered significant because it represents multi-swing low support and aligns with both the 23.60% Fibonacci Retracement and the 100% Fibonacci Projection, indicating strong potential support and a potential area of Fibonacci confluence.
In case of a more substantial decline, the 2nd support level at 14612.20 is also noteworthy, as it represents an overlap support. It aligns with the 38.20% Fibonacci Retracement and the 161.80% Fibonacci Extension, indicating strong Fibonacci confluence and potential stability at this level.
On the upper side, the 1st resistance at 16002.63 is considered important due to its characteristics as an overlap resistance.
Further upward movement could face resistance at the 2nd resistance level of 16491.16, characterized as swing high resistance. This level may act as a barrier to the bullish momentum within the observed range.
US500
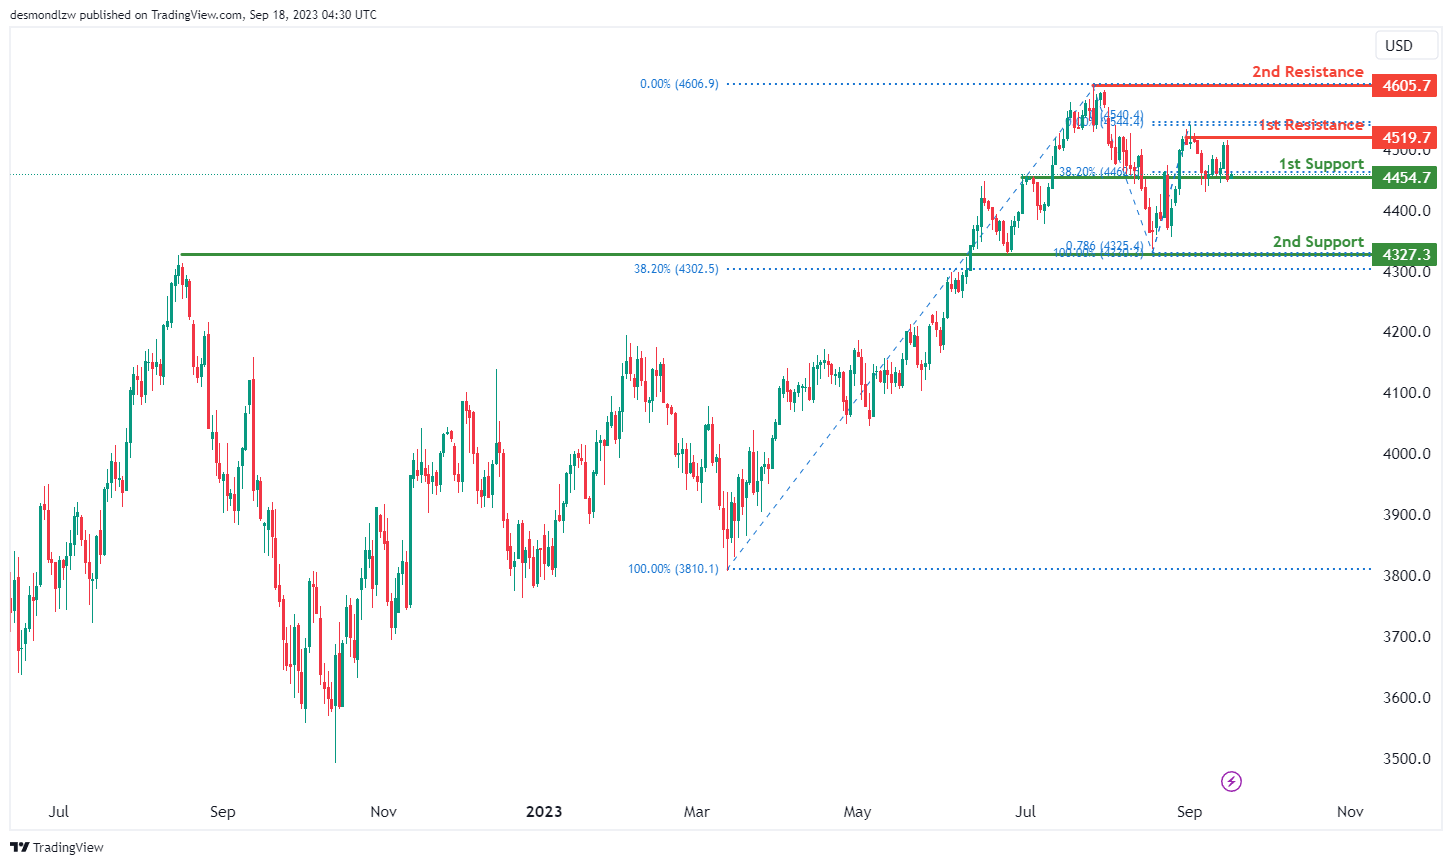
For US500, the overall momentum of the chart is currently bullish, indicating an upward trend.
There is potential for the price to make a bullish bounce off the 1st support level at 4454.7 and head towards the 1st resistance at 4519.7.
The 1st support at 4454.7 is considered significant because it represents a pullback support and aligns with the 38.20% Fibonacci Retracement.
In case of a more substantial pullback, the 2nd support level at 4327.3 is also noteworthy, representing an overlap support. It aligns with both the 38.20% Fibonacci Retracement and the 78.60% Fibonacci Projection, indicating strong potential support and a potential area of Fibonacci confluence.
On the upper side, the 1st resistance at 4519.7 is considered important due to its characteristics as multi-swing high resistance.
Further upward movement could face resistance at the 2nd resistance level of 4605.7, characterized as swing high resistance. This level may act as a barrier to the bullish momentum within the observed range.
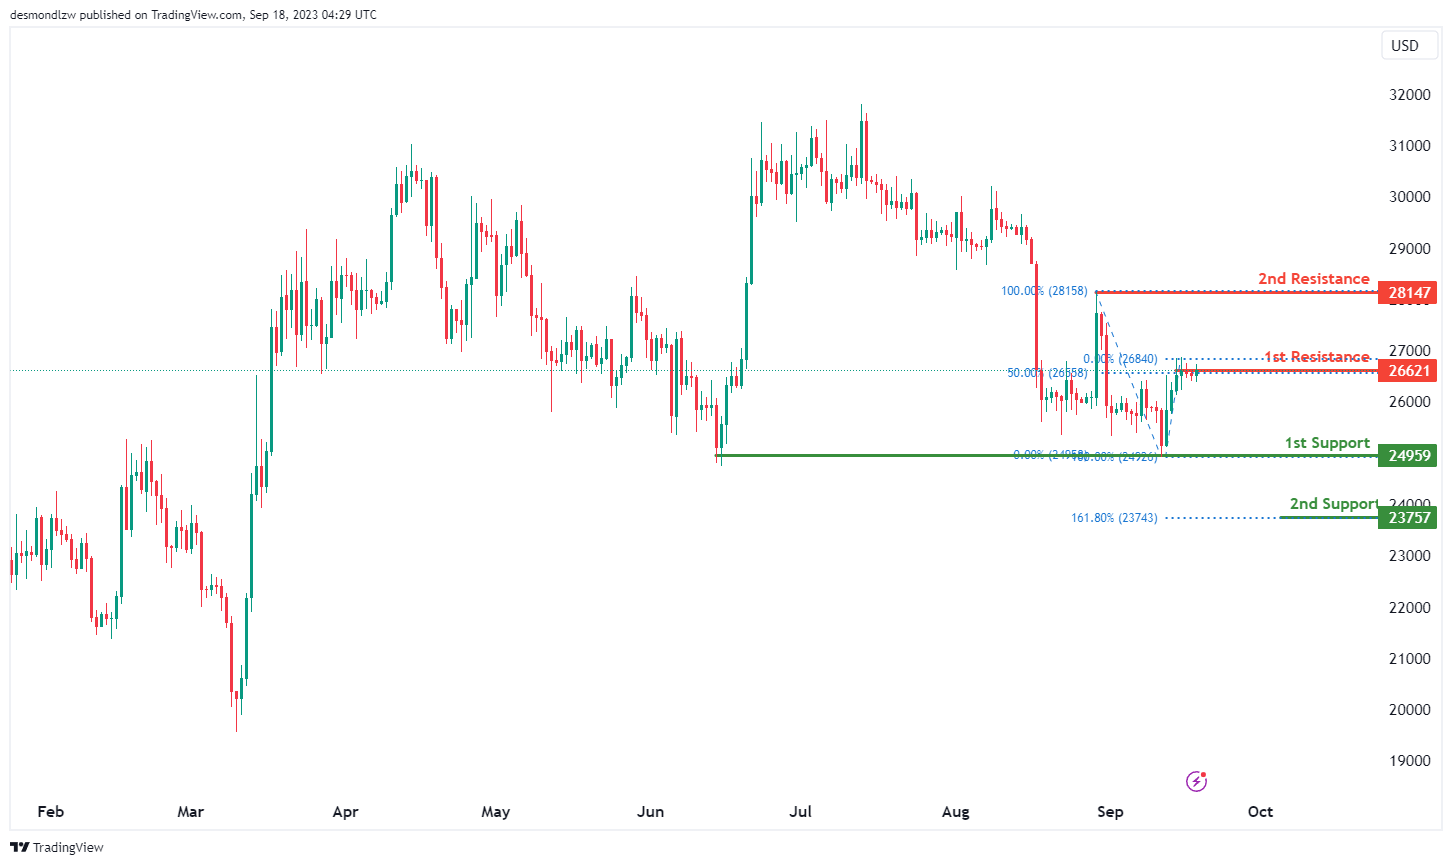
BTC/USD:
For BTC/USD, the overall momentum of the chart is currently bearish, indicating a downward trend.
There is potential for the price to have a bearish reaction off the 1st resistance level at 26621 and drop to the 1st support at 24959.
The 1st support at 24959 is considered significant because it represents multi-swing low support, suggesting potential stability and support at this level.
In case of a more substantial decline, the 2nd support level at 23757 is also noteworthy, as it represents the 161.80% Fibonacci Extension, providing additional support for this level.
On the upper side, the 1st resistance at 26621 is considered important due to its characteristics as swing high resistance and its alignment with the 50% Fibonacci Retracement level.
Further upward movement could face resistance at the 2nd resistance level of 28147, characterized as swing high resistance, potentially posing a significant barrier to the bullish momentum within the observed range.
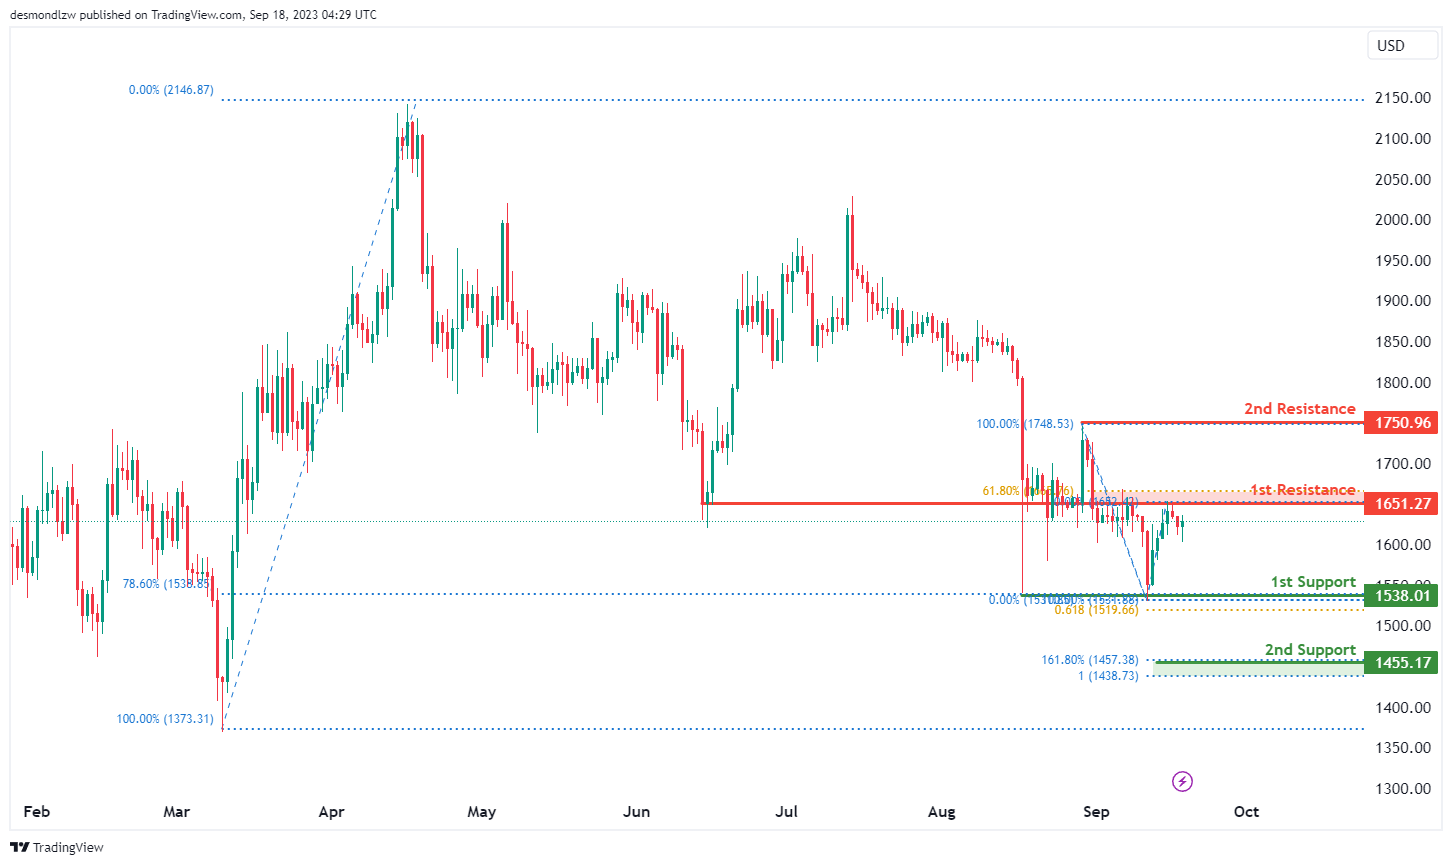
ETH/USD:
For ETH/USD, the overall momentum of the chart is currently bearish, indicating a downward trend.
There is potential for the price to have a bearish reaction off the 1st resistance level at 1651.27 and drop to the 1st support at 1538.01.
The 1st support at 1538.01 is considered significant because it represents multi-swing low support and aligns with both the 61.80% Fibonacci Projection and the 78.60% Fibonacci Retracement, indicating strong potential support at this level.
In case of a more substantial decline, the 2nd support level at 1455.17 is also noteworthy, as it represents the 161.80% Fibonacci Extension and the 100% Fibonacci Projection, indicating strong Fibonacci confluence and potential stability at this level.
On the upper side, the 1st resistance at 1651.27 is considered important due to its characteristics as an overlap resistance and its alignment with the 61.80% Fibonacci Retracement.
Further upward movement could face resistance at the 2nd resistance level of 1750.96, characterized as swing high resistance.
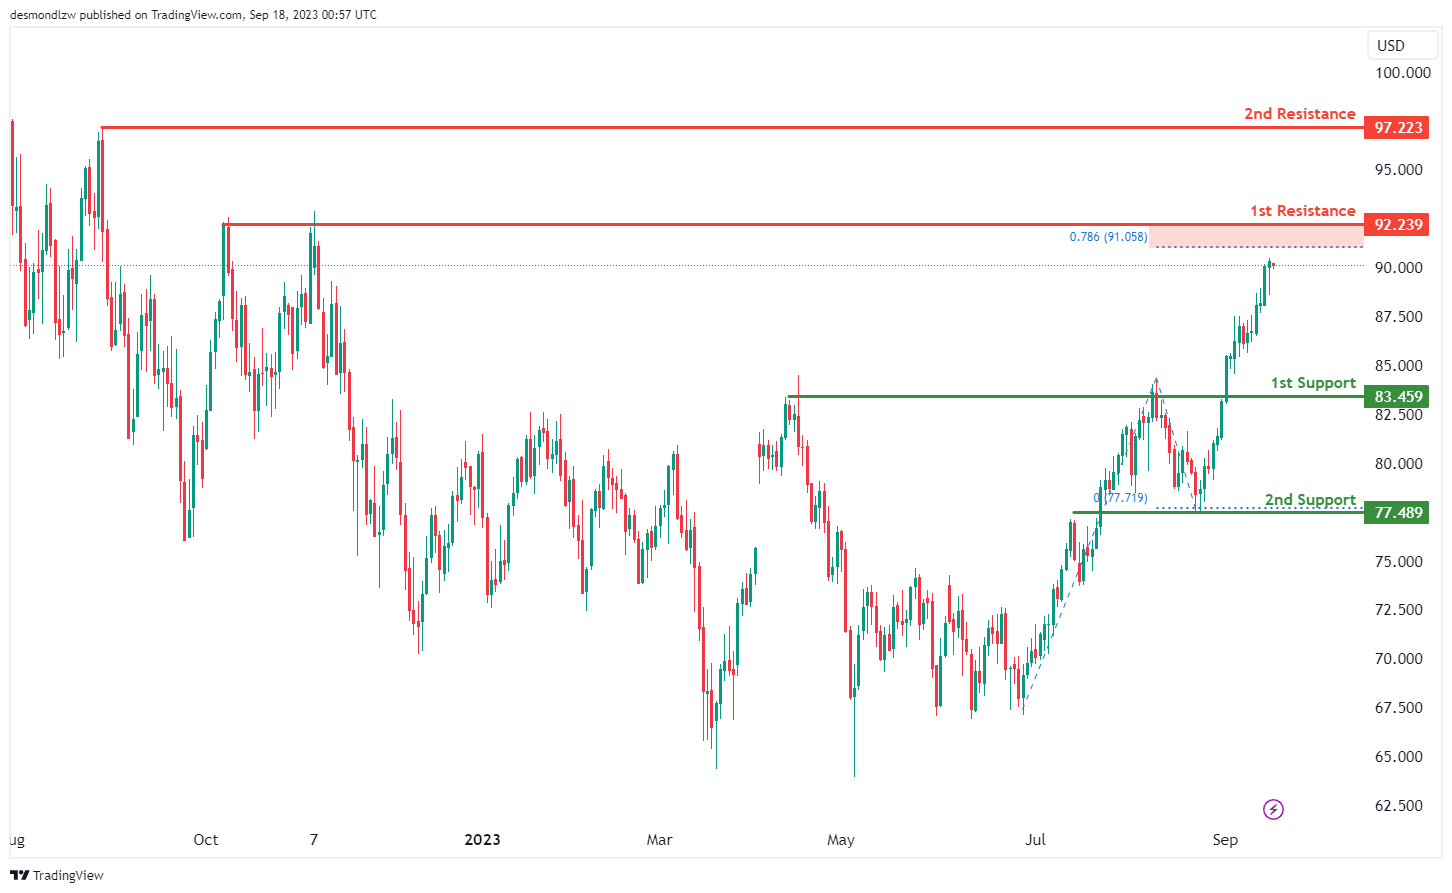
WTI/USD:
The WTI (West Texas Intermediate) chart currently indicates an overall bullish momentum, suggesting the potential for an upward price trend towards the 1st resistance level.
The 1st resistance level at 92.24 is identified as a multi-swing-high resistance that aligns with the 78.60% Fibonacci projection level.Further up, the 2nd resistance level at 97.22 is marked as swing-high resistance, which could potentially halt further upward movement in price.
To the downside, the 1st support level at 83.46 is identified as a pullback support while the 2nd support level at 77.49 is marked as an overlap support, indicating that it has previously acted as a strong barrier against price declines.
XAU/USD (GOLD):
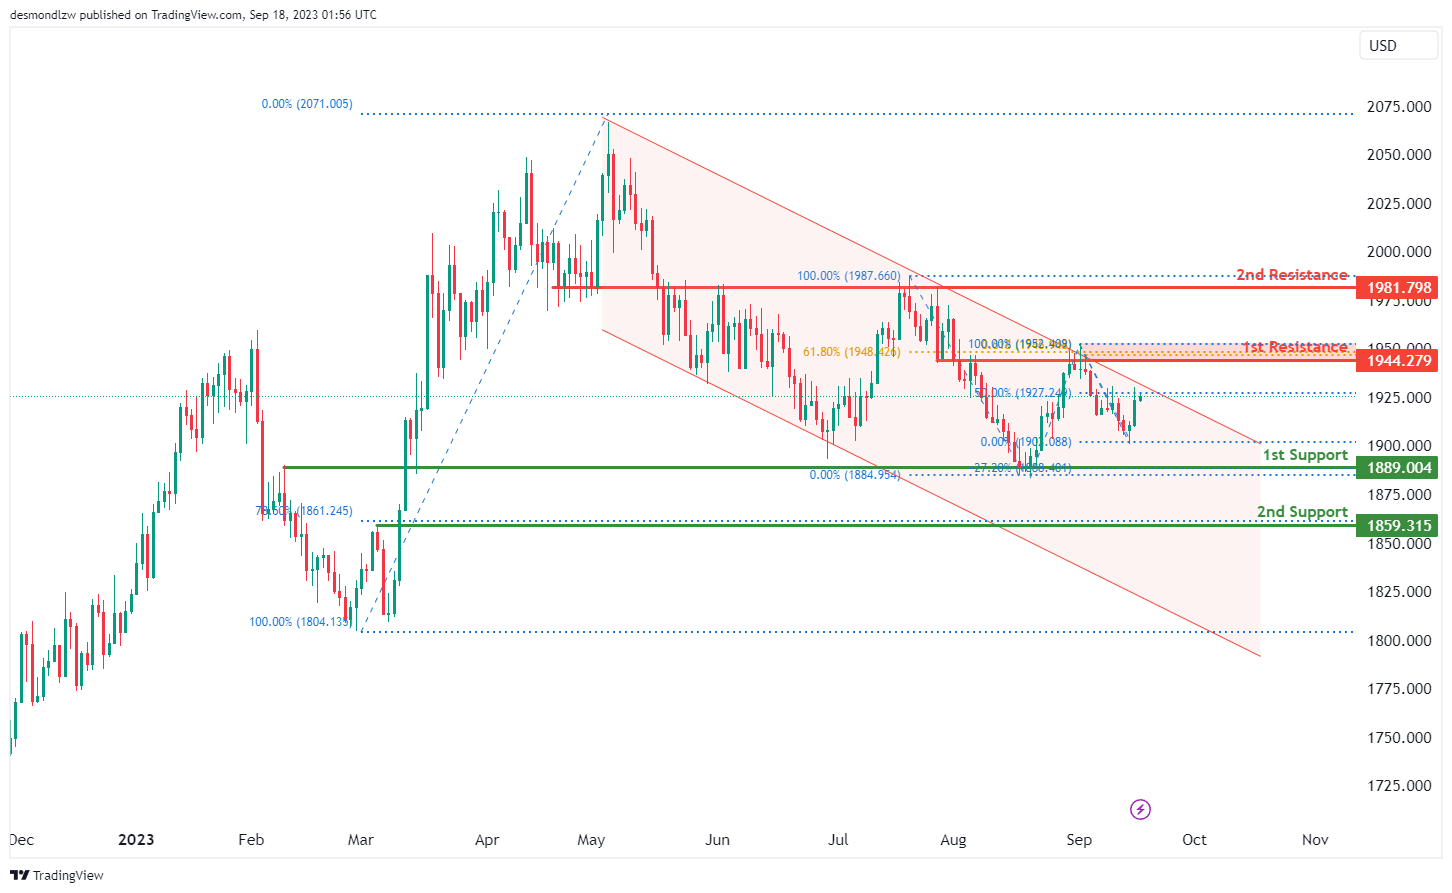
The XAU/USD chart currently demonstrates a prevailing bearish momentum, influenced by key factors contributing to its downward trajectory. Notably, the price is confined within a bearish descending channel, reinforcing the overall bearish sentiment and indicating the potential for further downward movement. In this context, there is a plausible scenario where the price may experience a bearish reaction upon reaching the 1st resistance level at 1944.27, followed by a potential retracement towards the 1st support at 1889.00. The 1st support level is of notable significance, classified as an overlap support, and it also aligns with the presence of the -27% Fibonacci Expansion, highlighting its potential as a strong support zone. Similarly, the 2nd support at 1859.31 is identified as a pullback support, coinciding with the 78.60% Fibonacci Retracement, further underlining its role as a key support level.
On the resistance side, the 1st resistance level at 1944.27 assumes a pivotal role as an overlap resistance, and it’s reinforced by the presence of both the 61.80% Fibonacci Retracement and the 61.80% Fibonacci Projection, indicating a significant Fibonacci confluence and adding weight to its potential as a resistance barrier. Beyond the 1st resistance, the 2nd resistance at 1081.79 is categorized as an overlap resistance. With the chart’s overall bearish momentum.