Sample Category Title
AUD/USD: Aussie Dollar Hit New Multi-Month Low, But Bears Faced Strong Headwinds
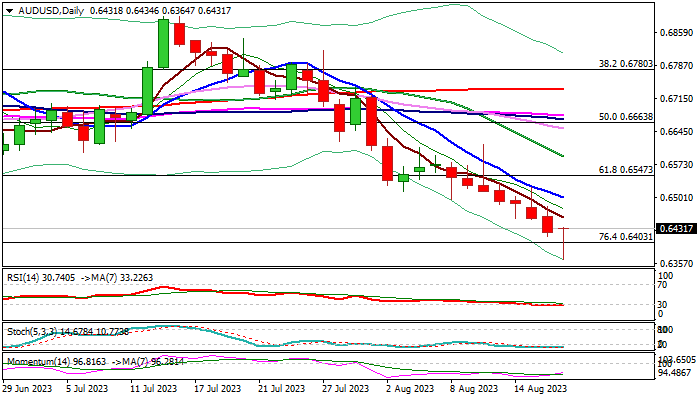
Australian dollar spiked to the lowest since early November on Wednesday, hit by downbeat Australia’s labor data (employment fell by 14.6K in July after 31.6K increase in June and well below forecast for 15K increase, while unemployment rose to 3.7% from 3.5% previous months and overshot consensus at 3.6%) adding to already weakened risk sentiment on concerns about China’s economic recovery.
Fresh bears broke through Fibo support at 0.6403 (76.4% of 0.6170/0.7157) and hit new multi-month low at 0.6364, but dip was short-lived as price quickly bounced to the session high, as daily studies are stretched.
Price adjustment is likely to precede fresh push lower and offer better selling opportunities while the price stays below falling 10DMA (0.6501).
Firm break of cracked Fibo support at 0.6403 would signal continuation of larger downtrend and risk test of 2022 low at 0.6170.
On the other hand, bears may lose traction on lift and close above 10DMA (0.6501), which would also generate initial signal of bear-trap and allow for stronger recovery.
Res: 0.6458; 0.6501; 0.6521; 0.6547.
Sup: 0.6403; 0.6364; 0.6272; 0.6170.
Dollar Can Complete a Five Wave Rise, Be Aware of a Retracement
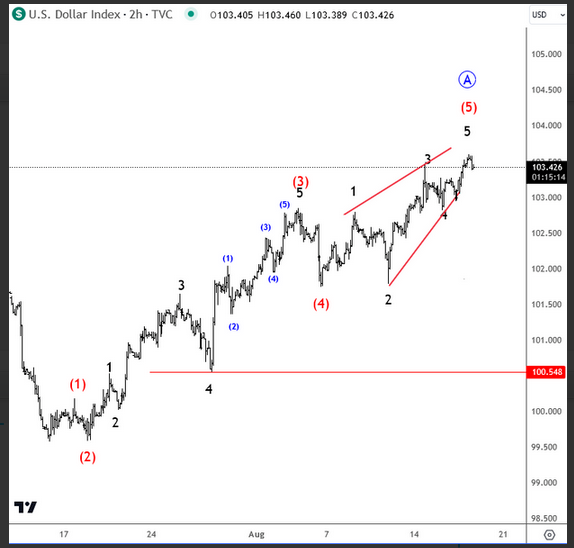
The USD edged slightly higher, and stocks hit new lows for the week yesterday after the release of FOMC minutes. These minutes revealed that officials expressed concerns about the pace of inflation and noted the possibility of additional rate hikes unless future data suggests otherwise. So USD index retested the highs, but notice that market can be coming into the end of a fifth wave with potential wedge formation, which normally suggests that a bearish reversal is about to happen. As such, dont be surprised if the market slows down here, which on the other side can also cause some relieve rally for stocks.
XAU/USD: Deeper Drop to be Expected on Firm Break of Key $1900 Support Zone
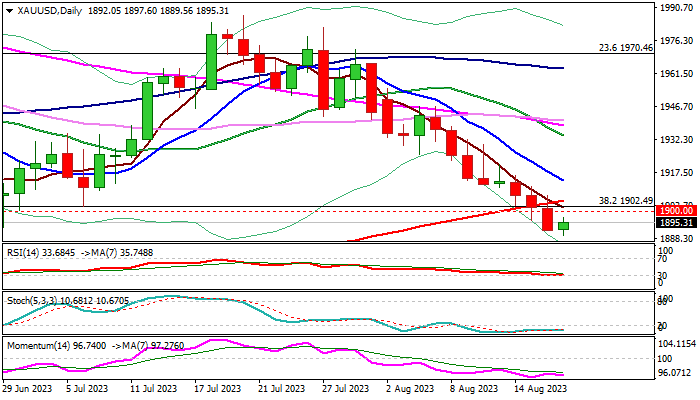
Gold price edged higher in European trading on Thursday, after hitting five-month low ($1889) in Asia.
Wednesday’s close below key supports at $1900 zone (200DMA - $1905; Fibo 38.2% of $1614/$2080 - 1902; psychological - $1900 and former low of June 29 - $1892) generated strong bearish signal.
Signal needs to be verified by sustained break below these supports, which will also complete a failure swing pattern on daily chart and add to bearish outlook.
Stronger dollar on overall hawkish Fed, as well as growing concerns about China’s economic growth, particularly on developing crisis in property sector, prompt traders into dollar and continue to pressure the yellow metal.
Meanwhile, bears may take a breather and consolidate, as daily studies are oversold, with the action expected to stay capped under 200DMA to keep bears intact for extension towards targets at $1858/$1847 (Mar 6 high / 50% retracement of $1614/$2080).
Caution on bounce above 200DMA which would generate initial signal of a false break lower, with acceleration above falling 10DMA ($1914) to weaken bearish structure and risk stronger rebound.
Res: 1900; 1905; 1914; 1926.
Sup: 1889; 1858; 1847; 1804.
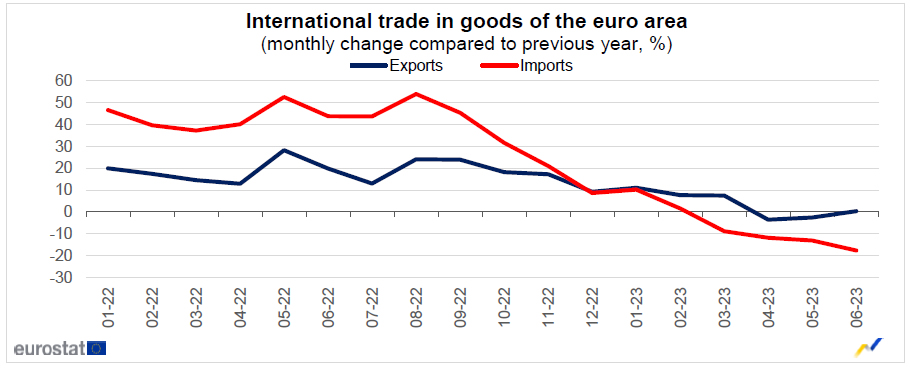
Eurozone exports rose 0.3% yoy in Jun, imports down -17.7% yoy
Eurozone exports of goods rose 0.3% yoy to EUR 252.3B in June. Imports fell -17.7% yoy to EUR 229.3B. Trade balanced recorded a EUR 23B surplus. Intra-Eurozone trade fell -4.1% yoy to EUR 231.6B.
In seasonally adjusted term, exports dropped -0.5% mom to EUR 237.2B. Imports dropped -5.6% mom to EUR 224.6B. Trade surplus widened to EUR 12.5B, larger than expectation of EUR 2.3B. Intra-Eurozone trade fell from EUR 220.8B to 217.6B during the month.
BTCUSD Drops to 2-Month Low
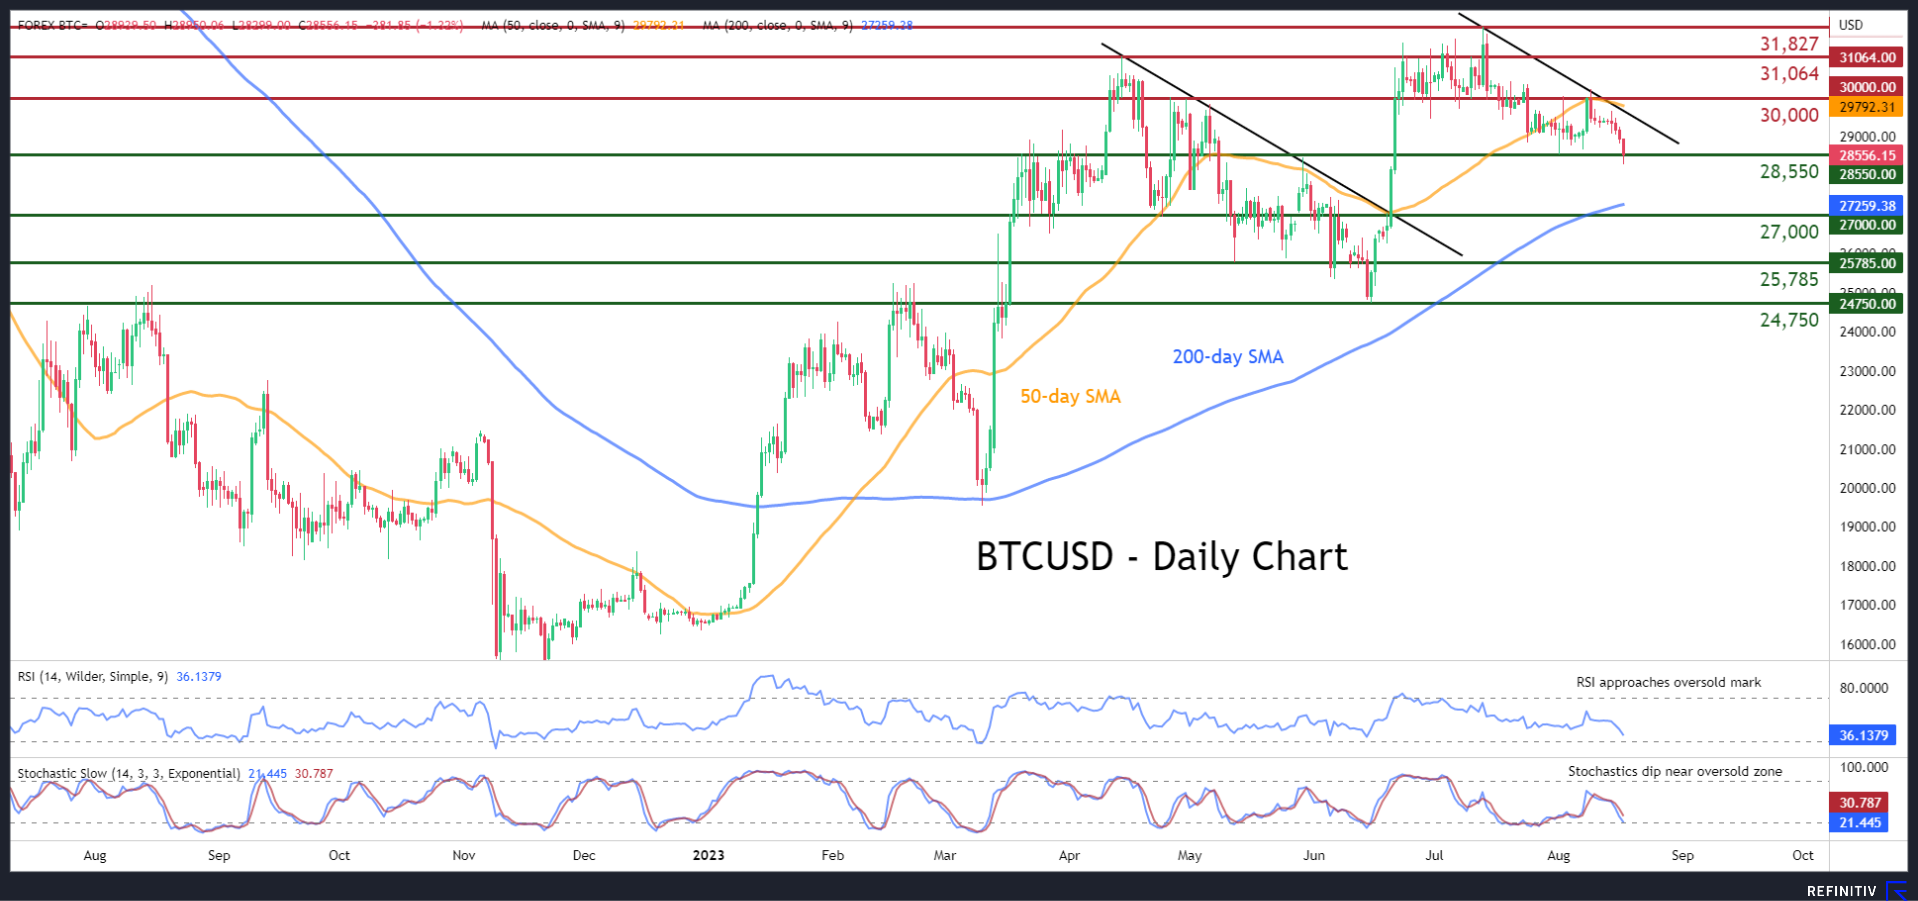
BTCUSD (Bitcoin) has been rangebound for almost a month following a mild pullback from its recent 2023 highs. However, the king of cryptos has been gradually forming a structure of lower highs and lower lows similar to the one observed during the April-June period, with the price posting a fresh two-month bottom in today’s session.
The momentum indicators currently suggest that near-term risks are tilted to the downside. Specifically, both the RSI and the stochastic oscillator are negatively charged just shy of their oversold territories.
To the downside, for Bitcoin to post a bearish breakout from its recent sideways pattern, the bears should initially push the price below the 28,550 hurdle. If that barricade fails, the spotlight could turn to the April bottom of 27,000 before the May low of 25,785 gets tested. Further declines might then cease at the June low of 24,750.
Alternatively, if the price regains traction and edges back above its downward sloping trendline, the $30,000 psychological mark could prove to be the first barrier for buyers to claim. A violation of that zone may open the door for the April peak of 31,064. Surpassing that region, the price could then challenge the 14-month high of 31,827.
Overall, BTCUSD has been trading sideways for quite some time amid a broader evolving bearish short-term pattern, which resulted in a fresh two-month low in today’s session. For the bulls to regain confidence, the price needs to jump back above the 50-day SMA.
Bears Get the Upper Hand in Crypto
Market picture
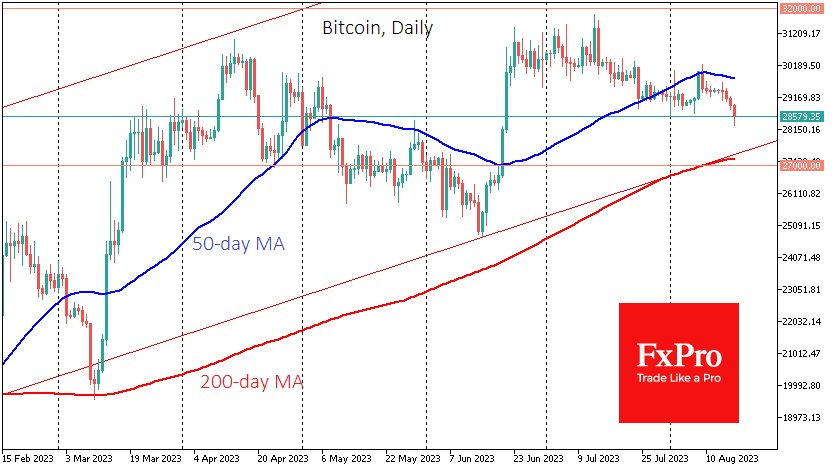
Crypto market capitalisation fell a further 1.6% overnight to 1,137 trillion. A brief dip in the morning to 1,113 took the market to its lowest level in almost two months. Bitcoin is down 1.7%, Ethereum is down 1.2%, with the top altcoins losing between 0.8% (Cardano) and 7% (Bitcoin Cash).
Bitcoin slipped to $28.3K in light trading early Thursday morning before stabilising at $28.6K. The fall below $28.8K confirmed the local dominance of the bears. The following key support points are now at the next round level of $28K and then at the $27.2K area, where the 200-day moving average and uptrend support from last November are centred.
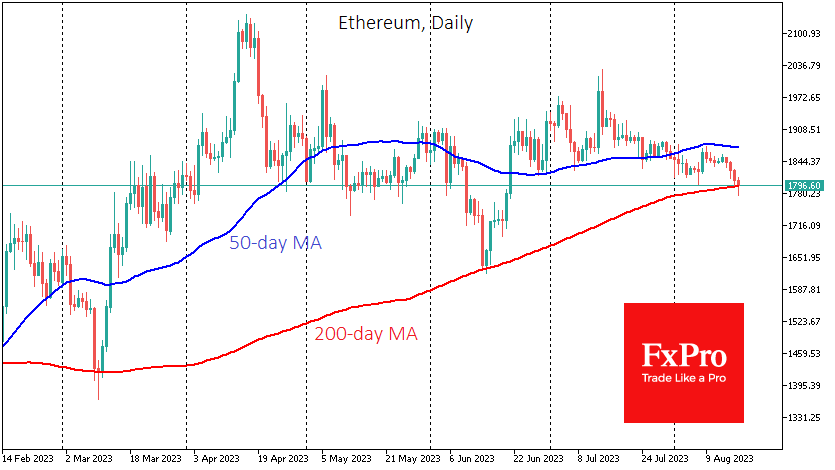
Ethereum pulled back below $1800 and tested its 200-day moving average. It bounced steadily from this level in March and June. Given the bearish sentiment in global markets and rising government bond yields, the chances of a drop to the previous lows of $1630 are increasing.
News background
The new SEI crypto token surpassed $1.6 billion in trading volume overnight. The token beat major crypto assets such as XRP, BNB and Dogecoin (DOGE) in turnover. The SEI launched its Sei Network blockchain project on Tuesday. The developers are positioning it as a network for high-frequency trading applications with high transaction processing speeds.
Tron co-founder Justin Sun described himself as a “Bitcoin supporter” and said he owns more than 100,000 BTC.
According to an agency report, the Federal Bureau of Investigation seized $1.7 million in various digital assets between March and May 2023.
Coinbase Exchange received a CFTC’s Futures Commission Merchant licence allowing crypto-based futures trading access to select US customers.
Observers noticed the movement of 1,005 BTC from the sleeping 13-year-old wallet, and some cryptocurrency community members even thought Satoshi Nakamoto had moved the coins.
EUR/USD: Euro Cracks Key Supports after Overall Hawkish Fed Minutes
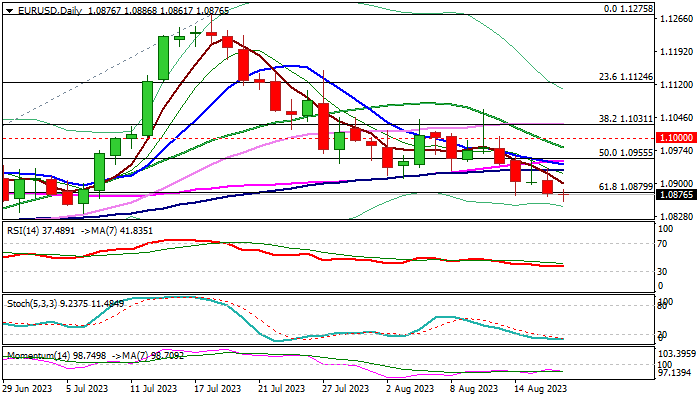
The Euro hit new 5 ½ week low in Asia on Thursday and generated fresh bearish signal on Wednesday’s close below important Fibo support at 1.0879 (61.8% of 1.0635/1.1275) and probe below rising daily cloud (spanned between 1.0887 and 1.0945).
The single currency came under increased pressure after Fed minutes of July meeting (released late Wednesday), which showed overall hawkish stance of the US policymakers.
Although the FOMC members were divided over the need for more rate hikes, pointing to growing risk to the economy on further rise in borrowing cost, they were united in their commitment to continue to fight inflation and bring it to 2% target, which markets saw as hawkish signal.
Slowdown in early European trading on Thursday after the price dipped below the cloud, was so far seen as consolidation, with oversold conditions on daily chart contributing to the scenario.
Limited upticks should keep overall bearish structure intact and offer better levels to re-enter bearish market, with repeated close below broken 1.0879 Fibo level and sustained break below daily cloud, to confirm signal and open way for test of next target at 1.0786 (200DMA / Fibo 76.4%).
Daily studies maintain strong negative momentum, with long upper shadows of Wed/Tue daily candles, pointing to bearish pressure and adding to negative outlook.
Near-term action should stay under 100DMA (1.0930) which capped upticks in past two day, while bears could be questioned if the price bounces above falling 10DMA (1.0942).
Res: 1.0930; 1.0950; 1.0980; 1.1000.
Sup: 1.0851; 1.0800; 1.0786; 1.0733.
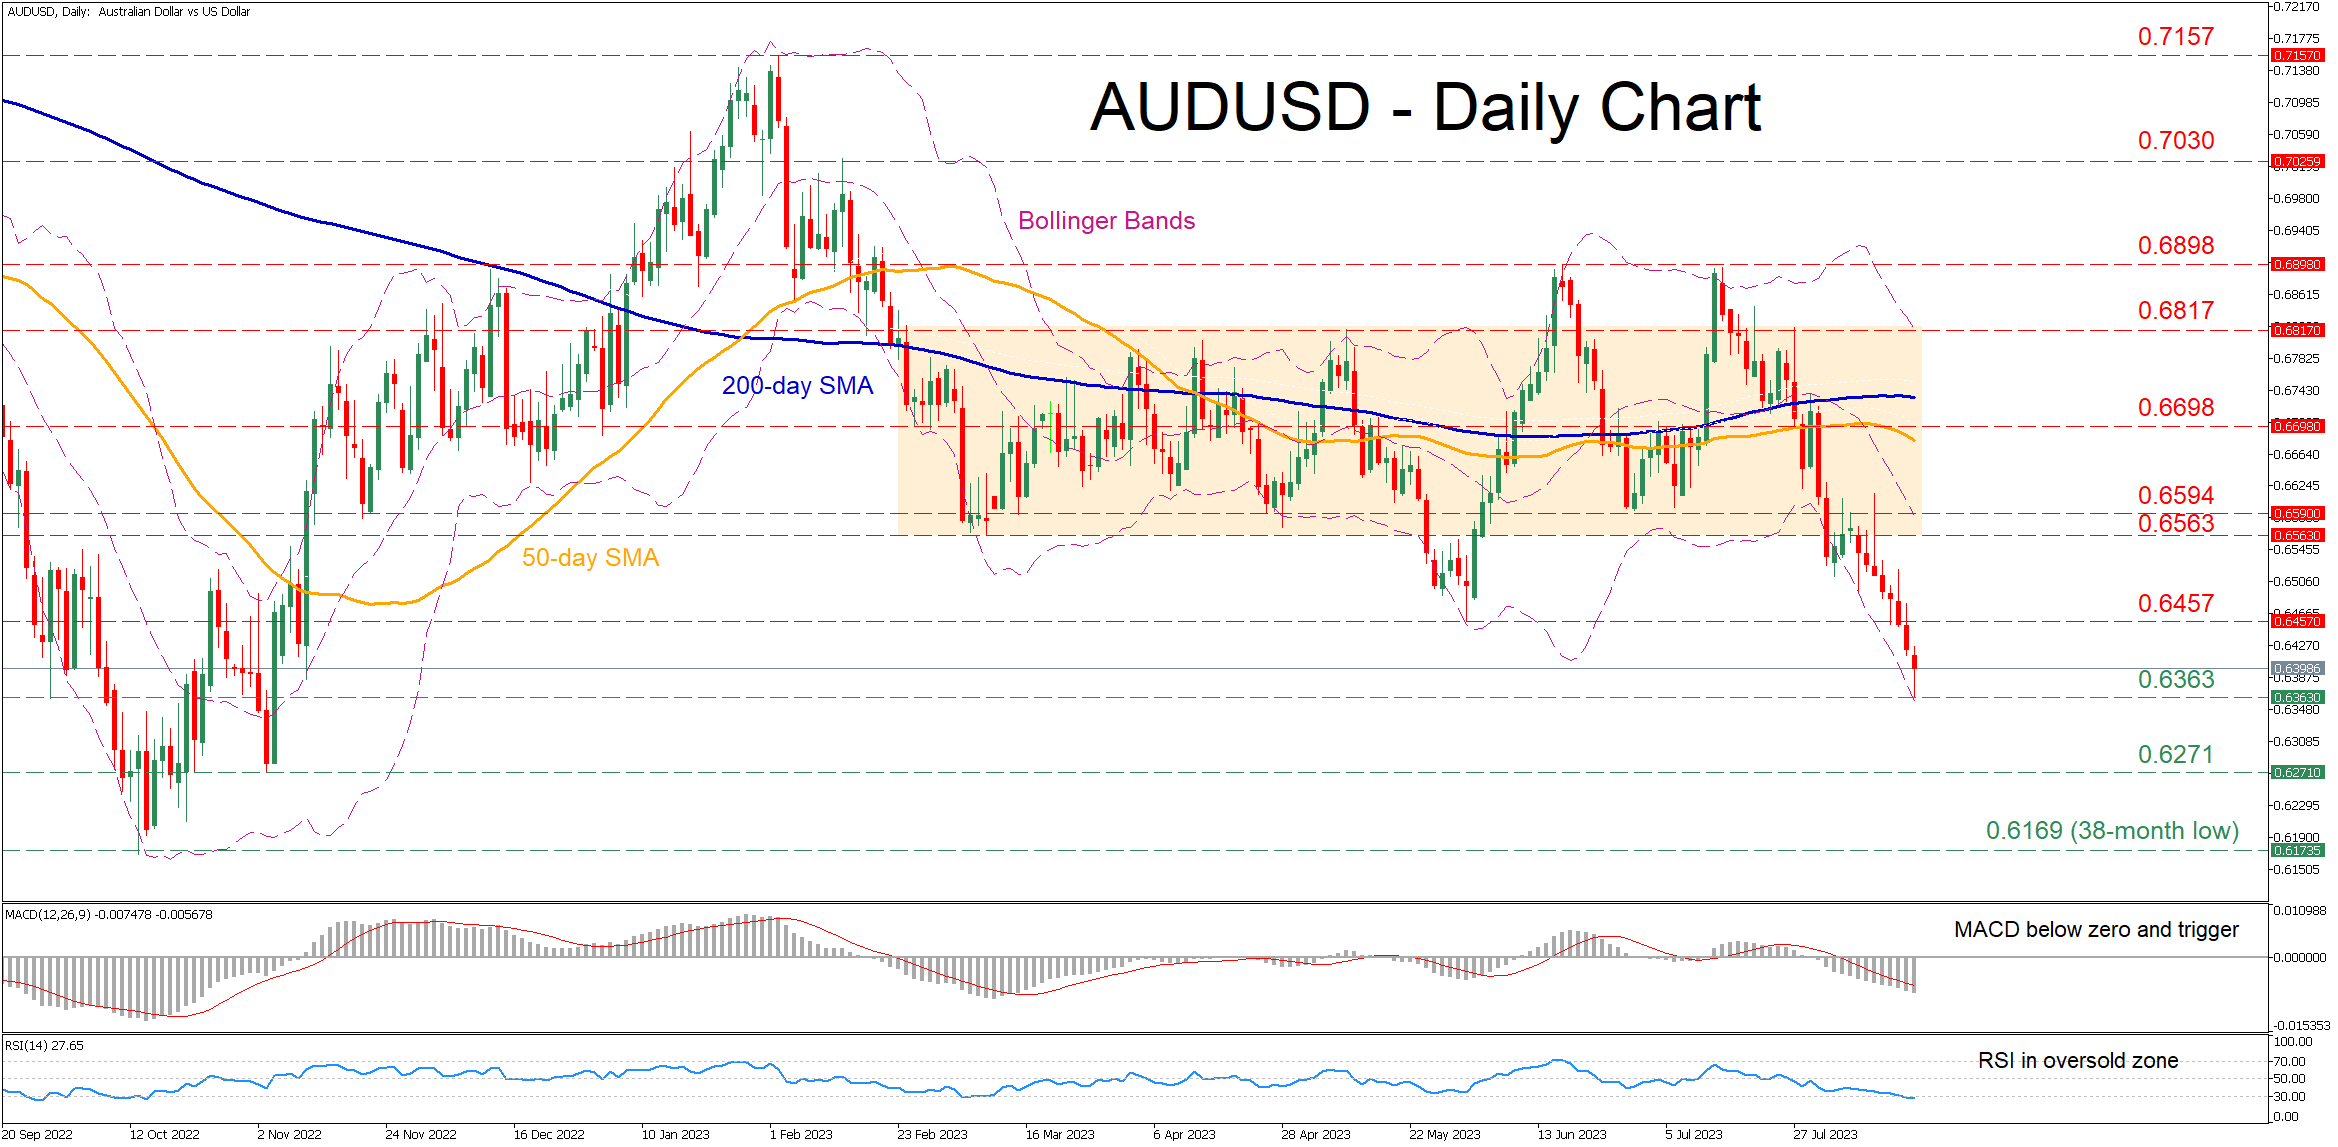
AUDUSD Sinks to Fresh 2023 Low, Looking Oversold
AUDUSD has been in an aggressive decline after its latest bullish breakout from the rectangle encountered resistance at 0.6898, validating a double top pattern. In the near-term, the pair is posting consecutive lower lows, with the price appearing to have approached oversold conditions as it is trading very close to the lower Bollinger band.
The momentum indicators currently suggest that the recent selloff could be overstretched. Specifically, the MACD is softening below both zero and its red signal line at its lowest levels since March, while the RSI is hovering within its 30-oversold territory.
Should the negative pressures persist, the price could initially test the 2023 bottom of 0.6363, which also held strong in September 2022. Slicing through that region, the pair might descend towards levels not seen in months, where the November 2022 low of 0.6271 could curb further downside attempts. A break below the latter could open the door for the 38-month low of 0.6169 registered in October 2022.
Alternatively, if the pair manages to halt its retreat and bounce back, a series of previous support regions such as 0.6457, 0.6563 and 6.594 could prove to be hard hurdles for the bulls to conquer. Surpassing the latter, the price might challenge 0.6698, which has acted both as resistance and support in recent months.
In brief, AUDUSD has been in a clear downtrend for the last 10 days, marking a streak of fresh 2023 lower lows as the bears seem unwilling to lift the foot off the gas. Nevertheless, traders should not rule out a potential rebound as the pair has approached oversold conditions.
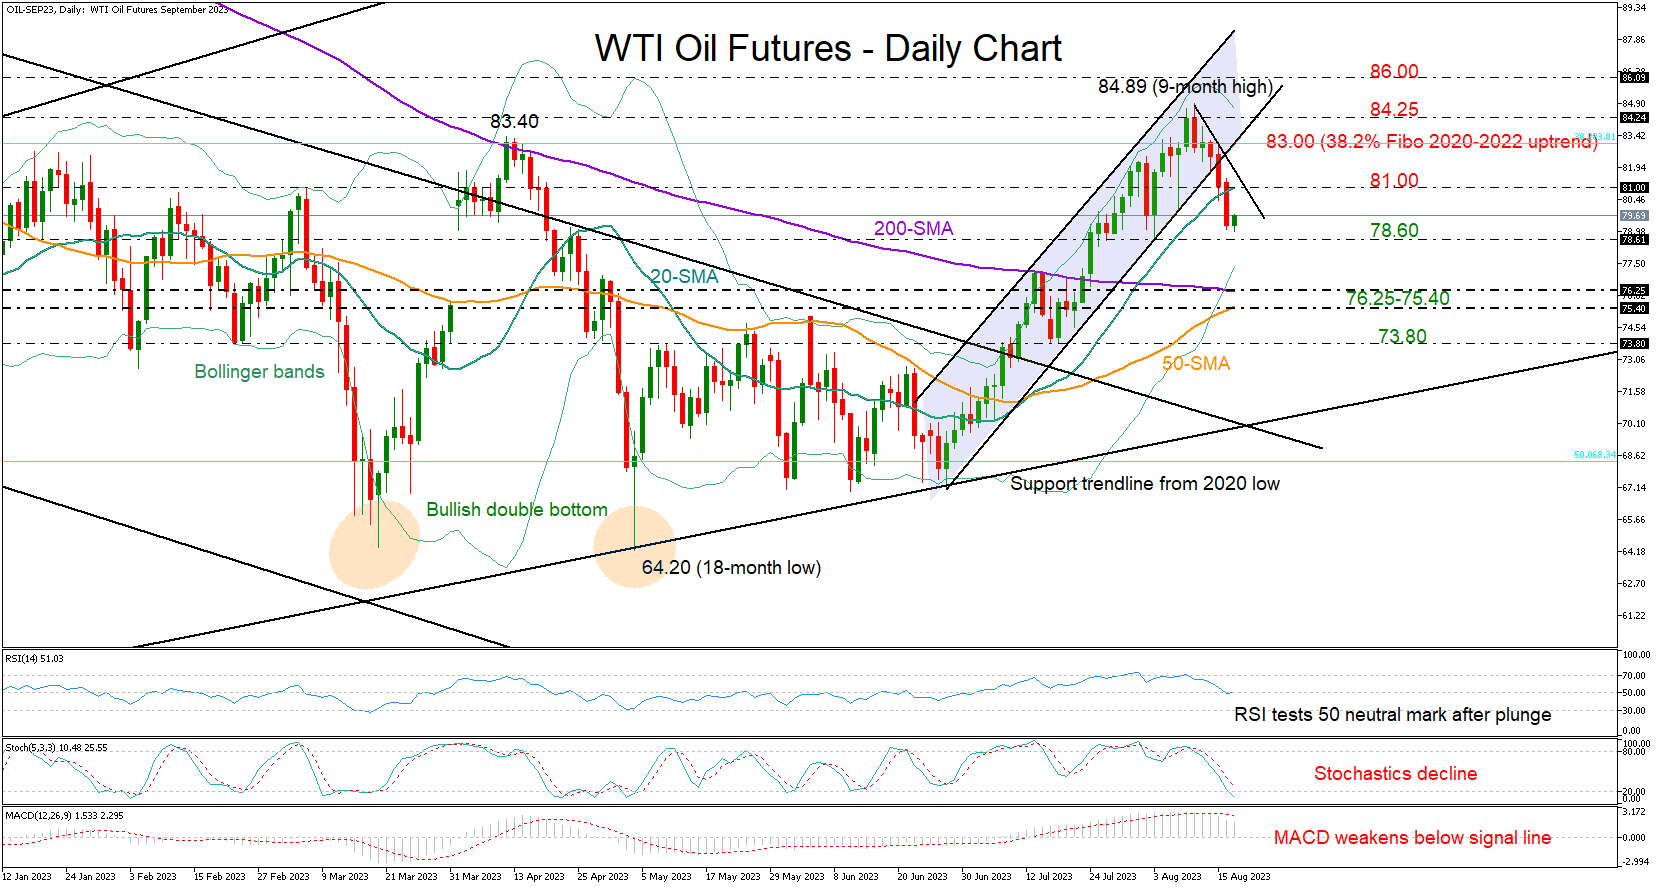
WTI Oil Dips Again as Sellers Take Control
WTI oil futures got hammered after the peak at a nine-month high of 84.89, breaking out of the tight bearish channel that had been navigating the market over the past two months.
The price has re-entered the broad neutral area below 83.40, closing significantly below the 20-day simple moving average (SMA) and the 80.00 round level on Wednesday. The latter is a negative warning that the sell-off could gain extra impetus and the technical indicators are in line with this narrative. The MACD is decelerating below its red signal line, while the RSI is set to cross below its 50 neutral mark. Meanwhile, the stochastic oscillator hasn't bottomed out yet, and the price itself is still above the lower Bollinger band, meaning sellers may still be in control for a while.
Should the bears snap the nearby floor of 78.60 too, the price could next seek shelter somewhere between the 200- and 50-day SMAs at 76.25 and 75.40 respectively. A step lower could halt near the 73.80 constraining zone, where the price rotated northwards in mid-July.
In the event of an upside reversal, traders will look for a close above the 20-day SMA at 81.00 before they target again the former resistance of 83.00-83.40. Then, an extension above last week’s bar of 84.25 could lift the price up to 86.00 last seen during August-November 2022.
Encouragingly, the 50-day SMA has reduced its gap with the 200-day SMA. Hence, it would be interesting to see if the lines will manage to post a bullish cross in the weeks ahead. If a bullish cross were to happen, the latest upleg could regain some trust.
Summing up, the short-term bias has switched back to bearish in the WTI crude market, with selling pressures expected to intensify again below 78.60.
JP225 Cash Index Bulls Reappear in the Market
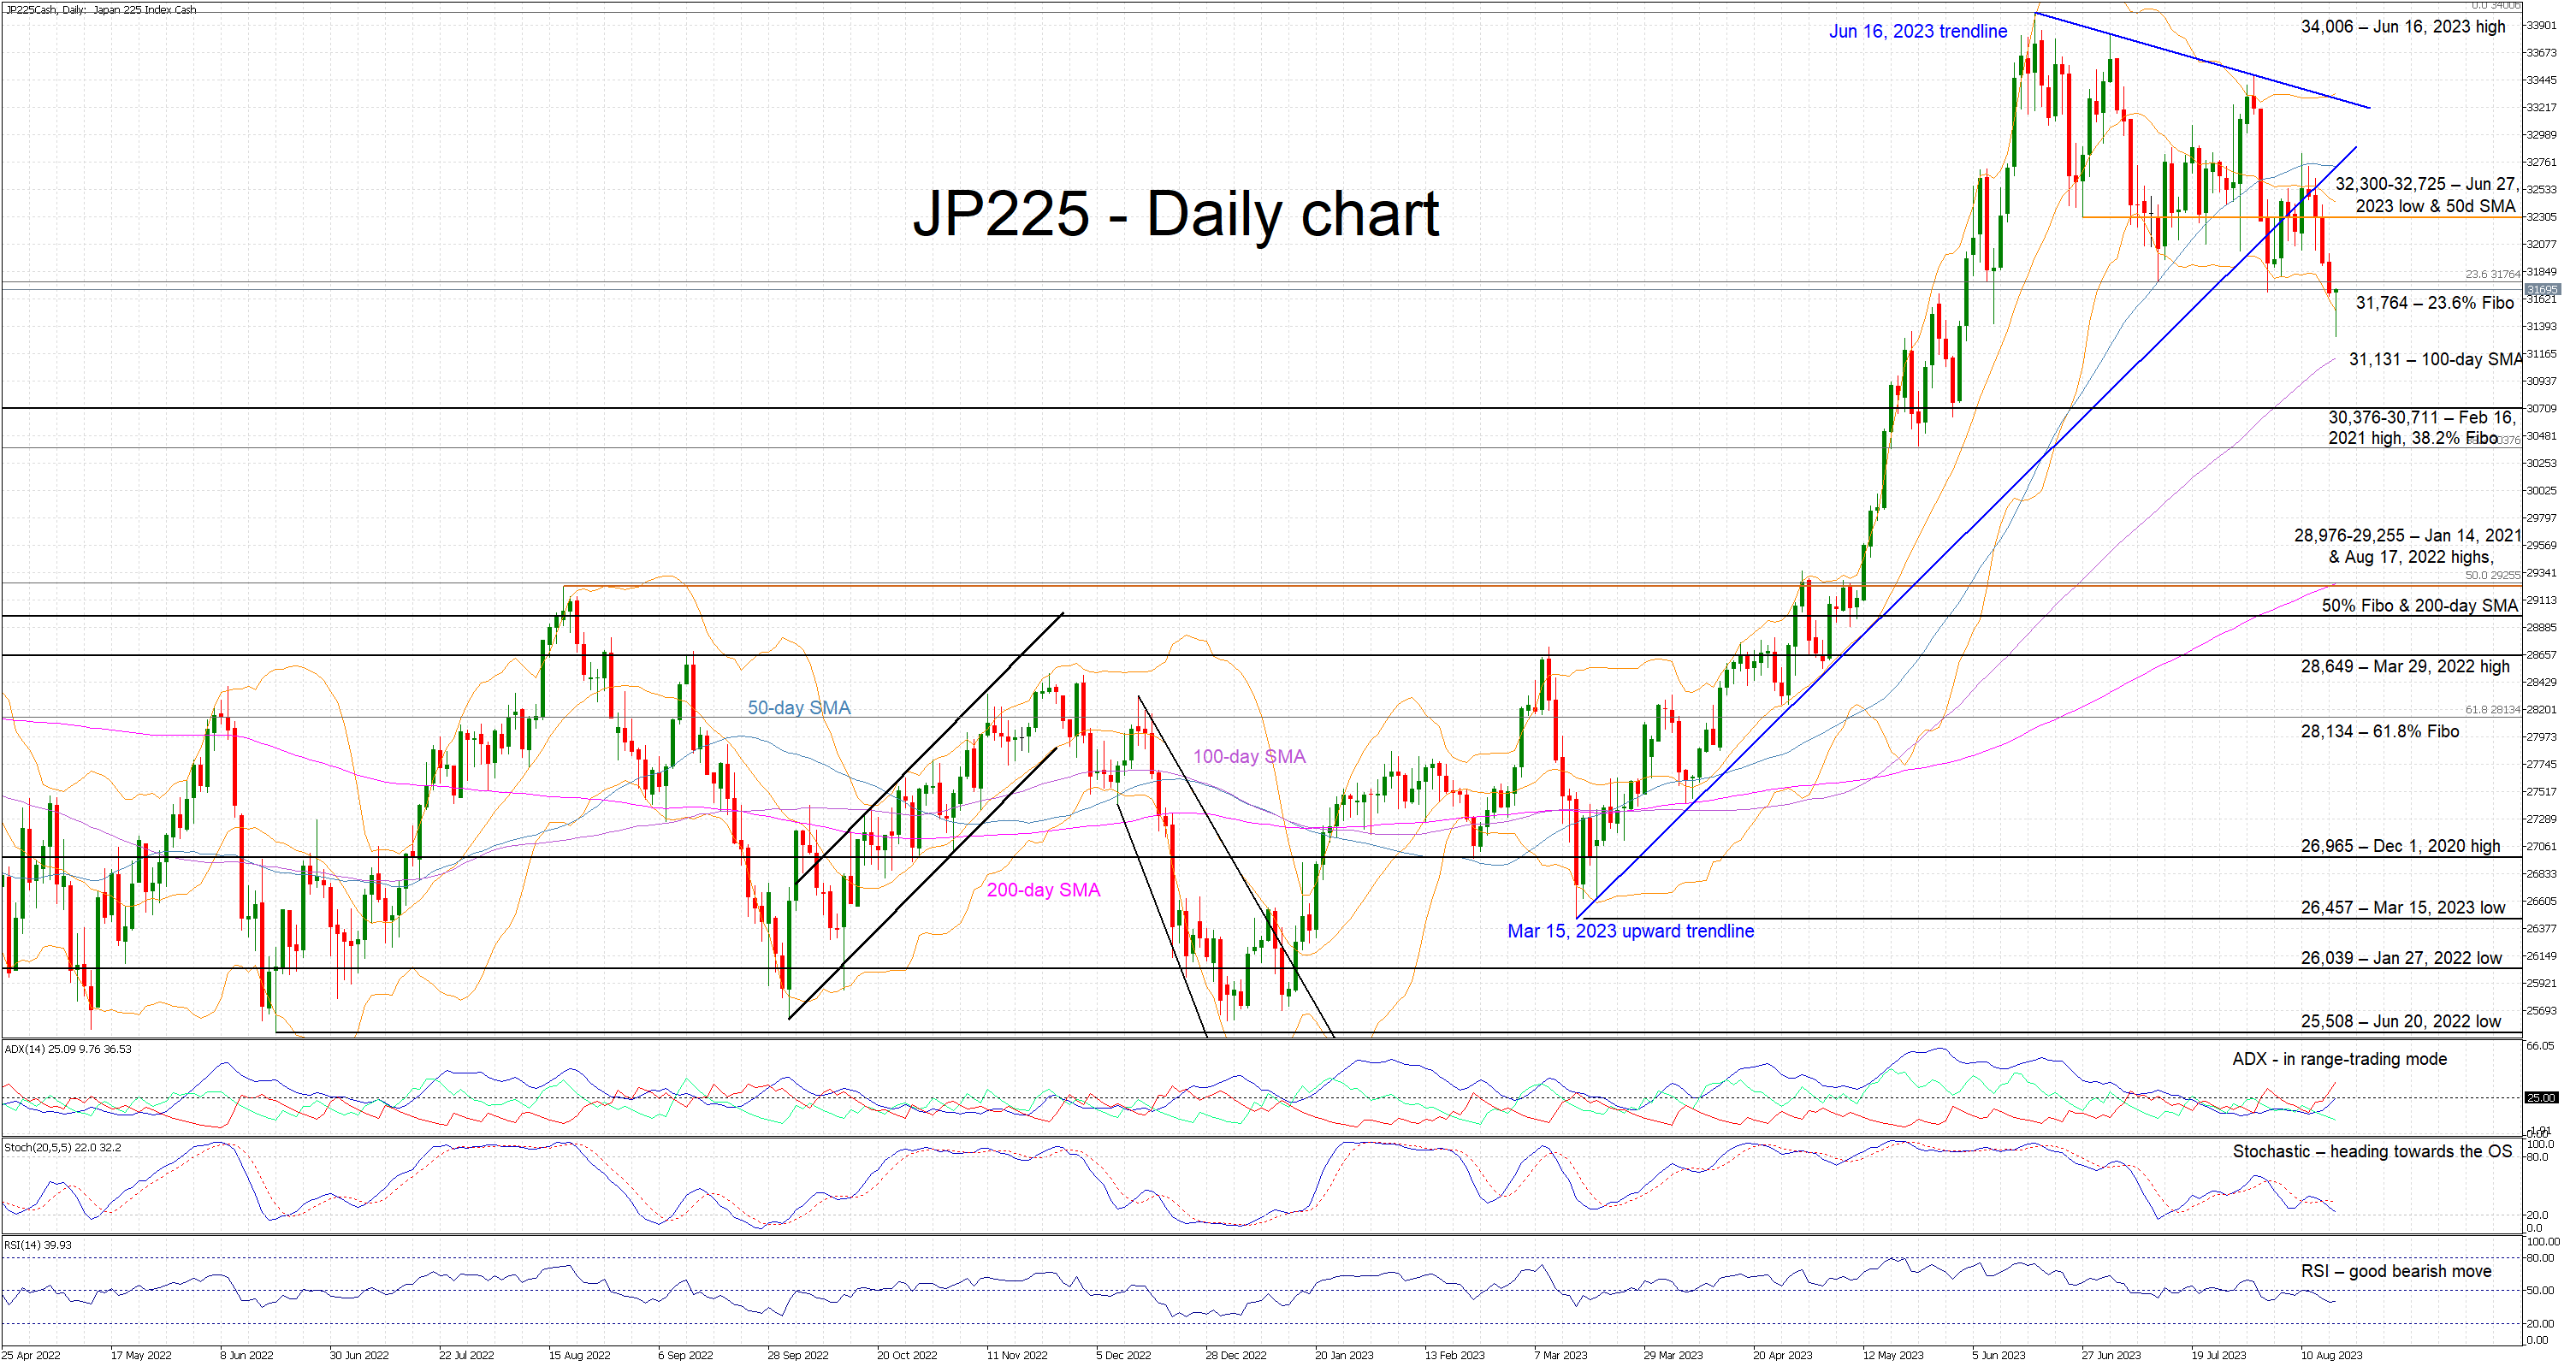
Following four red candles, the JP225 cash index is today recording an interesting candlestick called hammer that is usually interpreted as a bullish sign. The bulls would probably like to be given the chance for a rebound as the JP225 index has been on a downward trend since the June 16, 2023 high, and they are currently facing a bearish series of lower lows and lower highs. Therefore, a potential upleg needs to be sizeable to negate this structure and worry the bears.
In the meantime, the momentum indicators hesitantly support the bears’ intentions. The RSI has made a lower low, but it appears to be moving sideways now. The Average Directional Movement Index (ADX) has just surpassed its 25-threshold, signaling a muted bearish trend in the market. Interestingly, despite the recent downleg in JP225 index, the stochastic oscillator has failed to make a lower low, allowing the possibility for the formation of a bullish divergence. Its next move is crucial, especially if it finally decides to enter its oversold territory.
Should the bears remain committed in continuing their pullback, they would like to keep JP225 index below the 23.6% Fibonacci retracement level of the March 8, 2022 – June 16, 2023 uptrend at 31,764, and then have a go at the 100-day simple moving average (SMA) at 31,131. They could then set their eyes on the 30,376-30,711 area. This range is populated by the February 16, 2021 high and the 38.2% Fibonacci retracement, and breaking it would be key from a momentum perspective.
On the other hand, the bulls are trying to stage a recovery. The various bullish signs should energize them into pushing JP225 index above the 31,764 level and then target the 32,300-32,725 range, defined by the June 27, 2023 low and the 50-day SMA. Higher, the March 15, 2023 trendline could be the next key resistance area.
To sum up, the JP225 index bulls appear willing to take over the market reins but they need more bullish signs and a strong signal from the momentum indicators, which remain on the bears’ side.