Sample Category Title
WTI Oil Dips Again as Sellers Take Control
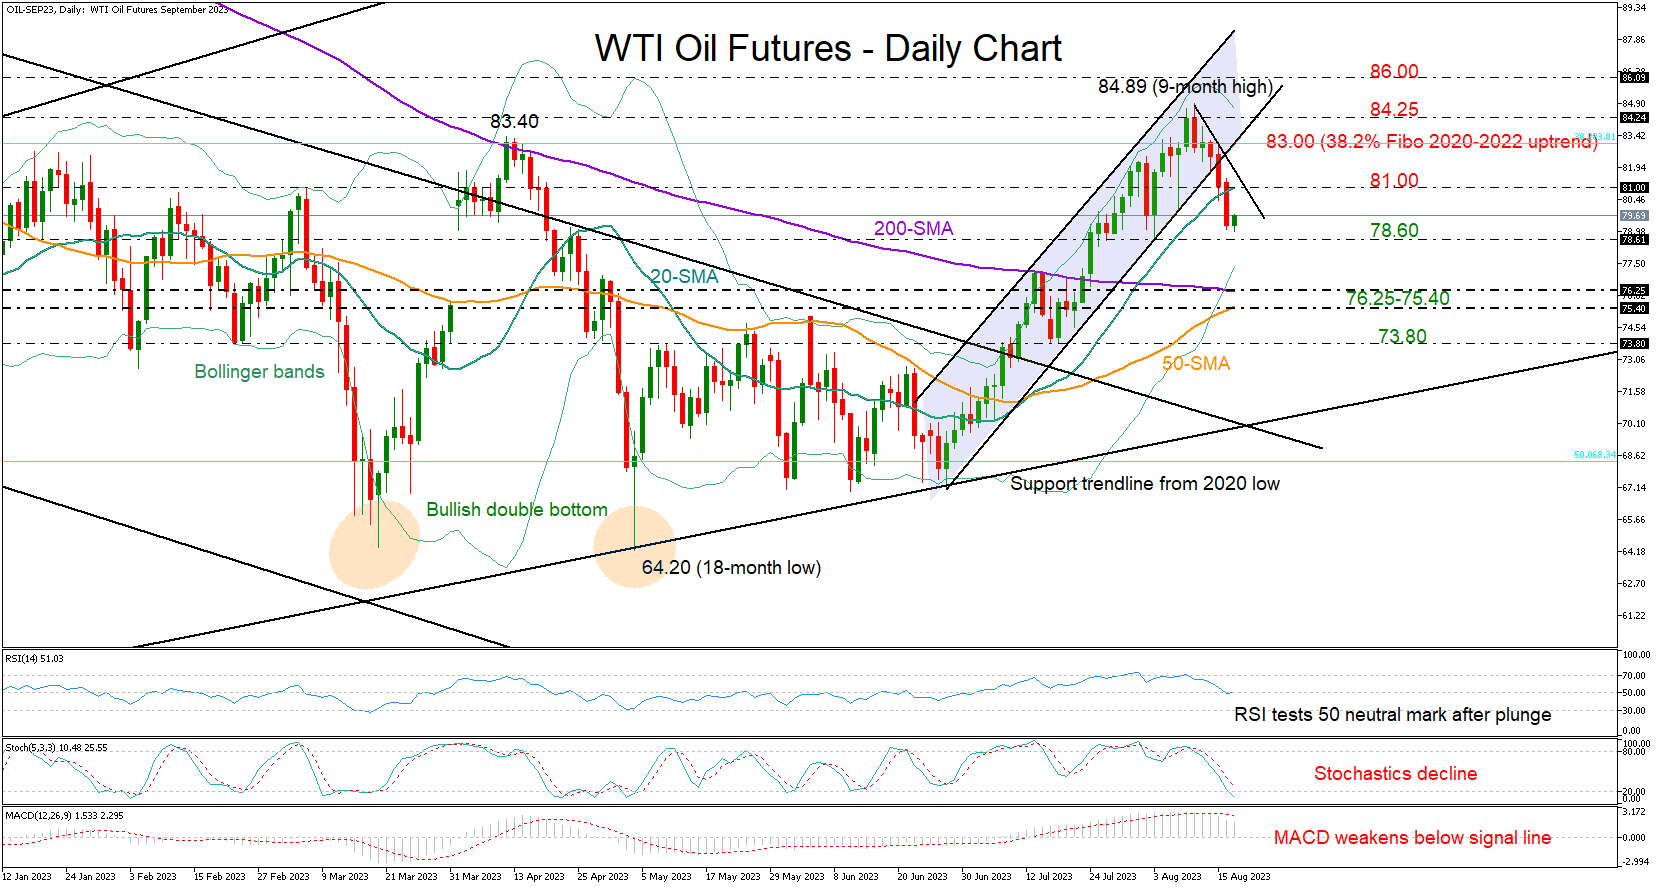
WTI oil futures got hammered after the peak at a nine-month high of 84.89, breaking out of the tight bearish channel that had been navigating the market over the past two months.
The price has re-entered the broad neutral area below 83.40, closing significantly below the 20-day simple moving average (SMA) and the 80.00 round level on Wednesday. The latter is a negative warning that the sell-off could gain extra impetus and the technical indicators are in line with this narrative. The MACD is decelerating below its red signal line, while the RSI is set to cross below its 50 neutral mark. Meanwhile, the stochastic oscillator hasn't bottomed out yet, and the price itself is still above the lower Bollinger band, meaning sellers may still be in control for a while.
Should the bears snap the nearby floor of 78.60 too, the price could next seek shelter somewhere between the 200- and 50-day SMAs at 76.25 and 75.40 respectively. A step lower could halt near the 73.80 constraining zone, where the price rotated northwards in mid-July.
In the event of an upside reversal, traders will look for a close above the 20-day SMA at 81.00 before they target again the former resistance of 83.00-83.40. Then, an extension above last week’s bar of 84.25 could lift the price up to 86.00 last seen during August-November 2022.
Encouragingly, the 50-day SMA has reduced its gap with the 200-day SMA. Hence, it would be interesting to see if the lines will manage to post a bullish cross in the weeks ahead. If a bullish cross were to happen, the latest upleg could regain some trust.
Summing up, the short-term bias has switched back to bearish in the WTI crude market, with selling pressures expected to intensify again below 78.60.
JP225 Cash Index Bulls Reappear in the Market
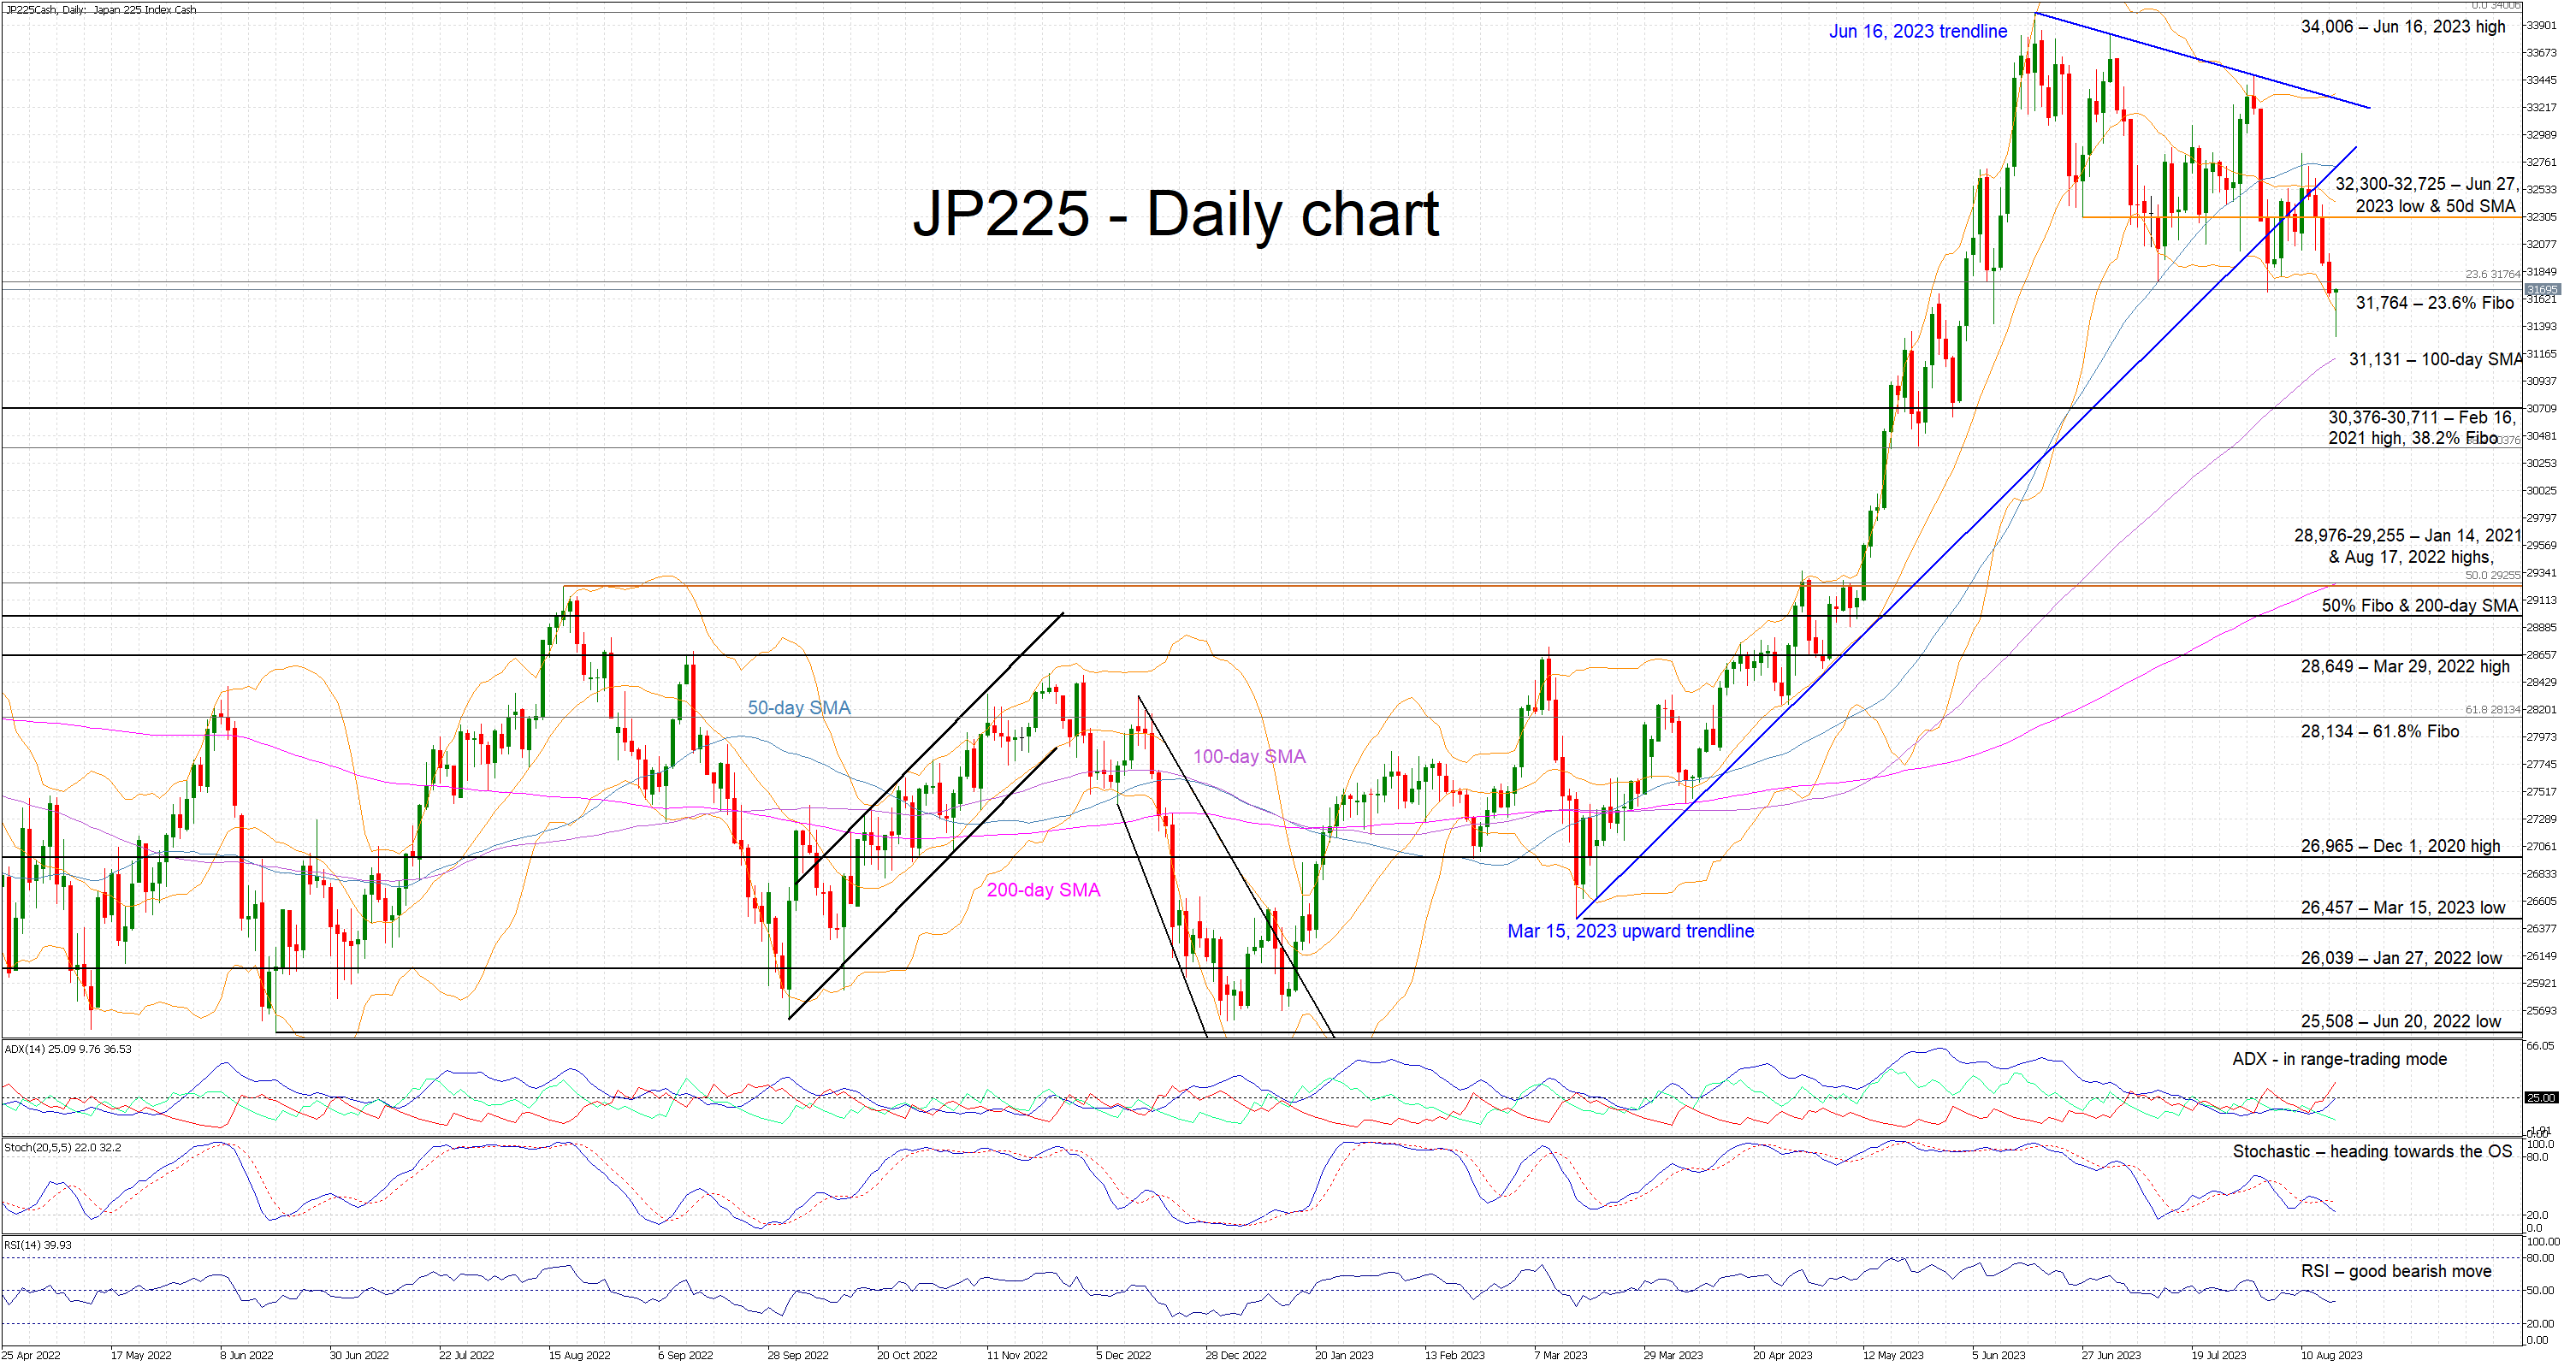
Following four red candles, the JP225 cash index is today recording an interesting candlestick called hammer that is usually interpreted as a bullish sign. The bulls would probably like to be given the chance for a rebound as the JP225 index has been on a downward trend since the June 16, 2023 high, and they are currently facing a bearish series of lower lows and lower highs. Therefore, a potential upleg needs to be sizeable to negate this structure and worry the bears.
In the meantime, the momentum indicators hesitantly support the bears’ intentions. The RSI has made a lower low, but it appears to be moving sideways now. The Average Directional Movement Index (ADX) has just surpassed its 25-threshold, signaling a muted bearish trend in the market. Interestingly, despite the recent downleg in JP225 index, the stochastic oscillator has failed to make a lower low, allowing the possibility for the formation of a bullish divergence. Its next move is crucial, especially if it finally decides to enter its oversold territory.
Should the bears remain committed in continuing their pullback, they would like to keep JP225 index below the 23.6% Fibonacci retracement level of the March 8, 2022 – June 16, 2023 uptrend at 31,764, and then have a go at the 100-day simple moving average (SMA) at 31,131. They could then set their eyes on the 30,376-30,711 area. This range is populated by the February 16, 2021 high and the 38.2% Fibonacci retracement, and breaking it would be key from a momentum perspective.
On the other hand, the bulls are trying to stage a recovery. The various bullish signs should energize them into pushing JP225 index above the 31,764 level and then target the 32,300-32,725 range, defined by the June 27, 2023 low and the 50-day SMA. Higher, the March 15, 2023 trendline could be the next key resistance area.
To sum up, the JP225 index bulls appear willing to take over the market reins but they need more bullish signs and a strong signal from the momentum indicators, which remain on the bears’ side.
GBP/JPY Daily Outlook
Daily Pivots: (S1) 185.24; (P) 185.80; (R1) 186.90; More...
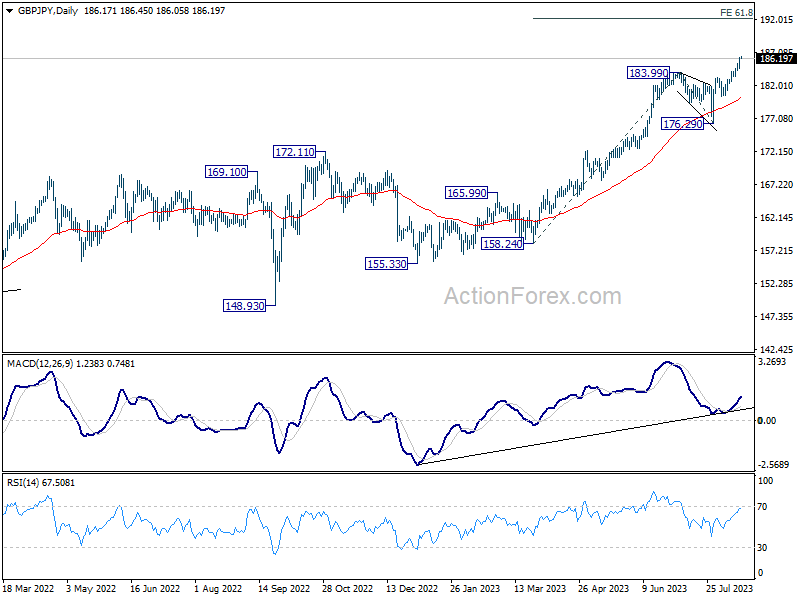
GBP/JPY's rally continues today and intraday bias stays on the upside. Current up trend should extend to 61.8% projection of 158.24 to 183.99 from 176.29 at 192.20. On the downside, below 184.67 minor support will turn intraday bias neutral and bring consolidations first, before staging another rally.
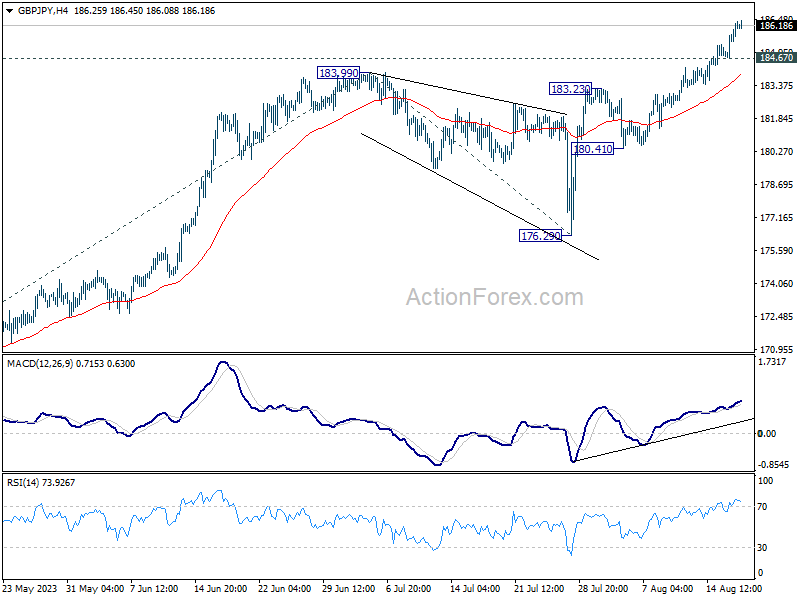
In the bigger picture, up trend from 123.94 (2020 low) is in progress. Next target is 195.86 (2015 high). This will now remain the favored case as long as 176.29 support holds, even in case of deeper pull back.
EUR/JPY Daily Outlook
Daily Pivots: (S1) 158.82; (P) 159.04; (R1) 159.44; More....
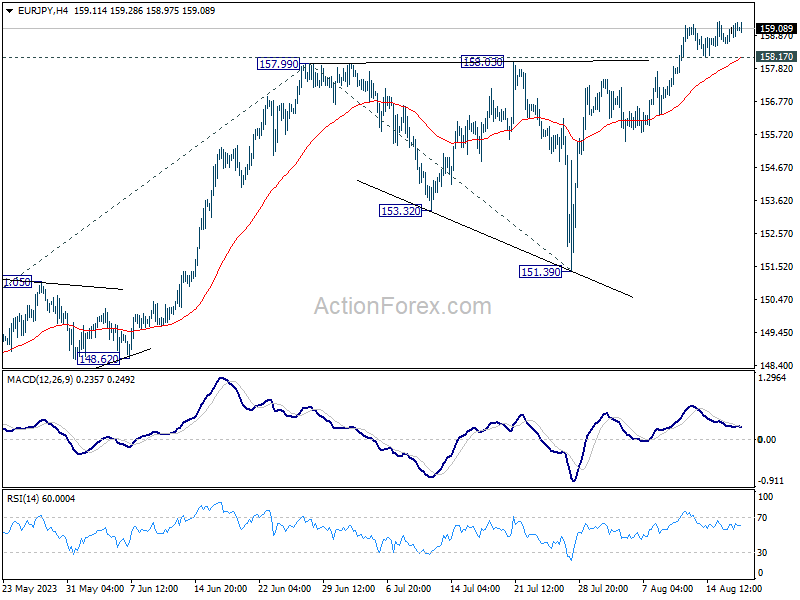
Intraday bias in EUR/JPY stays on the upside at this point. Current up trend should target 61.8% projection of 139.05 to 157.99 from 151.39 at 163.09 next. On the downside, below 158.17 minor support will turn bias neutral again and bring more consolidations.
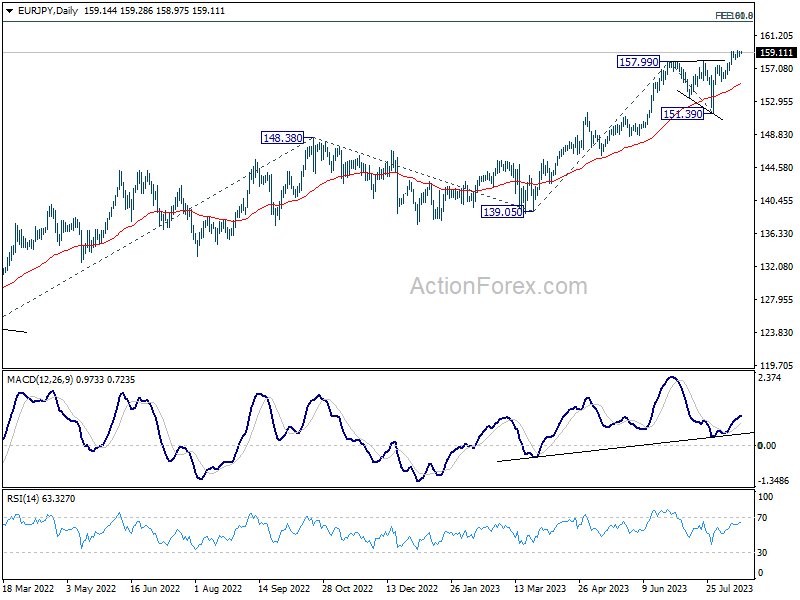
In the bigger picture, rise from 114.42 (2020 low) is in progress. Next target is 100% projection of 124.37 to 148.38 from 139.05 at 163.06. Sustained break there will pave the way to retest long term resistance at 169.96. This will now remain the favored case as long as 151.39 support holds, even in case of deep pull back.
EUR/GBP Daily Outlook
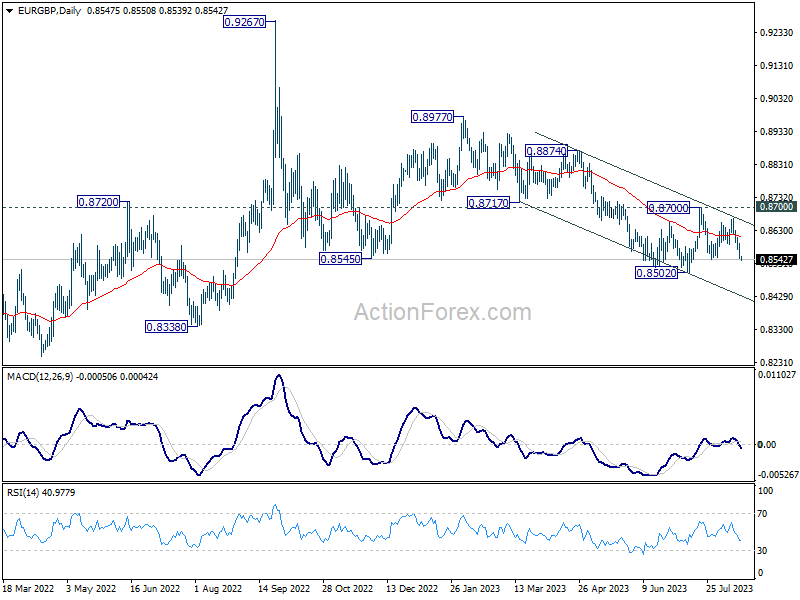
Daily Pivots: (S1) 0.8528; (P) 0.8561; (R1) 0.8577; More...
With break of 0.8543 support, intraday bias in EUR/GBP is back on the downside for retesting 0.8502 low. Decisive break there will resume larger decline from 0.8977. On the upside, above 0.8592 minor resistance will mix up the outlook and extend sideway trading.
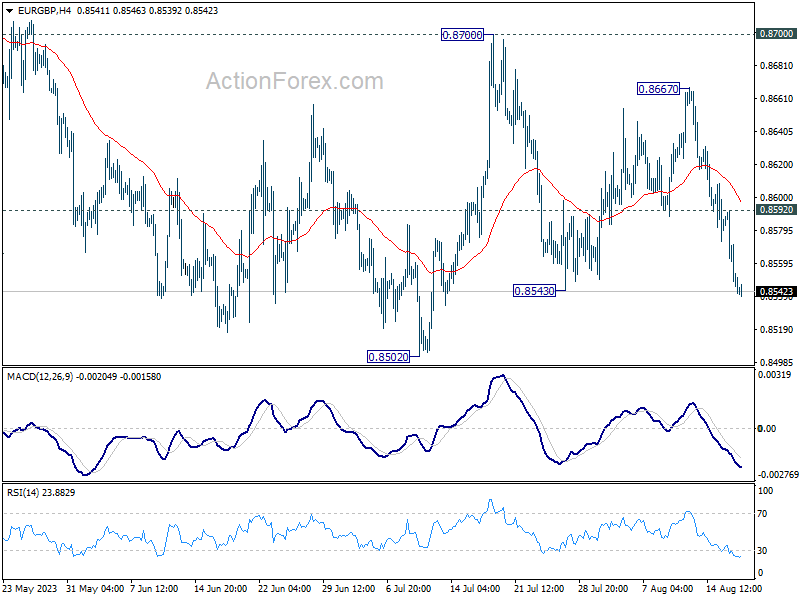
In the bigger picture, the down trend from 0.9267 (2022 high) is seen as part of the long term range pattern from 0.9499 (2020 high). Firm break of 0.8717 support turned resistance will argue that it has completed with three waves down to 0.8502. Further break of 0.8977 will bring retest of 0.9267 high. Nevertheless, rejection by 0.8717, followed by break of 0.8502 will resume the decline towards 0.8201 (2022 low).
EUR/AUD Daily Outlook
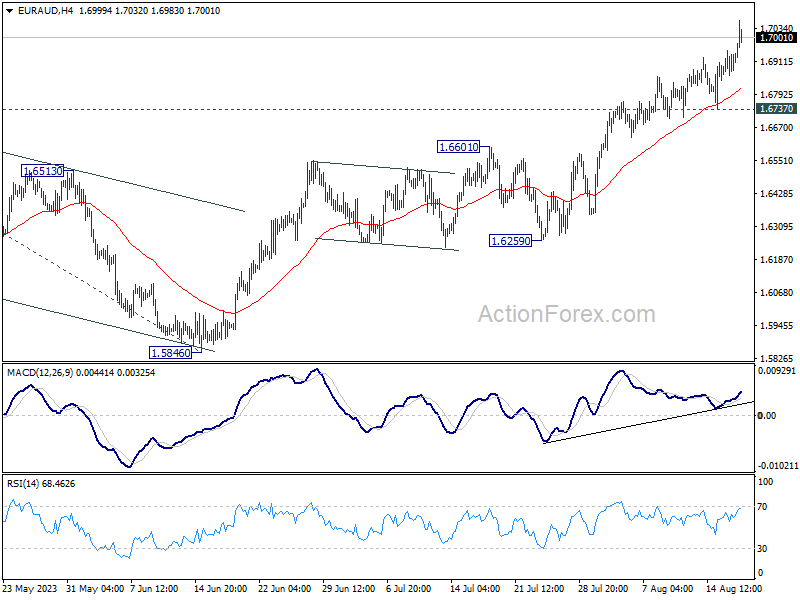
Daily Pivots: (S1) 1.6881; (P) 1.6919; (R1) 1.6972; More...
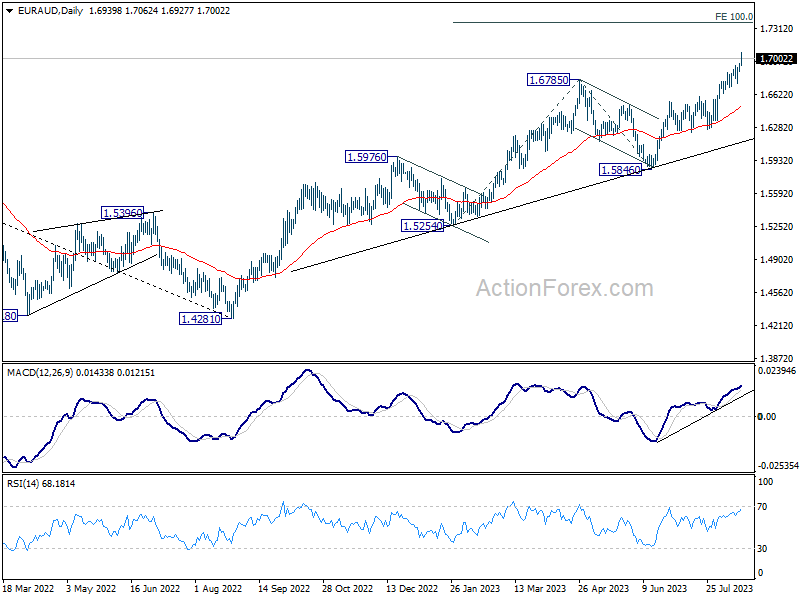
EUR/AUD's rally continues and intraday bias stays on the upside. Current rally is part of the up trend from 1.4281. Next target is 1.7377 projection level next. On the downside, break 1.6737 support is needed to indicate short term topping. Otherwise, outlook will stay bullish in case of retreat.
In the bigger picture, the rise from 1.4281 (2022 low) is in progress. Next target is 100% projection of 1.5254 to 1.6785 from 1.5846 at 1.7377. For now, outlook will stay bullish as long as 1.5846 support holds, even in case of another pull back.
EUR/CHF Daily Outlook
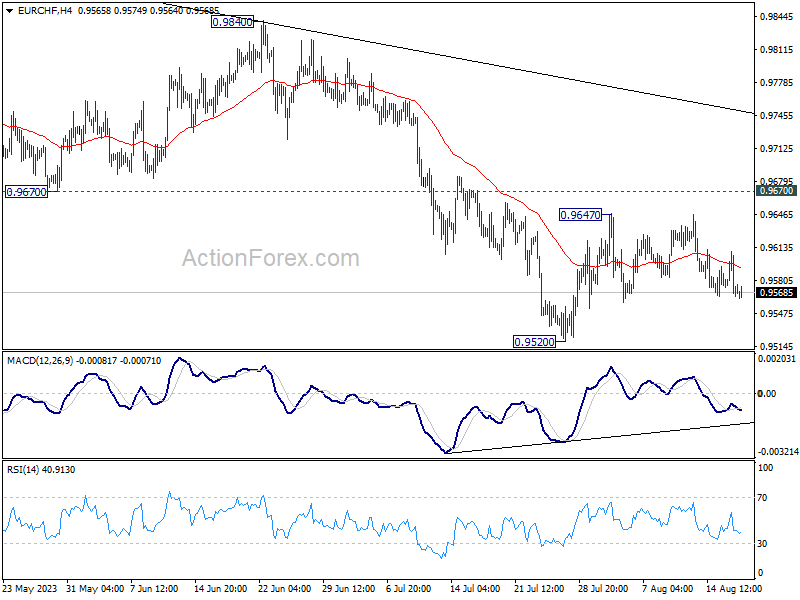
Daily Pivots: (S1) 0.9556; (P) 0.9584; (R1) 0.9601; More...
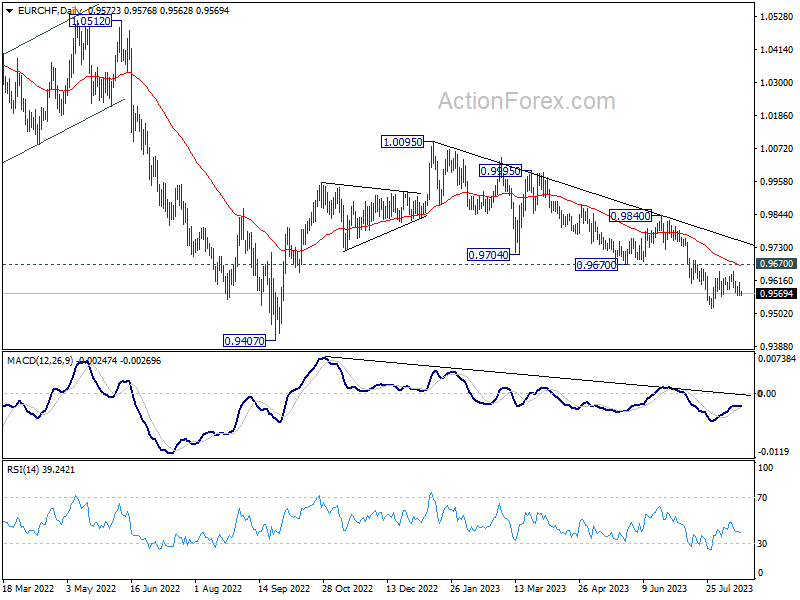
Intraday bias in EUR/CHF remains neutral as range trading continues. On the upside, break of 0.9647 will resume the rebound from 0.9520. Further sustained break of 0.9670 will be the first sign of bullish reversal and target 0.9840 resistance for confirmation. On the downside, break of 0.9520 will resume the whole fall from 1.0095 towards 0.9407 low.
In the bigger picture, medium term outlook is staying bearish as the pair is capped well below falling 55 W EMA (now at 0.9859). Down trend from 1.2004 (2018 high) is in favor to continue. Sustained break of 0.9407 will target 61.8% projection of 1.1149 to 0.9407 from 1.0095 at 0.9018. For now, this will remain the favored case as long as 0.9840 resistance holds, in case of strong rebound.
EUR/USD Daily Outlook
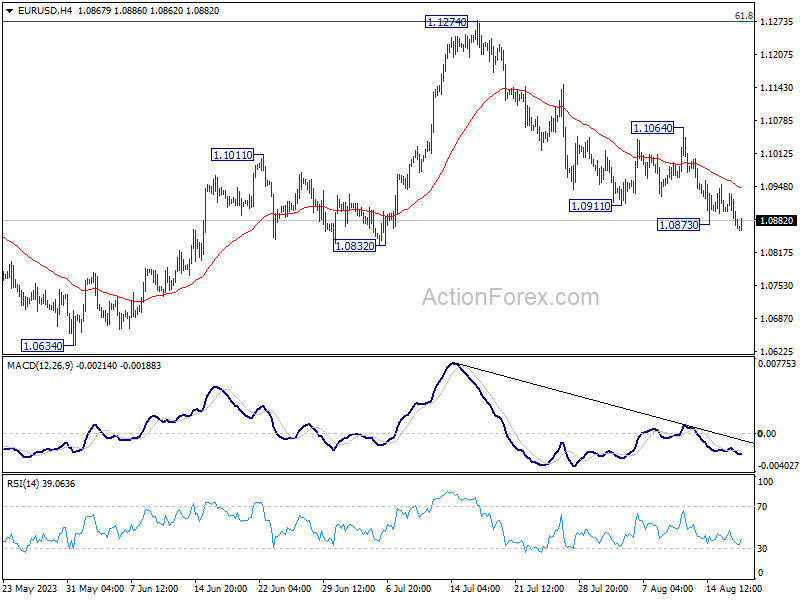
Daily Pivots: (S1) 1.0856; (P) 1.0895; (R1) 1.0919; More...
Intraday bias in EUR/USD is back on the downside, as fall from 1.1274 resumed by breaking 1.0873 temporary low. Deep Decisive break of 1.0832 will target 1.0609/34 cluster support. Near term outlook will stay cautiously bearish as long as 1.1064 resistance holds, in case of recovery.
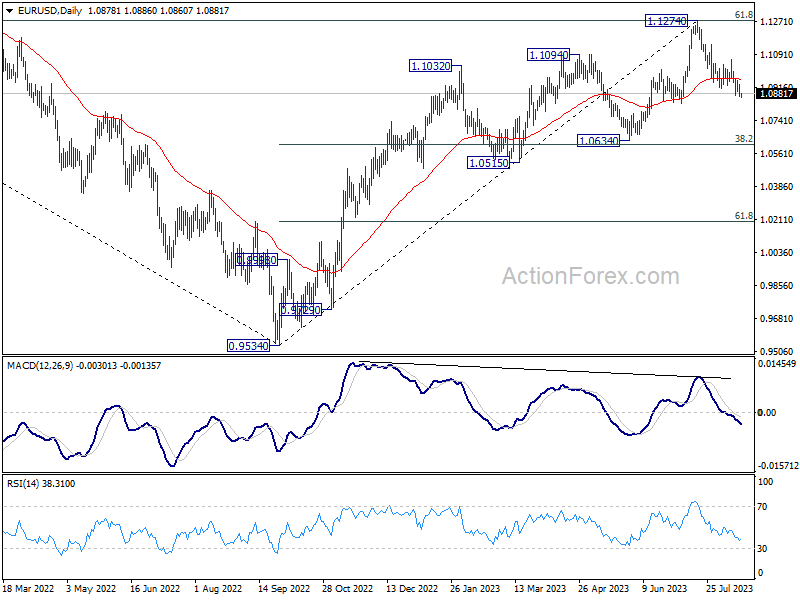
In the bigger picture, a medium term top could be formed at 1.1274, after failing to break through 61.8% retracement of 1.2348 (2021 high) to 0.9534 at 1.1273 decisively, on bearish divergence condition in D MACD. Sustained trading below 55 D EMA (now at 1.0966) will bring deeper correction to 1.0634 cluster support (38.2% retracement of 0.9534 to 1.1274 at 1.0609). Strong support could be seen there, at least on first attempt, to set the range for consolidation.
GBP/USD Daily Outlook
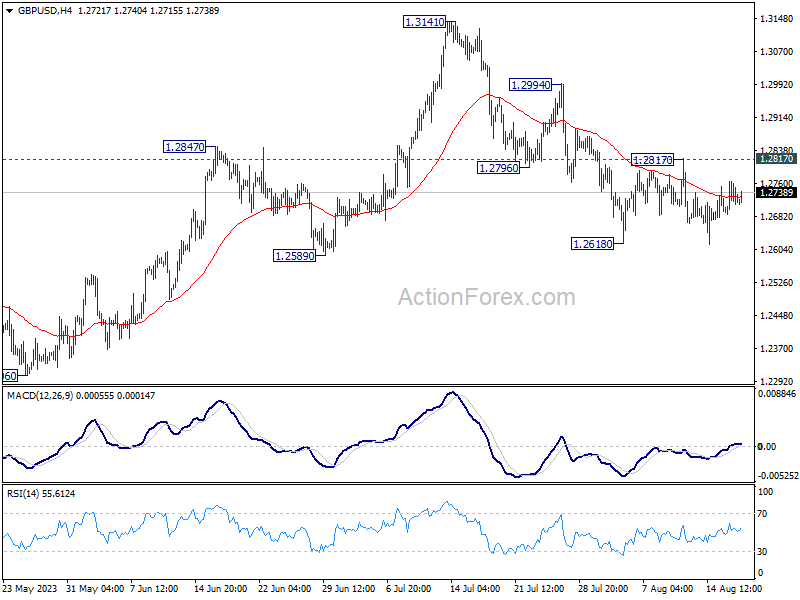
Daily Pivots: (S1) 1.2690; (P) 1.2729; (R1) 1.2770; More...
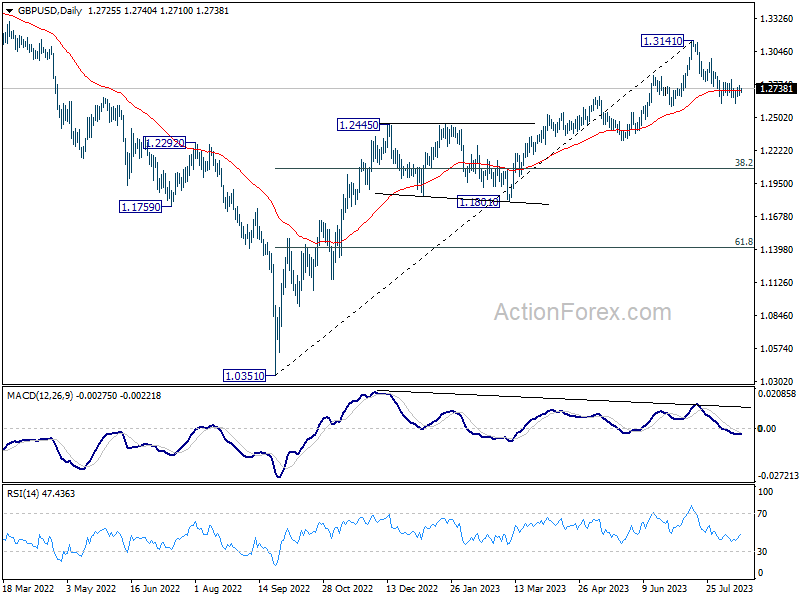
Intraday bias in GBP/USD remains neutral for sideway trading. On the downside, firm break of 1.2618, and sustained trading below 1.2678 resistance turned support will argue that it's already in a larger correction. Deeper decline would then be seen to 1.2306 support next. Nevertheless, break of 1.2817 minor resistance will indicate that the pull back has completed, and turn bias back to the upside for stronger rebound.
In the bigger picture, a medium term top could be in place at 1.3141 already, on bearish divergence condition in D MACD. Sustained trading below 55 D EMA (now at 1.2723) should confirm this case, and bring deeper fall to 38.2% retracement of 1.0351 to 1.3141 at 1.2075, as a correction to up trend from 1.0351 (2022 low). For now, rise will stay mildly on the downside as long as 1.3141 resistance holds, in case of strong rebound.
USD/CHF Daily Outlook
Daily Pivots: (S1) 0.8779; (P) 0.8796; (R1) 0.8818; More....
Intraday bias in USD/CHF stays neutral as range trading continues. On the upside, sustained trading above 0.8818 support turned resistance will carry larger bullish implication. Further rally should then be seen to 0.9146 cluster resistance next. However, break of 0.8688 support will indicate rejection by 0.8818, and turn bias back to the downside for retesting 0.8551 low.
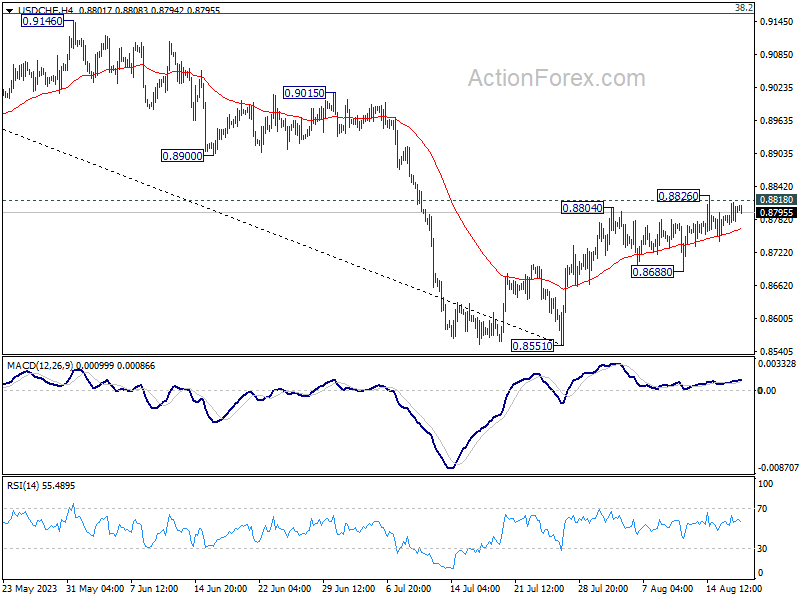
In the bigger picture, a medium term bottom could be in place at 0.8551 already, on bullish convergence condition in D MACD. Sustained trading above 0.8818 will bring further rise to 0.9146 cluster resistance (38.2% retracement of 1.0146 to 0.8551 at 0.9160), even as a correction. Nevertheless, break of 0.8851 will resume the down trend from 1.0146 instead.