

Sample Category Title
USD/JPY Daily Outlook
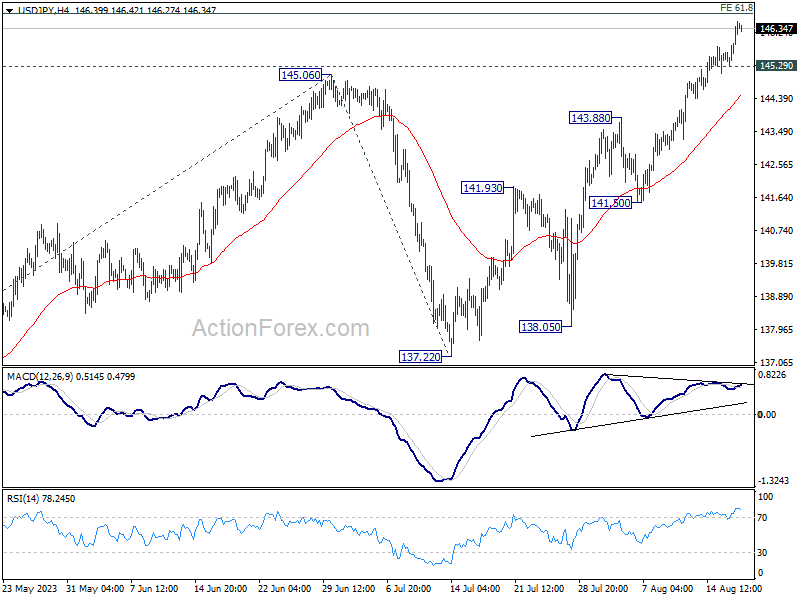
Daily Pivots: (S1) 145.64; (P) 146.02; (R1) 146.74; More...
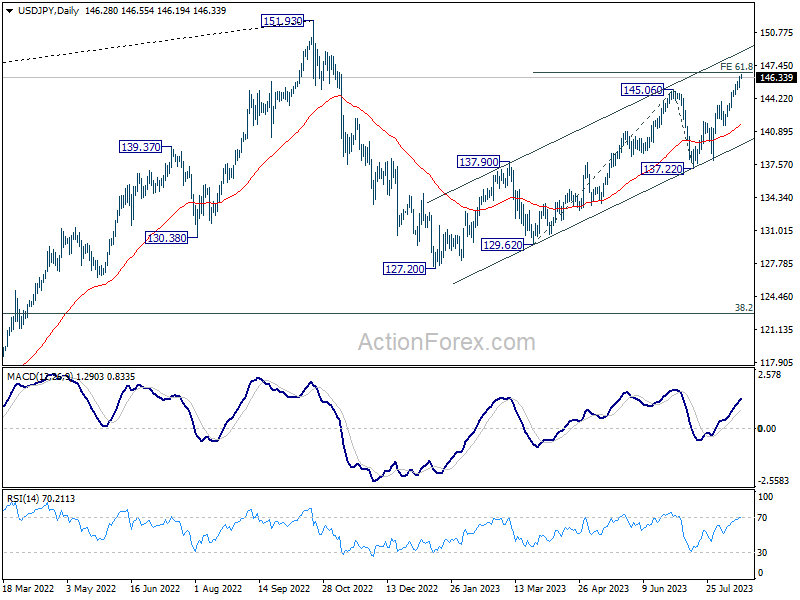
USD/JPY's rally continues today and intraday bias stays on the upside. Sustained break of 61.8% projection of 129.62 to 145.06 from 137.22 at 146.76 will pave the way to retest 151.93 high. On the downside, below 145.29 minor support will turn bias to the downside for deeper pull back.
In the bigger picture, overall price actions from 151.93 (2022 high) are views as a corrective pattern. Rise from 127.20 is seen as the second leg of the pattern and could still be in progress. But even in case of extended rise, strong resistance should be seen from 151.93 to limit upside. Meanwhile, break of 137.22 support should confirm the start of the third leg to 127.20 (2023 low) and below.
USD/CAD Daily Outlook
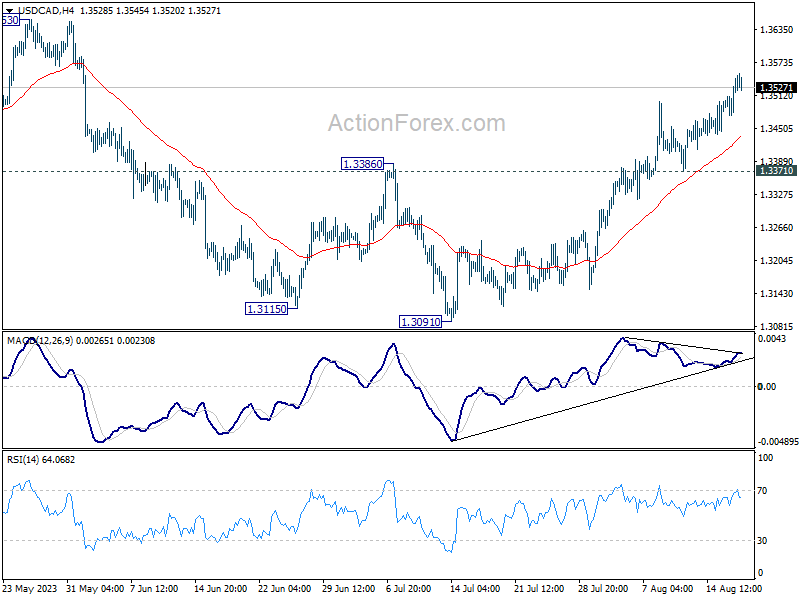
Daily Pivots: (S1) 1.3490; (P) 1.3518; (R1) 1.3559; More....
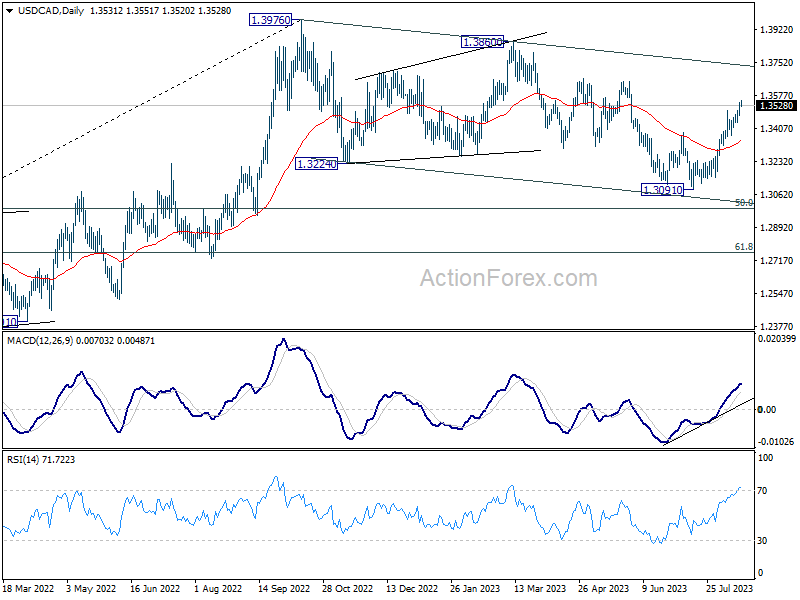
Intraday bias in USD/CAD stays on the upside for the moment. As noted before, corrective fall from 1.3976 should have completed with three waves down to 1.3091. Further rally would be seen to retest 1.3653 resistance next. Break there will further confirm this case and target 1.3976 high. For now, further rally is expected as long as 1.3371 support holds, in case of retreat.
In the bigger picture, price actions from 1.3976 are viewed as a corrective fall only. Upon completion, rise from 1.2005 (2021 low) would resume through 1.3976 towards 1.4667/89 long term resistance zone. In case of another fall, downside should be contained by 61.8% retracement of 1.2005 to 1.3976 at 1.2758.
USD/JPY Technical: Bullish Tone Resumes, 148.20/85 Next Resistance to Watch
- USD/JPY cleared above 145.50/146.10 resistance that confluences with BoJ’s FX intervention conducted on 22 September last year.
- Primary driver of USD/JPY rallies has been a weak Chinese yuan and rising sovereign yield premium of the 10-year US Treasury over the 10-year JGB.
- The next medium-term resistance to watch will be at 148.20/85 on the USD/JPY.
The USD/JPY has moved up relentlessly and cleared above 145.50/146.10 resistance that coincided with Bank of Japan (BoJ) FX intervention on 22 September last year to negate the JPY weakness seen in the prior major uptrend phase from the January 2021 low to Oct 2022 high, its first market intervention since 1998. It closed higher yesterday, 16 August at 146.36, near its intraday high of 146.41 printed in the US session.
So far, it has rallied by 850 pips from its 28 July 2023 low of 138.06, ex-post BoJ newly enacted flexible yield curve control programme on the 10-year Japanese Government Bond (JGB) and ignored the concerns of another round of FX intervention from BoJ.
Medium-term uptrend supported by sovereign yield premium
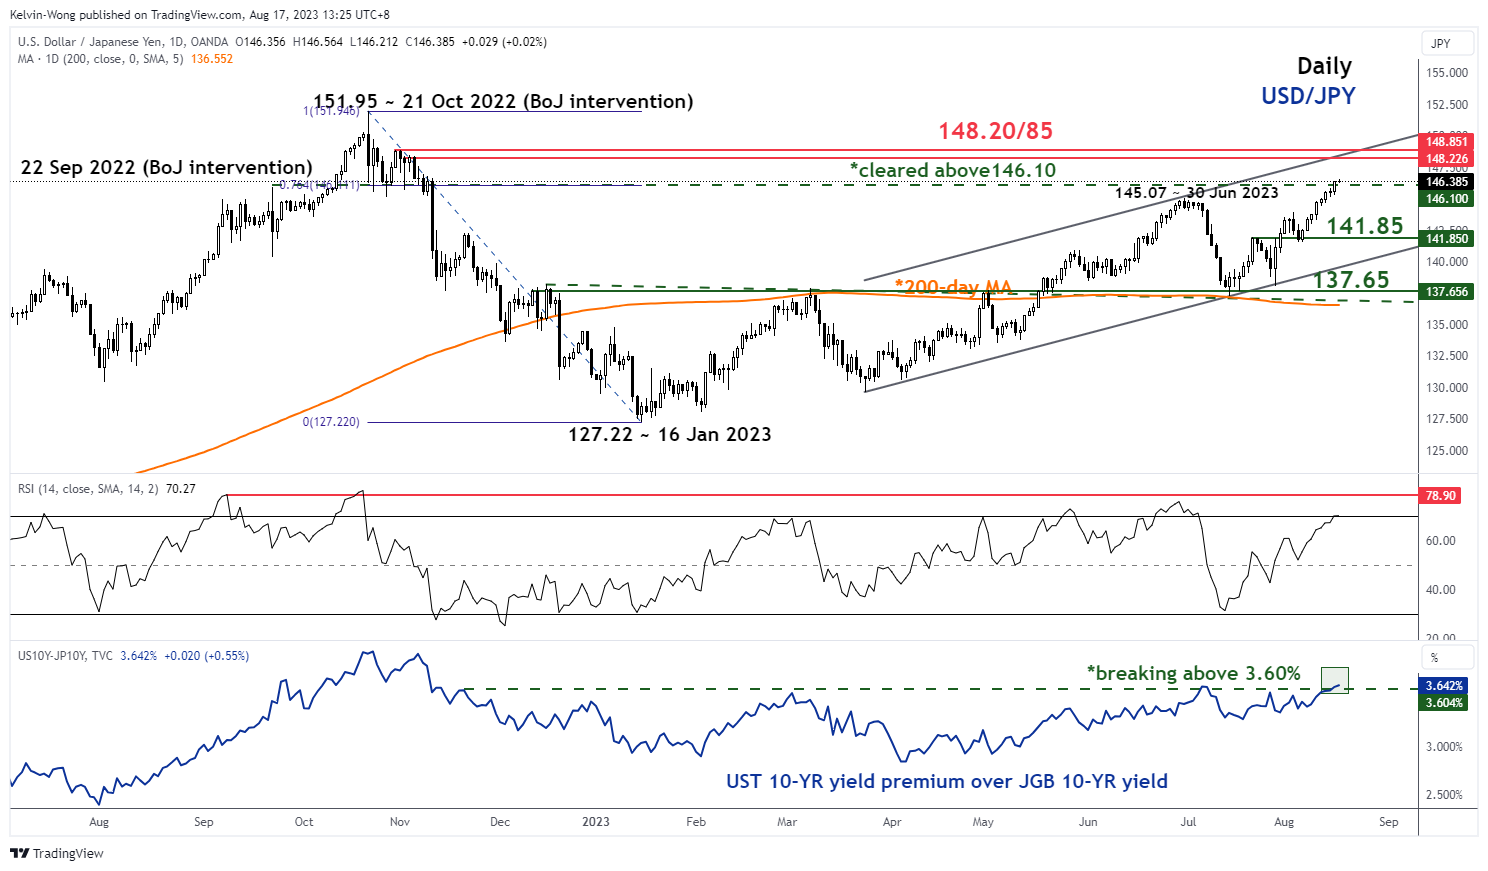
Fig 1: USD/JPY medium-term trend as of 17 Aug 2023 (Source: TradingView, click to enlarge chart)
The primary driver of this recent bout of USD/JPY’s sharp rallies seen in the past two weeks has been the steep sell-off inflicted on the offshore Chinese yuan (CNH) and the widening sovereign yield premium of the 10-year US Treasury note over the 10-year JGB, the yield spread has just broken above a key medium-term resistance of 3.60%.
Oscillating within a minor ascending channel since 7 August 2023 low
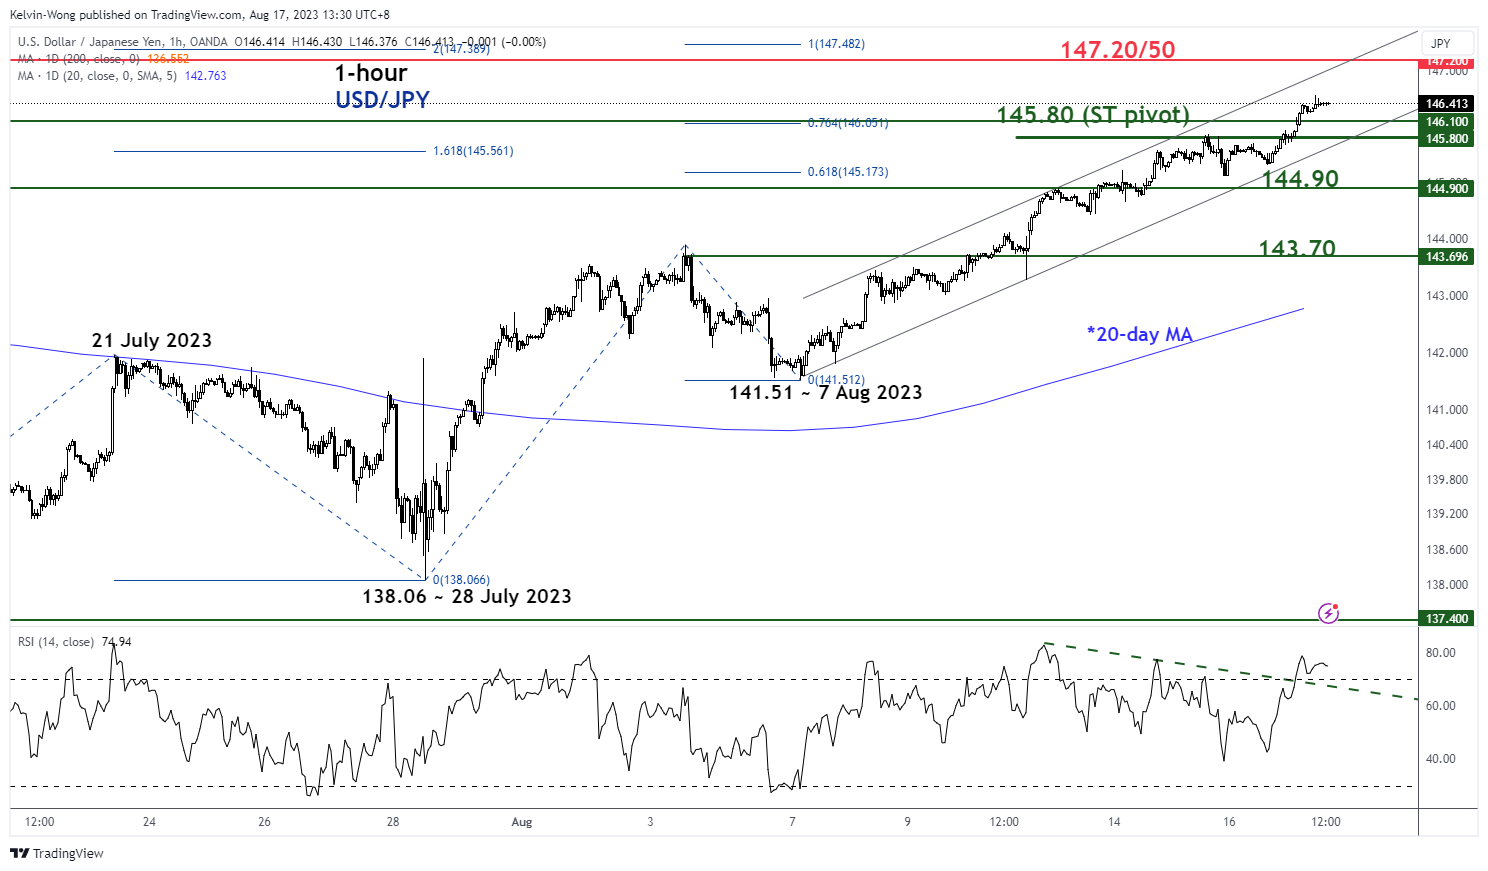
Fig 2: USD/JPY minor short-term trend as of 17 Aug 2023 (Source: TradingView, click to enlarge chart)
In the shorter term, watch the 145.80 key short-term pivotal support to maintain the current bullish tone to see the next resistance coming at 147.20/50 in the first step.
On the flip side, a break below 145.80 may jeopardize the bulls to expose the next supports at 144.90 and 143.70 (also close to the 20-day moving average).
Aussie Dollar Continues to Trade on Weak Side Against Strong USD
Markets
July FOMC Minutes showed that thinking within the Federal Reserve didn’t change compared to their June gathering which included updated growth/inflation forecasts and a dot plot. Two Fed officials favoured leaving rates unchanged instead of hiking by 25 bps; a preference already visible in June. “A number of participants judged that, with the stance of monetary policy in restrictive territory, risks to the achievement of the committee’s goals had become more two-sided, and it was important that the committee’s decisions balance the risk of an inadvertent overtightening of policy against the cost of an insufficient tightening”. Again, referring to June, this “number of participants” are probably the 4 governors which pencilled in a final rate hike delivered in July. “Most participants continued to see significant upside risks to inflation, which could require further tightening of monetary policy”. This is the group op 12 Fed governors which in June hinted at at least another two policy rate hikes (1 going forward). We remain flabbergasted by the fact that US money markets only attach a 1/3 probability for a final Fed rate hike by November despite this clear Fed guidance. The disinflation process runs as expected while US growth outperforms expectations, significantly reducing the 2023 recession probability. Next week’s Jackson Hole symposium offers an opportunity to dot the I’s and cross the t’s on this divergence.
US Treasuries remain in sell-off mode. Ahead of FOMC Minutes, markets digested decent eco data (housing market & industrial production). Technical elements are at play as well with the US 10-yr yield breaking the YTD high at 4.2% and pushing for a test of the 2022 high at 4.34%. Interestingly, the move is driven by higher US real yields. The US 10y real yield moved above 1.9% for the first time since 2009. We think that it’s both an indication of improved growth prospects, a return of US credit risk premia, a recognition of a higher future US neutral rate and embracing the higher for even longer scenario. Daily US yield changes yesterday varied between +1.2 bps (2-yr) and +3.9 bps (7- yr). The US 2-yr yield is pushing to move above 5% with the cycle high at 5.12% being next resistance. The US dollar holds its momentum though gains might have been bigger given the real interest rate support. EUR/USD closed at 1.0879 from an open at 1.0905. A test of the July low at 1.0834 is imminent. The Japanese yen remains on the weak side (USD/JPY > 146) following last week’s rise in core yields. Back in September, the Japanese Ministry of Finance did its first FX interventions since 1998 at the current spot rate. They later stepped it up as USD/JPY briefly passed 150 in October. We expect ruling trends – core bond weakness & dollar strength – to persist short term with today’s soft eco calendar (US weekly claims & Philly Fed index) not\interfering.Sterling yesterday outperformed the single currency on higher than expected July core CPI figures with EUR/GBP sliding to 0.8504 support.
News and views
Australian July payrolls disappointed with employment dropping by 14 600 people while consensus expected an increase by around the same amount. Details showed full time occupations falling by 24 200 with a 9 600 gain in part time employment softening the blow. The unemployment rate increased by 0.2 percentage points to 3.7% with the participation rate decreasing 0.1 ppt to 66.7%. Both indicators remain near their historically best levels, suggesting an ongoing tight labour market. The head of labour statistics at the Australian Bureau of Statistics downplayed the job losses by pointing to the average monthly employment increase of +42 000 in the first half of the year with employment also being 387 000 higher compared with last July. On top, July includes the school holidays which often shows job changes around when people take their leave and start of leave a job. Monthly hours worked increased 0.2% in July and are 5.2% higher than in July of last year suggesting that the demand for labour is partially met by people working more hours. In a separate report, the ABS said that average weekly earnings rose by 3.9% on an annual basis in May, which is the strongest annual growth since May 2013 apart from a brief spike early in the pandemic. Australian swap rates follow the global move this morning, rising by 4.1 bps (2-yr) to 8.8 bps (30- yr). The Aussie dollar continues to trade on the weak side against a strong USD with AUD/USD falling below the 0.64 big figure for the first time since November last year. The 2022 low at AUD/USD 0.6170 is key support.
Significant Upside Risks to Inflation
FOMC minutes released yesterday showed that most Federal Reserve (Fed) officials see ‘significant upside risks to inflation that may require more tightening’. Policymakers cited a range of scenarios that included the rising commodity prices that could lead to ‘more persistent elevated inflation’. Two of them favoured halting rate hikes, but the minutes showed no official dissenters. The Fed economists also expect a small rise (only) in jobless rate in the US, but they warned that commercial real estate fundamentals could worsen.
The regional banks are under a rising pressure, as a Fitch analyst warned that dozens of US bank credit ratings are at risk – just a week after the rating agency downgraded the US’ credit rating, and Moody’s downgraded 10 US small and mid-sized banks.
The US 2-year yield remained little changed at around the 5% mark, while the 10-year flirts with the 4.30% level, approaching last October’s peak, raising questions among investors on whether levels above 4% are a good entre point in the US 10-year papers, or could it go higher? Looking at the net speculative positions, the rising US treasury yields attract investors. Asset managers’ combined treasury positions hit a record in August, but that also means that these positions could be unwound and give way to a deeper selloff. The conclusion is, even though the actual levels look appetizing for US long-dated papers – especially with the Fed’s nearing the end of its tightening cycle and trouble brewing in China. risks prevail. Activity on Fed funds futures gives less than 15% chance for a September rate hike in the wake of the latest FOMC minutes. That’s slightly higher than around 10% assessed to a 25bp hike before the release of the minutes yesterday. But the pricing for a potential 25bp and even 50bp hike in November meeting are in play.
The US dollar extends gains, and the dollar index is now marching above its 200-DMA, into the overbought market territory, with little reason for investors to step back given the Fed’s decided hawkish stance on its rate policy. The S&P500 extended losses below its 50-DMA yesterday and is preparing to test the 4400 support to the downside, while Nasdaq 100 closed below the 15000 level for the first time since end of June. Tesla dropped another 3% yesterday on news that it cut its car prices in China for the second time this year, and the shares closed the session at a spitting distance from the major 38.2% Fibonacci retracement, which should distinguish between the positive trend building since the beginning of this year and a bearish reversal.
Elsewhere, Target jumped nearly 3% yesterday after beating profit expectations when it released Q2 earnings yesterday. Lower costs boosted profit margins, and gross margins jumped 27% last quarter compared to 21.5% printed a quarter earlier, net income more than quadrupled. Shiny results helped investors overcome the 11% drop in online sales – vs. 5% growth nailed by Amazon, and the slashed sales and profit outlook. Again, despite the risk that US consumers may not spend much in the next few quarters, what we see in most data is that… they continue spending – and the resilience of spending starts weighing more on Fed expectations than the risks that don’t materialize.
Slowing Europe
In Europe, the latest data released yesterday showed that growth and industrial production slowed, but slowed less than expected, while employment deteriorated less than expected – giving the European Central Bank (ECB) a good reason to continue its fight against inflation. But on a microscopic level, the Ifo said that Germany’s skilled worker pool is worsening. The Netherlands unexpectedly slipped into recession after showing two straight quarter contraction, and Eastern Europe continues feeling the pinch of Ukrainian war; the Polish economy printed a 3.7% contraction. Plus, Europe’s got a China problem. The European luxury goods have been supporting a rally in the European stocks as a result of higher Chinese purchases of the luxury products. But the souring economic conditions in China, falling home prices, rising unemployment and deteriorating sales growth weigh on valuations of companies like LVMH and Hermes. The Stoxx 600 is getting ready to test the 200-DMA, near 453, to the downside, and trend and momentum indicators hint that a deeper selloff could be on the European stocks’ menu this quarter.
On the currency front, the weak data – even though it was stronger-than-expected, combined with a broad-based surge in the US dollar, kept the EURUSD below the 100-DMA yesterday, near 1.0930. The pair fell to the lowest levels since the beginning of July and the strengthening bearish momentum calls for a deeper downside correction. The next natural target for the EURUSD bears stands at 1.0790, the 200-DMA. The ECB will likely keep its hawkish stance unchanged, but when the Fed hawks step in, the other central bank hawks just need to wait before their hawkishness is reflected in market pricing.
Norges Bank to Hike 25bp Today
Market movers today
Today's main event is the Norges Bank meeting. In June, Norges Bank signalled that the policy rate would probably be raised further at the coming week's meeting. High inflation figures for June unexpectedly opened up the possibility of the bank having to deliver another half-point hike in August, but falling core inflation in July combined with current market signals now clearly point to a quarter-point hike.
The 60 second overview
FOMC minutes: The minutes from the July FOMC meeting revealed very few new policy signals. Most Fed officials saw "significant" upside risks to inflation and believe that more tightening might be required, although with a more balanced risk outlook, which was emphasised several times. Two members backed a hold at the meeting. The FOMC minutes are obviously backward looking compared to the recent slew of data, but inflation concerns are still lingering despite the two latest benign US CPI prints. The Fed also scraps its recession call, which points to the US growth resilience as well in the face of extraordinary tightening. Market reaction was generally muted on the back of the minutes. Today is a quiet day with focus on jobless claims and Philadelphia Fed Manufacturing index.
US GDP: Atlanta Fed's GDPnow forecast for Q3 was lifted to 5.8%, up from 5.0% earlier this week.
Euro area: The strong euro area labour market was confirmed to continue in Q2 as well. While the employment growth lost some pace, it still grew by 0.2% qoq in the euro area, which is essentially the lowest since the pandemic. Indeed's hiring lab database suggested that wage growth declined further in July, albeit stayed printed at an elevated 4.2% yoy.
Equities: European and Nordic equities recovered into the session, while US closed another -1% lower and ended near session lows. It was not a risk-off session at home turf, with consumer discretionary banks and industrials all performing well. However, US saw more of a defensive and value preference. Big tech and yield sensitive sectors such as real estate sold off, as yields rose after the Fed minutes. VIX ticked another point higher to 17. Risk sentiment seems to improve this morning with Asian markets mixed and US futures a notch higher.
FI: Global bond yields moved generally sideways yesterday will no significant news to alter the pricing. The FOMC minutes released last night did not lead to a market reaction. That means that 2y UST yields are still trading just below the 5% level. Inflation swaps declined marginally yesterday coming off the recent highs of 2.65% in 5y5y inflation swap. At the same time, markets added to its rate cut expectations from the ECB yesterday to now around -65bp priced through 2024.
FX: Scandies were once again under pressure yesterday from negative risk sentiment. Both EUR/NOK and EUR/SEK rose to the highest level since early June. GBP and USD were top performers as EUR/GBP slipped to the lowest in over a month and EUR/USD hovered around the 1.09 level.
Credit: The negative tone in the credit market continued yesterday, which we largely attribute to the ongoing barrage of negative stories out of China and their potential to spill over to the rest of the global economy. This drove iTraxx Main out by 1.1bp to 74bp while Xover widened 4.4bp to 415.4bp. We note though, that the moves in cash space are less pronounced indicating that liquidity remains weak in the secondary market.
Nordic macro
Norway: Norges Bank signalled in June that the policy rate would probably be raised further in August. High inflation figures for June unexpectedly opened up the possibility of the central bank having to deliver another half-point hike in August, but core inflation fell again in July from 7.0% to 6.4%, which is only marginally above the 6.3% assumed in the June monetary policy report. Together with a slightly stronger NOK, higher FRA-OIS spreads and somewhat lower rate expectations abroad, this clearly points to a quarter-point hike as signalled at the June meeting. We expect Norges Bank to keep the tightening bias, stating that 'rates most likely will be raised again in September'. However, they will stress that this will be data dependent.
Sweden: Anna Breman will be the first Riksbank board member to comment on the economy and monetary policy after the summer break when she speaks at 14:00 today. She will get the chance to reflect on, hitherto, higher inflation than anticipated and a much weaker than expected preliminary GDP print for the second quarter. In June she expressed a lot of concern that service inflation gets stuck up here. Regarding monetary policy she stressed that if, which is in fact the case, the market prices in 'premature' rate cuts, the Riksbank may have to respond by keeping rates higher for longer. Arguably, the rationale for that would be to mitigate unwarranted easing of financial conditions. Breman is currently a hawk.
AUD/USD Daily Report
Daily Pivots: (S1) 0.6400; (P) 0.6440; (R1) 0.6464; More...
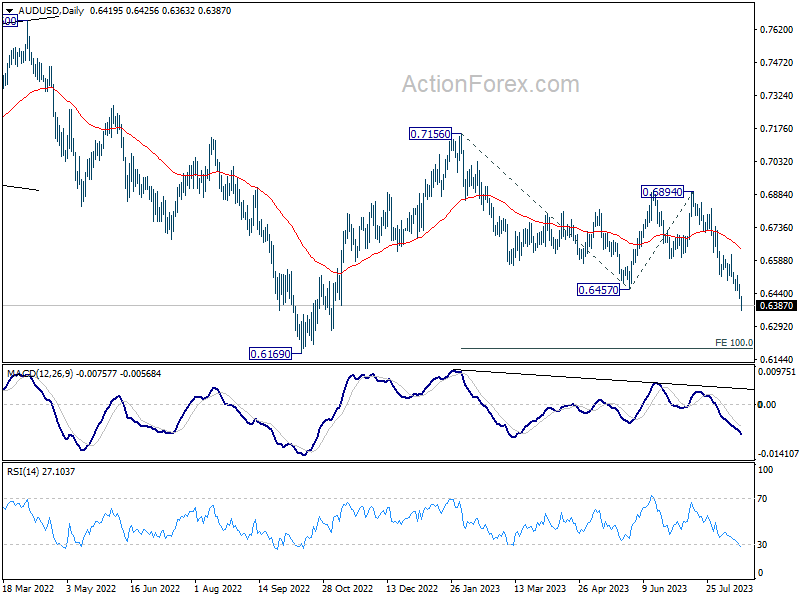
Intraday bias in AUD/USD remains on the downside at this point, as decline from 0.7156 extends. Next target is 100% projection of 0.7156 to 0.6457 from 0.6894 at 0.6195. On the upside, above 0.6479 minor resistance will turn intraday bias neutral and bring consolidations first, before staging another fall.
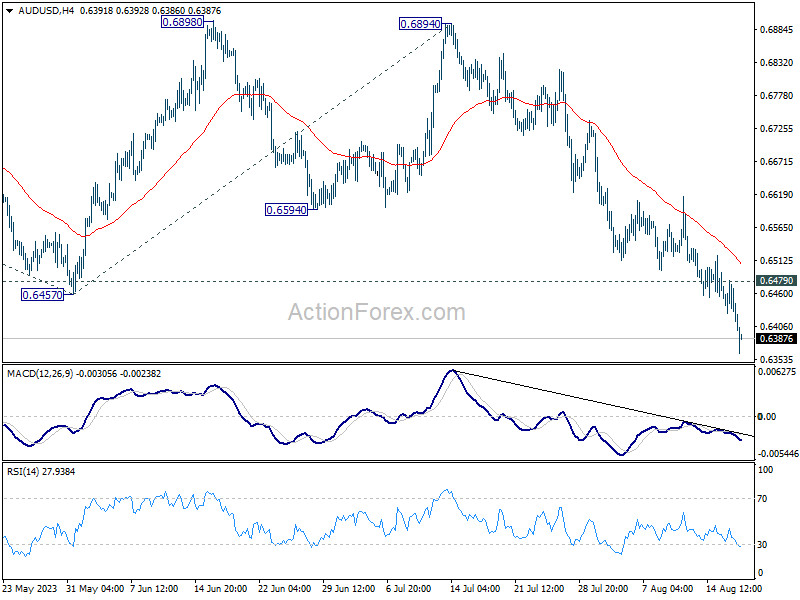
In the bigger picture, the down trend from 0.8006 (2021 high) could still be in progress. Break of 0.6457 support affirms this bearish case. Further break of 0.6169 will target 61.8% projection of 0.8006 to 0.6169 to 0.7156 at 0.6021. This will now remain the favored case as long as 0.6894, in case of strong rebound.
Australian Dollar Dives After Poor Employment Data and Risk Off Sentiment
Australian Dollar faced a discernible decline during today's Asian trading session, continuing its broad-based selloff throughout the week. The catalyst behind Aussie's downturn can be traced back to the underwhelming employment figures released from Australia. Additionally, a prevailing risk-averse sentiment, inherited from US markets overnight, further burdened the risk-sensitive currency. Following closely, New Zealand Dollar emerges as the session's second-weakest currency. Surprisingly, despite market's cautionary mood, Japanese Yen finds no solace and positions itself as the third-worst performer.
On the other hand, Dollar is showing signs of rejuvenation, bolstered by uptick in benchmark yields. Nonetheless, it's only managed to secure a spot behind the Sterling, making it the week's second-strongest currency thus far. Recent market movements hint at a changing dynamic for Euro and Swiss Franc, with both currencies facing downward pressure, especially against Dollar and Pound. Yet, it's worth noting that Euro still manages to gain a substantial lead over laggards like the Aussie and Kiwi.
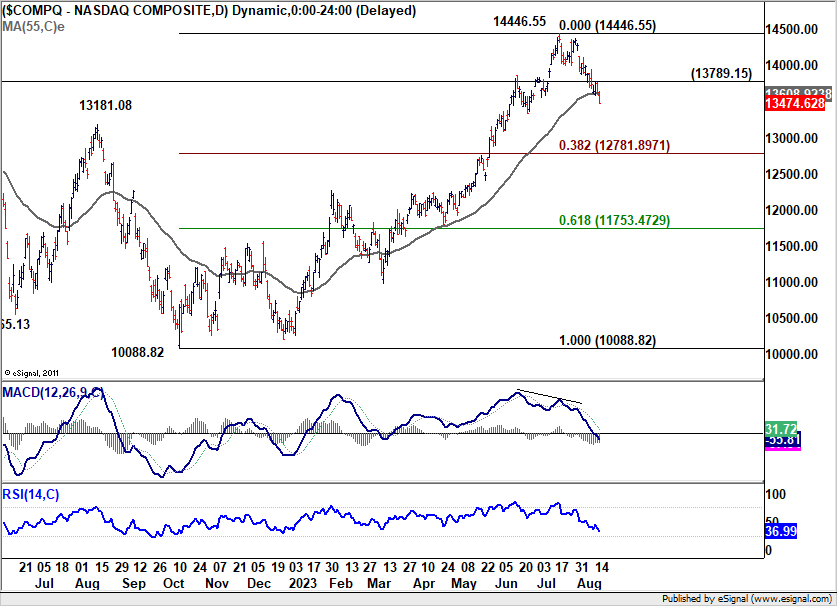
Technically, NASDAQ broke through 55 D EMA (now at 13608.92) overnight to close at 13474.62. The development now affirms that case that it's at least in correction the whole up trend from 10088.82 (2022 low). Further decline is expected as long as 13789.15 resistance holds. Next target is 38.2% retracement of 10088.82 to 14446.55 at 12781.89. The prevailing uncertainty lies in the trajectory of the sell-off and its ripple effects on currency markets amidst the risk-averse sentiment.
In Asia, at the time of writing, Nikkei is down -0.32%. Hong Kong HSI is down -0.12%. China Shanghai SSE is up 0.01%. Japan 10-year JGB yield is up 0.0177 at 0.650. Overnight, DOW dropped -0.52%. S&P 500 dropped -0.76%. NASDAQ dropped -1.15%. 10-year yield rose 0.037 to close at 4.258.
Hawkish tilt evident in FOMC minutes, yet rate hike skepticism remains
The minutes from FOMC meeting on July 25-26 signal a clear division within the committee regarding the path of future monetary tightening, with a slight inclination towards a hawkish stance.
Despite this, market anticipation for immediate rate adjustments remains tepid. Fed fund futures indicate an 86.5% chance that Fed will maintain the status quo in September, with less than 50% probability of a rate hike by year-end.
On the stock front, NASDAQ felt the heat, declining by 1.15%, possibly reacting to Fed's deliberations.
Within the minutes, one point was underscored: "With inflation still well above the Committee's longer-run goal and the labor market remaining tight, most participants continued to see significant upside risks to inflation."
Yet, counterpoints highlighted potential economic vulnerabilities and concerns about unemployment, with some members noting, "there continued to be downside risks to economic activity and upside risks to the unemployment rate."
Additionally, a number of participants judged that risks to achieve inflation target "had become more two sided", and wanred of the risk of "inadvertent overtightening of policy against the cost of an insufficient tightening."
Australian employment down -14.6k, but hours worked continue to rise
Australia witnessed a contraction in employment by -14.6k in July, starkly missing expectations of a 15.2k growth. This decline was majorly attributed to a drop in full-time jobs by -24.2k, even as part-time employment saw an increase of 9.6k.
Unemployment rate rose from 3.5% to 3.7%, surpassing market anticipations which had pinned it at 3.6%. The participation rate also registered a dip, moving from 66.8% to 66.7%.
However, it wasn't all bleak. Monthly hours worked showed a marginal increase of 0.2% mom. Commenting on this aspect, Bjorn Jarvis, ABS head of labour statistics, observed, "The strength in hours worked shows that it continues to be a tight labour market."
Jarvis pointed out that hours worked have risen by an impressive 5.2% compared to July 2022, a significant outperformance relative to the 2.8% annual increase in employment.
He further noted, "The strength in hours worked over the past year, relative to employment growth, shows the demand for labour is continuing to be met, to some extent, by people working more hours."
RBNZ Orr: We don't feel a rush to be changing rates anytime soon
In a Bloomberg TV interview, RBNZ Governor Adrian Orr indicated that a forthcoming mild recession is the "bare minium" for New Zealand, as "demand has been well outstripping the pace of the supply capacity."
"We need to see subdued consumer spending, business investment and government constraints on spending, these are a critical part of the inflation process," he added.
Orr also reiterated that interest rate will need to stay high for a period of time, as "we don't feel a rush to be changing rates anytime soon."
"We believe if we stay where we are for long enough, inflation will be back inside the target band mid-next year and, and stay there," he added.
RBNZ projects OCR to peak at 5.59% in mid-2024, then retract slightly to 5.36% by early 2025. This suggests rate cuts might be off the table for about 18 months. Orr clarified that these figures are projections and "signal or constraint."
Japans' export contracts in Jul, shipments to China fell for 8th month
Japan Witnesses First Export Contraction in Over Two Years Amidst Declining Trade with China
Japan's exports experienced a dip of -0.3% yoy to JPY 8725B in July. This contraction is noteworthy as it breaks a growth streak that has lasted for over two years since February 2021.
Diving deeper into the data, while shipments to US and Europe saw a positive trajectory with respective rises of 13.5% yoy and 12.4% yoy, the trade dynamics with China narrated a different story.
Exports to China, Japan's primary trading ally, plummeted by -13.4%, marking the steepest decline since January. Notably, this reflects an ongoing trend with shipments to China diminishing for the eighth consecutive month, subsequent to a -10.9% yoy drop in June.
On the import front, Japan registered a decline of -13.5% yoy to JPY 8804B. This marks the fourth consecutive month of declining imports and is the most significant dip since September 2020. The downturn can be partly attributed to the decreasing commodities prices.
With imports exceeding exports, trade balance for the month ended in a deficit of JPY -78.7B.
When observing the figures in seasonally adjusted terms, both exports and imports displayed a 2.0% mom rise, amounting to JPY 8460B and JPY 9018B respectively. Consequently, trade deficit widened slightly, reaching JPY -557B.
Looking ahead
Eurozone trade balance will be release in European session. US will release jobless claims and Philly Fed survey.
AUD/USD Daily Report
Daily Pivots: (S1) 0.6400; (P) 0.6440; (R1) 0.6464; More...
Intraday bias in AUD/USD remains on the downside at this point, as decline from 0.7156 extends. Next target is 100% projection of 0.7156 to 0.6457 from 0.6894 at 0.6195. On the upside, above 0.6479 minor resistance will turn intraday bias neutral and bring consolidations first, before staging another fall.
In the bigger picture, the down trend from 0.8006 (2021 high) could still be in progress. Break of 0.6457 support affirms this bearish case. Further break of 0.6169 will target 61.8% projection of 0.8006 to 0.6169 to 0.7156 at 0.6021. This will now remain the favored case as long as 0.6894, in case of strong rebound.
Economic Indicators Update
| GMT | Ccy | Events | Actual | Forecast | Previous | Revised |
|---|---|---|---|---|---|---|
| 22:45 | NZD | PPI Input Q/Q Q2 | -0.20% | 0.40% | 0.20% | 0.00% |
| 22:45 | NZD | PPI Output Q/Q Q2 | 0.20% | 0.80% | 0.30% | 0.20% |
| 23:50 | JPY | Trade Balance (JPY) Jul | -0.56T | -0.44T | -0.55T | -0.54T |
| 23:50 | JPY | Machinery Orders M/M Jun | 2.70% | 3.60% | -7.60% | |
| 01:30 | AUD | Employment Change Jul | -14.6K | 15.2K | 32.6K | 31.6K |
| 01:30 | AUD | Unemployment Rate Jul | 3.70% | 3.60% | 3.50% | |
| 04:30 | JPY | Tertiary Industry Index M/M Jun | -0.40% | -0.10% | 1.20% | 1.00% |
| 09:00 | EUR | Eurozone Trade Balance (EUR) Jun | 2.3B | -0.9B | ||
| 12:30 | USD | Initial Jobless Claims (Aug 11) | 240K | 248K | ||
| 12:30 | USD | Philadelphia Fed Manufacturing Survey Aug | -9.5 | -13.5 | ||
| 14:30 | USD | Natural Gas Storage | 35B | 29B |
Technical Outlook and Review
DXY:
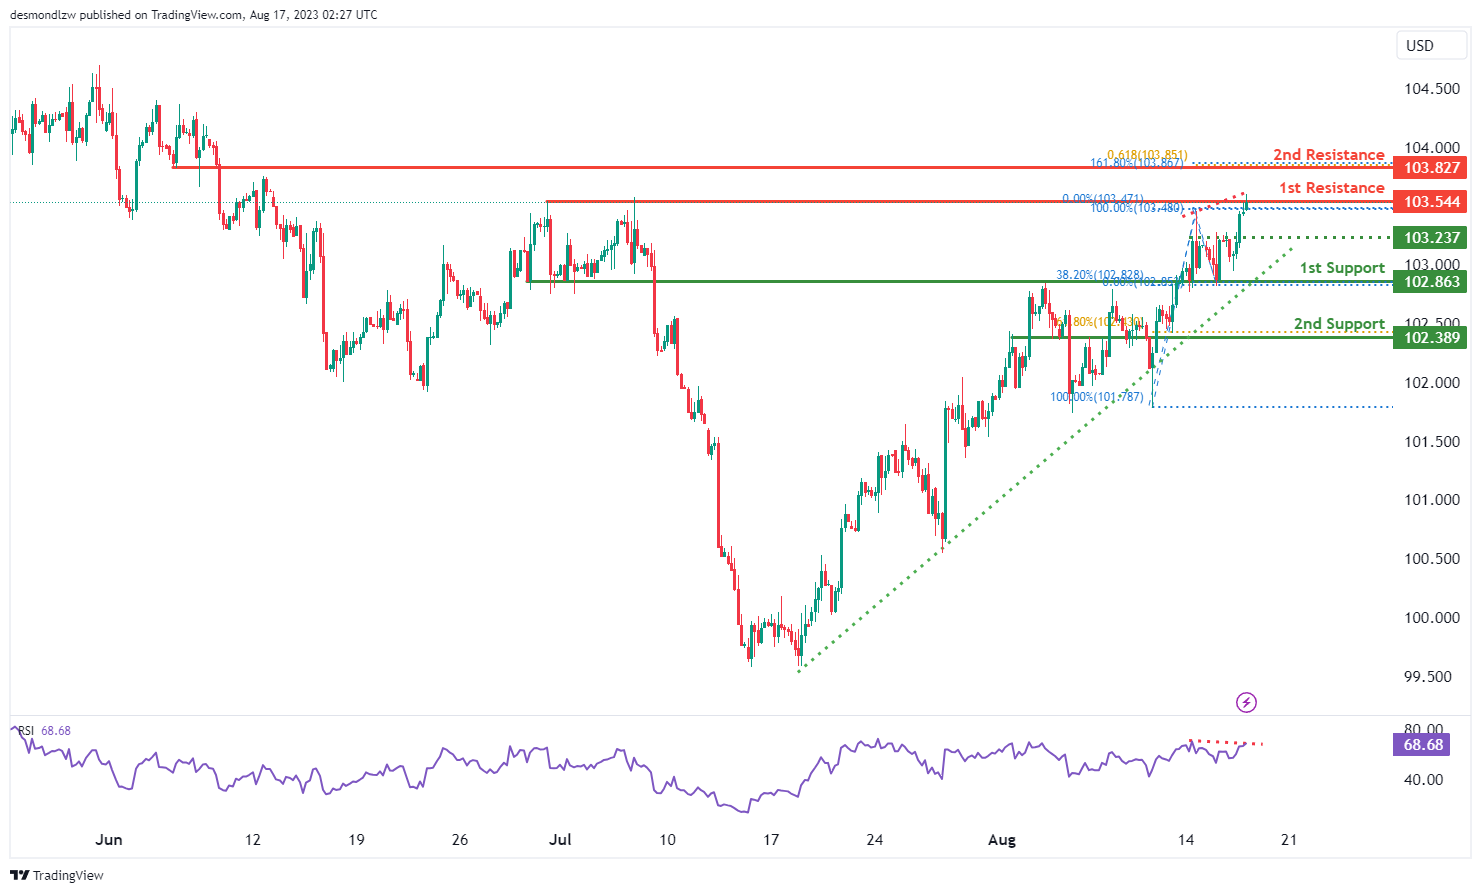
The DXY chart’s overall momentum is bullish, supported by its position above a significant ascending trend line, hinting at potential further bullish movement.
Considering this, there’s a possibility of a short-term decline towards the 1st support at 102.86 before a potential bounce, aiming for the 1st resistance at 103.54, noted for its multi-swing high resistance.
The 1st support at 102.86 gains strength as a pullback support, backed by the 38.20% Fibonacci Retracement, while the 2nd support at 102.38 acts as an overlap support, reinforced by the 61.80% Fibonacci Retracement.
On the flip side, the 2nd resistance at 103.82 represents a pullback resistance.
Additionally, the Relative Strength Index (RSI) testing a major resistance level implies a potential upcoming reversal in price movement.
EUR/USD:
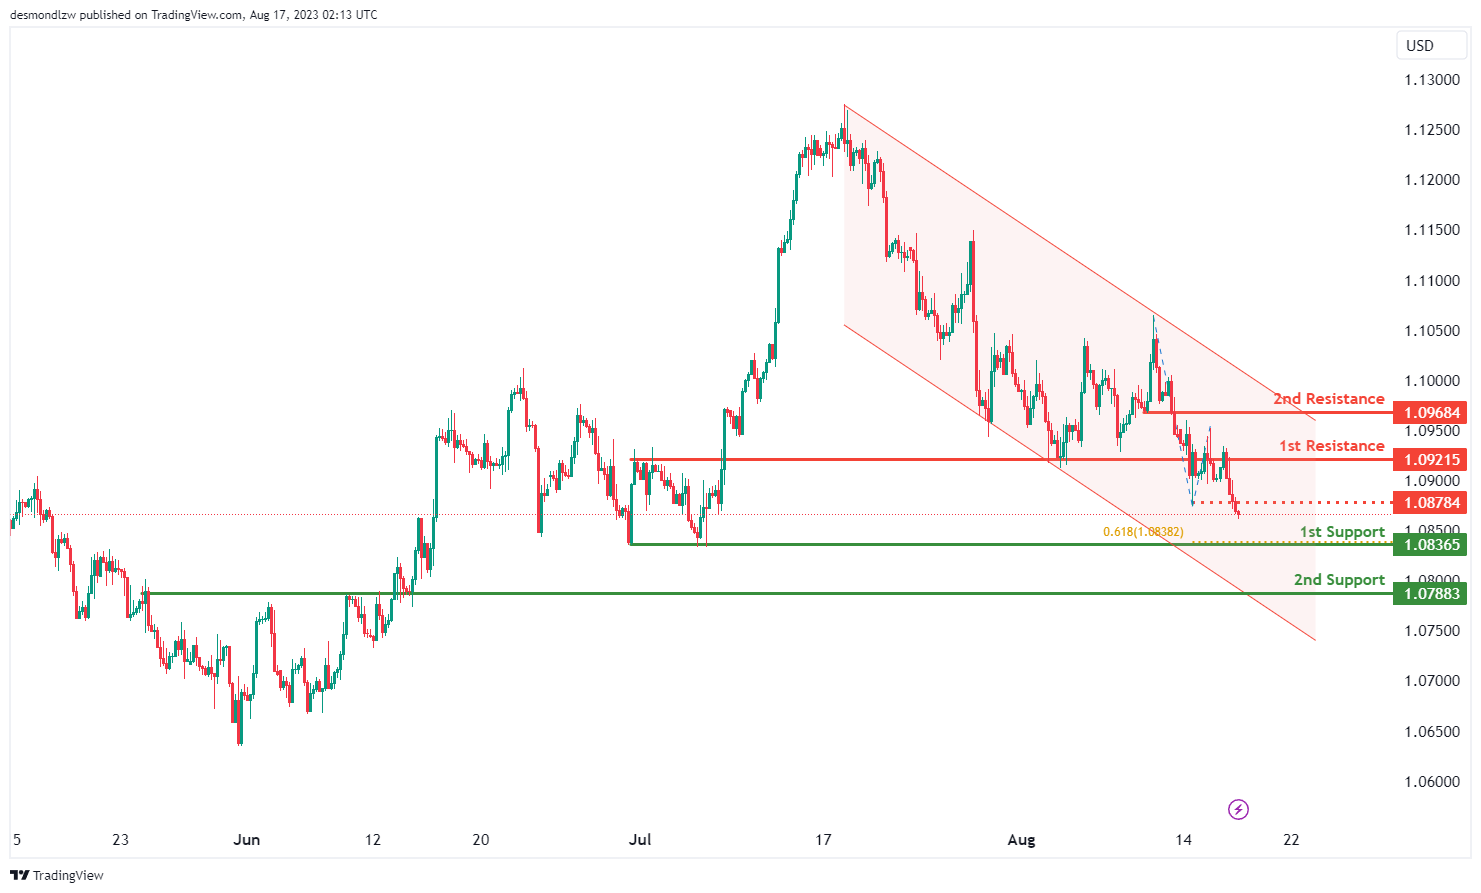
The EUR/USD chart currently maintains a bearish momentum, as indicated by its position within a descending channel. This channel pattern suggests a potential continuation of the downward trend due to the existing bearish momentum.
Given this bearish sentiment, there’s a likelihood of a bearish continuation towards the 1st support at 1.0836, which is reinforced by its role as a multi-swing low support and the presence of a 61.80% Fibonacci Projection.
Supporting the structure, the 2nd support at 1.0788 is identified as an overlap support.
On the resistance side, the 1st resistance at 1.0921 is significant due to its classification as an overlap resistance. Additionally, the 2nd resistance at 1.0968 acts as a pullback resistance.
Moreover, the intermediate resistance at 1.0878 is a pullback resistance, further contributing to the potential resistance levels.
EUR/JPY:
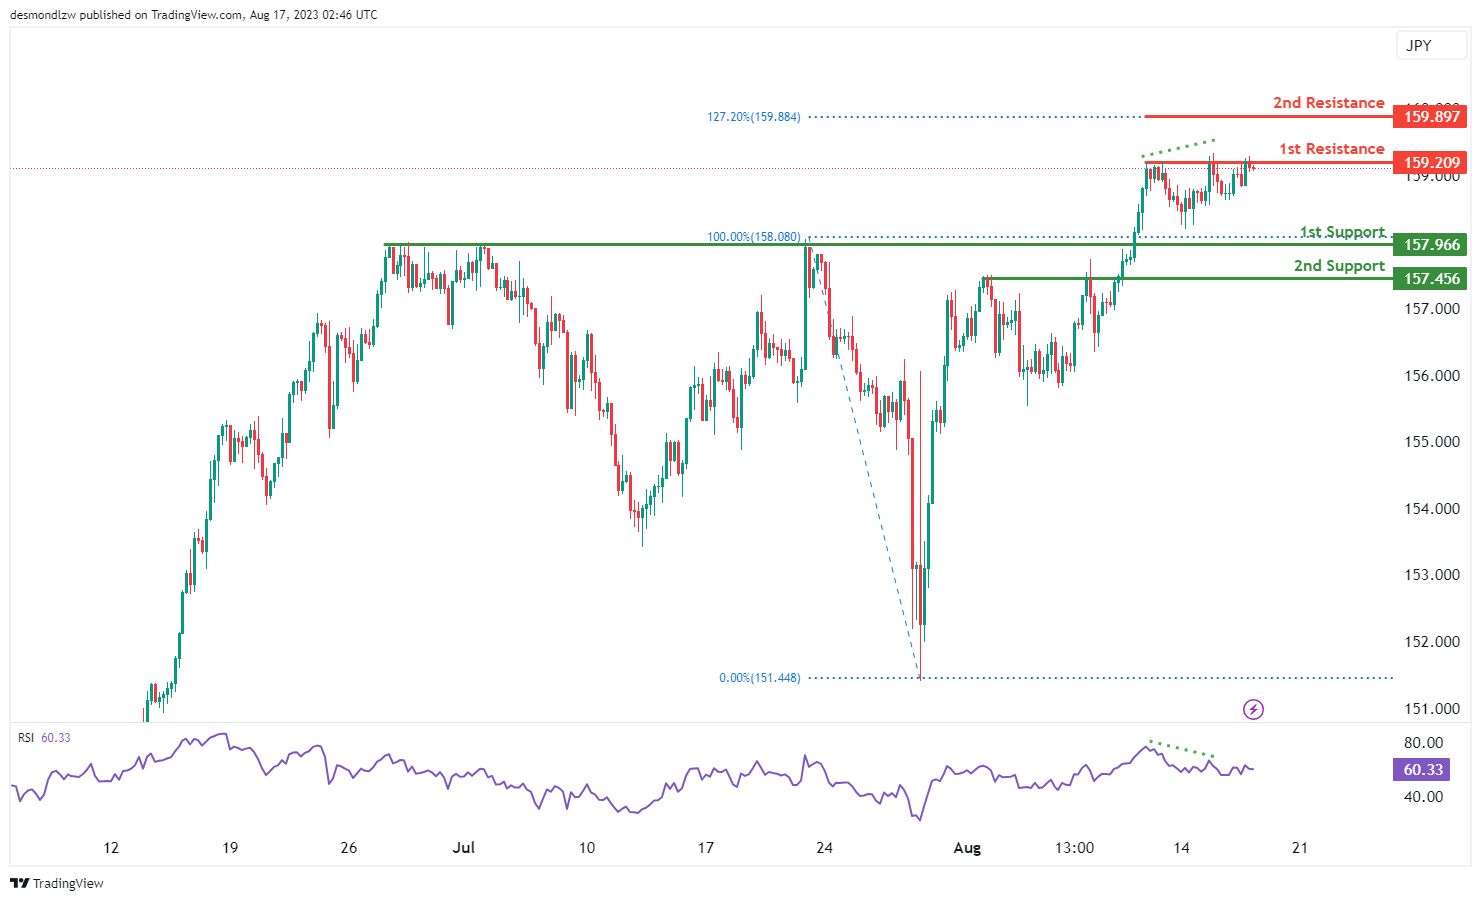
The EUR/JPY chart demonstrates a bearish overall momentum. There is a potential for a bearish reaction off the 1st resistance level, leading to a drop towards the 1st support level.
The 1st support is located at 157.96 and is considered advantageous due to its pullback support characteristics. Furthermore, the 2nd support at 157.45 is also seen as a valuable level because of its pullback support characteristics.
On the resistance side, the 1st resistance level at 159.20 is noteworthy as it represents a multi-swing high resistance. Additionally, the 2nd resistance at 159.89 is significant due to its association with the 127.20% Fibonacci Extension.
Furthermore, the Relative Strength Index (RSI) is also displaying bearish divergence versus price, suggesting that a reversal might occur soon. This could indicate a potential shift in the momentum of the chart.
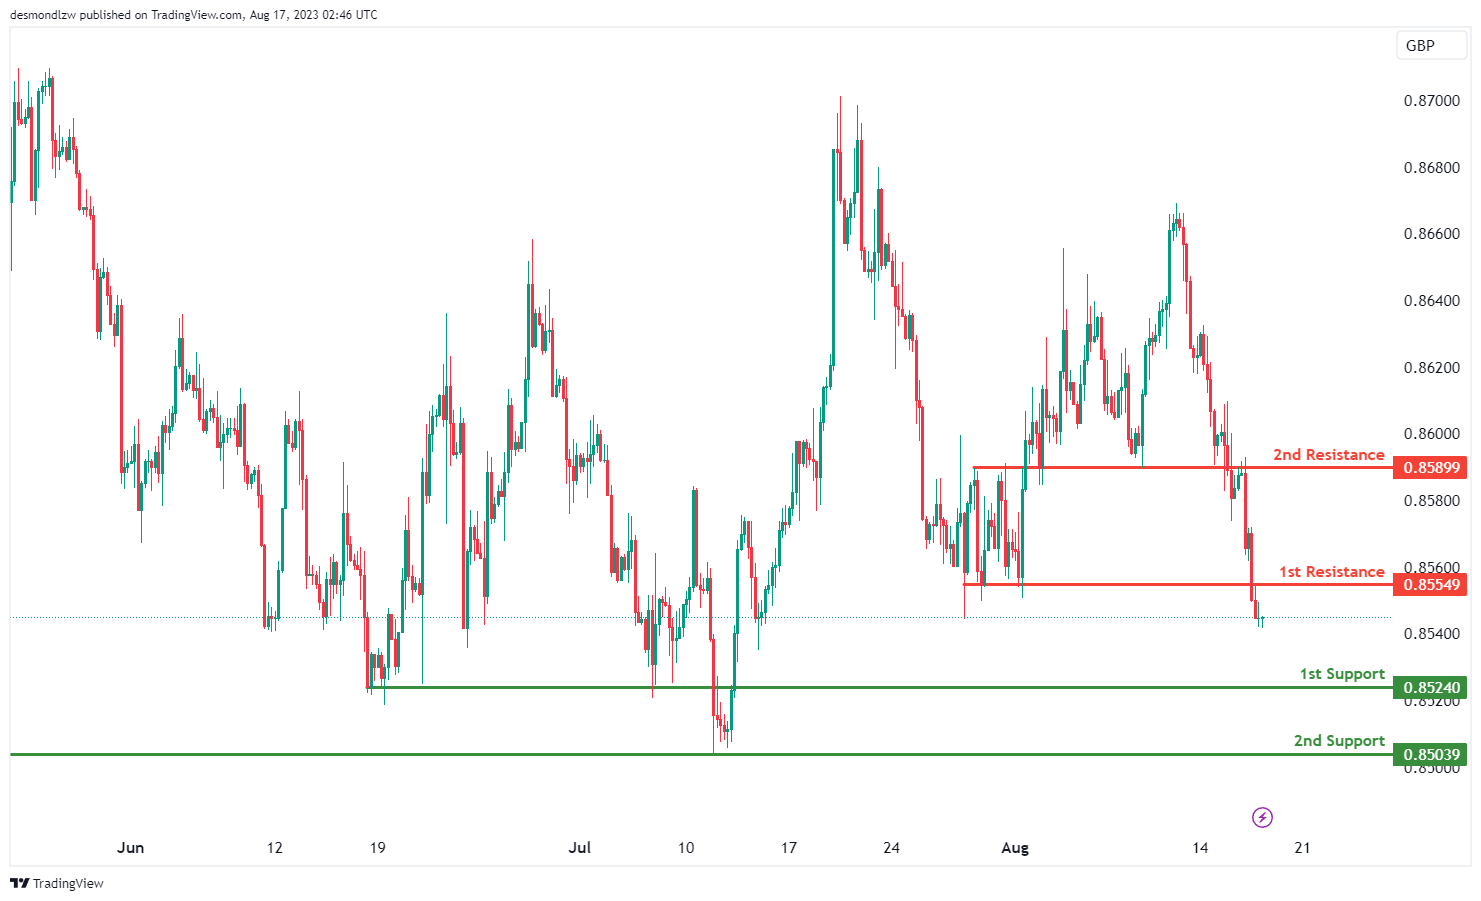
EUR/GBP:
The EUR/GBP chart indicates a bearish overall momentum. There is a potential for a bearish continuation towards the 1st support level.
The 1st support is situated at 0.8524 and is considered advantageous due to its overlap support characteristics. Additionally, the 2nd support at 0.8503 is also viewed as a valuable level because of its overlap support.
On the resistance side, the 1st resistance level at 0.8554 is noteworthy as it represents a pullback resistance. Furthermore, the 2nd resistance at 0.8589 is also seen as significant due to its overlap resistance characteristics. This configuration suggests potential levels where the price might encounter obstacles in its movement.
GBP/USD:
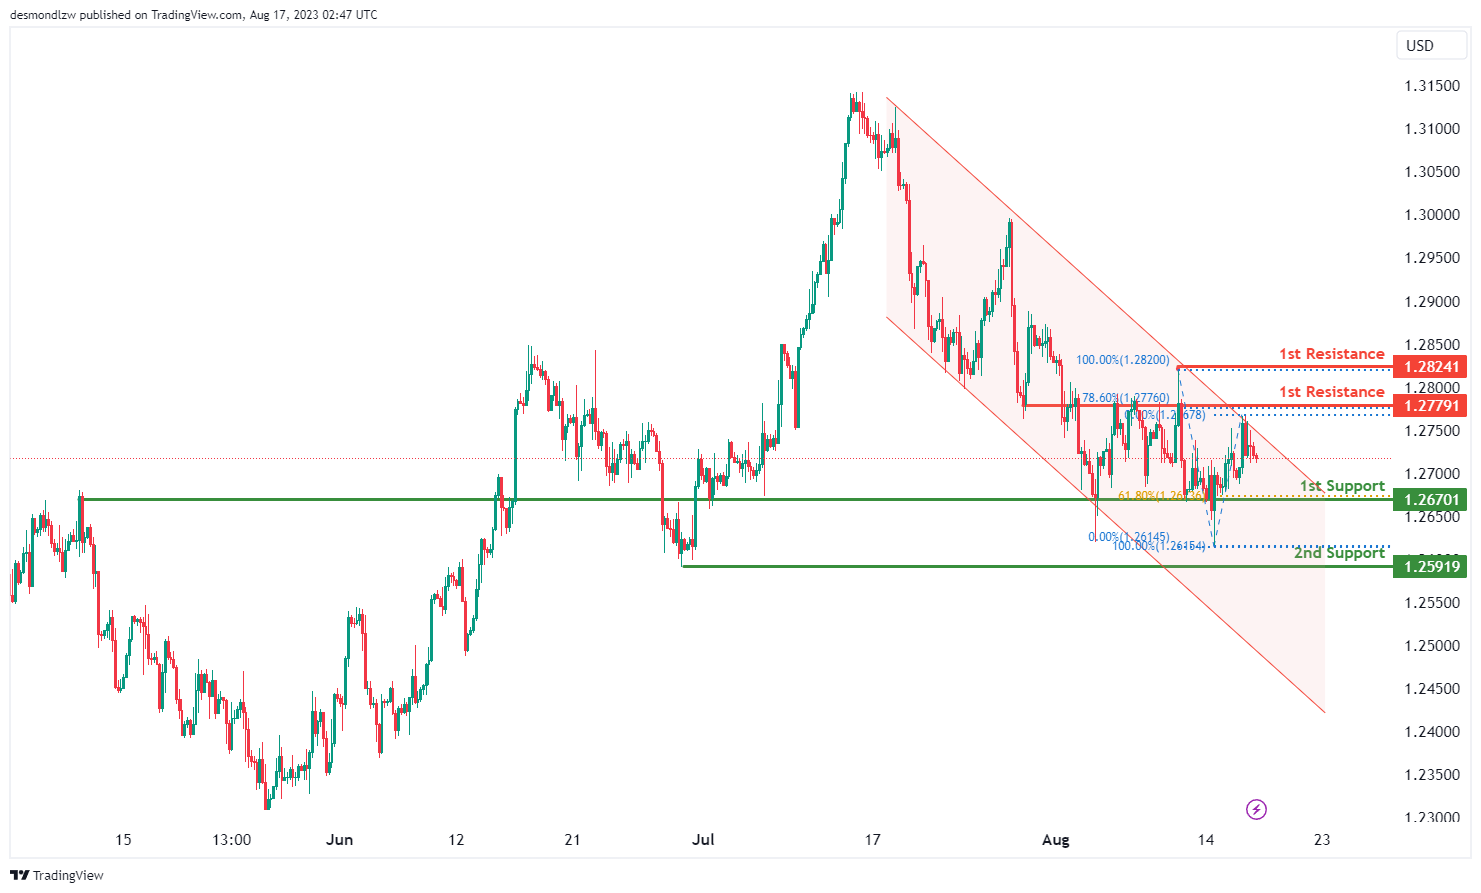
The GBP/USD chart currently maintains a bearish momentum, as indicated by its position within a descending channel. This channel pattern suggests a potential for the ongoing downward movement to persist due to the prevailing bearish trend.
Given this bearish context, there’s a likelihood of a bearish continuation towards the 1st support at 1.2670, which holds significance as an overlap support and aligns with the 61.80% Fibonacci retracement level.
Furthermore, the 2nd support at 1.2591 adds strength as a swing low support, contributing to the potential support levels.
On the resistance side, the 1st resistance at 1.2779 serves as a pullback resistance, reinforced by the presence of the 78.60% Fibonacci retracement level. The 2nd resistance at 1.2824 is identified as a swing high resistance, further contributing to the potential resistance levels.
Overall, the chart’s configuration aligns with the bearish momentum within the descending channel pattern.
GBP/JPY:
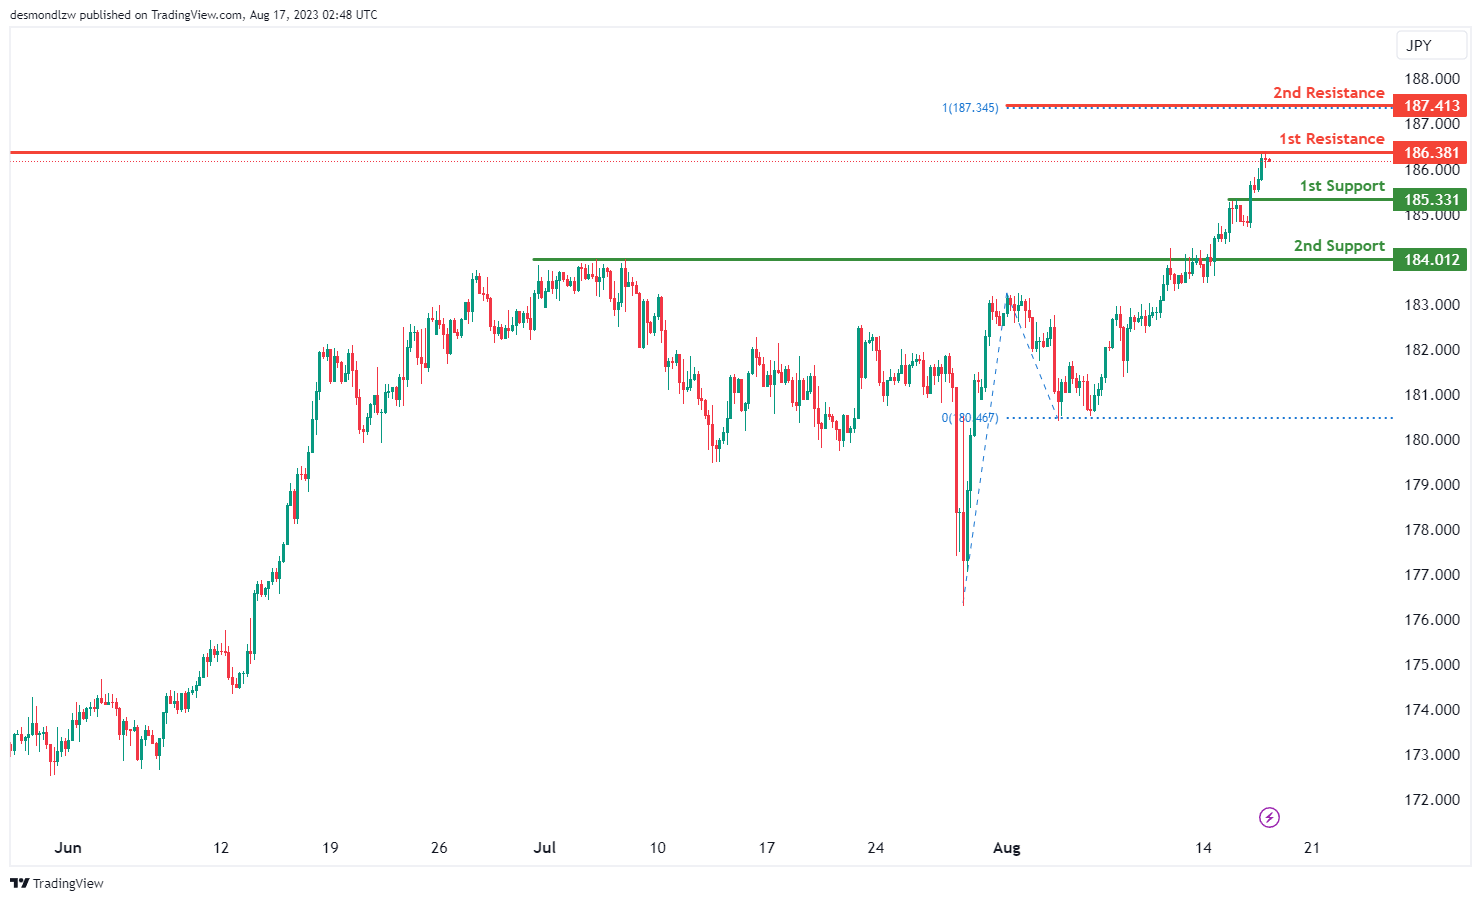
The GBP/JPY chart displays a bearish overall momentum. There is a potential for a bearish reaction off the 1st resistance level, leading to a drop towards the 1st support level.
The 1st support is positioned at 185.33 and is considered advantageous due to its pullback support characteristics. Furthermore, the 2nd support at 184.01 is also seen as valuable because it represents a pullback support.
On the resistance side, the 1st resistance level at 186.38 is noteworthy as it represents a swing high resistance. Additionally, the 2nd resistance at 187.41 is significant due to its association with the 100% Fibonacci Projection. These levels indicate potential points where the price might encounter resistance or support in its movement.
USD/CHF:
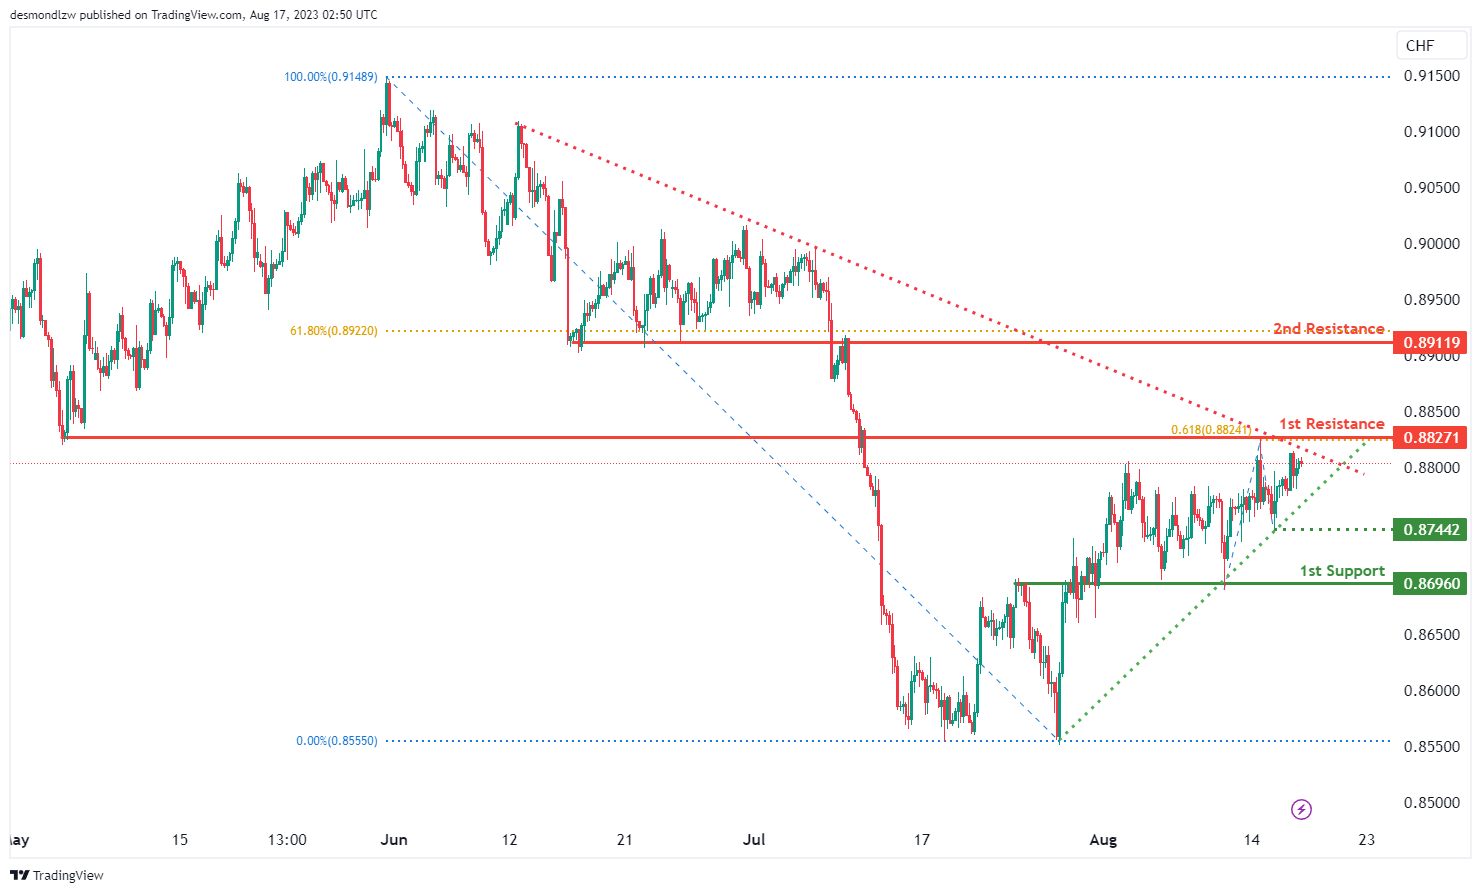
The USD/CHF chart currently maintains a neutral momentum, implying a lack of strong directional bias.
Given this neutral stance, there’s a possibility that the price might oscillate within the range defined by the 1st resistance at 0.8827 and the 1st support at 0.8696. These levels are significant, with the 1st support serving as an overlap support and the intermediate support at 0.8744 reinforcing the support structure. Similarly, the 1st resistance is an overlap resistance, while the 2nd resistance at 0.8911 is identified as a pullback resistance.
Adding to the analysis, the chart pattern indicates a symmetrical triangle formation, which typically signifies a period of consolidation before an imminent breakout or breakdown. If the price breaks above the upper trendline of the pattern, it could indicate a potential bullish breakout. Conversely, a break below the lower trendline might suggest a bearish breakdown.
Overall, the neutral momentum and the presence of the symmetrical triangle pattern indicate a potential for upcoming volatility and a decisive move in either direction.
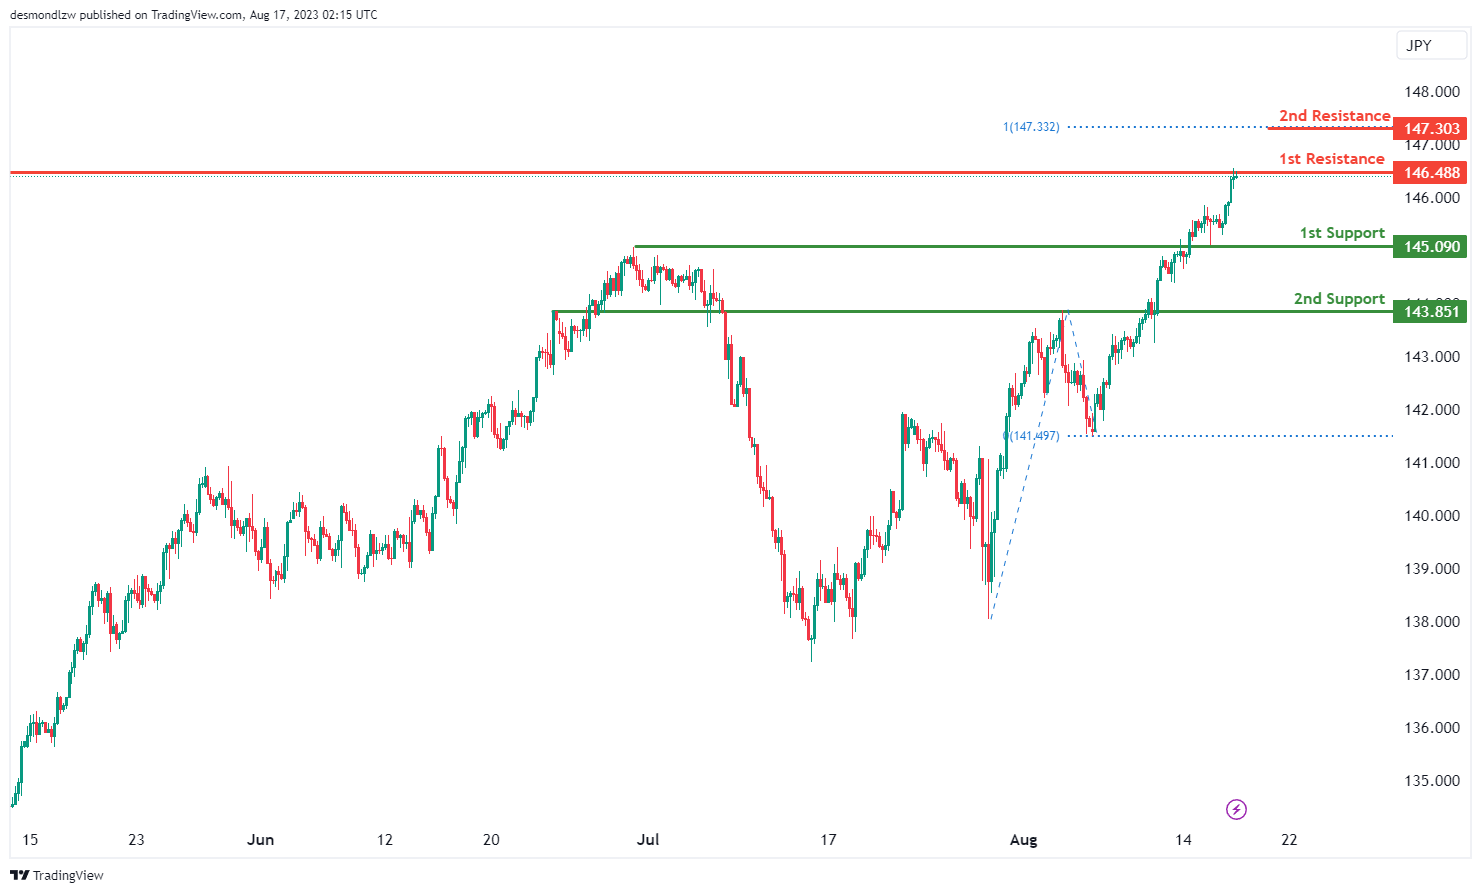
USD/JPY:
The USD/JPY chart currently exhibits a bearish momentum, suggesting a prevailing downward trend.
Given this bearish sentiment, a potential scenario could involve a bearish reaction as the price approaches the 1st resistance level at 146.48, followed by a drop towards the 1st support at 145.09. The significance of the 1st support lies in its classification as an overlap support, while the 2nd support at 143.85 gains importance as a pullback support.
On the resistance side, the 1st resistance at 146.48 is noted as a swing high resistance. Additionally, the 2nd resistance at 147.30 is categorized as an overlap resistance, reinforcing its potential impact as a barrier to further upward movement.
USD/CAD:
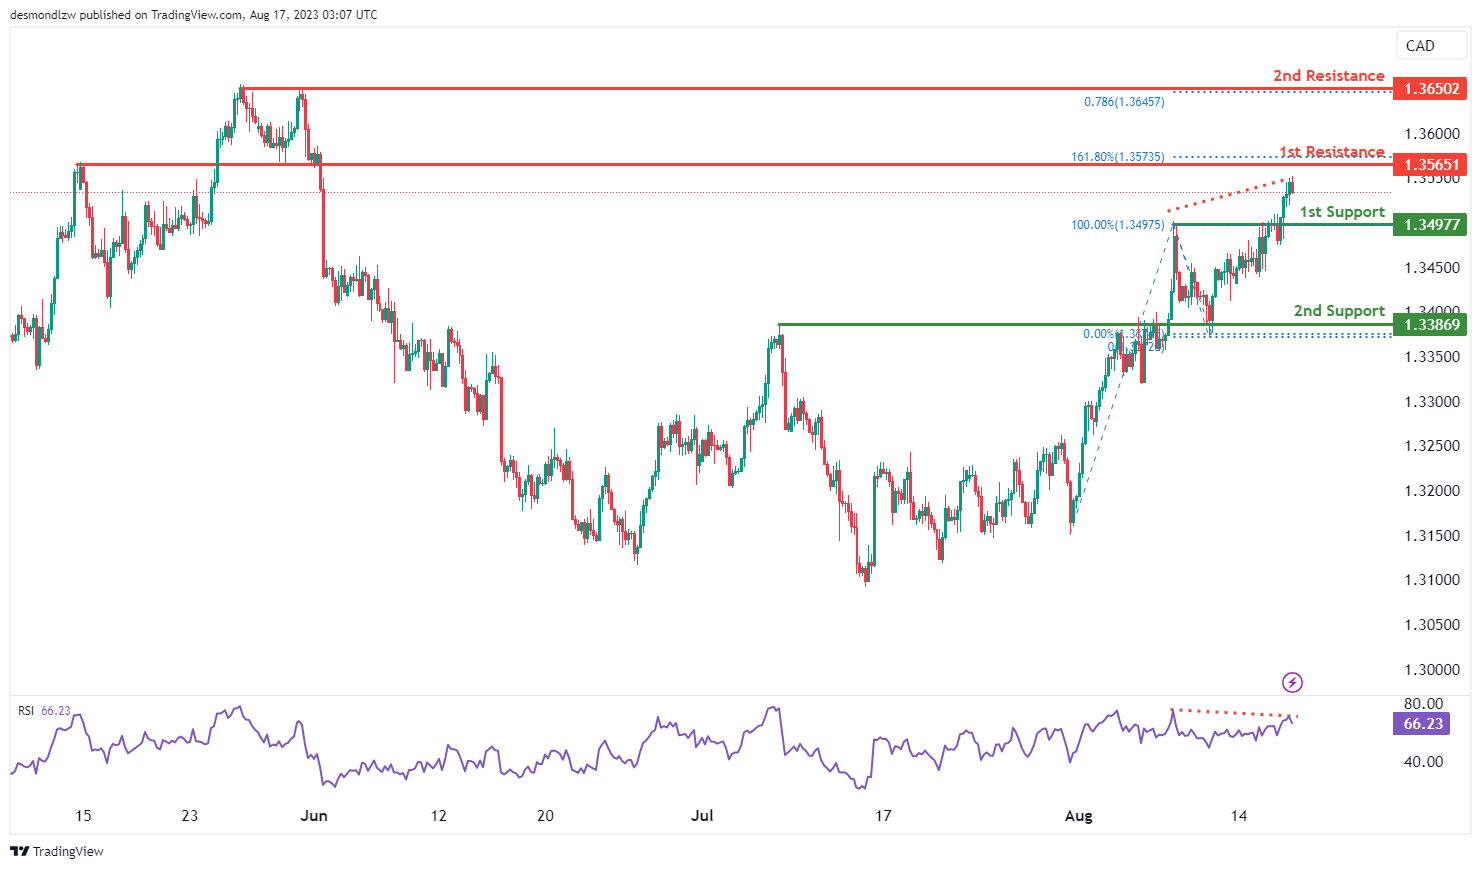
The USD/CAD chart currently shows a bearish momentum, indicating a prevailing downward trend. There’s a potential scenario where the price could continue its bearish movement towards the 1st support at 1.3498, which is identified as an overlap support. The 2nd support at 1.3387 is also identified as an overlap support level.
To the upside, the 1st resistance at 1.3565 is identified as an overlap resistance level that aligns with the 161.80% Fibonacci extension level while the 2nd resistance at 1.3650 is identified as a multi-swing-high that aligns with the 78.60% Fibonacci projection level.
AUD/USD:
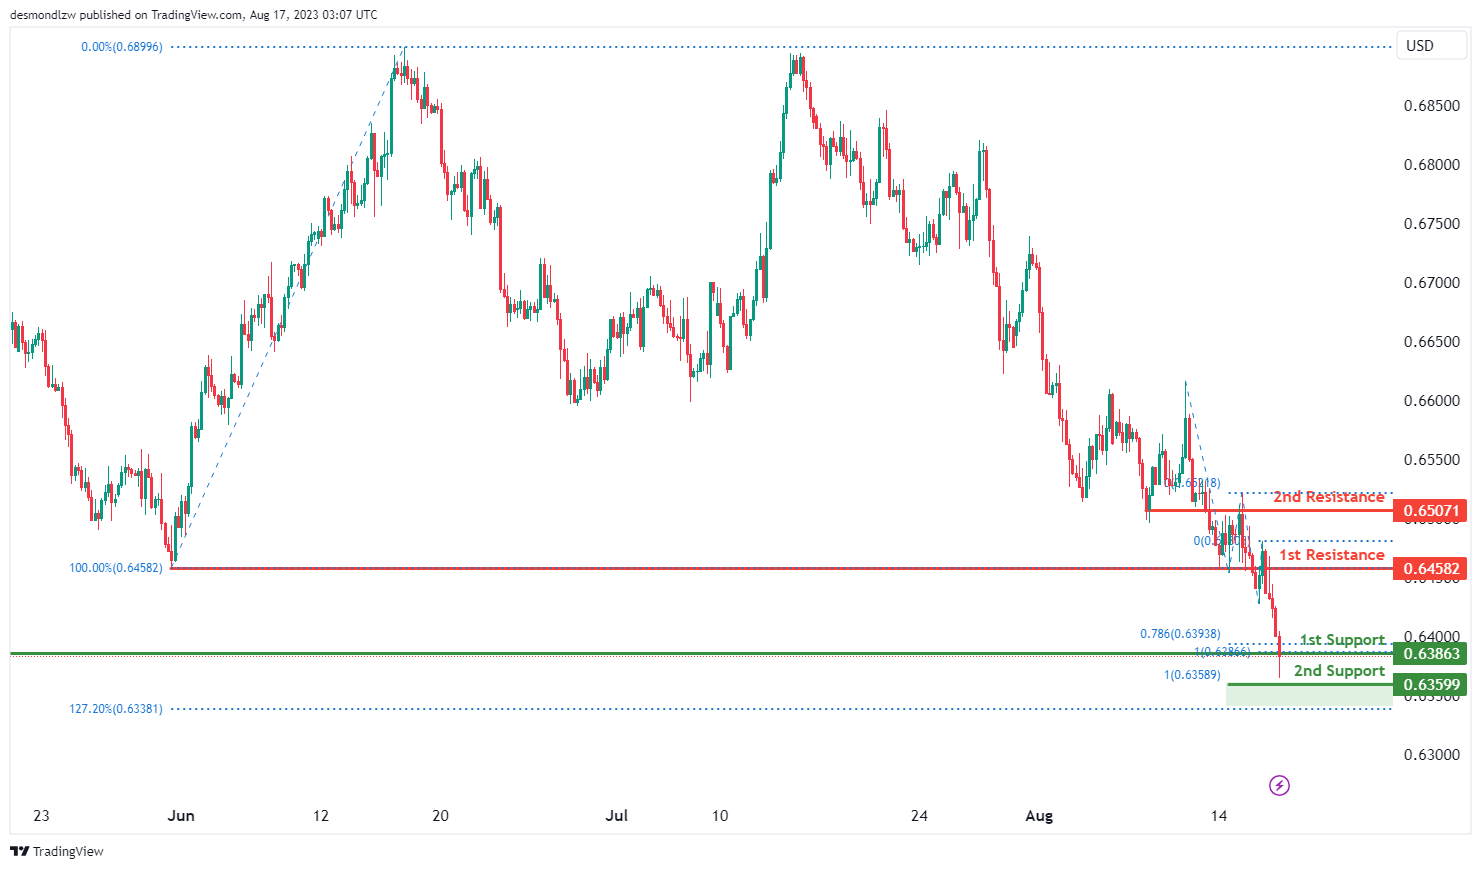
The current trend in the AUD/USD chart is bearish, with potential for a further downward movement. The price may break below the 1st support and make a potential move towards the 2nd support level.
The 1st support level at 0.6386, which is identified as a pullback support, is reinforced by a confluence of Fibonacci levels i.e. the 78.60% and the 100.00% projection levels. The 2nd support at 0.6359 adds to the support area with the presence of the 100.00% Fibonacci projection and the 127.20% Fibonacci extension levels, which is also identified as a Fibonacci confluence.
To the upside, the 1st resistance level at 0.6458 is identified as an overlap support while the 2nd resistance at 0.6507 is also identified as an overlap resistance.
NZD/USD
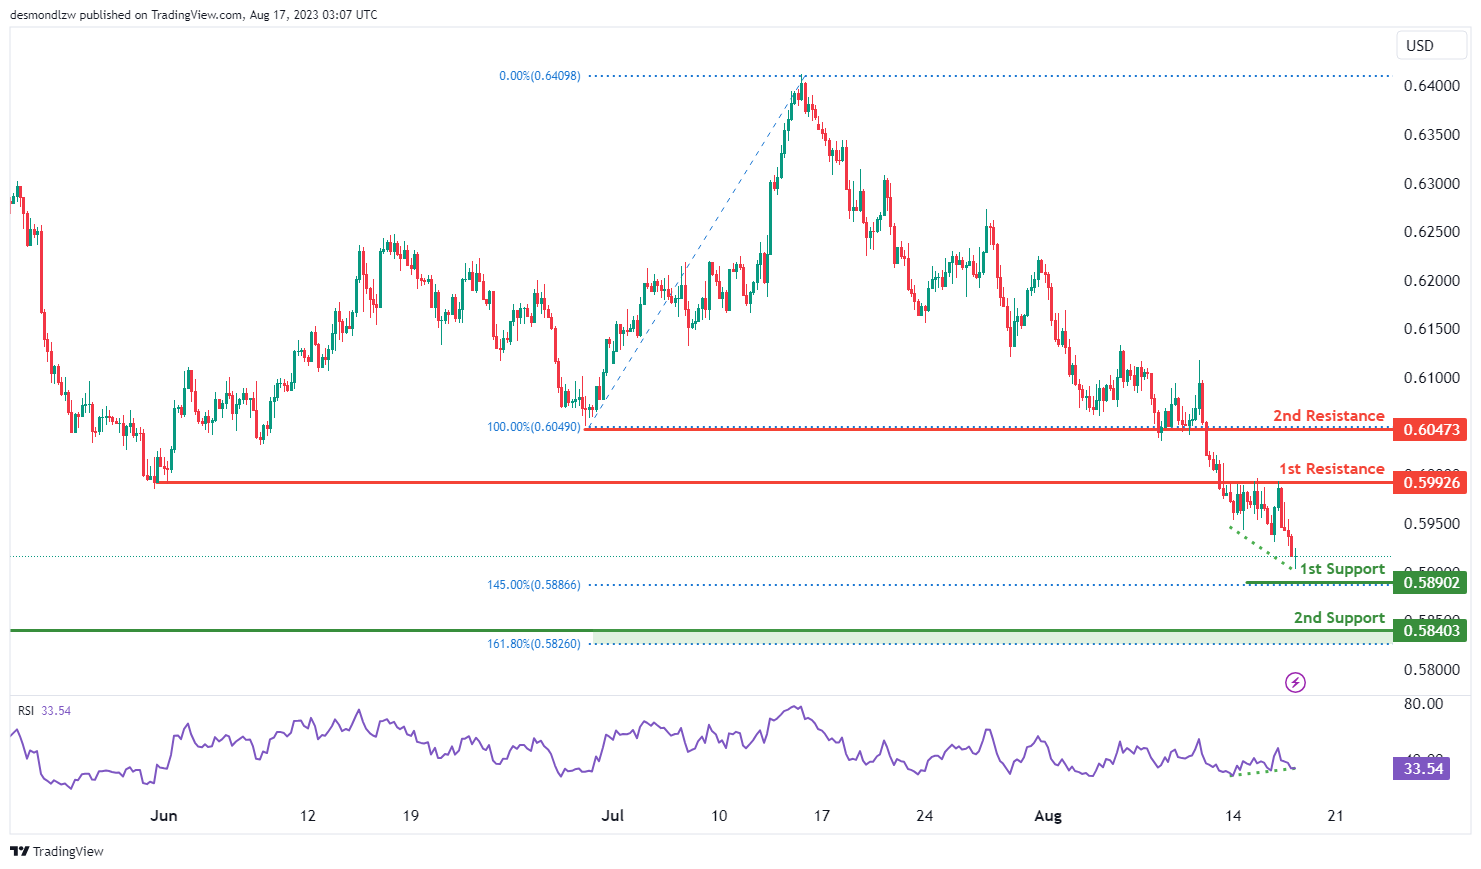
The current trend in the NZD/USD chart shows a weak bullish movement with low confidence. There is potential for the price to continue its upward movement towards the 1st resistance level at 0.5993. Additionally, the RSI indicator shows bullish divergence, suggesting a potential bounce in the near future.
The 1st support at 0.5890 is supported by the presence of the 145.00% Fibonacci extension level while the 2nd support at 0.5840 is supported by the presence of the 161.80% Fibonacci extension level.
To the upside, the 1st resistance at 0.5993 is an overlap resistance level while the 2nd resistance at 0.6047 is also identified as an overlap resistance.
DJ30:
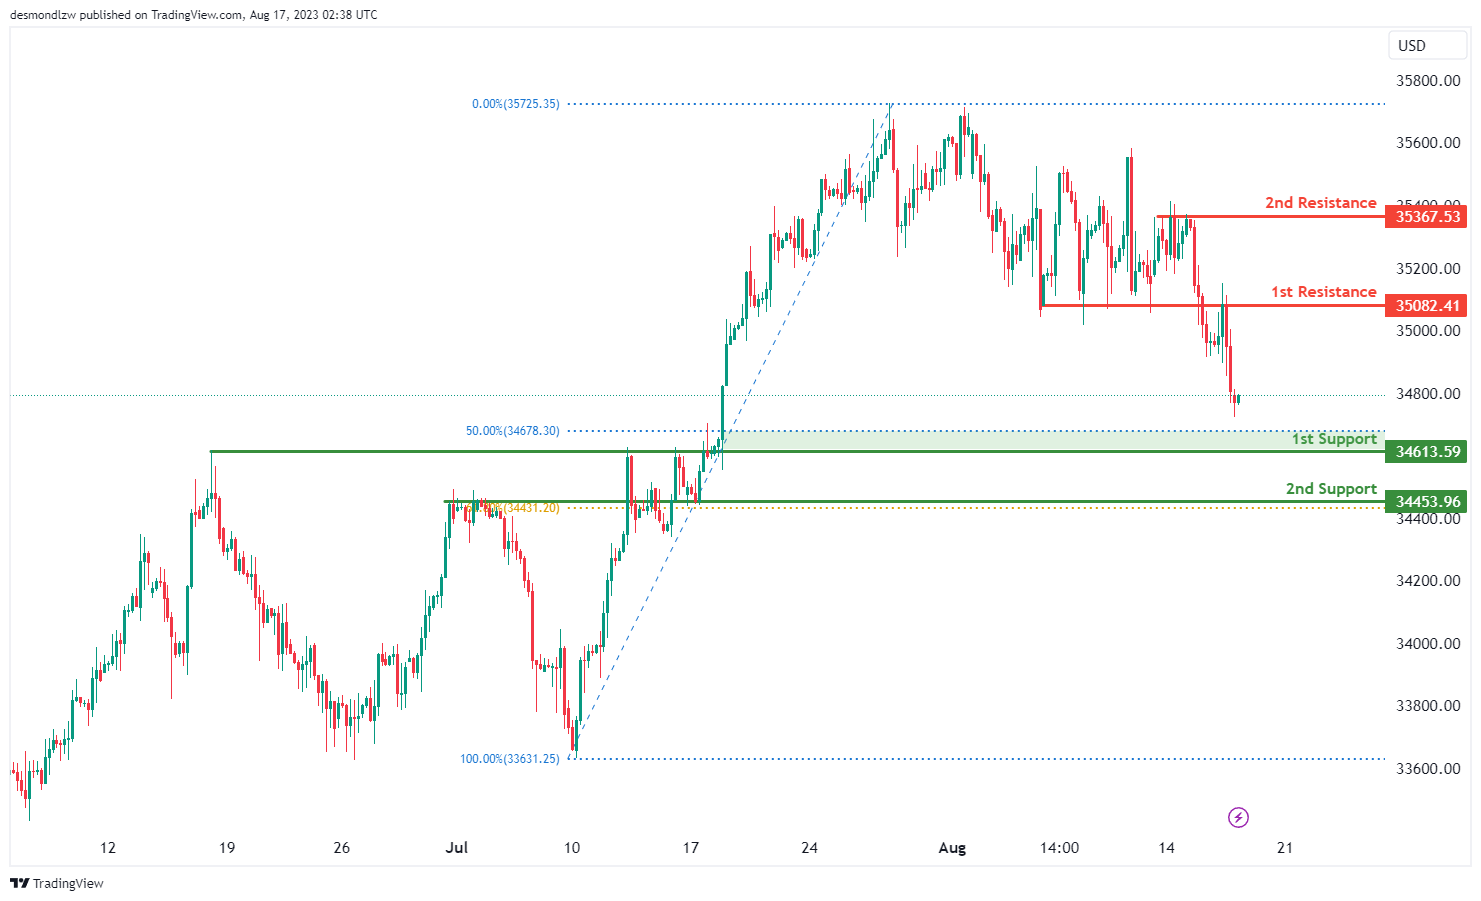
The DJ30 chart displays a bearish overall momentum. There is a potential for a bearish continuation towards the 1st support level. The 1st support is positioned at 34613.59 and is considered advantageous due to its pullback support, as well as a Fibonacci confluence of a 50% Fibonacci Retracement and a 100% Fibonacci Projection.
Additionally, the 2nd support at 34453.96 is also seen as a valuable level due to its overlap support and a 61.80% Fibonacci Retracement.
On the resistance side, the 1st resistance level at 35082.41 is notable as it represents a pullback resistance. Moreover, the 2nd resistance at 35367.53 is also significant due to its multi-swing high resistance characteristics.
GER30:
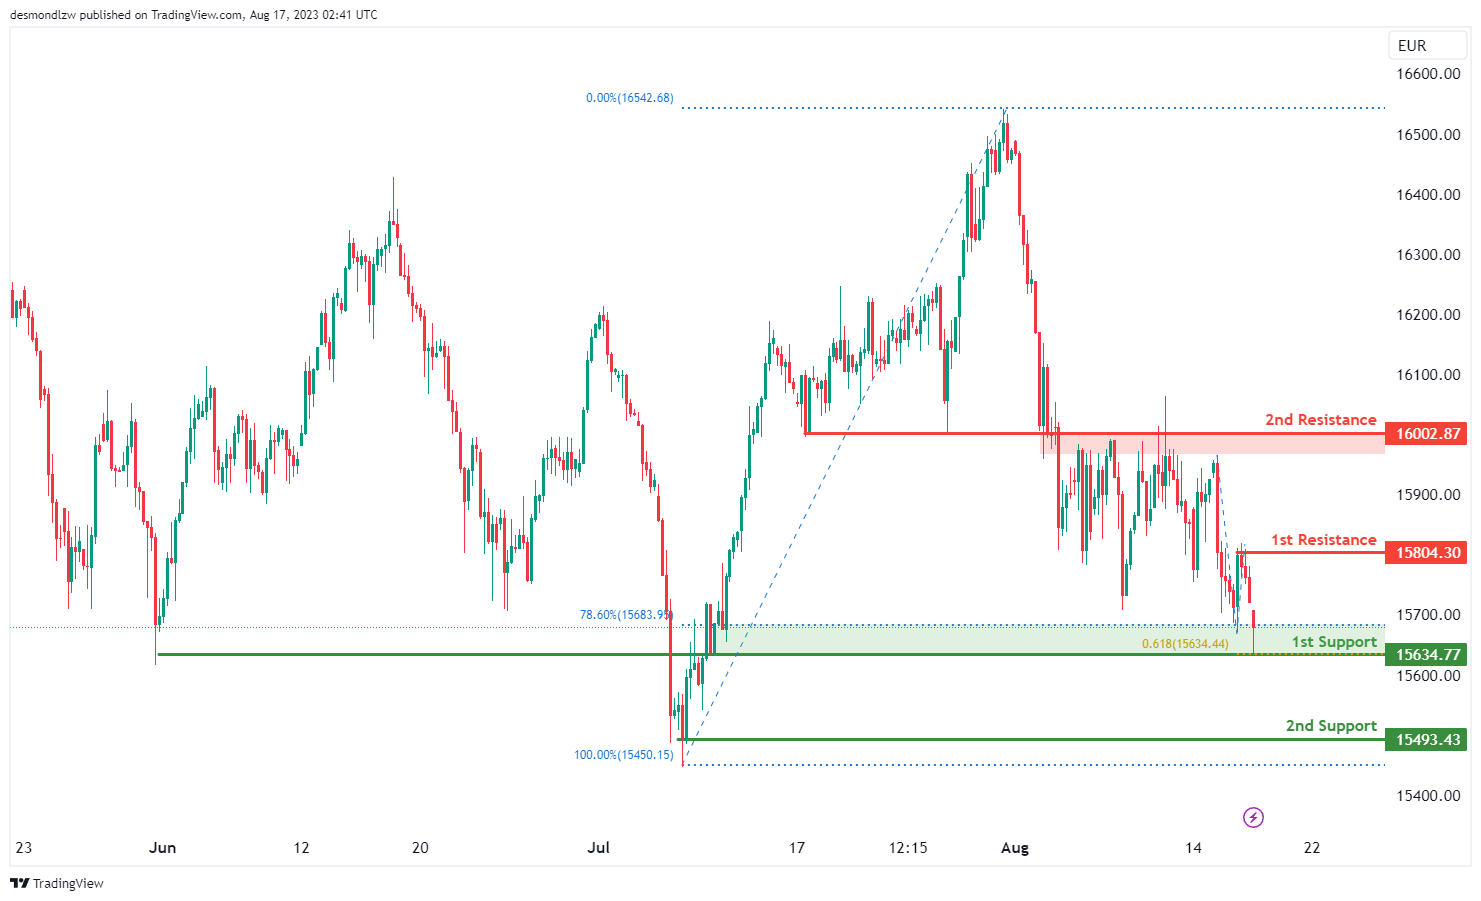
The GER30 chart indicates a bullish overall momentum. There is a potential for a bullish bounce off the 1st support level, leading towards the 1st resistance.
The 1st support is positioned at 15634.77 and is considered favorable due to its overlap support, along with a Fibonacci confluence of a 78.60% Fibonacci Retracement and a 61.80% Fibonacci Projection.
Furthermore, the 2nd support at 15493.43 is viewed as a valuable level due to its swing low support characteristics.
On the resistance side, the 1st resistance level at 15804.30 is noteworthy as it represents an overlap resistance. Additionally, the 2nd resistance at 16002.87 is significant due to its pullback resistance characteristics.
US500
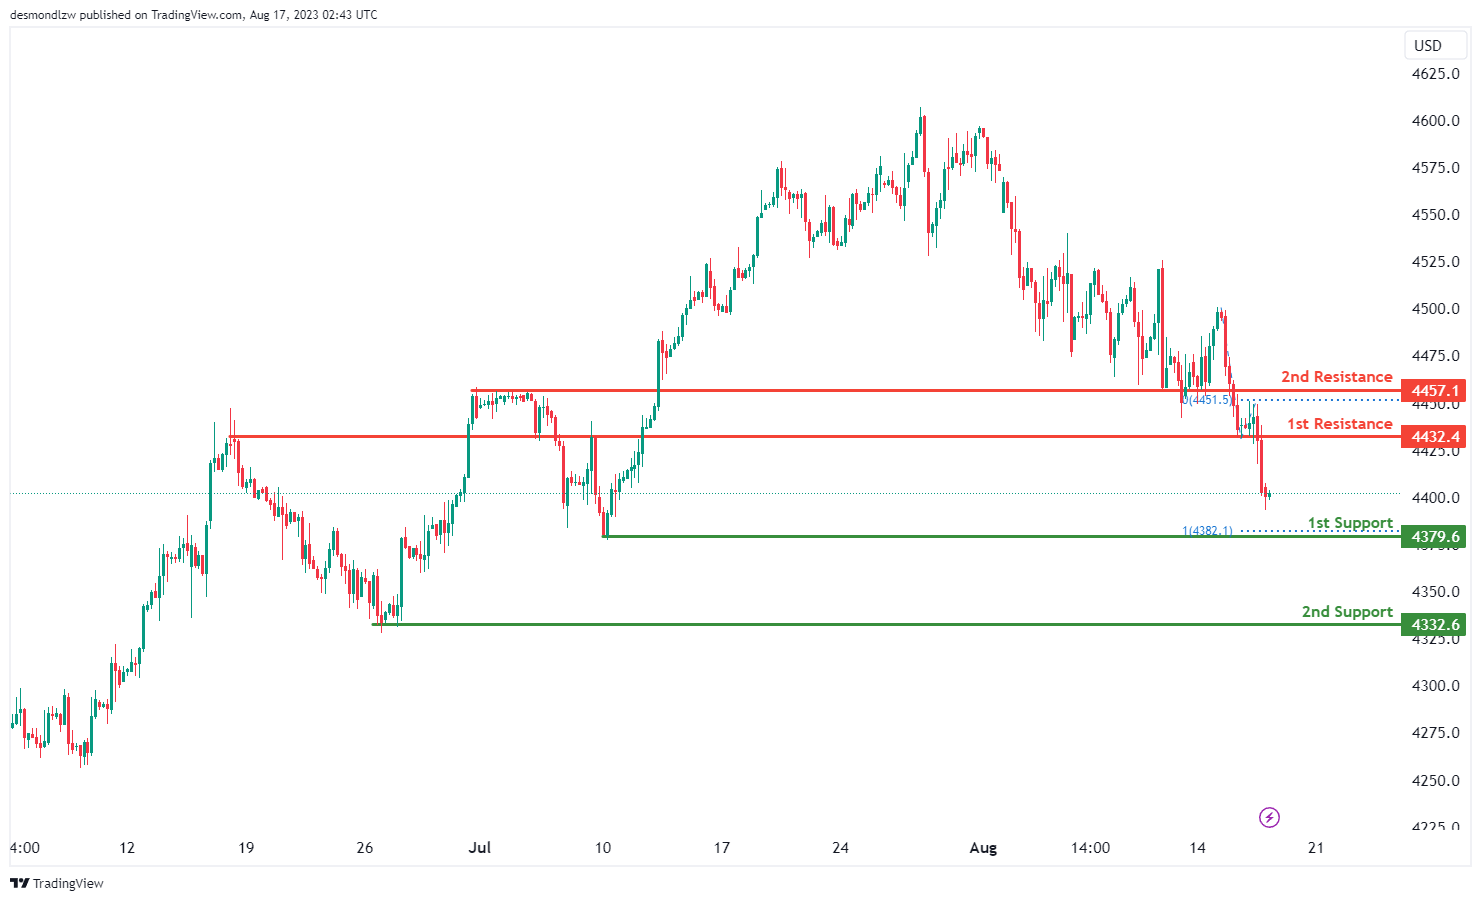
The US500 chart indicates a bearish overall momentum. There is a potential for a bearish continuation towards the 1st support level. The 1st support is situated at 4379.6 and is considered advantageous due to its swing low support characteristics, accompanied by a 100% Fibonacci Projection.
Furthermore, the 2nd support at 4332.6 is also considered a valuable level because of its swing low support characteristics.
On the resistance side, the 1st resistance level at 4432.4 is noteworthy as it represents an overlap resistance. Additionally, the 2nd resistance at 4457.1 is also significant due to its overlap resistance characteristics.
BTC/USD:
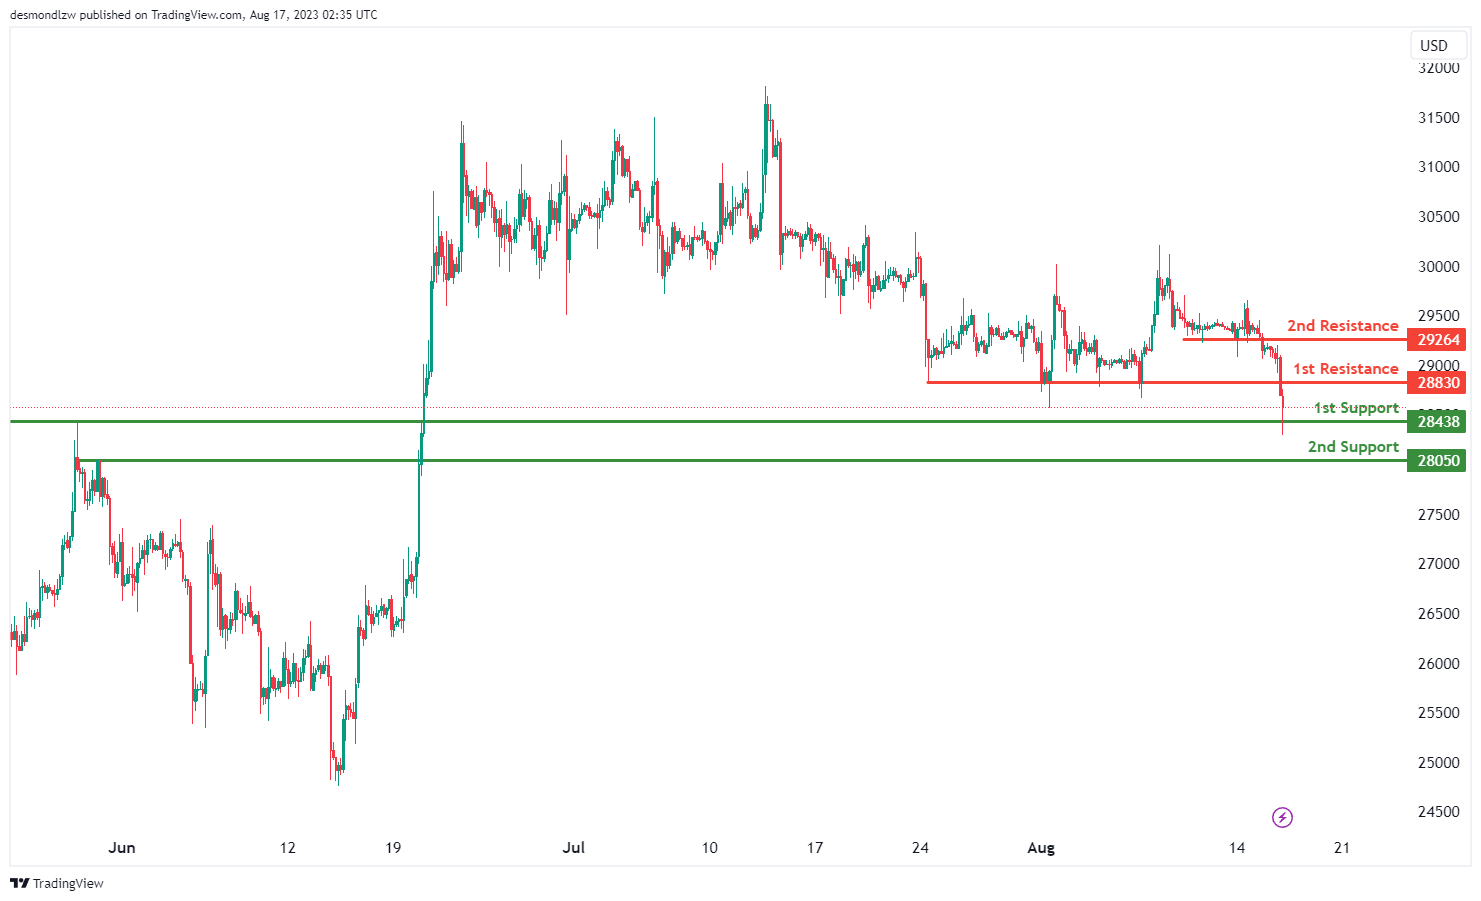
The BTC/USD chart displays a bearish overall momentum. There is a potential for a bearish continuation towards the 1st support level. The 1st support is situated at 28438 and is considered significant due to its overlap support characteristics. Furthermore, the 2nd support at 28050 is viewed as advantageous because it represents a pullback support.
On the resistance side, the 1st resistance level at 28830 is notable as it presents a pullback resistance. Additionally, the 2nd resistance at 29264 is also considered significant due to its pullback resistance characteristics.
ETH/USD:
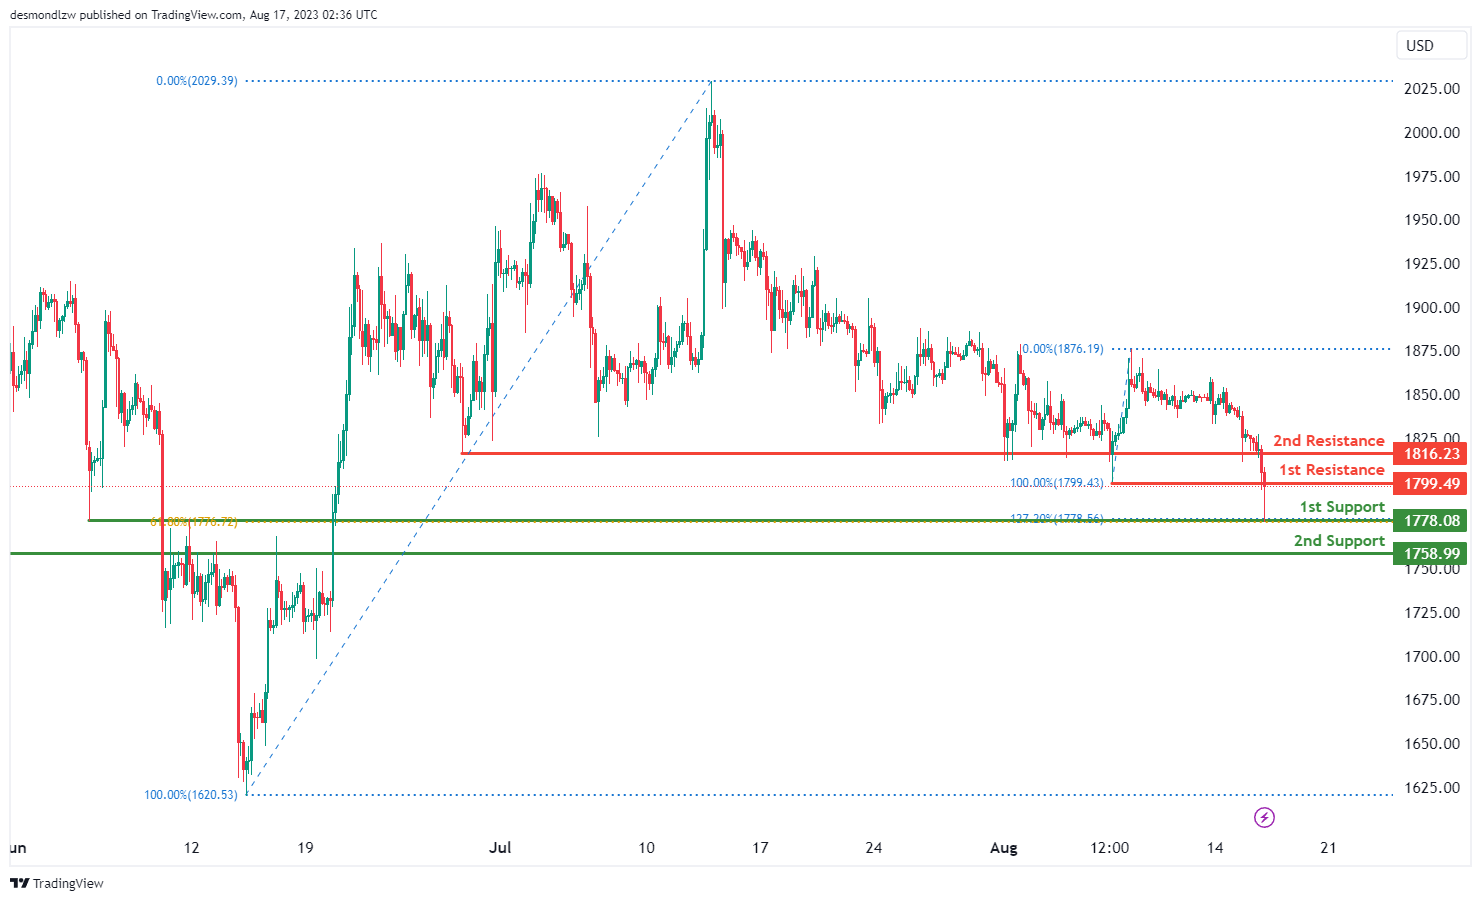
The ETH/USD chart shows a bearish overall momentum. There is a potential for a bearish continuation towards the 1st support level. The 1st support is positioned at 1778.08 and is considered favorable due to its overlap support, along with a Fibonacci confluence of a 127.20% Fibonacci Extension and a 61.80% Fibonacci Retracement.
Furthermore, the 2nd support at 1758.99 is also considered good due to its overlap support characteristics.
On the resistance side, the 1st resistance level at 1799.49 is noteworthy as it represents a pullback resistance. Additionally, the 2nd resistance at 1816.23 is also seen as significant due to its pullback resistance characteristics.
WTI/USD:
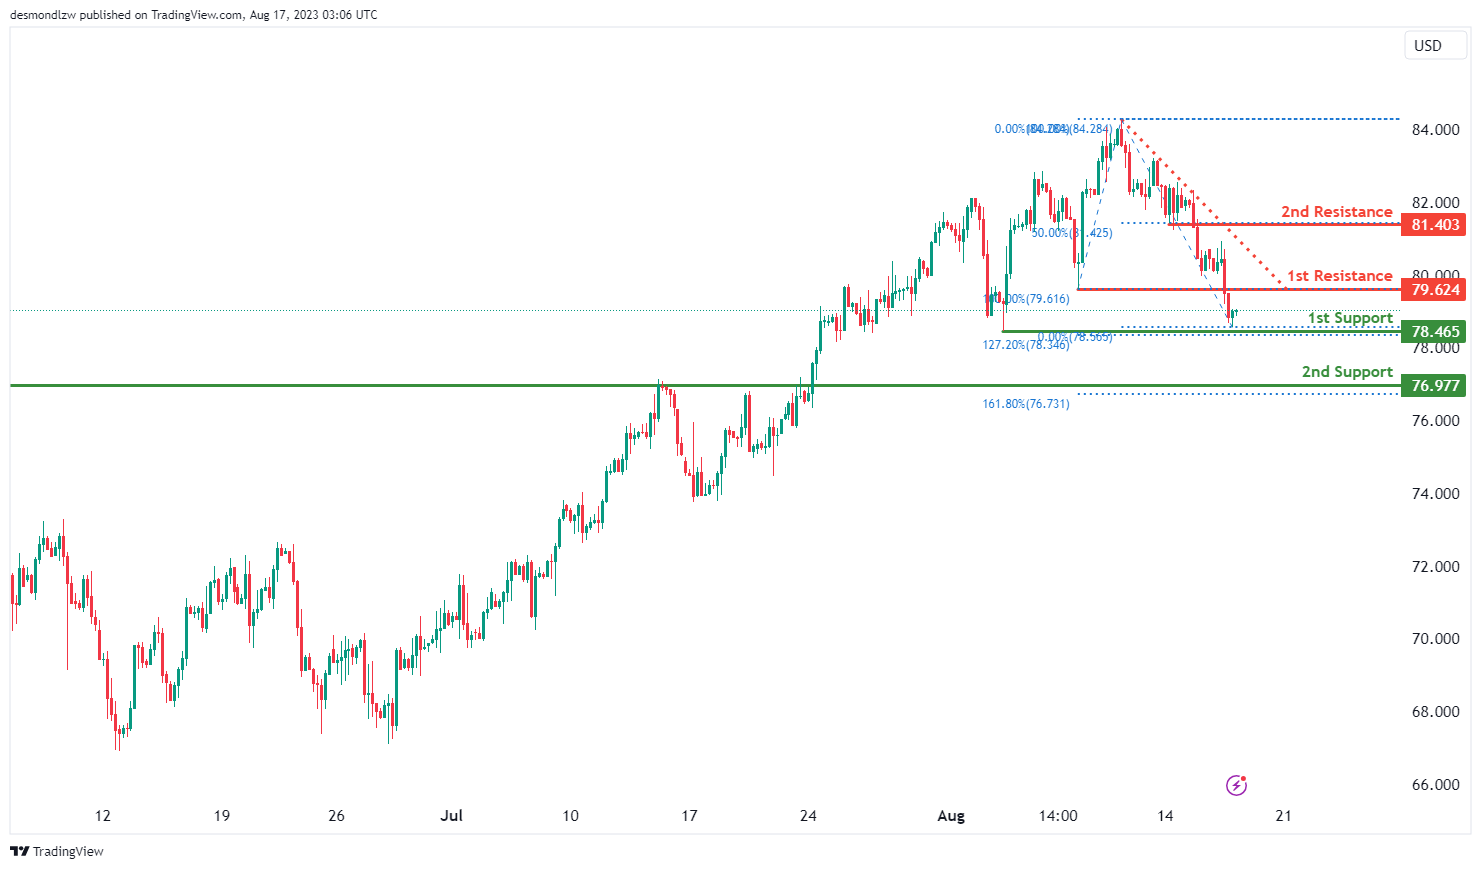
The WTI/USD chart is currently displaying a neutral momentum, indicating a lack of clear directional trend. There is a potential scenario where the price could fluctuate between the 1st resistance and the 1st support.
The 1st support level at 78.47 is identified as an overlap support that aligns with the 127.20% Fibonacci extension level. The 2nd support at 76.98 is also identified as an overlap support that aligns with the 161.80% Fibonacci extension level.
To the upside, the 1st resistance level at 79.62 is identified as an overlap resistance while the 2nd resistance at 81.40 is identified as a pullback resistance that aligns with the 50.00% Fibonacci retracement level.
XAU/USD (GOLD):
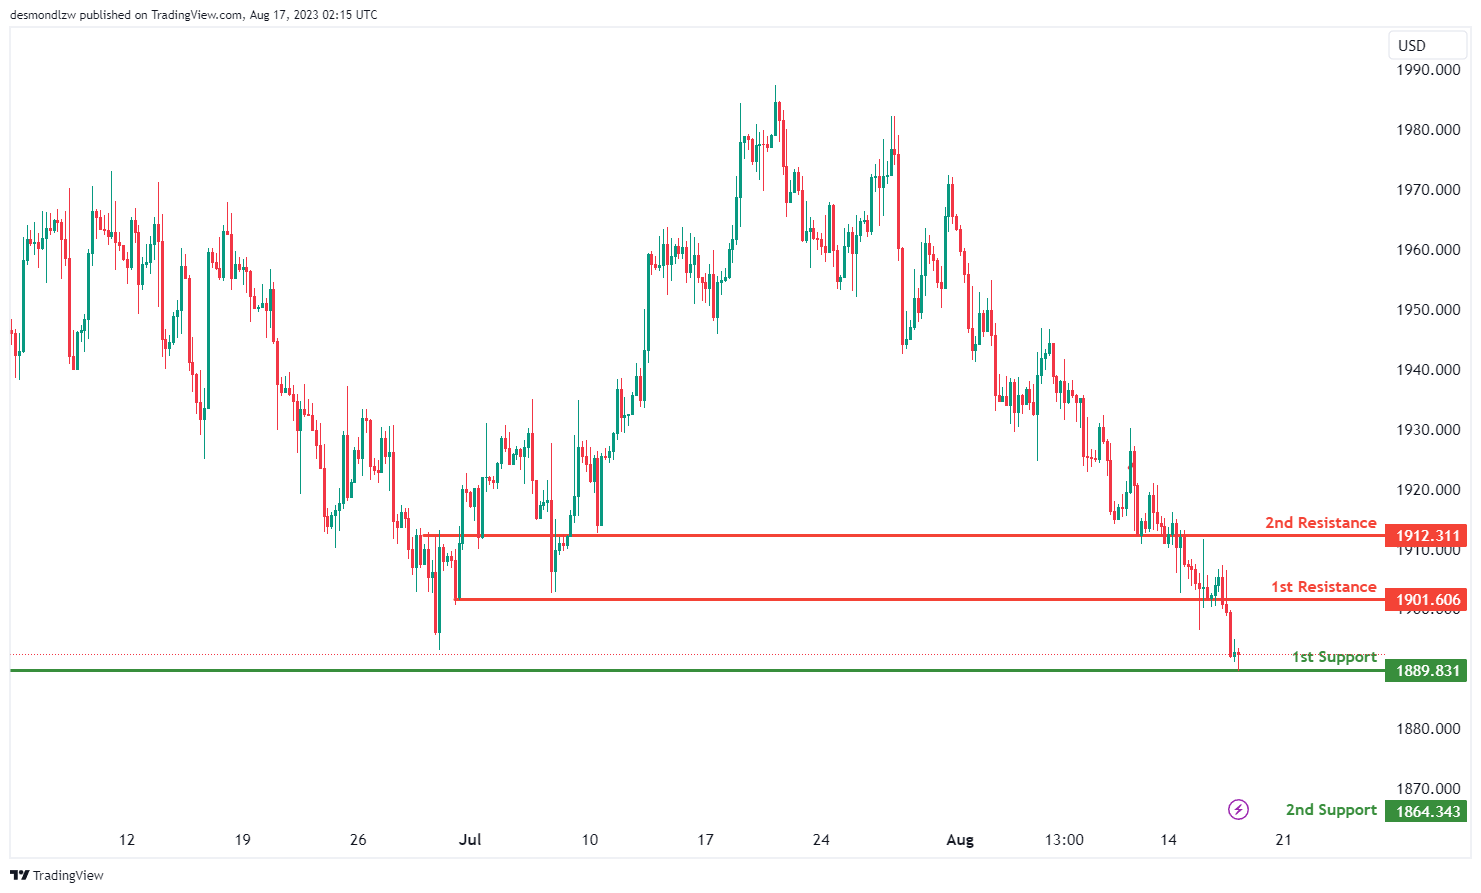
The XAU/USD chart currently demonstrates a bullish momentum, indicating a prevailing upward trend.
Within this context, a potential scenario involves a bullish bounce off the 1st support level at 1896.25, categorized as an overlap support. This bounce could potentially lead the price towards the 1st resistance level at 1901.60, which is considered a pullback resistance.
The 2nd support at 1864.34 is noted as a pullback support, reinforcing the overall support structure. Similarly, the 2nd resistance at 1912.31 is identified as an overlap resistance, further enhancing its potential significance as a barrier to further upward movement.
Japans’ export contracts in Jul, shipments to China fell for 8th month
Japan's exports experienced a dip of -0.3% yoy to JPY 8725B in July. This contraction is noteworthy as it breaks a growth streak that has lasted for over two years since February 2021.
Diving deeper into the data, while shipments to US and Europe saw a positive trajectory with respective rises of 13.5% yoy and 12.4% yoy, the trade dynamics with China narrated a different story.
Exports to China, Japan's primary trading ally, plummeted by -13.4%, marking the steepest decline since January. Notably, this reflects an ongoing trend with shipments to China diminishing for the eighth consecutive month, subsequent to a -10.9% yoy drop in June.
On the import front, Japan registered a decline of -13.5% yoy to JPY 8804B. This marks the fourth consecutive month of declining imports and is the most significant dip since September 2020. The downturn can be partly attributed to the decreasing commodities prices.
With imports exceeding exports, trade balance for the month ended in a deficit of JPY -78.7B.
When observing the figures in seasonally adjusted terms, both exports and imports displayed a 2.0% mom rise, amounting to JPY 8460B and JPY 9018B respectively. Consequently, trade deficit widened slightly, reaching JPY -557B.