Sample Category Title
EUR/AUD Daily Outlook
Daily Pivots: (S1) 1.6785; (P) 1.6849; (R1) 1.6956; More...
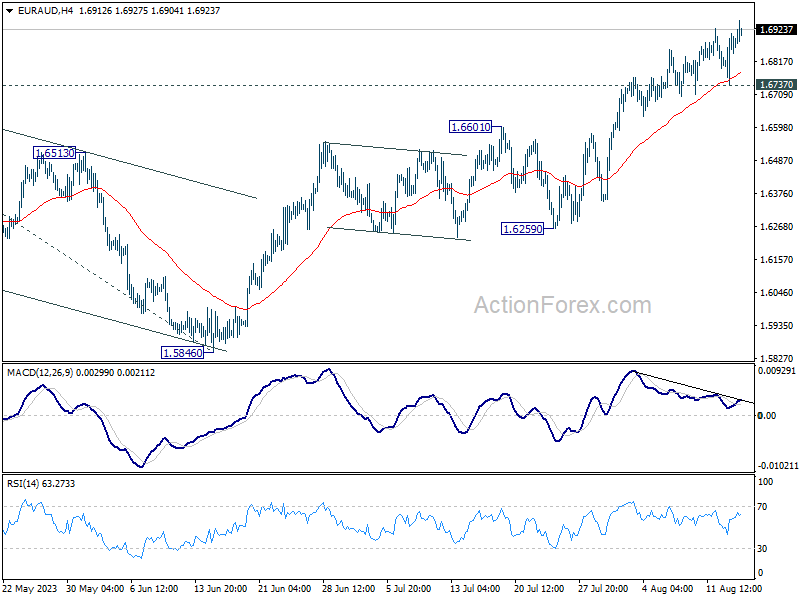
EUR/AUD's rally continues today and intraday bias remains on the upside. Current rally is part of the up trend from 1.4281. Next target is 1.7377 projection level next. On the downside, break 1.6737 minor support will intraday bias neutral and bring consolidations first, before staging another rise.
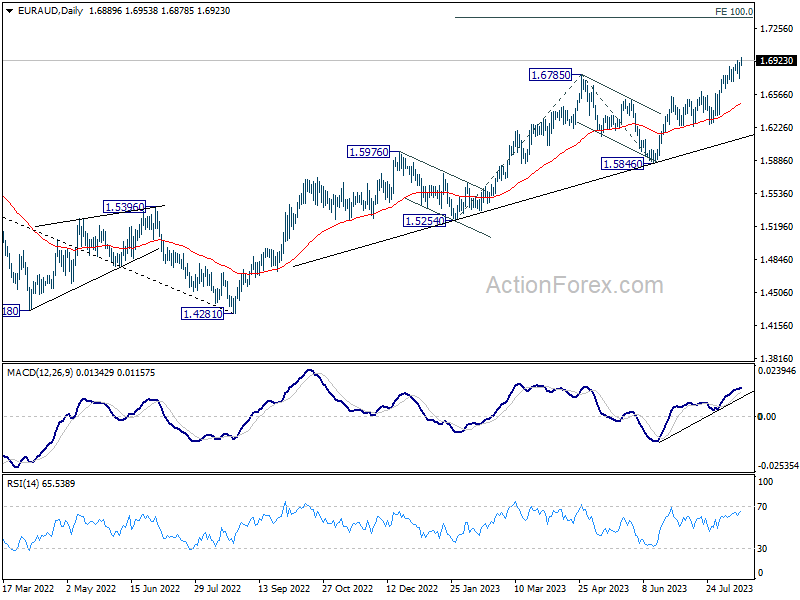
In the bigger picture, the rise from 1.4281 (2022 low) is in progress. Next target is 100% projection of 1.5254 to 1.6785 from 1.5846 at 1.7377. For now, outlook will stay bullish as long as 1.5846 support holds, even in case of another pull back.
EUR/CHF Daily Outlook
Daily Pivots: (S1) 0.9566; (P) 0.9581; (R1) 0.9595; More...
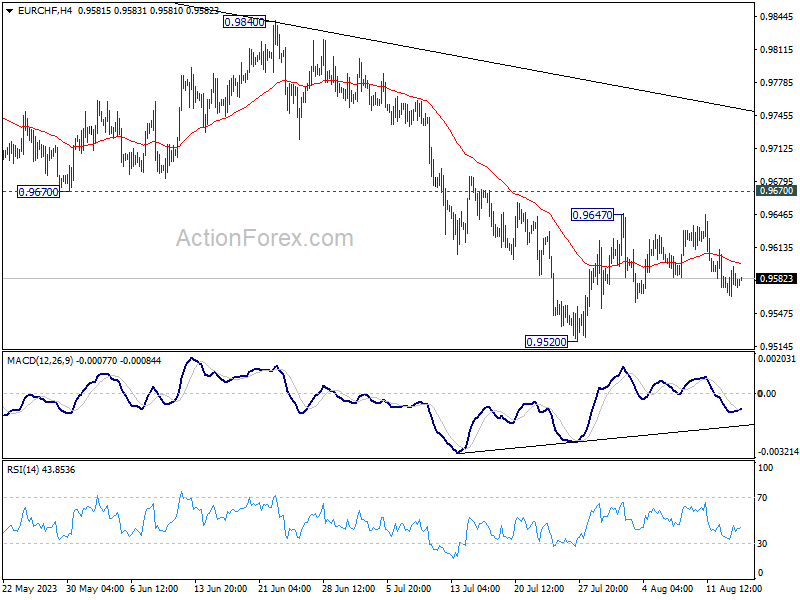
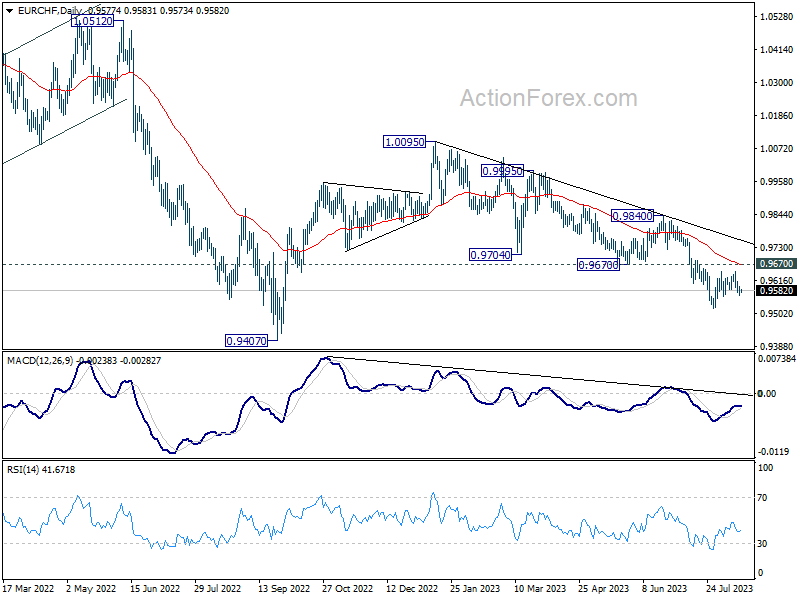
EUR/CHF is staying in established range and intraday bias remains neutral for the moment. On the upside, break of 0.9647 will resume the rebound from 0.9520. Further sustained break of 0.9670 will be the first sign of bullish reversal and target 0.9840 resistance for confirmation. On the downside, break of 0.9520 will resume the whole fall from 1.0095 towards 0.9407 low.
In the bigger picture, medium term outlook is staying bearish as the pair is capped well below falling 55 W EMA (now at 0.9859). Down trend from 1.2004 (2018 high) is in favor to continue. Sustained break of 0.9407 will target 61.8% projection of 1.1149 to 0.9407 from 1.0095 at 0.9018. For now, this will remain the favored case as long as 0.9840 resistance holds, in case of strong rebound.
Silver (XAGUSD) Short Term Bearish Structure
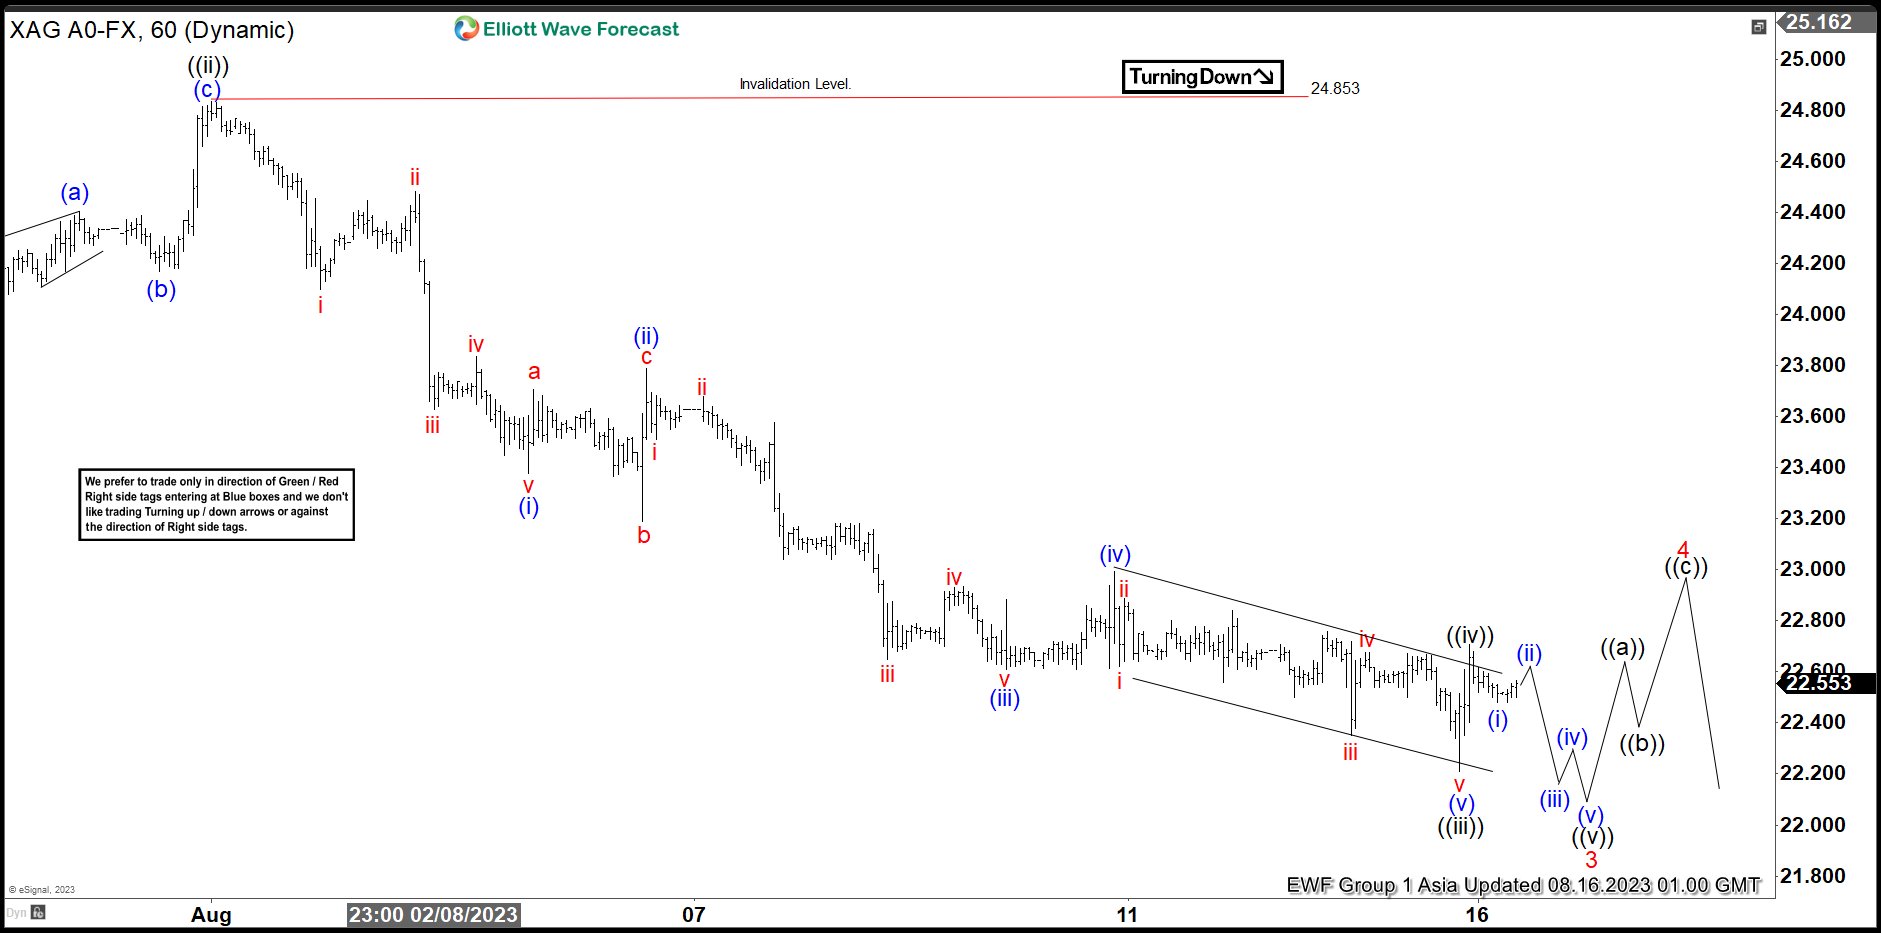
Silver (XAGUSD) cycle from 5.5.2023 high remains in progress with extreme area target of 18.78 – 21.26. Near term, cycle from 7.27.2023 high is in progress as a 5 waves impulse Elliott Wave structure. Down from 7.27.2023 peak, wave ((i)) ended at 24.03 and wave ((ii)) rally ended at 24.85. The 1 hour chart below shows the wave ((ii)) starting point. The metal then extended lower in wave ((iii)). Down from wave ((ii)), wave (i) ended at 23.37 and rally in wave (ii) ended at 23.78. The metal extended lower in wave (iii) towards 22.6 and rally in wave (iv) ended at 23. Final leg wave (v) ended at 22.21 which completed wave ((iii)).
Corrective bounce in wave ((iv)) is proposed complete at 22.70. Expect the metal to extend lower in wave ((v)) to complete wave 3 in higher degree. Afterwards, it should rally in wave 4 to correct cycle from 7.27.2023 high before it resumes lower again. As far as pivot at 24.85 high stays intact, expect wave 4 rally to fail in 3, 7, or 11 swing for further downside in wave 5. Potential target lower is the extreme area from 5.5.2023 peak at 18.78 – 21.26 where buyers should appear.
XAGUSD 60 Minutes Elliott Wave Chart
XAGUSD (Silver) Elliott Wave Video
https://www.youtube.com/watch?v=hCyF-FcsnhQ
Technical Outlook and Review
DXY:
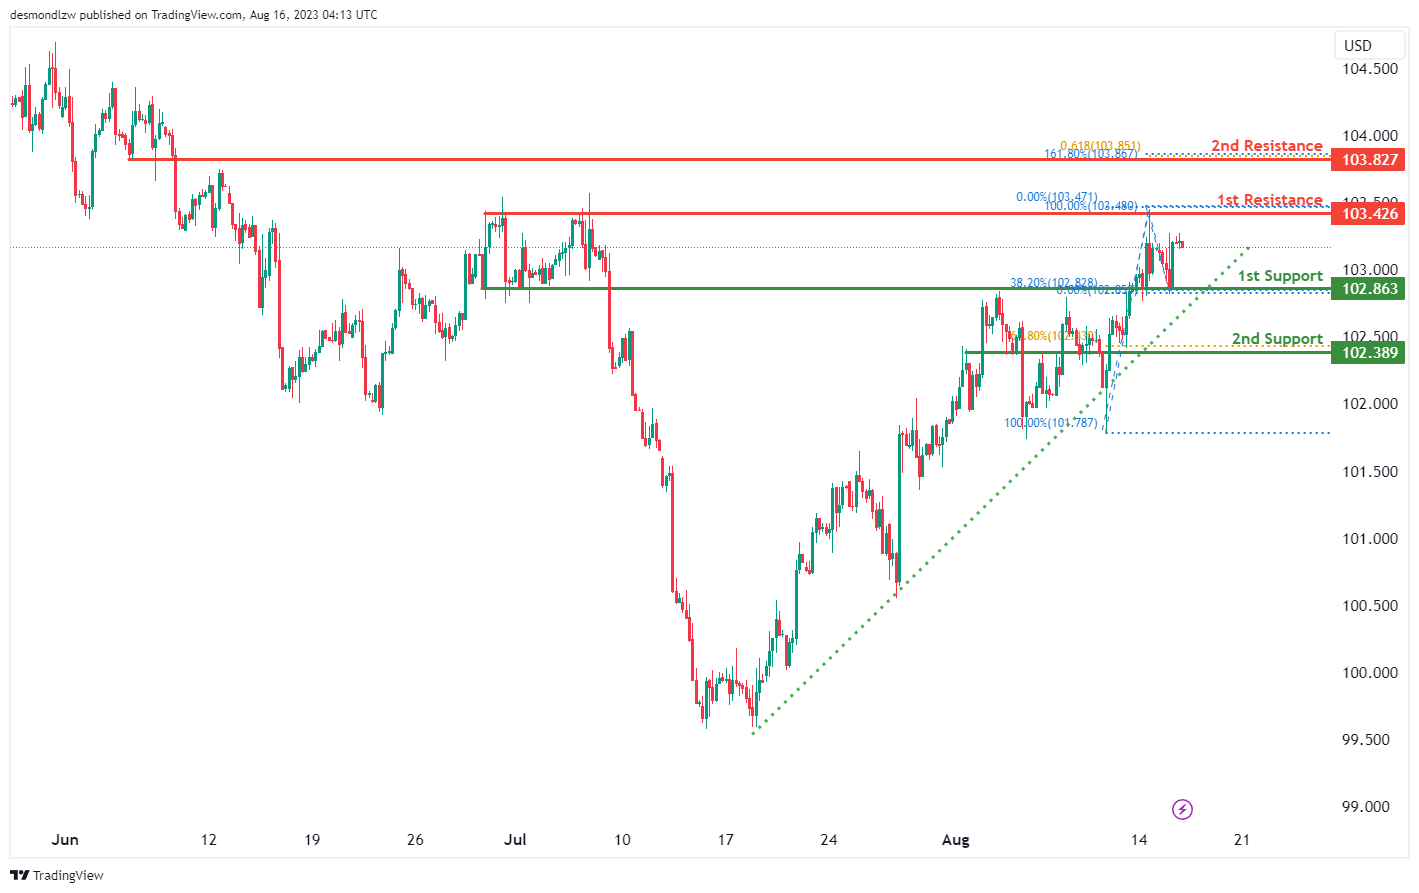
The current trend of the DXY indicates a bullish sentiment, supported by its position above a major ascending trend line. This suggests that there may be further upward momentum in the future.
There is a possibility that the price will initially decline towards the 1st support level at 102.86. This support level is significant as it is an overlap support and also corresponds to the 38.20% Fibonacci retracement level.
In the event of a rebound, the 1st resistance level at 103.42 is notable as it is an overlap resistance. Additionally, the 2nd resistance at 103.82 is also a point of confluence, marked by the presence of both a 161.80% Fibonacci Extension and a 61.80% Fibonacci Projection.
Overall, the chart signals potential for further bullish movement but a downside correction is also a possibility before the upward movement resumes.
EUR/USD:
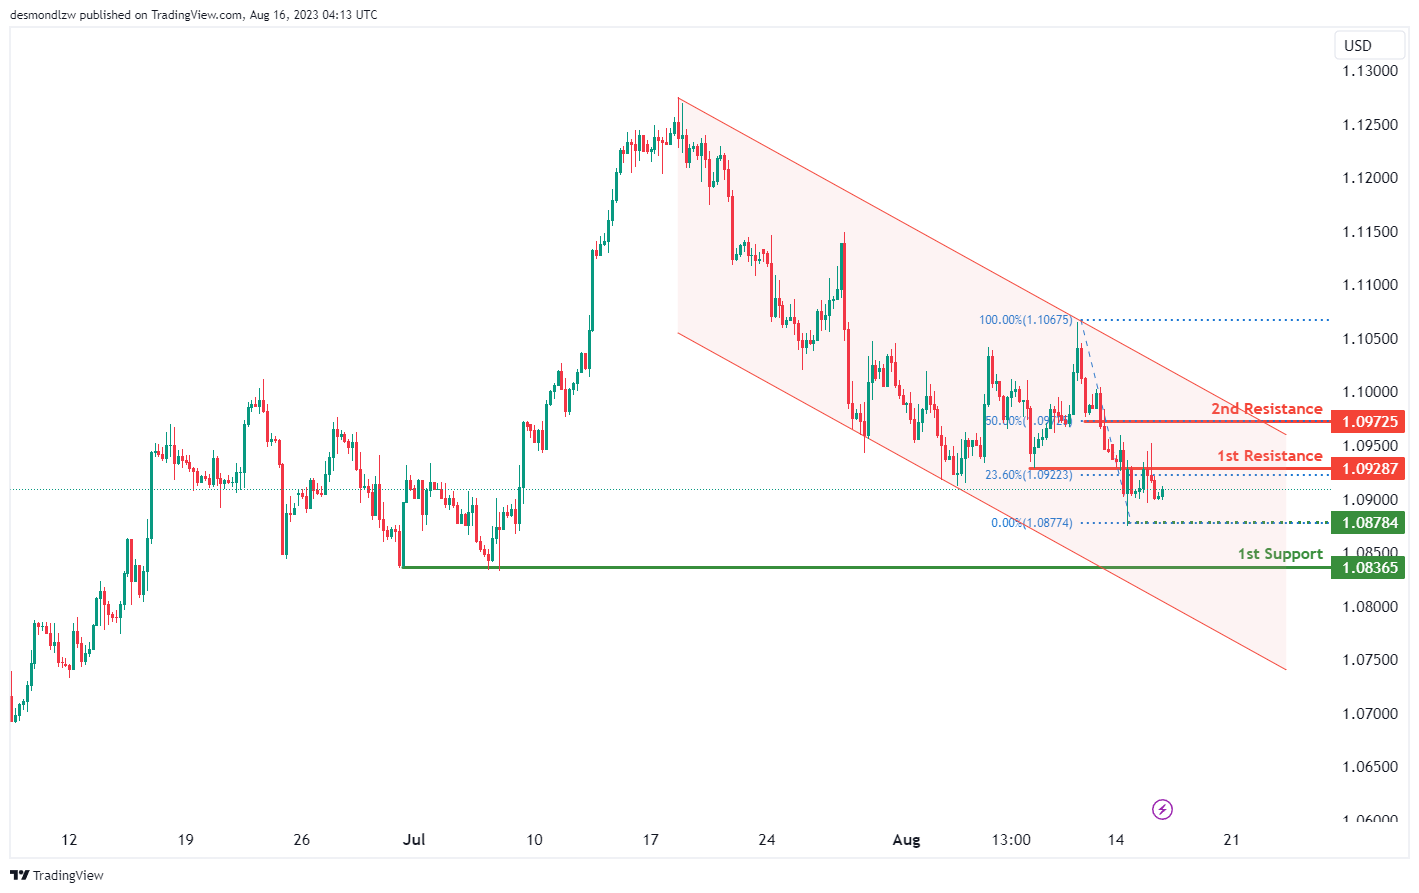
The EUR/USD chart currently exhibits a bearish momentum, evident by its position within a descending channel. This bearish channel pattern implies a potential continuation of the downward movement due to the prevailing bearish trend.
Considering this bearish sentiment, there’s a possibility of a bearish reaction occurring as the price reaches the 1st resistance level at 1.0928, followed by a potential drop towards the 1st support at 1.0836. This support level gains significance as it aligns with a multi-swing low point.
Additionally, an intermediate support level at 1.0878, corresponding to a swing low support, further reinforces the potential for a support zone.
Conversely, the presence of the 1st resistance at 1.0928 is notable due to its classification as an overlap resistance and its alignment with the 23.60% Fibonacci retracement level. Furthermore, a 2nd resistance level at 1.0972 holds significance as it corresponds to the 50% Fibonacci retracement, adding to its potential as a resistance level.
EUR/JPY:
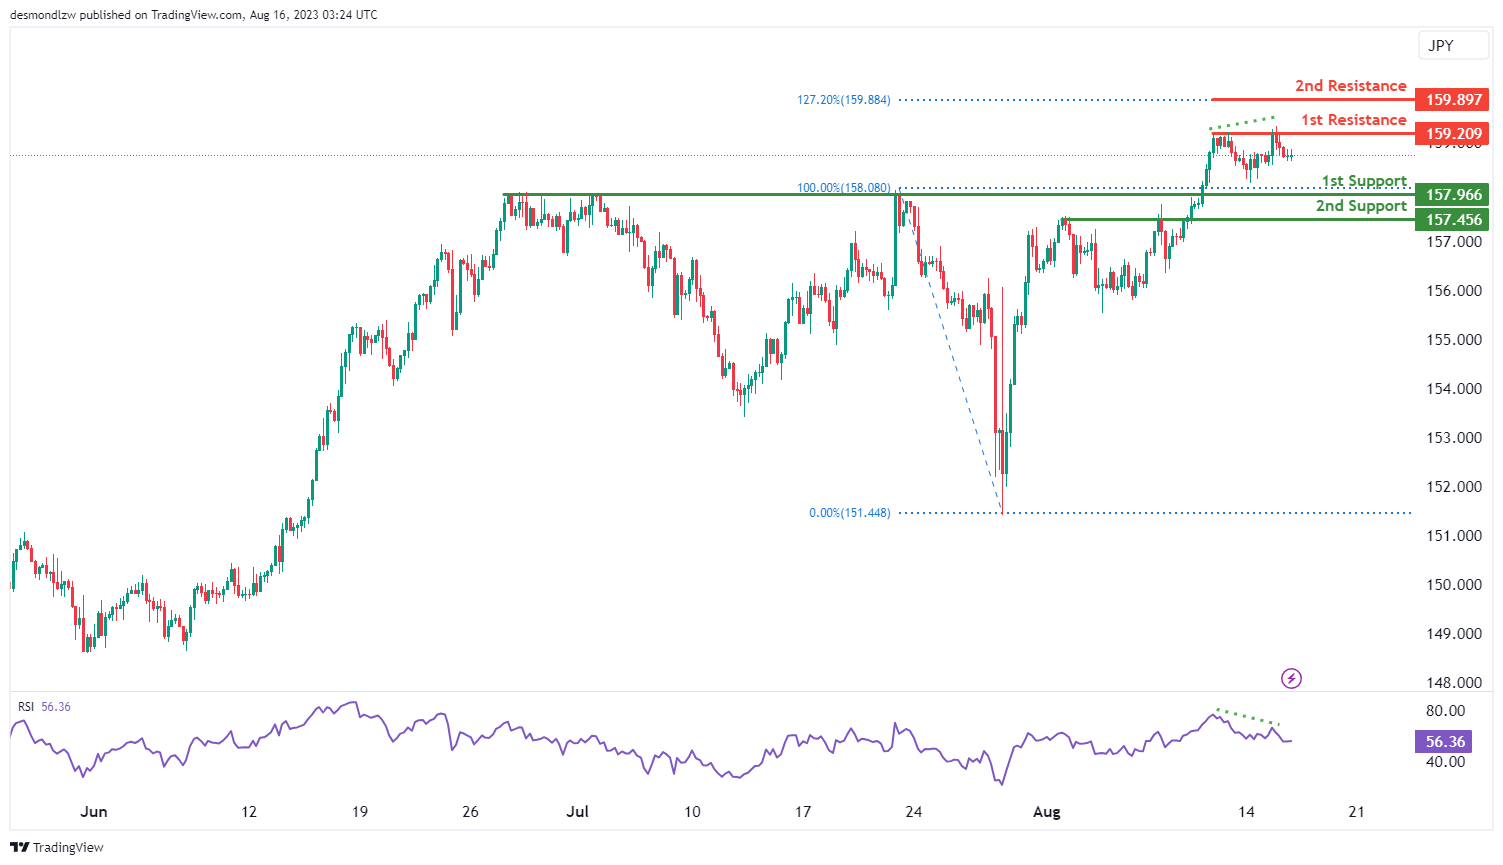
The EUR/JPY chart currently indicates a bearish momentum, implying the potential for further downward movement. It’s conceivable that the price could experience a bearish continuation towards the 1st support level at 157.96. This support level gains significance as a pullback support, potentially influencing price action.
Additionally, the 2nd support at 157.45 further reinforces the potential for a downward move. On the resistance side, the 1st resistance at 159.20 holds importance as a multi-swing high resistance level. The 2nd resistance at 159.89 is notable due to its alignment with a 127.20% Fibonacci extension, adding to its potential impact.
Moreover, the Relative Strength Index (RSI) is exhibiting bearish divergence compared to the price, suggesting a possible upcoming reversal. This could indicate a shift in momentum from the current bearish trend.
EUR/GBP:
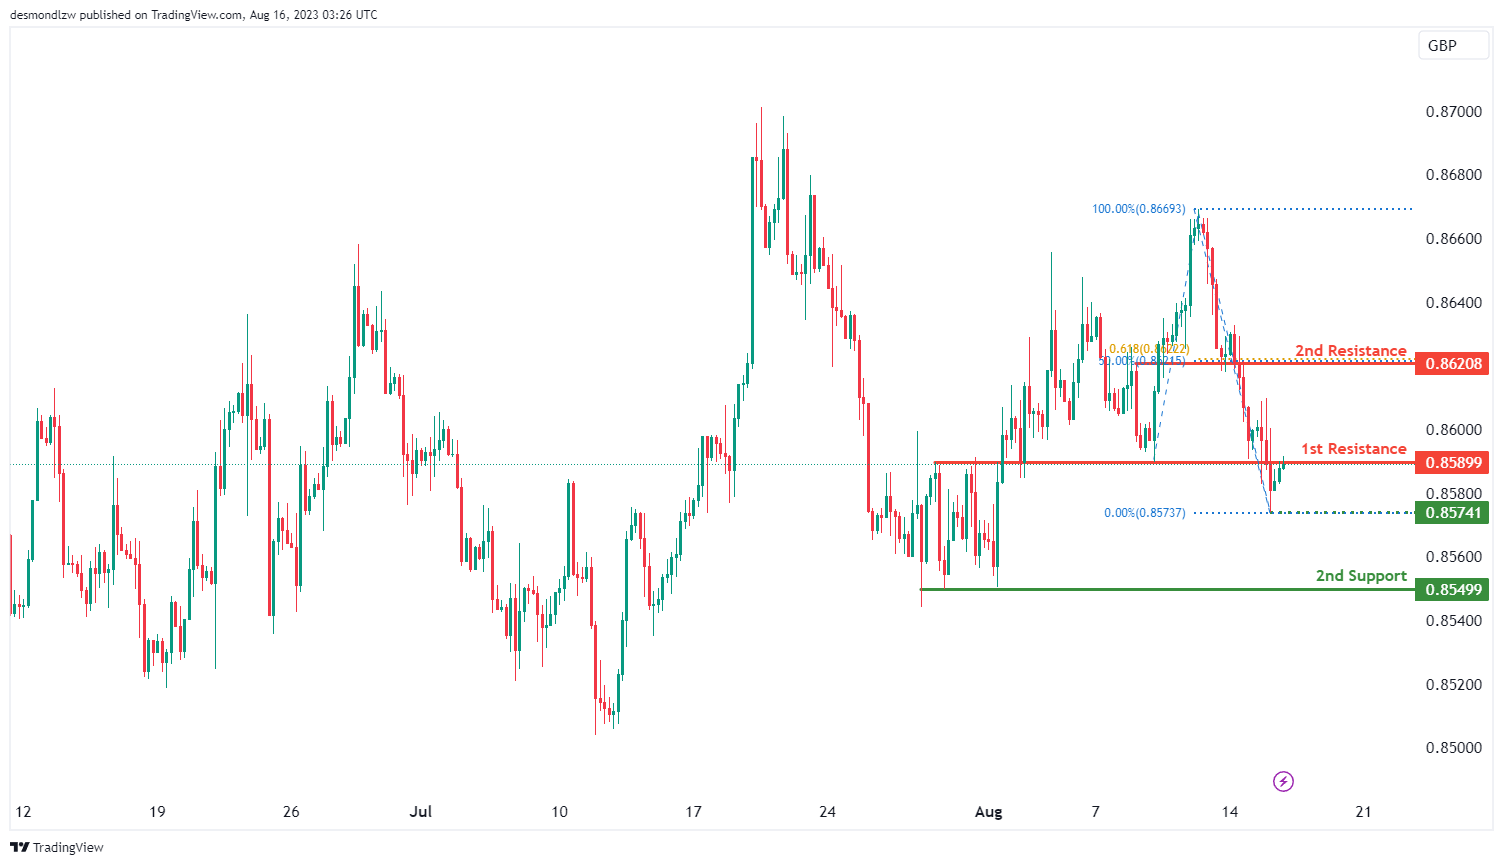
The EUR/GBP chart currently reflects a bearish momentum, indicating a potential downward trend. Given this momentum, there is a possibility of a bearish reaction occurring upon reaching the 1st resistance level, followed by a potential drop towards the 1st support.
The 1st support level at 0.8549 is significant due to its alignment with a multi-swing low support, adding to its potential influence.
Conversely, the 1st resistance level at 0.8589 holds importance as an overlap resistance. The 2nd resistance at 0.8620 gains significance from its alignment with a 50% Fibonacci retracement and a 61.80% Fibonacci projection, suggesting a potential Fibonacci confluence.
Furthermore, an intermediate support at 0.8549 reinforces the overall support structure by aligning with a multi-swing low support.
GBP/USD:
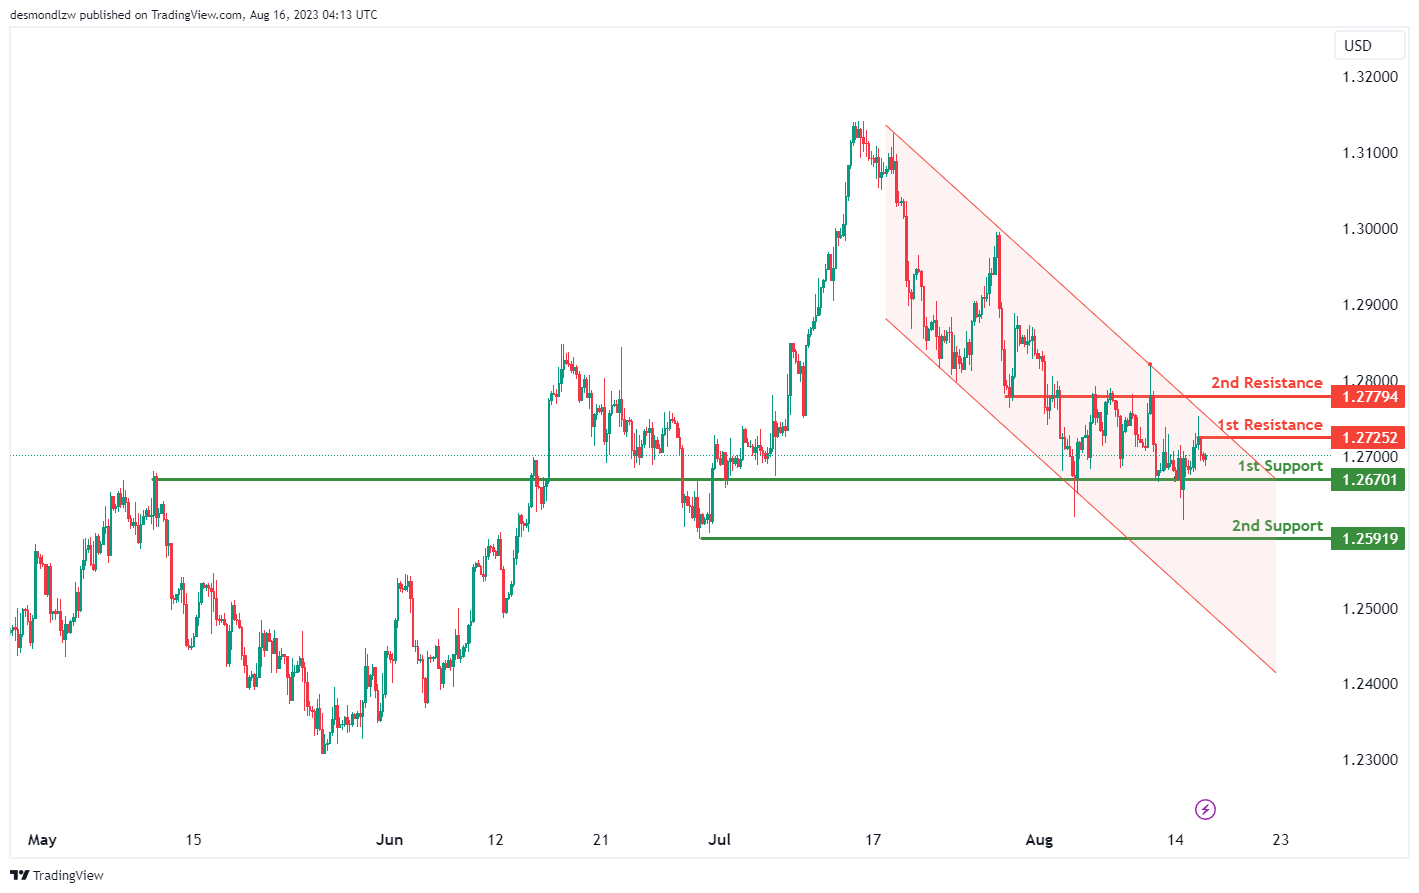
The USD/GBP chart currently demonstrates a bearish momentum, evident by its position within a descending channel. This bearish channel pattern suggests a potential continuation of the downward movement due to the existing bearish trend.
Given this bearish sentiment, there’s a likelihood of a bearish continuation as the price moves towards the 1st support level at 1.2670, potentially encountering an overlap support.
Additionally, the 2nd support level at 1.2591 adds to the support structure and gains significance as it aligns with a swing low point.
On the resistance side, the 1st resistance at 1.2725 and the 2nd resistance at 1.2779 are noteworthy. While the specific reasons for the 1st resistance are not mentioned, the 2nd resistance is categorized as an overlap resistance.
GBP/JPY:
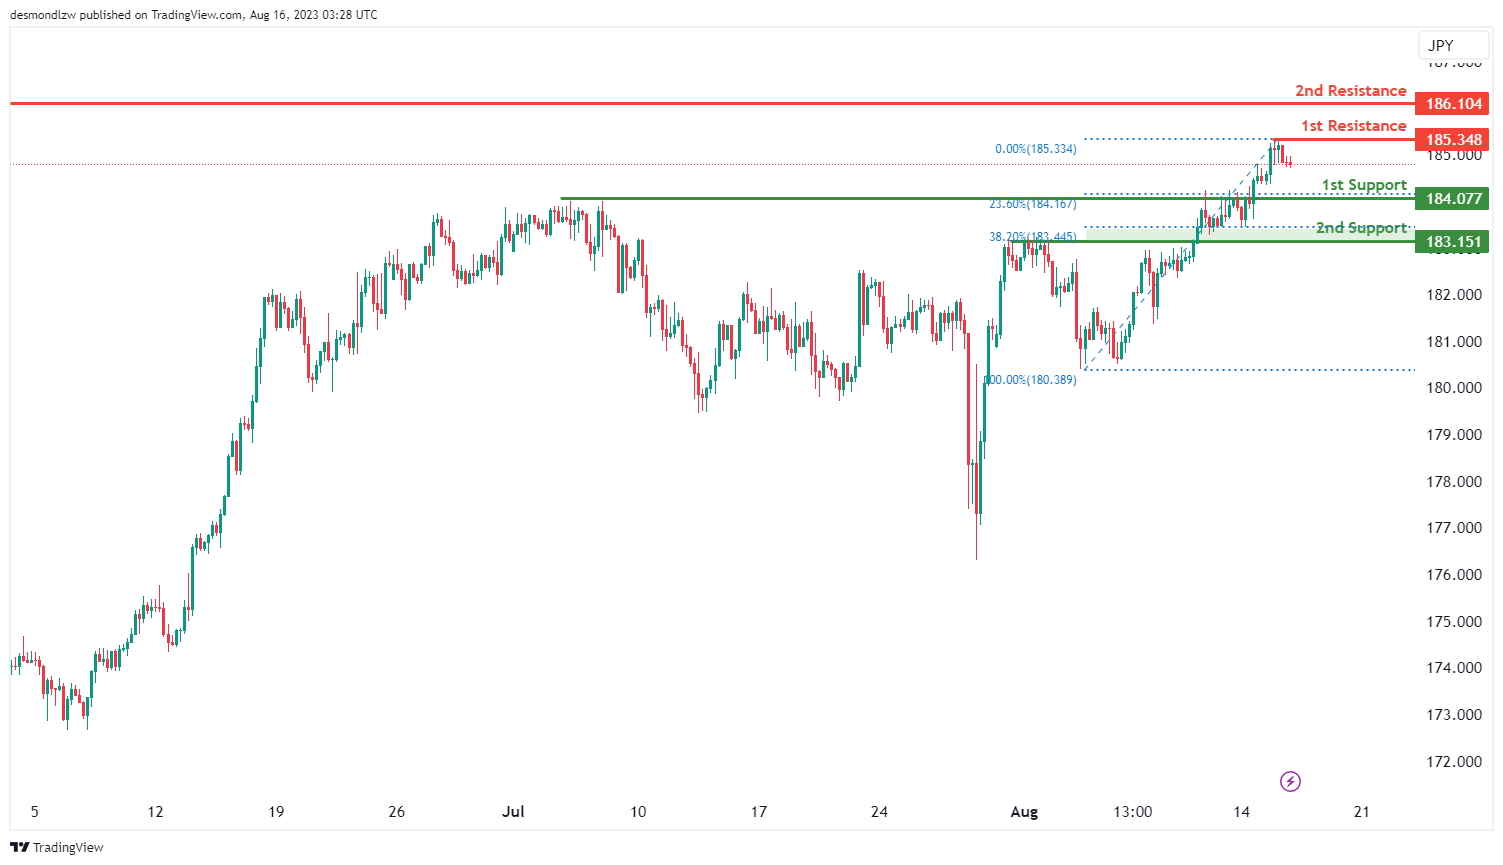
The GBP/JPY chart currently exhibits a bearish momentum, indicating a potential downward trend. In light of this momentum, there is a scenario where the price might continue its bearish movement towards the 1st support level.
The 1st support at 184.07 gains significance as a pullback support, further reinforced by its alignment with a 23.60% Fibonacci retracement. The 2nd support at 183.15 also holds importance due to its role as a pullback support, along with its alignment with a 38.20% Fibonacci retracement.
Conversely, the 1st resistance level at 185.34 is notable as a swing high resistance, and its significance is enhanced by its alignment with a 161.80% Fibonacci extension. The 2nd resistance at 186.10 carries strength as a swing high resistance, potentially influencing price movements.
USD/CHF:
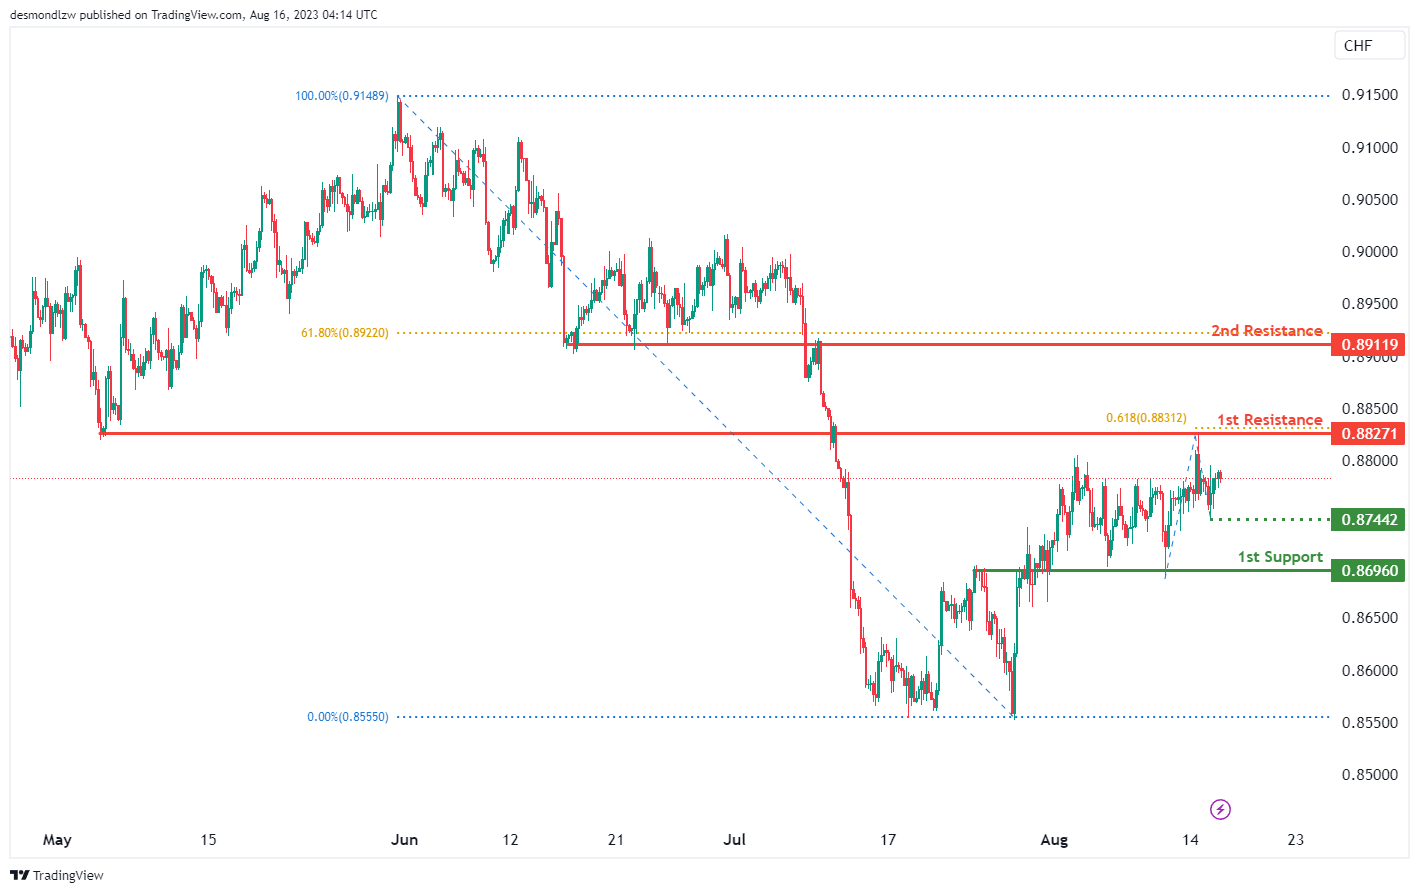
The USD/CHF chart currently showcases a bearish momentum, suggesting a prevailing downward trend.
Within this bearish context, there is a possibility of a bearish continuation towards the 1st support level at 0.8696, which is identified as an overlap support. Moreover, an intermediate support at 0.8744, acting as a swing low support, adds to the potential support zones.
On the resistance side, the 1st resistance at 0.8827 holds significance due to its categorization as an overlap resistance and alignment with a 61.80% Fibonacci Projection.
Additionally, the 2nd resistance at 0.8911 is notable as a pullback resistance. This resistance level gains importance as it aligns with a 61.80% Fibonacci Retracement.
USD/JPY:
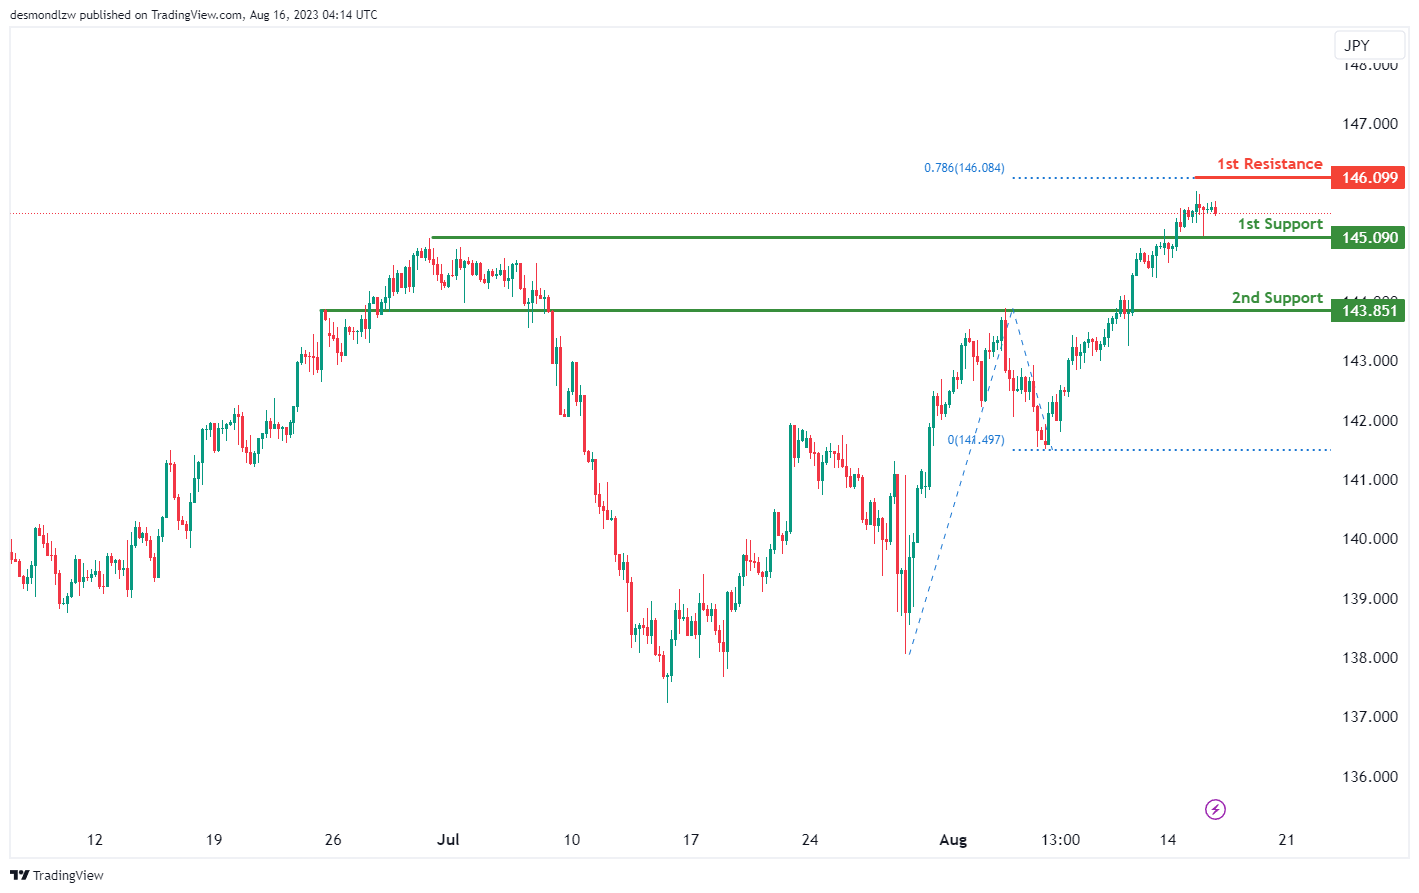
The USD/JPY chart currently reflects a bullish momentum, suggesting a prevailing upward trend.
Within this bullish context, a potential scenario could involve a short-term drop in price towards the 1st support level at 145.09, identified as an overlap support. This might be followed by a bounce from this support, leading to a rise towards the 1st resistance at 146.09.
Adding to the support structure, the 2nd support at 143.85 is considered a pullback support, which could provide additional stability during price fluctuations.
On the resistance side, the significance of the 1st resistance at 146.09 is reinforced by its alignment with a 78.60% Fibonacci Projection.
Given the overall bullish momentum, the indicated support and resistance levels suggest the potential for a short-term drop followed by a subsequent upward movement.
USD/CAD:
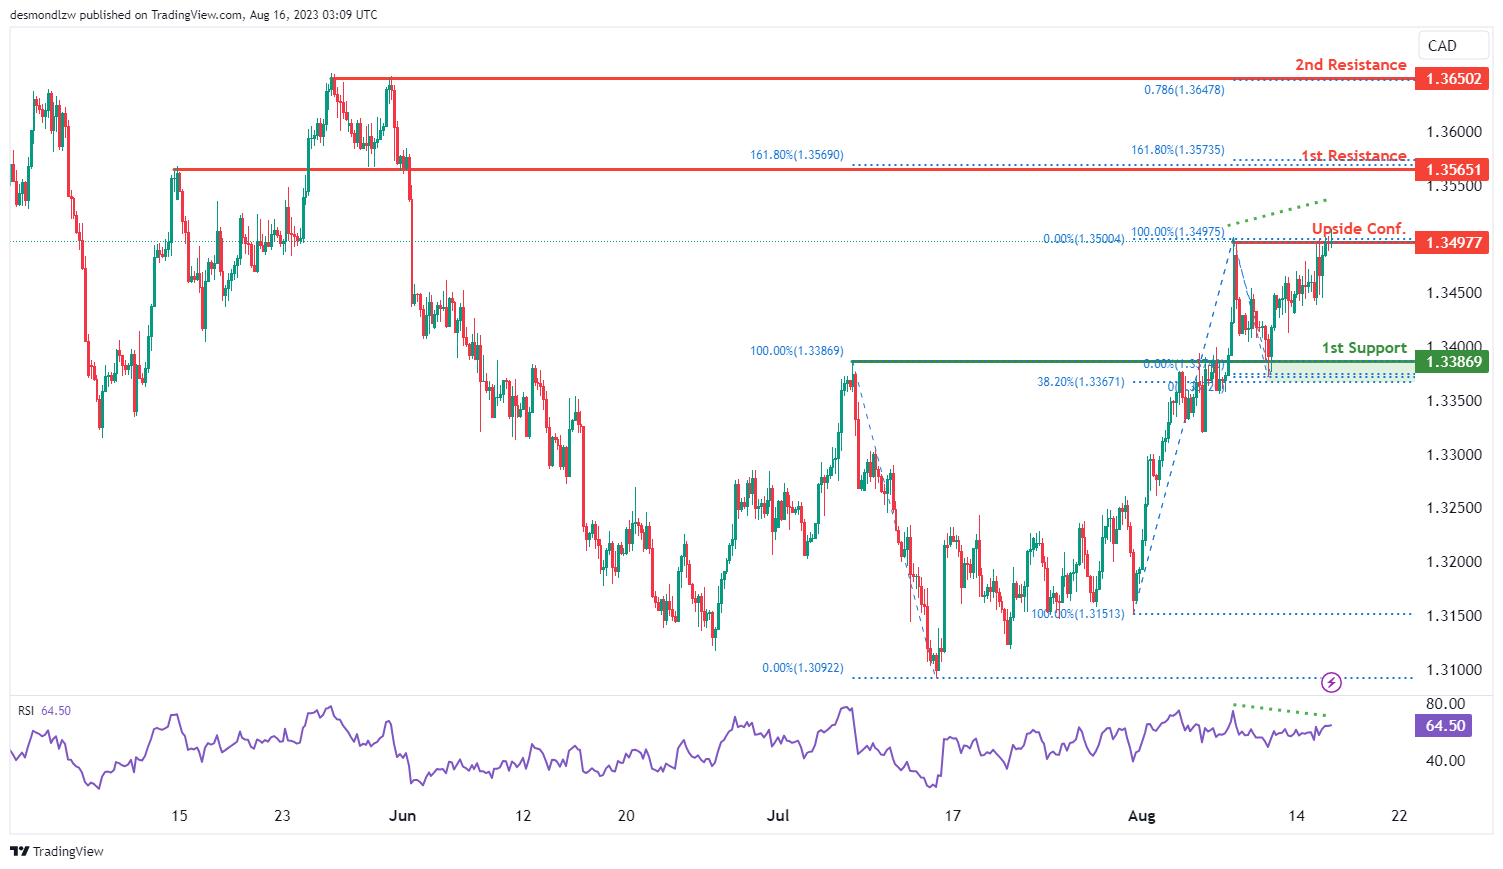
The current momentum of the USD/CAD chart is bullish, indicating a potential continuation of the upward trend should the price break through and stay above the upside confirmation level at 1.3498. Price could potentially climb towards the 1st resistance. However, do take note of the bearish RSI divergence that suggests that price could make a potential bearish reversal.
The 1st resistance at 1.3565 is significant due to its role as an overlap resistance and the presence of multiple Fibonacci confluence levels i.e. the double occurrence of the 161.80% Fibonacci extension levels. Furthermore, there is also a 2nd resistance at 1.3650 that is identified as an overlap resistance that aligns with the 78.60% Fibonacci projection level.
The 1st support level at 1.3387 is an overlap support that is reinforced by the 38.20% Fibonacci retracement level.
AUD/USD:
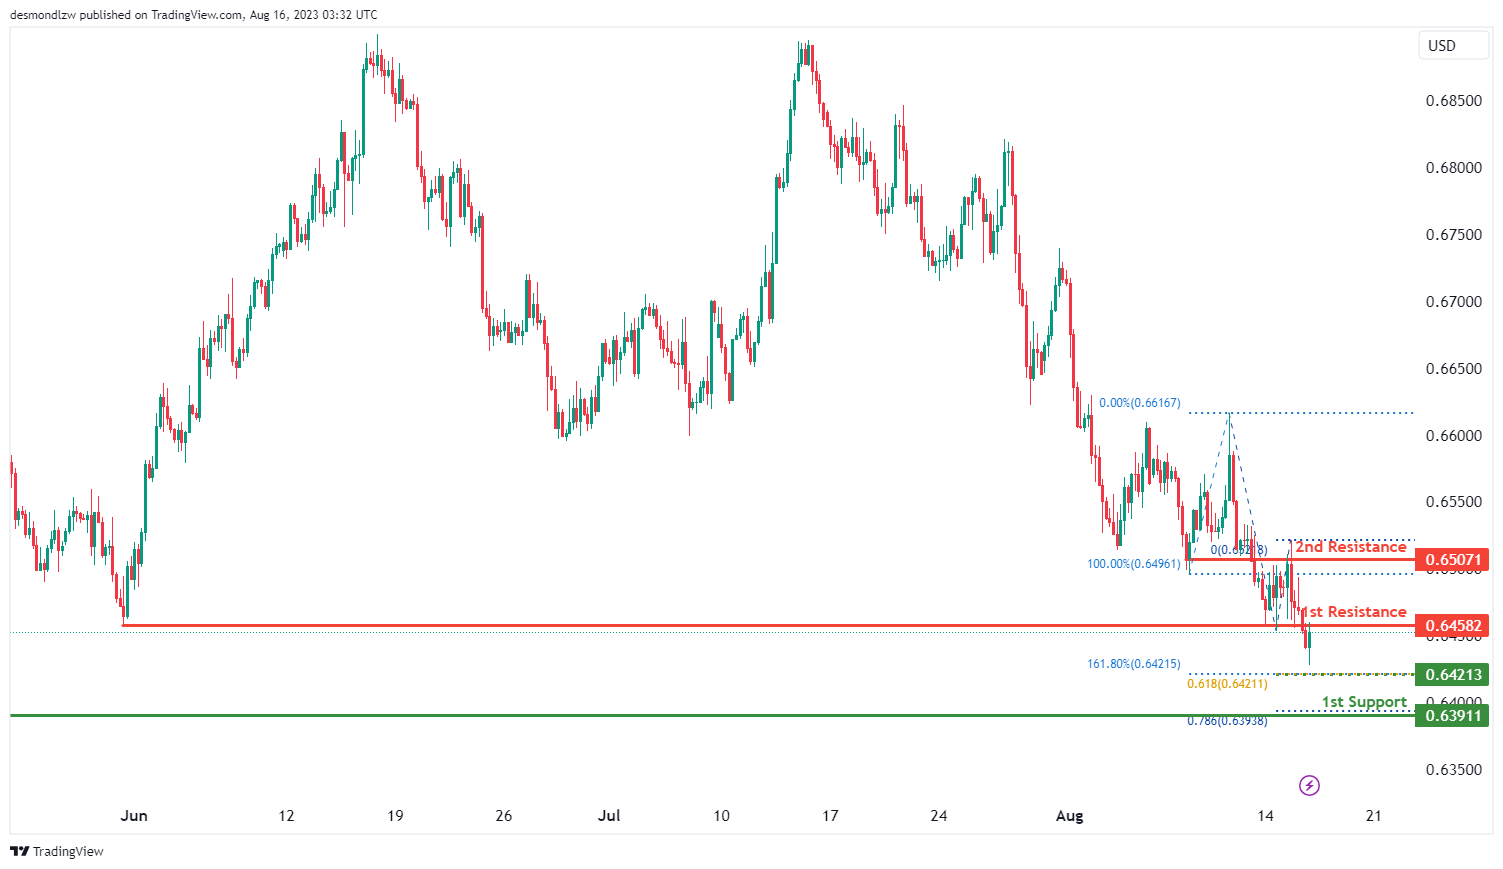
The current momentum of the AUD/USD chart is bearish, indicating a potential continuation of the downward trend.
There is a possibility that the price could experience a bearish reaction off the 1st resistance level at 0.6458 before moving down towards the intermediate support level at 0.6421. This level is supported by a confluence of Fibonacci levels i.e. the 61.80% projection and the 161.80% extension levels. Additionally, the 2nd support at 0.6391 is identified as a swing-low support that aligns with the 78.60% Fibonacci projection level.
To the upside, the 1st resistance at 0.6458 is identified as an overlap resistance. Furthermore, the 2nd resistance at 0.6507 is also identified as an overlap resistance.
NZD/USD
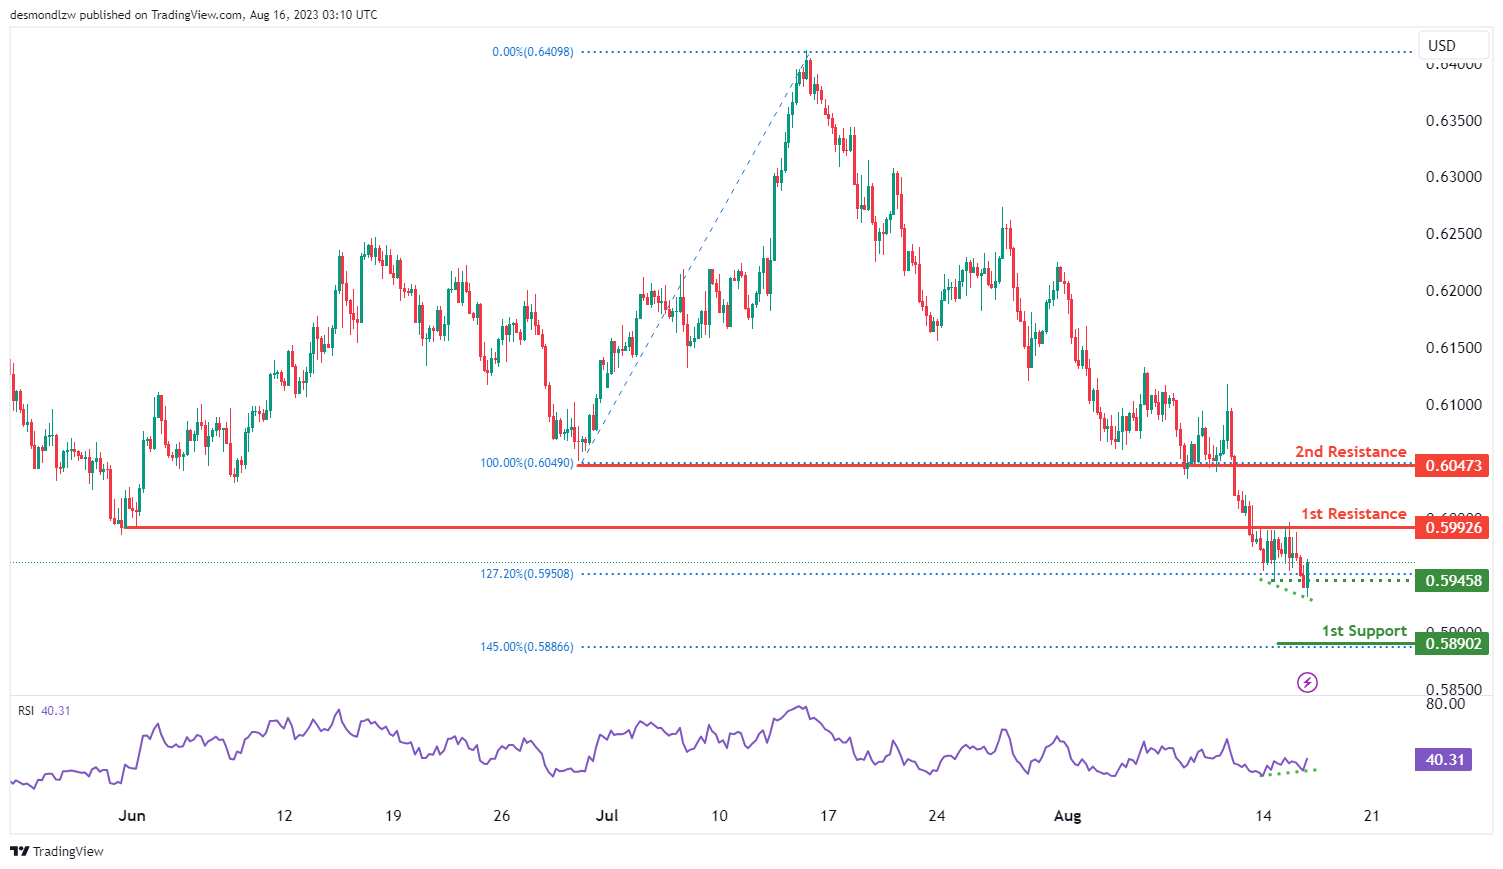
The current chart for NZD/USD indicates a bullish momentum, suggesting a potential continuation of the upward trend. This momentum is supported by the presence of bullish divergence between the price and the RSI indicator.
There is a likelihood that the price could experience a bullish movement towards the 1st resistance level at 0.5993 that is identified as an overlap resistance. Additionally, the 2nd resistance at 0.6047 is also identified as an overlap resistance.
To the downside, the intermediate support level at 0.5946 aligns with the 127.20% Fibonacci extension level. Furthermore, the 1st support level at 0.5890 aligns with the 145.00% Fibonacci extension level.
DJ30:
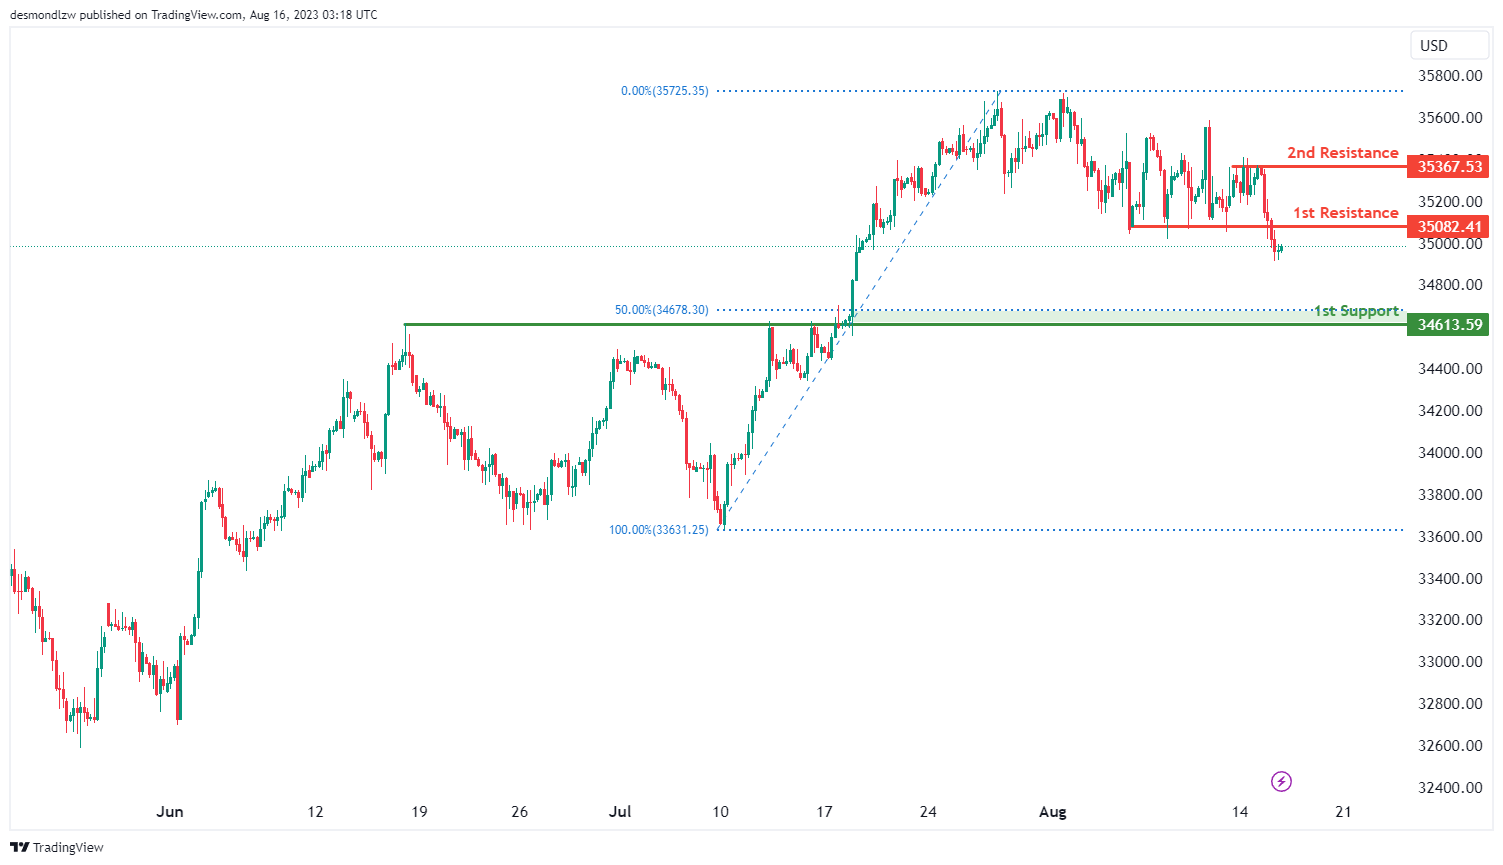
The current analysis of DJ30 indicates a bearish momentum, suggesting a potential continuation of the downward trend. There is a possibility for the price to experience a short-term upward movement towards the 1st resistance level at 35082.41 before reversing and heading towards the 1st support at 34613.59. The 1st support is supported by the presence of a 50% Fibonacci retracement level.
In addition, the 2nd resistance at 35367.53 is notable as a multi-swing high resistance, which could potentially act as a barrier to any further upward movement.
GER30:
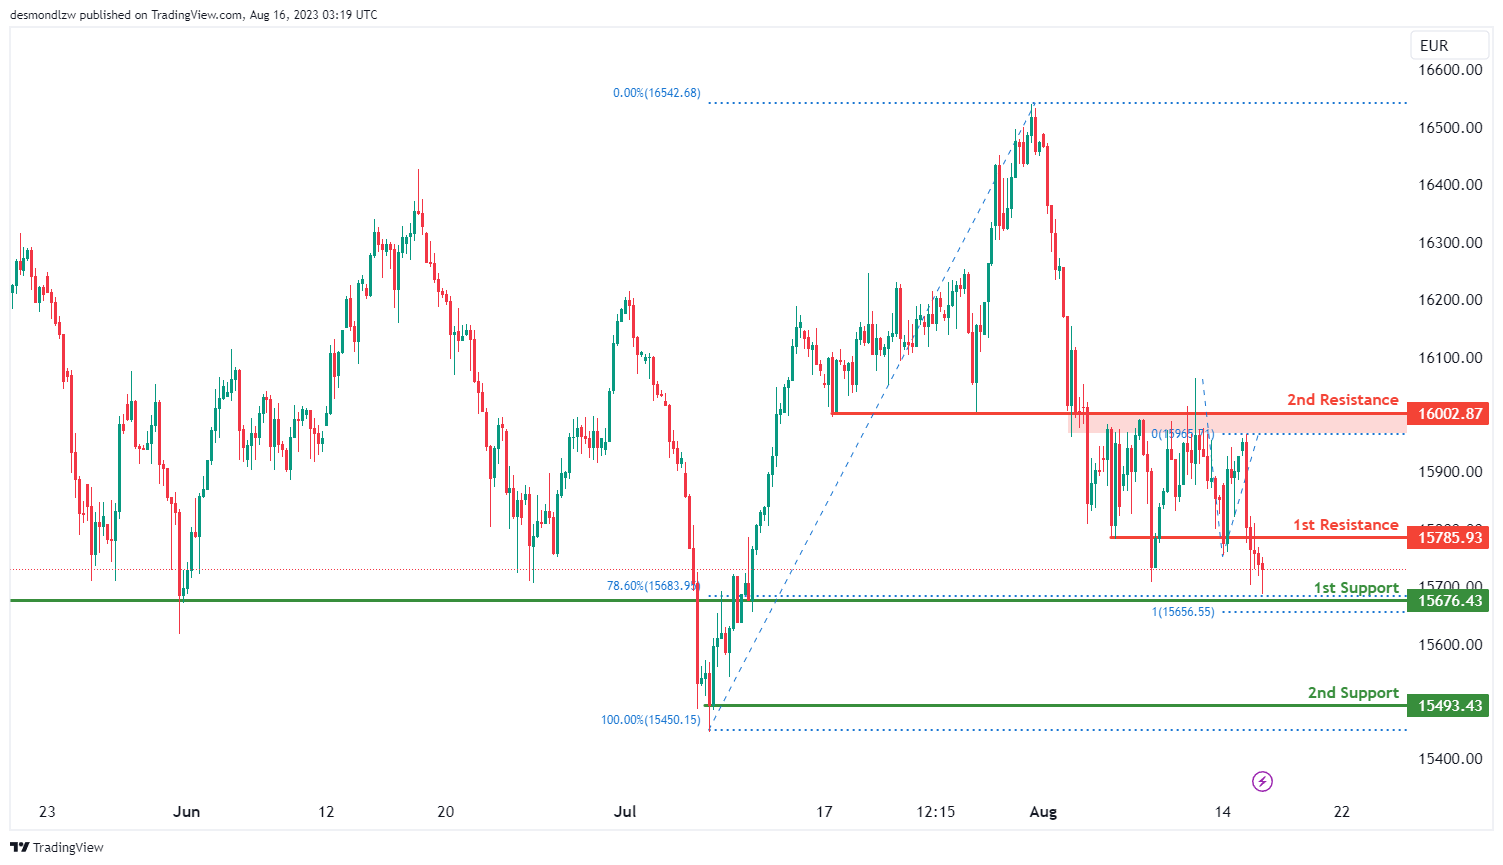
The GER30 chart currently shows a bullish momentum, suggesting a potential continuation of the upward trend. There is a possibility that the price might bounce off the 1st support at 15676.43, which is supported by both a 78.60% Fibonacci retracement level and a 100% Fibonacci projection. Additionally, the 2nd support at 15493.43 serves as a potential level for a reversal.
On the other hand, the 1st resistance at 15785.93 is significant as an overlap resistance, which could pose a challenge for further upward movement. The 2nd resistance at 16002.87 also acts as a pullback resistance, adding to the resistance levels to watch for potential price movement.
US500
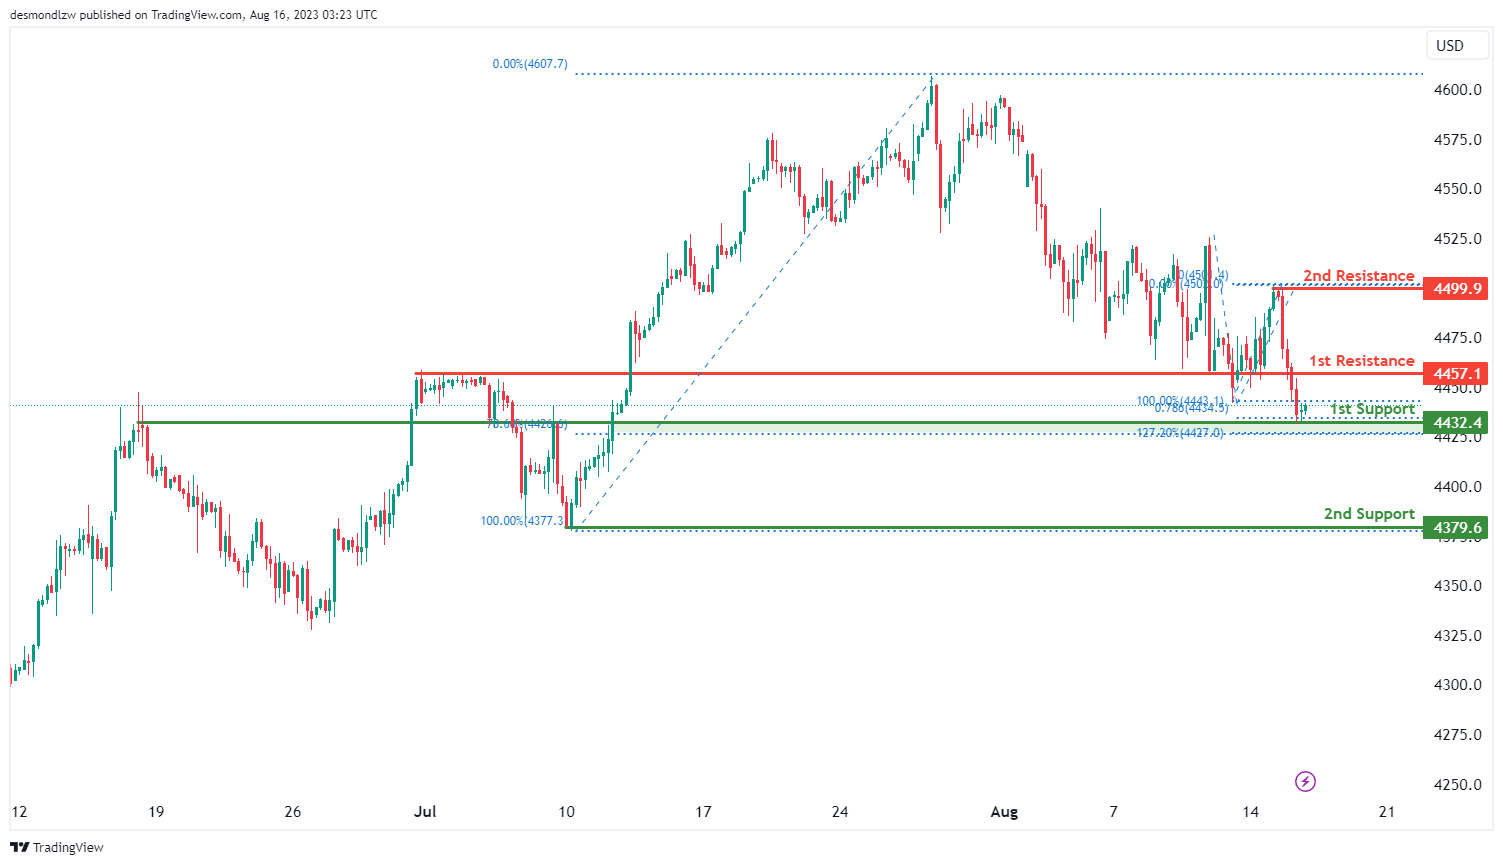
The US500 chart currently reflects a bullish momentum, suggesting the potential for a continuation of the upward trend. It’s plausible that the price might experience a bullish bounce off the 1st support at 4432.4. This support level is significant as it aligns with both a 78.60% Fibonacci retracement and a 127.20% Fibonacci extension, highlighting a Fibonacci confluence and reinforcing its importance.
Furthermore, the 2nd support at 4379.6 adds to the potential for a rebound. On the resistance side, the 1st resistance at 4457.1 holds significance as an overlap resistance, which could impact upward movement. The 2nd resistance at 4499.9 serves as a notable swing high resistance, potentially influencing price behavior.
BTC/USD:
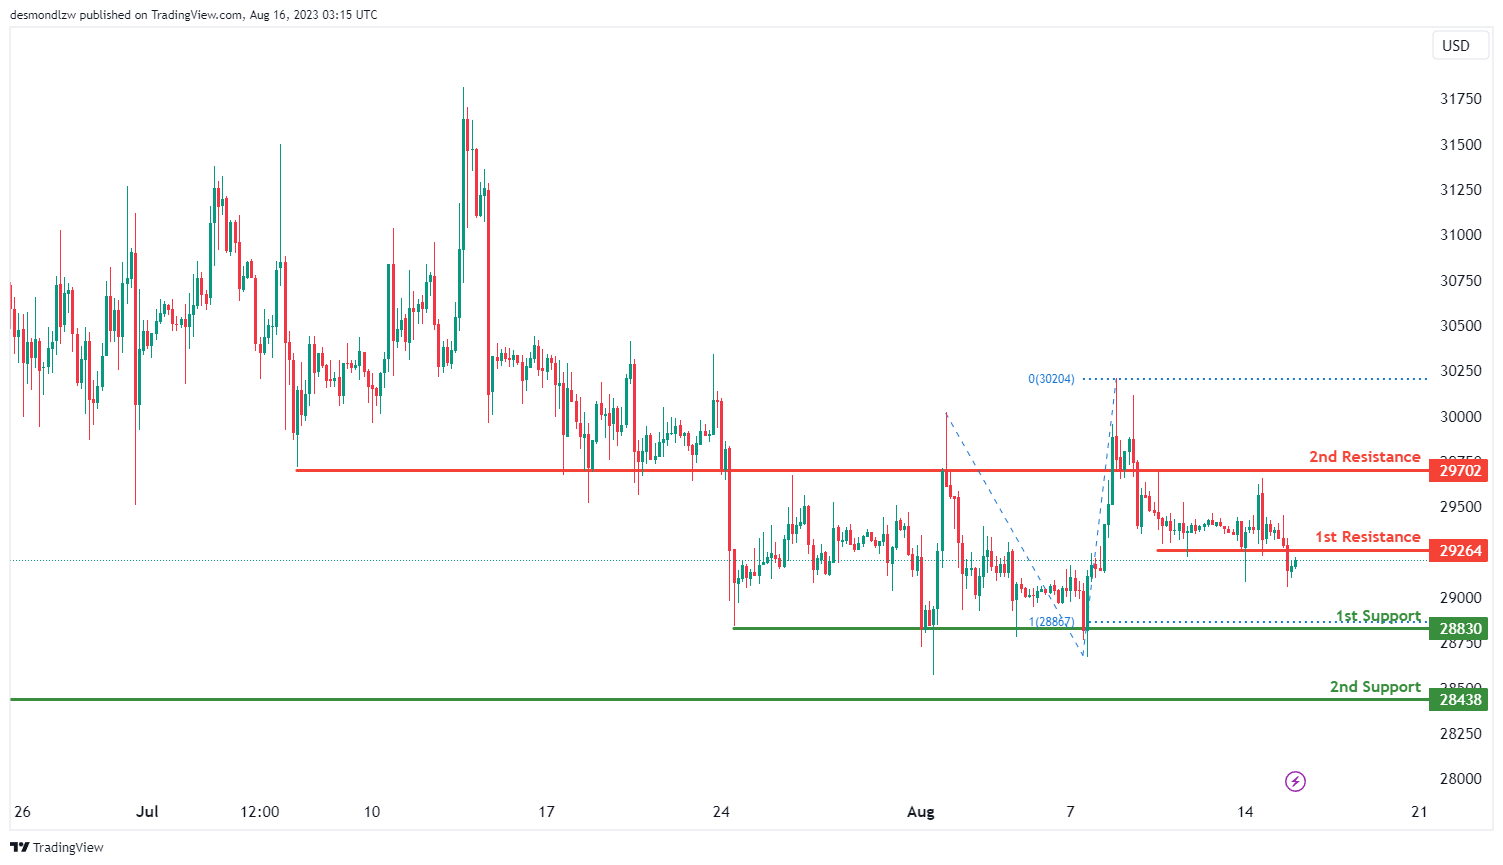
The current chart analysis of BTC/USD indicates a bearish momentum, suggesting a potential continuation of the downward trend. The price is expected to react bearishly upon reaching the 1st resistance level and move towards the 1st support level. The 1st support at 28830 is reinforced by a 100% Fibonacci Projection and can serve as a strong support level. The 2nd support at 28438 is also significant as an overlap support.
On the other hand, the 1st resistance at 29264 is noteworthy as it coincides with pullback resistance. Additionally, the 2nd resistance at 29702 is also important as an overlap resistance.
ETH/USD:
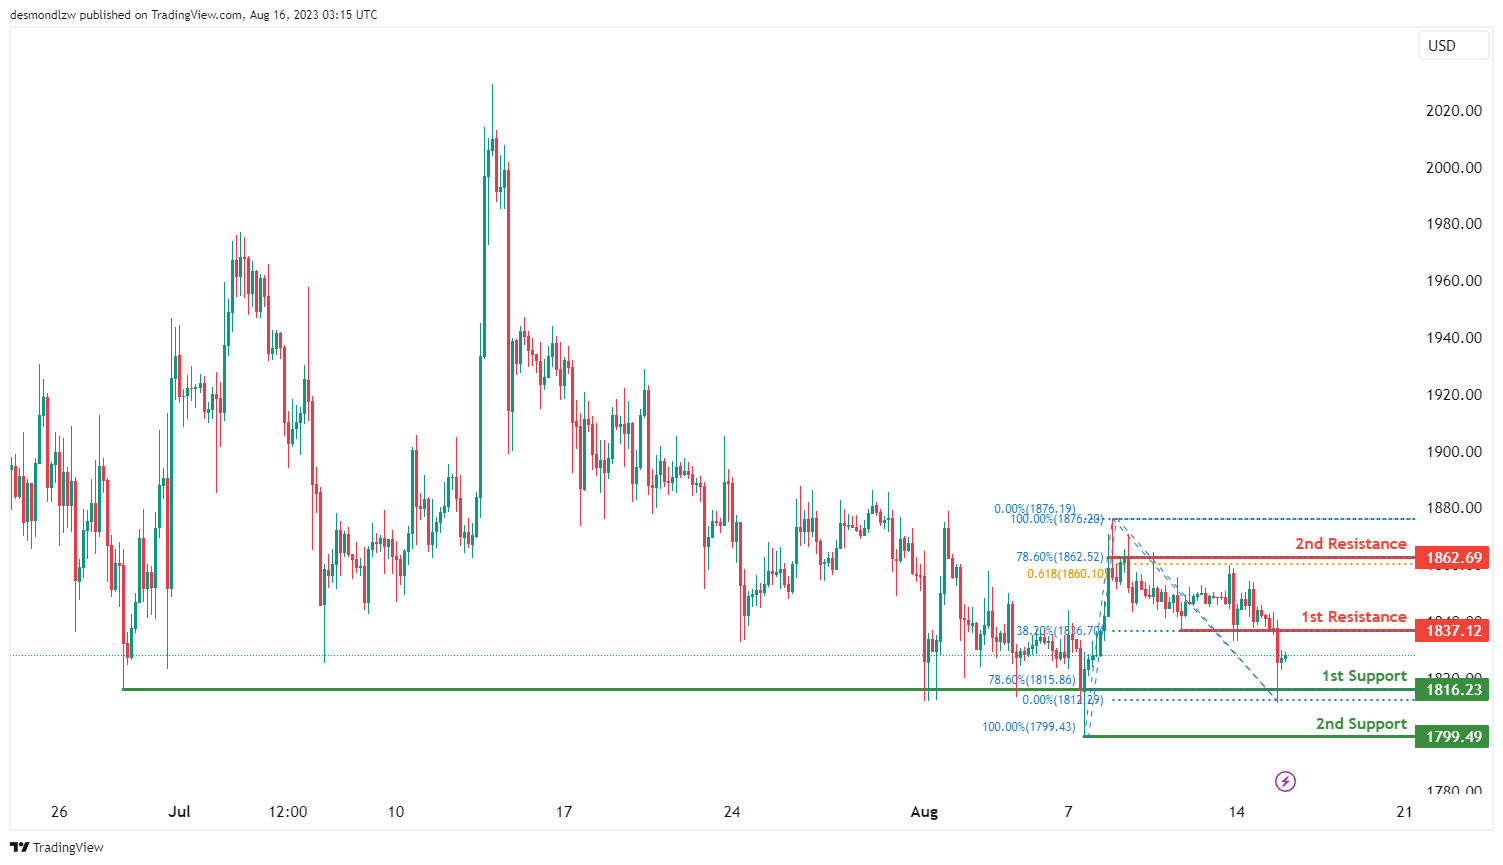
The current chart analysis of ETH/USD suggests a bearish momentum, indicating a potential continuation of the downward trend. The price may see a short-term rise towards the 1st resistance level at 1837.12 before reversing and heading towards the 1st support level at 1816.23. The 1st support is significant as it is a level of overlap and coincides with the 78.60% Fibonacci retracement. The 2nd support at 1799.49 is also important as a swing low support.
On the other hand, the 1st resistance at 1837.12 is significant due to its role as a pullback resistance. Additionally, the 2nd resistance at 1862.69 holds importance as it is a multi-swing high resistance and also coincides with the 78.60% Fibonacci retracement and 61.80% Fibonacci projection, indicating a potential area of resistance.
WTI/USD:
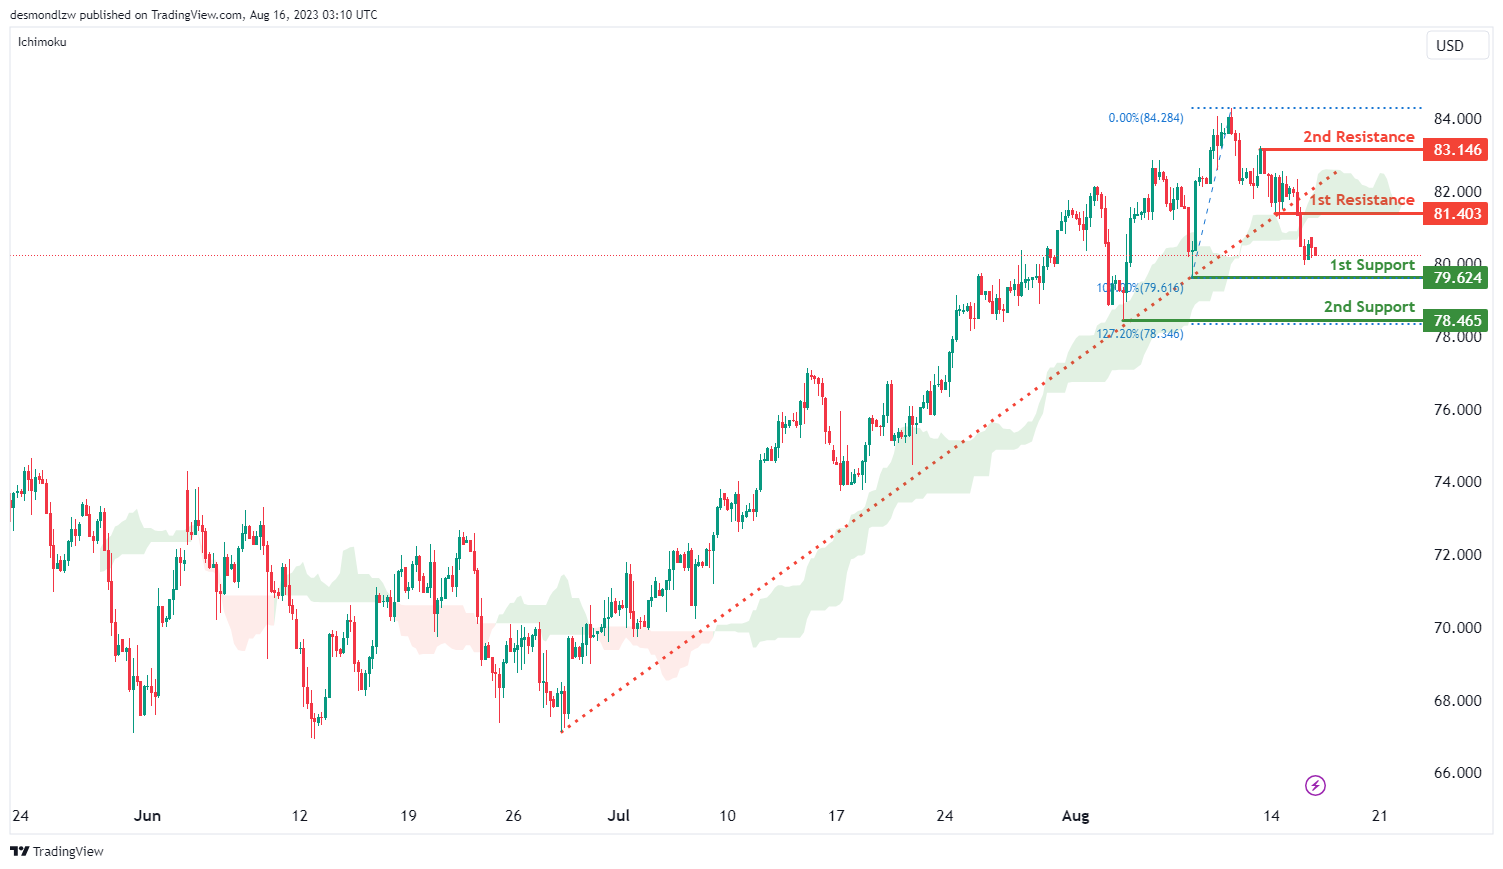
The current momentum of the WTI/USD chart is bearish, supported by the fact that the price has broken below an ascending support line as well as crossing below the Ichimoku cloud. This suggests the potential for a continued downward movement.
There is a possibility for the price to continue its bearish momentum towards the 1st support level at 79.62. The 2nd support at 78.465 is swing-low that aligns with the 127.20% Fibonacci extension level, adding to its significance.
To the upside, the 1st resistance level at 81.40 acts as a pullback resistance. Additionally, the 2nd resistance at 83.15 also functions as a pullback resistance should price reach this level.
XAU/USD (GOLD):
The XAU/USD chart currently exhibits a bullish momentum, indicating a prevailing upward trend.
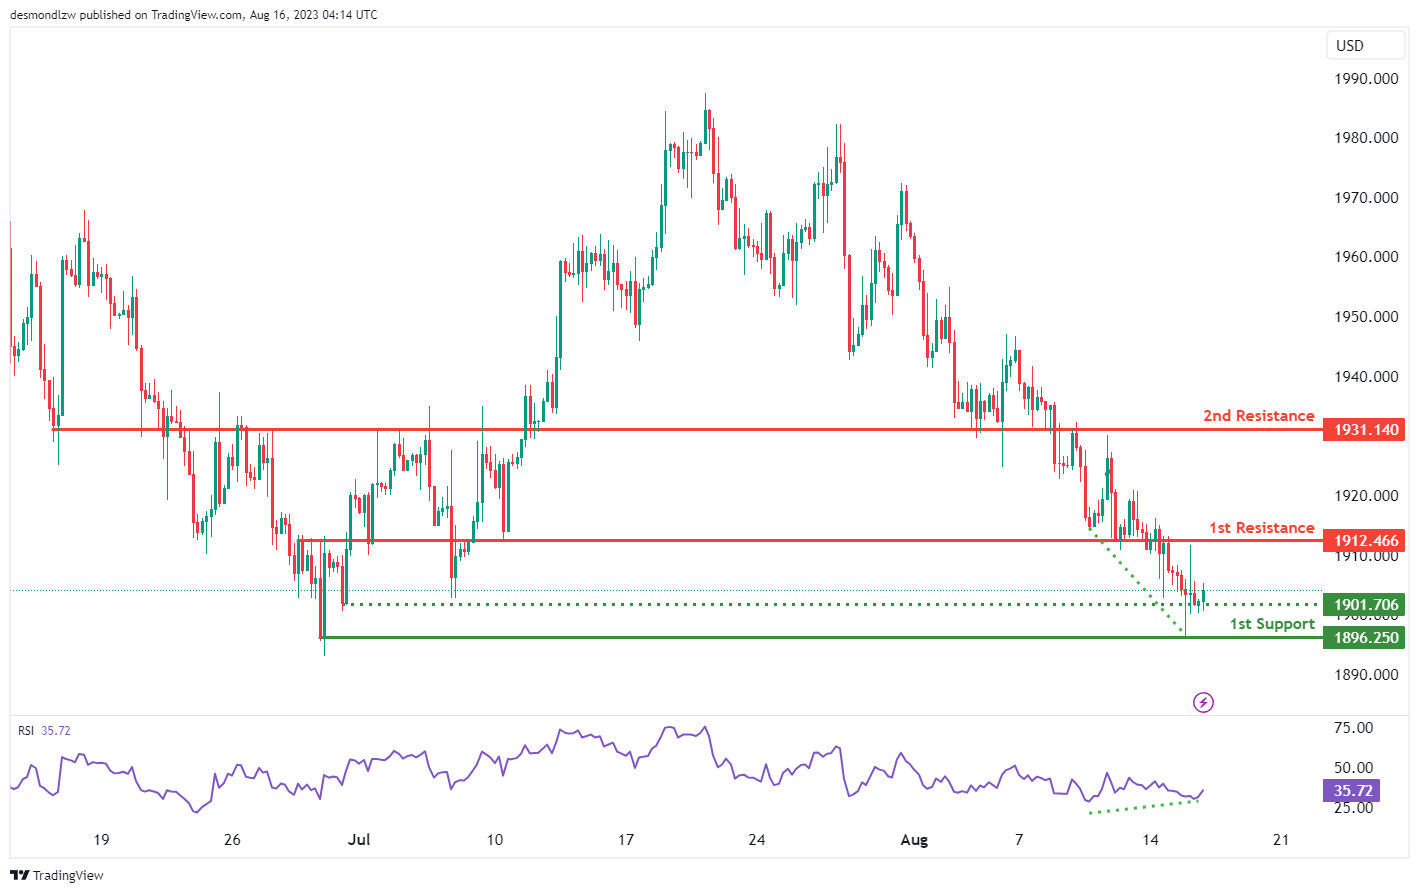
Within this bullish context, a potential scenario involves a bullish bounce off the 1st support level at 1896.25, which is considered a pullback support. This bounce could lead the price towards the 1st resistance level at 1912.46, characterized as an overlap resistance.
Providing additional support, the intermediate support at 1901.70 is identified as a multi-swing low support, potentially reinforcing the overall support structure.
On the resistance side, the 2nd resistance at 1931.14 is also an overlap resistance, adding to its significance as a potential barrier to upward movement.
It’s noteworthy that the Relative Strength Index (RSI) is currently situated on a major support level, suggesting the possibility of an upcoming bounce in the price.
NZ First Impression RBNZ August 2023 Policy Decision
RBNZ on hold in August, OCR forecast revised higher.
First Impressions RBNZ August 2023 Monetary Policy Statement
- OCR remains at 5.5% as expected.
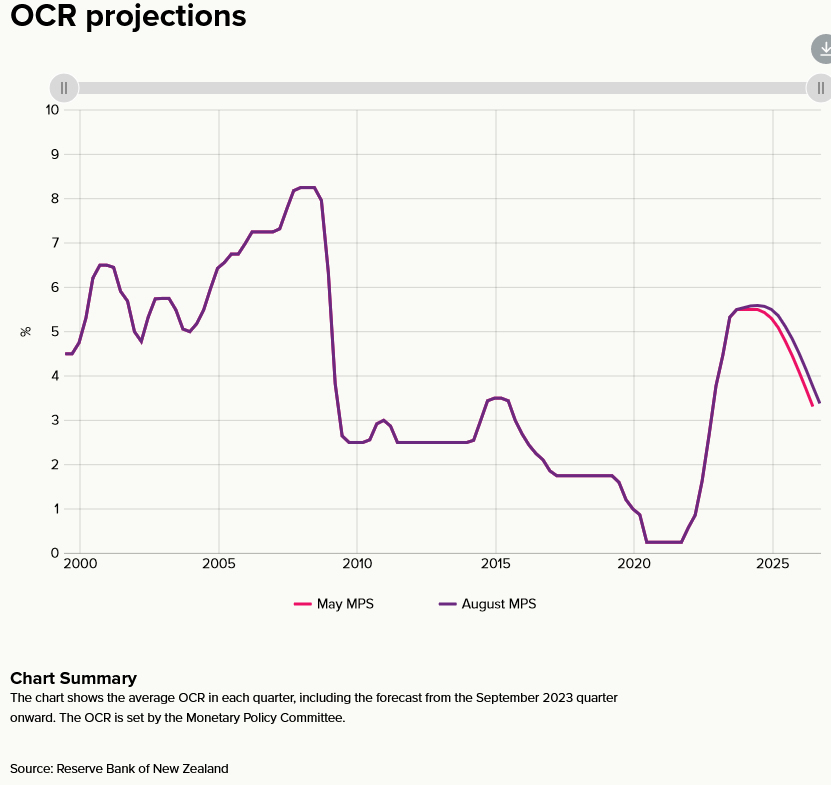
- Near term growth outlook revised up, and OCR profile revised higher to 5.6% (March-June 2024)
- Around 40% chance of a further rate hike to 5.75%.
- Assumed neutral OCR revised up 25 basis points to 2.25%, lifting the OCR profile.
- CPI inflation gets back inside the range September 2024.
- Medium term CPI profile unchanged although with higher interest rates.
- Westpac retains its call for a 25-basis point increase in the OCR in November.
Steady as she …. oh wait!
The RBNZ left the OCR unchanged as widely expected at 5.5%. The overall tone of the statement is broadly unchanged although a touch more hawkish for the immediate period given the OCR track has been revised slightly higher (the updated OCR track now shows around a 40% chance of one further rate hike to 5.75% in the first half of 2024. In contrast, the RBNZ’s previous forecasts did rise above 5.50%).
The peak in the OCR has been pushed out to the first half of 2024 and easing is delayed an extra quarter – now in Q4 2024 or Q1 2025 vs Q3 2024 previously.
A reason the RBNZ now sees the risk the OCR will need to rise again is their reassessment of the long-run neutral level of the OCR. The RBNZ’s estimate of the long-run neutral OCR has been revised up 25bps to 2.25%. This means that the RBNZ now believes that the OCR has not been constraining activity to the extent they had thought, and rates therefore need to be higher.
The Bank sees upside risks to growth and inflation in the near-term, with the unemployment rate now forecast to rise more slowly than in May. Looking towards the medium-term, the Bank emphasises downside risks to the growth and inflation outlook from the weaker external outlook, especially as regards China. This is unsurprisingly given recent negative trends in dairy prices. Indeed, following last night’s auction, current dairy prices appear about 10% weaker than the Bank’s assumed cycle low point.
The upside risks centre around the still elevated core inflation measures as shown by the June quarter CPI out-turn. The RBNZ has also revised up their house price projections as we foreshadowed in our Monetary Policy Statement preview. Over 2024 the RBNZ sees house prices rising around 3% compared to the small fall forecast in May. A near term uplift in exports is also lifting activity.
The RBNZ has analysed the inflationary impact of migration and tentatively concluded that the inflationary impacts will be positive but lower than seen historically. More research is underway.
The inflation profile is broadly unchanged over the medium term. The RBNZ still expects the CPI to return to the target range in Q3 2024, though that is now predicated on a slightly higher OCR. The RBNZ has upgraded its near-term profile for non-tradables inflation reflecting the surprise in the June quarter outturn and an expectation of higher non-tradables inflation in the September 2023 quarter.
The RBNZ’s updated policy assessment now more closely matches our own view that there is still more work to be done to ensure inflation returns to the target range sufficiently quickly. The short-term bias in the OCR track implies that the choices for the MPC in future meetings will range between no change and a further OCR increase. Westpac continues to expect a 25-basis point increase in the OCR at the November Monetary Policy Statement.
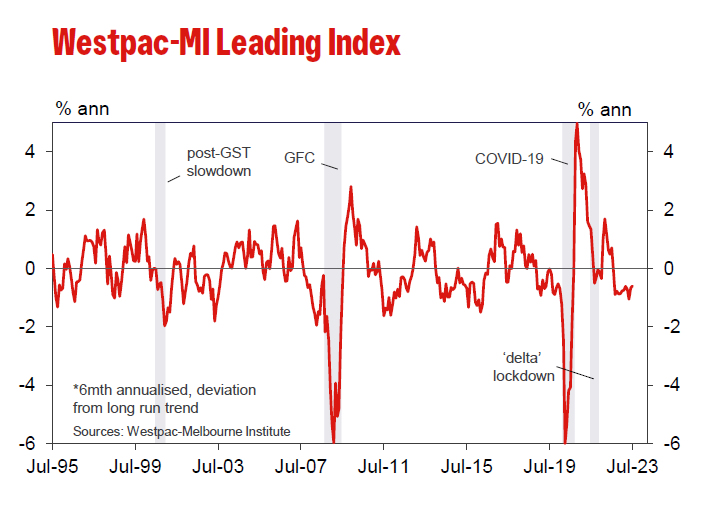
Australia’s Westpac leading index ticks up, but below-par growth set to persist
Australia's Westpac Leading Index figures reveals that growth rate has shown a marginal uptick, moving from -0.67% to -0.60% in July. But alarmingly, this marks the twelfth consecutive month in red, representing the longest stretch of such negative prints in a span of seven years, barring the COVID-affected period.
The subdued, below-par growth momentum witnessed throughout 2023 seems set to persist into the subsequent year. Westpac predicts deceleration in GDP growth to a mere 1% for the current year. Any potential rebound is anticipated to be minimal, with projections indicating a slight rise to 1.4% annually in 2024 – with the bulk of this growth concentrated towards the year-end.
Regarding RBA meeting on September 5, Westpac sets its expectations clear. The institution foresees cash rate remaining stable at 4.10%, denoting the zenith of this current tightening phase.
Referring the recent remarks of RBA Governor before the House of Representatives Standing Committee on Economics, the note emphasized, "Policy is now in a 'calibration' phase with small adjustments still possible if the data starts to show clear risks of a slower return to low inflation."
Nevertheless, given the evident frailty in growth momentum – as underscored by the most recent Leading Index update – coupled with the broader dynamics of price and wage inflation aligning with RBA's forecasts, "the threshold for additional tightening is high and unlikely to be met."
AUD/USD Dips Below 0.6500, FOMC Minutes Next
Key Highlights
- AUD/USD traded below the 0.6500 support zone.
- A major bearish trend line is forming with resistance near 0.6495 on the 4-hour chart.
- EUR/USD is consolidating losses near the 1.0900 zone.
- GBP/USD might face resistance near 1.2770 and 1.2800.
AUD/USD Technical Analysis
The Aussie Dollar started a fresh decline from well above 0.6720 against the US Dollar. AUD/USD traded below the 0.6620 support to move into a bearish zone.
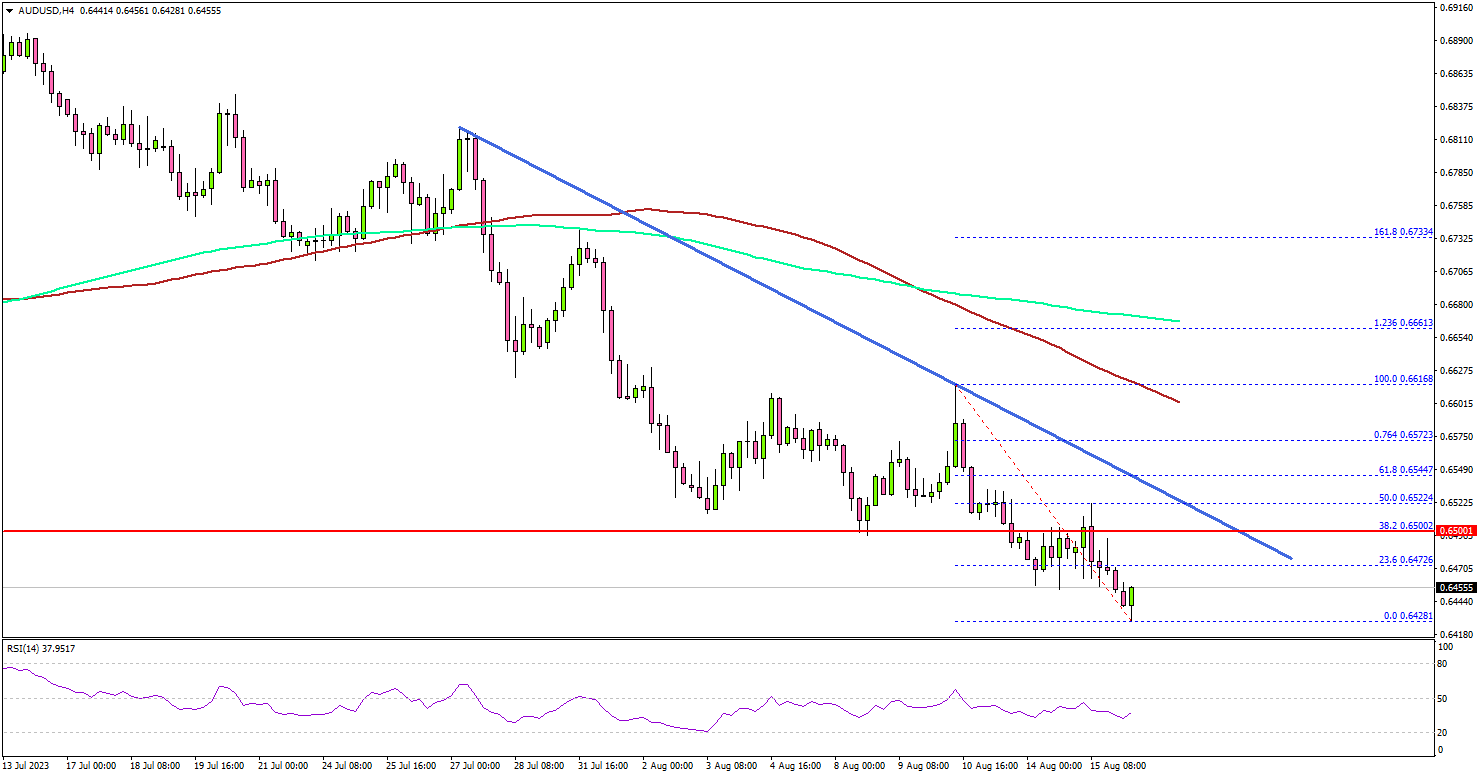
Looking at the 4-hour chart, the pair settled below the 0.6550 level, the 100 simple moving average (red, 4 hours), and the 200 simple moving average (green, 4 hours).
The pair also traded below the 1.2500 support zone and tested 0.6425. A low is formed near 0.6428 and the pair is now consolidating losses. On the upside, an initial resistance is near the 0.6475 level. The first major resistance is near 0.6500.
There is also a major bearish trend line forming with resistance near 0.6495 on the same chart. A close above the 0.6500 resistance could start a decent increase.
In the stated case, the pair could rise toward the 0.6550 level. Any more gains could start a fresh increase toward the 0.6620 level.
Initial support is near the 0.6425 level. The next major support is near 0.6400, below which AUD/USD could gain bearish momentum. In the stated case, the pair could test the 0.6325 support.
Looking at EUR/USD, the pair is showing bearish signs and is currently consolidating losses near the 1.0900 level.
Economic Releases
- Euro Zone Gross Domestic Product Q2 2023 (Preliminary) (QoQ) - Forecast 0.6%, versus 0.6% previous.
- FOMC Meeting Minutes.
RBNZ on hold, OCR to stay high for longer
RBNZ has decided to maintain OCR unchanged at 5.50% again, aligning with broad market expectations. Making its stance clear, the bank asserted that the "OCR needs to stay at restrictive levels for the foreseeable future."
Reflecting a neutral stance, the central bank emphasized its confidence in the current monetary policy, "that with interest rates remaining at a restrictive level for some time, consumer price inflation will return to within its target range of 1 to 3% per annum, while supporting maximum sustainable employment."
Adding depth to its economic perspective, "The nominal neutral OCR has increased by 25 basis points to 2.25% within the projections," the Committee noted. They were in consensus that the existing OCR level was contractionary, asserting that it's effectively curbing domestic spending as intended.
Shifting the lens to future projections, the forecasts in the Monetary Policy Statement hint at the OCR potentially reaching a peak of 5.6% in the first quarter of 2024. This marks a slight shift from the earlier prediction of 5.5% in Q3 2023, hinting at the possibility of an additional rate hike. As for subsequent rate cut expectations are now set for the second quarter of 2025, a slight delay from the previously anticipated period between Q4 2024 and Q1 2025.
(RBNZ) Official Cash Rate remains at 5.5%
The Monetary Policy Committee today agreed to maintain the Official Cash Rate (OCR) at 5.5%.
The current level of interest rates is constraining spending and hence inflation pressure, as anticipated and required. The Committee agreed that the OCR needs to stay at restrictive levels for the foreseeable future to ensure annual consumer price inflation returns to the 1 to 3% target range, while supporting maximum sustainable employment.
The New Zealand economy is evolving broadly as anticipated. Activity continues to slow in parts of the economy that are more sensitive to interest rates. Labour shortages are easing as overall demand softens and immigration adds to labour resources. Headline inflation and inflation expectations have declined, but measures of core inflation remain too high.
Globally, economic growth remains below trend and headline inflation has eased for most of our trading partners. Core inflation remains high in many countries. Weakening global economic growth is putting downward pressure on New Zealand export prices.
The imbalance between demand and supply is moderating in the New Zealand economy. However, a prolonged period of subdued spending growth is still required to better match the supply capacity of the economy and reduce inflation pressure.
In the near term, there is a risk that activity and inflation measures do not slow as much as expected. Over the medium-term, a greater slowdown in global economic demand, particularly in China, could weigh more on commodity prices and overall New Zealand export revenue.
The Committee is confident that with interest rates remaining at a restrictive level for some time, consumer price inflation will return to within its target range of 1 to 3% per annum, while supporting maximum sustainable employment.
Media contact
James Weir
Senior Adviser External Stakeholders
Phone:+64 4 471 3962 Mobile: 021 103 1622
Email: James.Weir@rbnz.govt.nz
Summary record of meeting
The Monetary Policy Committee discussed recent developments in the New Zealand economy. The Committee agreed that monetary conditions are restricting spending and reducing inflationary pressure as anticipated. While supply constraints in the economy continue to ease, inflation remains too high. Spending needs to remain subdued to better match the economy's ability to supply goods and services, so that consumer price inflation returns to its target range.
Global economic growth remains below trend for most of our trading partners. While global growth was resilient across the first half of the year this is beginning to fade, particularly in China. Globally, headline inflation has declined but core inflation remains high in many countries. The Committee noted that regional divergences in the moderation of core inflation are beginning to emerge.
New Zealand's export volumes over the last quarter were more resilient than expected due to favourable agricultural growing conditions in some regions. However, export revenues are expected to ease, in line with weakening global demand. A decline in global commodity prices has seen prices for New Zealand's exports moderate.
The Committee noted that tight monetary conditions continue to constrain domestic spending. The slowdown in economic activity is most notable in the parts of the economy that are more sensitive to interest rates. The Committee judged that with monetary conditions remaining restrictive, they expect to see further declines in consumption per capita and for GDP growth to be subdued over coming quarters.
Annual CPI inflation declined to 6.0% in the June quarter, with tradables inflation declining more than non-tradables inflation. Most measures of inflation expectations have declined alongside the fall in headline inflation. However, measures of core inflation remain near their recent highs.
The Committee discussed the labour market and agreed that capacity pressures have begun to ease. Recent net immigration has increased labour supply, helping to alleviate some labour market shortages. Employment growth remains resilient. The Committee noted that most measures of annual wage inflation have begun to ease.
The Committee noted that the estimate of the nominal neutral OCR has increased by 25 basis points to 2.25% within the projections, consistent with the Reserve Bank's indicator suite. The Committee agreed that the current level of the OCR remains contractionary and is constraining domestic spending as needed.
The Committee discussed the increase in the current account deficit and noted that this is primarily due to reduced services exports stemming from the COVID-19 pandemic as well as excess domestic demand. The current account deficit is expected to steadily narrow. Members noted that net foreign liabilities have declined over recent years and that risks associated with funding the deficit were low, as most foreign debt is hedged against foreign exchange risk.
The Committee discussed the recent strong growth in net immigration. The overall impact on demand and inflation pressure remains uncertain. Members noted that the current increase in net immigration may be less inflationary than previous increases, due to both changes to the composition of migrants and in the context of a tight domestic labour market.
The Committee noted that house prices appear to have stabilised. Members agreed that the current projection for house prices was reasonably balanced, remaining around estimates of sustainable levels. The Committee agreed that house price changes have an impact on household wealth. However, members agreed the willingness to consume out of wealth can vary and may be lower in the current context of high debt servicing costs.
The Committee discussed the balance of risks for inflation, output, and employment. Members noted that current projections are for subdued GDP growth, rather than a sharp downturn.
In discussing near-term risks, members considered upside risks to activity and inflation. Members discussed the impact of recent administered price increases – for example, council rates and excise tax – on headline inflation for the September quarter and noted that this could pose a risk to inflation expectations. Members also discussed risks around a slower easing in the labour market resulting in wage inflation taking longer to decline.
The Committee noted that the projections for government expenditure and revenue are predicated on Budget 2023 forecasts. Overall, real government consumption and investment spending as a share of potential GDP is projected to decline over the forecast horizon.
Over the medium term, the Committee discussed risks around the outlook for global growth and judged that these were skewed to the downside. A greater slowdown in global growth would likely see a fall in import prices. Members noted that weaker global demand, particularly from China, could weigh further on commodity prices and therefore on export revenues.
Members also discussed the risks around the lagged effect of previous monetary tightening on households and businesses. The average mortgage rate on outstanding loans is expected to rise from around 5% to near 6% by early 2024, and debt servicing costs as a share of income are still increasing.
Members discussed the risk to those parts of the economy most exposed to lower commodity or asset prices. The Committee agreed that the slowdown in economic activity will not be even across sectors of the economy, due to global factors and the varied impact of high domestic interest rates. In particular, the Committee noted that pockets of stress were beginning to emerge for some households, and the commercial property, agriculture, and construction sectors.
The Committee agreed that in the current circumstances, there is no material trade-off between meeting the Committee's inflation and employment objectives and maintaining the stability of the financial system. Members noted that debt levels are high in some parts of the economy and debt servicing costs have increased. While broad indicators of stress have increased, non-performing loans remain at low levels.
In discussing their Remit objectives, the Committee noted inflation is still expected to decline within the target band by the second half of 2024. The Committee agreed that the risks around the inflation projection remain balanced. Employment is above its maximum sustainable level, however, recent indicators show that labour market pressures continue to ease.
The Monetary Policy Committee discussed the appropriate stance of monetary policy. The Committee agreed that interest rates still need to remain at a restrictive level for the foreseeable future, to ensure annual consumer price inflation returns to the 1 to 3% target range while supporting maximum sustainable employment.
On Wednesday 16 August, the Committee reached a consensus to maintain the Official Cash Rate at 5.50%.
Attendees:
Reserve Bank members of MPC: Adrian Orr, Karen Silk, Christian Hawkesby, Paul Conway
External MPC members: Bob Buckle, Peter Harris, Caroline Saunders
Treasury Observer: Dominick Stephens
MPC Secretary: Kate Poskitt
WTI Wave Analysis
- WTI reversed from resistance level 82.50
- Likely to fall to support level 76.80.
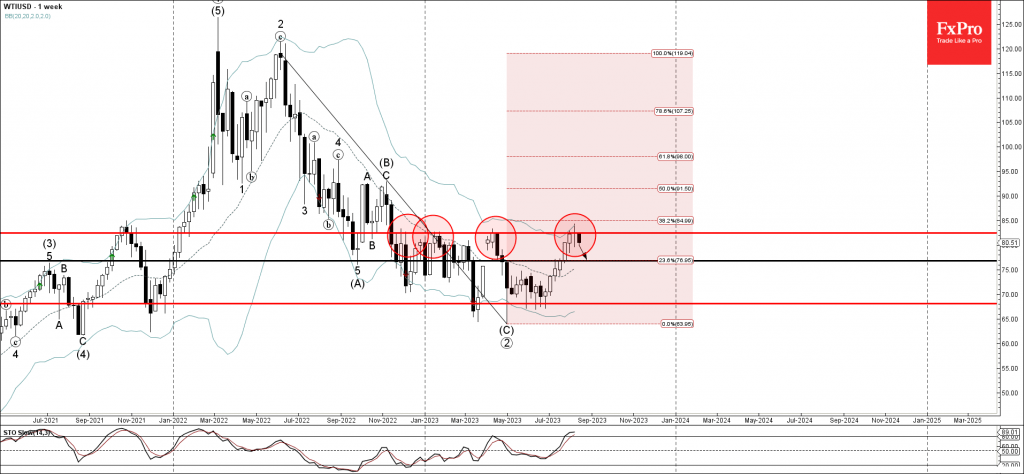
WTI crude oil recently reversed down from the major long-term resistance level 82.50 (which has been reversing the price from the end of last year).
The resistance level 82.50 was strengthened by the upper daily Bollinger Band and the 38.2% Fibonacci correction of the previous downtrend from last year. Given the strength of the resistance level 82.50 and the overbought weekly Stochastic, WTI crude oil can be expected to fall further toward the next support level 76.80.