Sample Category Title
AUD/USD Daily Report
Daily Pivots: (S1) 0.6476; (P) 0.6505; (R1) 0.6524; More...
Intraday bias in AUD/USD stays on the downside at this point. Decisive break of 0.6457 support will confirm resumption of whole fall from 0.7156. Next target is 100% projection of 0.7156 to 0.6457 from 0.6894 at 0.6195. Nevertheless, firm break of 0.6615 minor resistance will dampen this view, and turn bias back to the upside for stronger rebound.
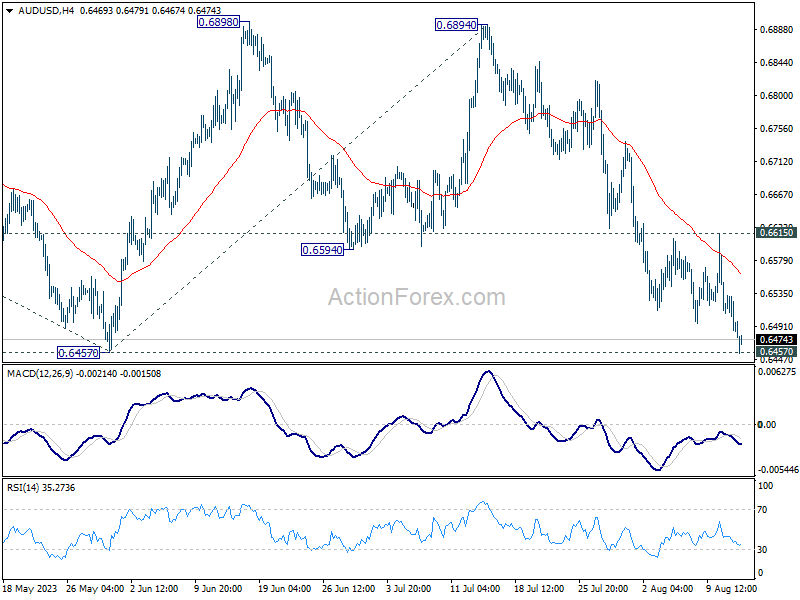
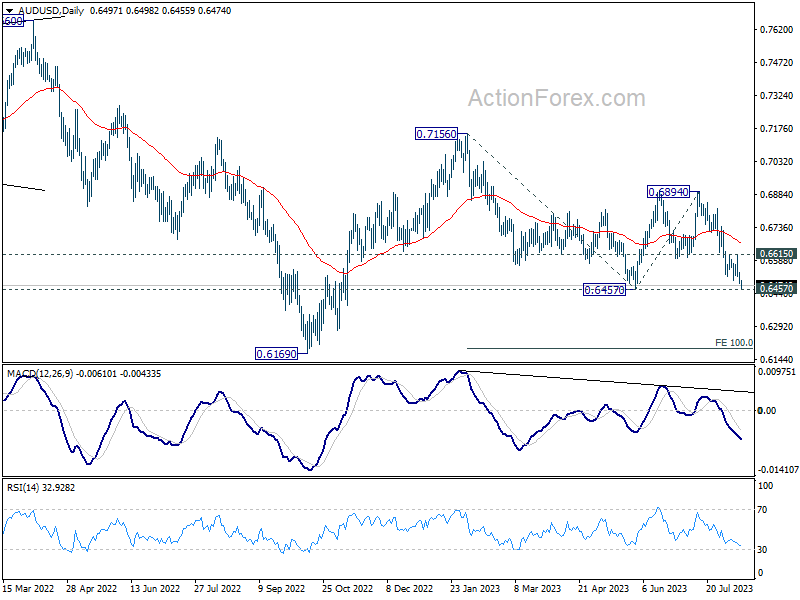
In the bigger picture, the down trend from 0.8006 (2021 high) could still be in progress. Break of 0.6457 will affirm this bearish case. Further break of 0.6169 will target 61.8% projection of 0.8006 to 0.6169 to 0.7156 at 0.6021. This will now remain the favored case as long as 0.6894, in case of strong rebound.
Aussie and Kiwi Feel the Heat as Asian Risks Rise
Australian and New Zealand Dollars faced broad-based pressures in today's Asian session, as markets are gripped by risk-off mood. Hong Kong HSI is witnessing the most significant downturn, in the wake of the beleaguered Chinese property developer, Country Garden, halting trading on at least ten of its mainland bonds. This move has ignited broader decline in property-related stocks. Kiwi faces added burdens, stemming from lackluster services data signaling an intensified contraction in activity. Meanwhile, both Yen and Dollar have risen amid heightened risk aversion, though the former appears to be marginally in the lead. European majors present a mixed picture at the moment.
Despite today's potential trading lull, due to a barren economic calendar in Europe and North America, the markets are bracing themselves for a whirlwind of significant events. Come tomorrow's Asian session, all eyes will be on Japan's GDP, minutes from RBA meeting, and a suite of Chinese economic indicators including industrial production, retail sales, and the unemployment rate. Hence, beware that some traders are jumping the gun to prepare for tomorrow.
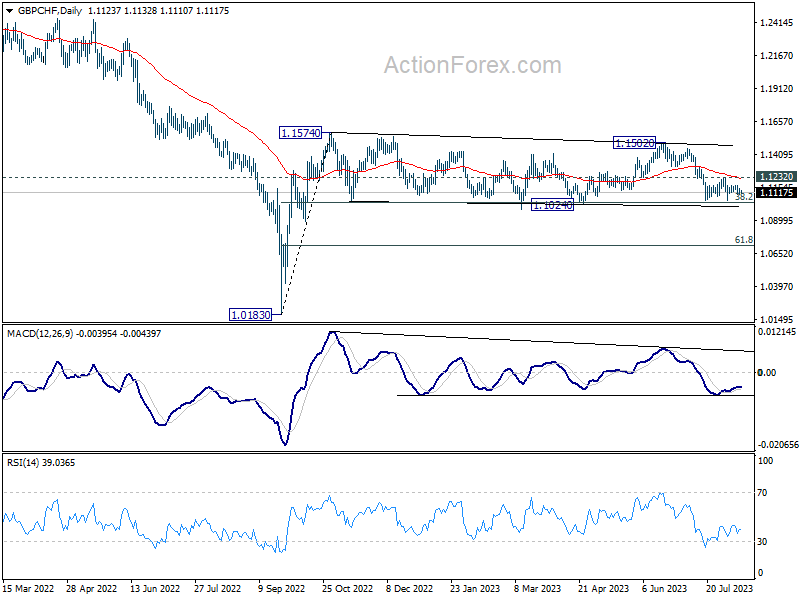
This week also casts a spotlight on Sterling, with UK's employment statistics, inflation data, and retail sales figures due for release. On the technical front, GBP/CHF is still battling to uphold 1.1024 support level, which has kept it within the medium-term range stemming from 1.1574. Risk is tilted to the downside as 1.1232 resistance remains intact. Firm break of 1.1024, spurred either by adverse UK data or a shift towards Franc as a safe haven, would send the cross lower to 61.8% retracement of 1.0183 to 1.1574 at 1.0714.
In Asia, Nikkei closed down -1.27%. Hong Kong HSI is down -2.06%. China Shanghai SSE is down -0.33%. Singapore Strait Times is down -1.66%. Japan 10-year yield is up 0.0193 at 0.608, back above 0.6%.
NZ BNZ services plunges down to 47.8, deepening contraction as activity dives
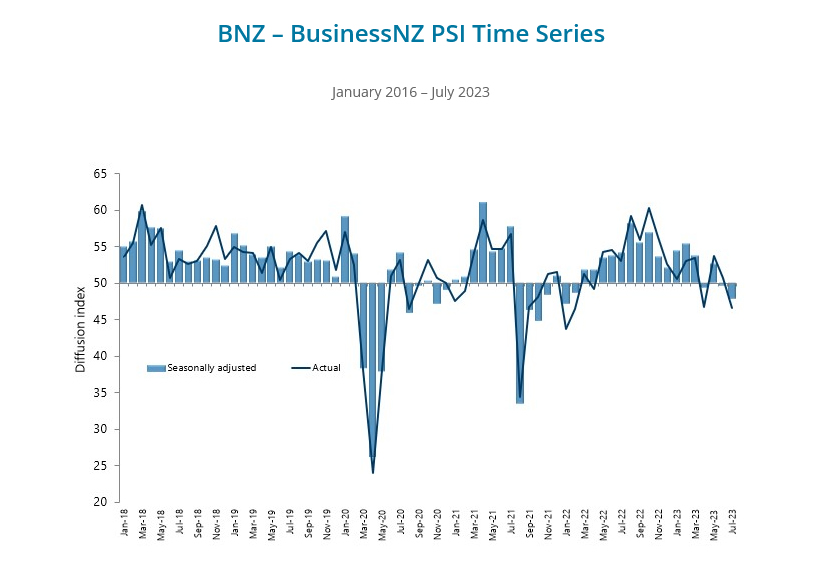
New Zealand's service sector, as gauged by the BusinessNZ Performance of Services Index, experienced a marked decline in July, descending from 49.6 to a worrying 47.8. This latest reading is not only the lowest since January 2022 but also trails the long-term average of 53.5 significantly.
A detailed analysis of the index highlights concerning trends. The activity component has sharply dropped from 50.9 to 39.6, marking its worst performance since August 2021 and setting a gloomy record. Specifically, this month's reading stands as the worst non-lockdown related reading on record since 2007. New orders within businesses have taken a substantial hit, plummeting from 50.4 to 43.8.
Meanwhile, employment showed a marginal decrease, moving from 49.1 to 49.0. On a brighter note, stocks or inventories observed an increase, jumping from 47.2 to 54.0, with supplier deliveries also ticking up from 51.0 to 52.1.
BusinessNZ's Chief Executive, Kirk Hope, said. "The further fall into contraction during July also saw another lift in the proportion of negative comments," he remarked, drawing attention to the sharp increase in negative feedback, which escalated to 67% from 55.6% in June and 49.4% in May.
Hope continued, "Overall, negative comments received were strongly dominated by a general downturn in the economic conditions/slowing economy, as well as ongoing increased costs."
BNZ Senior Economist, Doug Steel, weighed in on the data, highlighting a distressing pattern. "The results all point to a sharp drop in demand in July, significantly accelerating the slowing trend that had been evident for many months," he said.
NZD/USD under siege on domestic data and Asian market risks
NZD/USD is having a notable decline today, pressured by dismal services data from New Zealand and an escalating sense of risk aversion throughout Asian markets. This downtrend also sets a tense backdrop leading up to this week's RBNZ rate decision, with the central bank widely anticipated to hold for the second consecutive month.
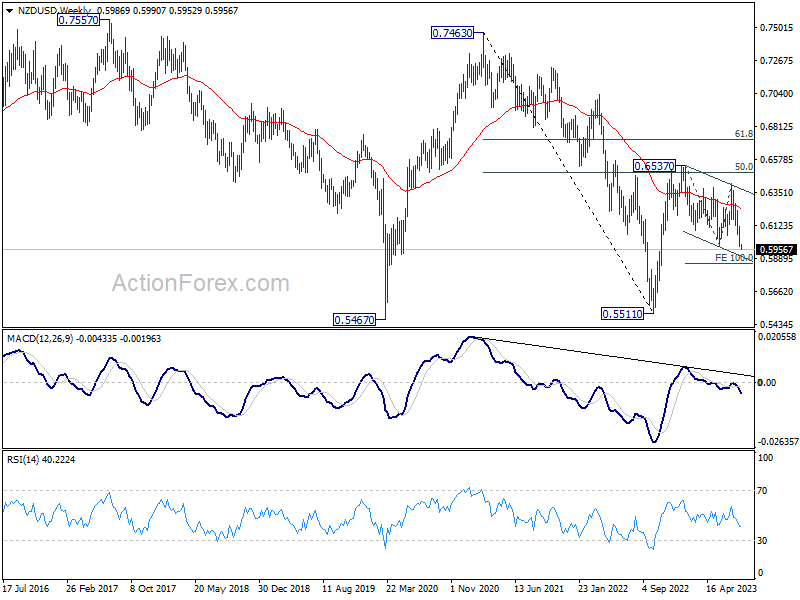
Last week's break of 0.5984 support should confirm resumption of whole decline from 0.6537. Near term outlook in NZD/USD will stay bearish as long as 0.6117 resistance holds. Next target is 100% projection of 0.6537 to 0.5894 from 0.6410 at 0.5857.
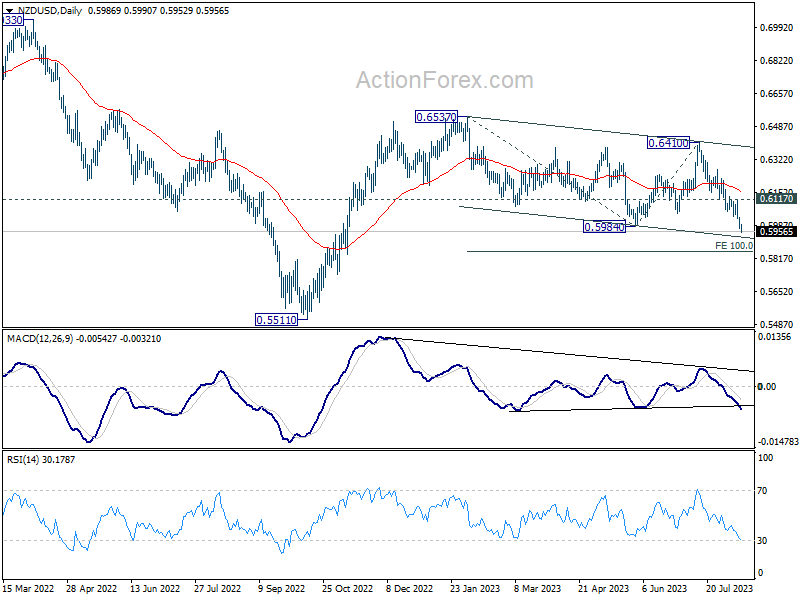
For now, the structure of the decline from 0.6537 is still favoring that it's a correction to rebound from 0.5511. Hence, strong support should emerge below 0.5857 to bring reversal. However, any downside acceleration below 0.5857 would raise the chance that it's indeed resuming the larger down trend through 0.5511.
A busy week with RBNZ decision, RBA and Fed minutes, lots of data
In a week set to be bustling with significant economic updates, market watchers are paying attention to pivotal decisions and minutes from leading central banks, as well as a string of important data.
RBNZ is widely anticipated to maintain its OCR at 5.50% in its upcoming gathering, marking a second consecutive pause. While Q2 inflation rate of 6% came in below the bank's own forecasts, the sudden rise in inflation expectations, as indicated in RBNZ's latest survey, has raised eyebrows. The robust job market, although slightly marred by a marginal increase in unemployment rate, keeps the speculation rife. Market whispers suggest a coin toss probability for another rate hike this year, but this balance hangs precariously, susceptible to shifts based on any unforeseen projection revelations.
Also Down under, RBA's August minutes are expected to echo the familiar tune of contentment with the prevailing monetary policy. The bank exudes confidence in maneuvering the challenging course towards a low inflation environment, ensuring minimal adverse impacts on the economy.
Meanwhile, the Federal Reserve's July meeting minutes are drawing significant attention. The overarching sentiment leans towards Fed maintaining its current stance in the upcoming September meeting. But the waters are murky beyond that, with evident divisions among Fed officials. Investors and analysts alike will dissect the minutes, seeking clues on potential tightening debates. However, clear directives might be elusive, reinforcing the bank's data-dependent strategy.
Furthermore, an array of economic data from around the globe will punctuate the week. Notable releases include US retail sales, Germany's ZEW, UK's employment and CPI figures, Japan's GDP and CPI, Canada's CPI, Australia's employment metrics, and a suite of Chinese economic indicators. Undoubtedly, traders and investors will be kept on their toes, with potential market-moving news popping up daily.
Here are some highlights for the week:
- Monday: NZ BusinessNZ services index; Germany WPI.
- Tuesday: Japan GDP; RBA minutes, wage price index; China industrial production, retail sales, fixed asset investment; UK employment; Swiss PPI; Germany ZEW economic sentiment; Canada CPI, manufacturing sales; US retail sales, Empire State manufacturing index, import prices, business inventories, NAHB housing index.
- Wednesday: RBNZ rate decision; UK CPI, PPI; Eurozone GDP revision, industrial production; Canada housing starts, wholesales sales; US housing starts and building permits, industrial production; FOMC minutes.
- Thursday: New Zealand PPI; Japan trade balance, machine orders, tertiary industry index; Australia employment; Eurozone trade balance; US jobless claims, Philly Fed index.
- Wednesday: Japan CPI; UK Gfk consumer confidence, retail sales; Eurozone CPI final; Canada IPPI and RMPI.
AUD/USD Daily Report
Daily Pivots: (S1) 0.6476; (P) 0.6505; (R1) 0.6524; More...
Intraday bias in AUD/USD stays on the downside at this point. Decisive break of 0.6457 support will confirm resumption of whole fall from 0.7156. Next target is 100% projection of 0.7156 to 0.6457 from 0.6894 at 0.6195. Nevertheless, firm break of 0.6615 minor resistance will dampen this view, and turn bias back to the upside for stronger rebound.
In the bigger picture, the down trend from 0.8006 (2021 high) could still be in progress. Break of 0.6457 will affirm this bearish case. Further break of 0.6169 will target 61.8% projection of 0.8006 to 0.6169 to 0.7156 at 0.6021. This will now remain the favored case as long as 0.6894, in case of strong rebound.
Economic Indicators Update
| GMT | Ccy | Events | Actual | Forecast | Previous | Revised |
|---|---|---|---|---|---|---|
| 22:30 | NZD | Business NZ PSI Jul | 47.8 | 50.1 | 49.6 | |
| 06:00 | EUR | Germany Wholesale Price Index M/M Jul | -0.20% | -0.20% |
Sentiment Sours on Further Bad News from China
The week starts on a bad mood as the Chinese property worries escalate with Country Garden suspending almost a dozen of onshore bonds starting from today. Plus, Zhongzhi Enterprise Group, which has around 1 trillion yuan under management failed on its payments linked to products issued by its companies last Friday, further fueling the stress among investors. The CSI index gap opened below the 50-DMA this morning while the Hang Seng index lost nearly 2.50%. Investors are also concerned that the economic data due to be released this week in China would further dampen sentiment.
American crude is under pressure around $85.50 at the time of talking, the MACD indicator just turned bearish hinting that we could see some more downside correction in case of weak news this week, and more bears could join to test the $80pb level to the downside. Likewise, copper futures, which serve as a gauge of global economic health continues its deep dive. Since the start of the month, they have been down by more than 8%.
Some easing in energy and metal prices could be a good thing, as Friday’s producer price index in the US came in stronger than expected, both for the headline and the core metrics. The PPI accelerated 0.8% in July, slightly faster than 0.7% expected by analysts, while the core PPI remained flat at 2.4%, instead of a tick lower to 2.3% as expected by analysts. The stronger-than-expected set of producer price data sent the US 2-year yield above the 4.90% and the dollar index above the March to now down-trending channel top, and back into a long-term ascending trend. The EURUSD slipped below its 50-DMA on the back of a stronger US dollar and is testing the 100-DMA, at 1.0930, to the downside, while the USDJPY is about to test the 145 mark. But a potential break of the 145 resistance isn’t very exciting for the yen bears as these are the levels that the Bank of Japan (BoJ) is inclined to intervene to cool down the selling pressure on the yen. In New Zealand, the kiwi slipped below the 60 cents level in the run up to the latest Reserve Bank of New Zealand (RBNZ) decision due Wednesday. The RBNZ is expected to keep the rates unchanged at 5.5%.
For the UK, the news was, for once, better than expected, as Friday’s GDP data surprised to the upside with a 0.2% growth in Q2. Output in July rose more than double the analyst expectations thanks to a sunny July and Prince Charles coronation, and Cable rose on Friday on expectation that the encouraging figures would fuel inflation and wages, and lead to further rate hikes from the BoE – which expects a more meaningful expansion this quarter. Though, British economy is the worst performer among G7 since last quarter of 2019, and the deepening housing crisis – with now news of a rise in tax proceeds from property disposals and which is expected to lead to a further selloff by landlords, puts the British growth in jeopardy. Sterling is under pressure this morning against the broadly-stronger USD and the short—term trend remains comfortably negative with a possibility of a slump to and the 100-DMA, which stands near the 1.26 mark, especially if this week’s inflation data points to a further easing in British inflation.
In precious metals, gold remains under the pressure of rising yields and a stronger US dollar across the board. Support is seen before the $1900 per ounce, where stands the 200-DMA, but we can’t rule out the possibility of a further strength in the US dollar this week, hence a slide for gold below the 200-DMA and the $1900 psychological mark.
This week
Investors’ focus will shift to US retail sales and earnings from US big retailers, including Walmart, Target and Home Depot. Overall, retail sales in July may show a slight acceleration, but goods prices are not what puts the biggest pressure on inflation, shelter is. Shelter was indeed responsible for 90% of the CPI’s monthly gain last month. So yes, stronger-than-expected retail sales could fuel the idea that the US economy will fall on its four feet and avoid recession amid the Federal Reserve’s (Fed) aggressive tightening cycle, but it won’t necessarily impact inflation expectations. But anyway, strong sales data and encouraging earnings could halt bleeding in US stocks, where both the S&P500 and Nasdaq posted their second straight weekly decline last week.
US Yields Keep Rising Given Speculation of More Hawkish Federal Reserve
Market movers today
The week kicks off in a quiet fashion as many Europeans are still on summer holiday.
Later this week, tomorrow brings German ZEW index and US retail sales.
On Wednesday, we expect the RBNZ to keep rates unchanged. FOMC minutes are released on the same evening. On Thursday, we have Norges Bank where we expect a 25bp hike in line with consensus. Overall, due to holiday period, very few central bank speeches are scheduled.
Friday brings July final HICP print for euro area with detailed data on components.
The 60 second overview
10Y US Treasury yields moved higher on Friday on the back of higher than expected producer prices. Given the hawkish comments from some of the Federal Reserve members the markets will read the minutes from the FOMC meeting extra carefully when it is released on Wednesday.
There are plenty of speculation in the market when the Federal Reserve will begin to ease monetary policy and whether they will keep policy rates higher for longer. Currently, the market is pricing an unchanged Federal Reserve for the rest of 2023 and rate cuts already in late Q1 and Q2 for a total of 125bp in 2024.
The hot weather is adding pressure on the oil price and thus on inflation. This is seen in e.g. both 5y5y US and EUR inflation swaps, which are drifting higher.
The big events in the Nordic market this week is the Swedish inflation data on Tuesday and the Norges Bank meeting on Thursday. Swedish inflation is expected to decline as CPIF is expected to decline from 0.9% m/m in June to 0% m/m in July according to the consensus forecast. Norges Bank is expected to raise rates by 25bp. This is fully priced by the market and the risk is if they do 50bp, but we expect they will only do 25bp.
There are some speculation regarding intervention in the JPY as the JPY is testing the 145-level versus the dollar. Some market participants are looking for an intervention in the 145-150-level.
Equities: Global equities lower Friday with several indices seeing another weekly decline. The most interesting part was the US session where we saw a preference for defensives but also a stagflationary rotation where banks were in favour together with defensives as yields ticked higher. US PPI data blamed weak risk sentiment, but may be more a reflection of investors having too high hopes on the soft-landing scenario. In US on Friday, Dow +0.3%, S&P 500 -0.1%, Nasdaq -0.7% and Russell 2000 +0.1%. Negative sentiment in Asia this morning dragged down by China and new worries in the property sector. US and European futures down 0.2%-0.3% this morning.
FI: 10Y US Treasury yields moved higher Friday on the back of higher than expected producer prices. Given the hawkish comments from some of the Federal Reserve members the markets will read the minutes from the FOMC meeting extra carefully when it is released on Wednesday.
FX: Scandies dropped along with NZD and AUD on Friday, where the USD came out on top together with GBP. In particular, EUR/SEK is under the rise again and now close to the historic high form early July. EUR/USD trades in the 1.09-1.10 range.
Credit: iTraxx Main traded slightly wider during Friday and closed 1bp wider at 71.6bp, while Xover moved out 7.2bp during the session to close at 402.7bp. The week was characterized by basically unchanged CDS levels and relatively muted activity in the primary market, sentiment remains constructive in credit space and investor appetite for new deals continue to look solid
Technical Outlook and Review
DXY:
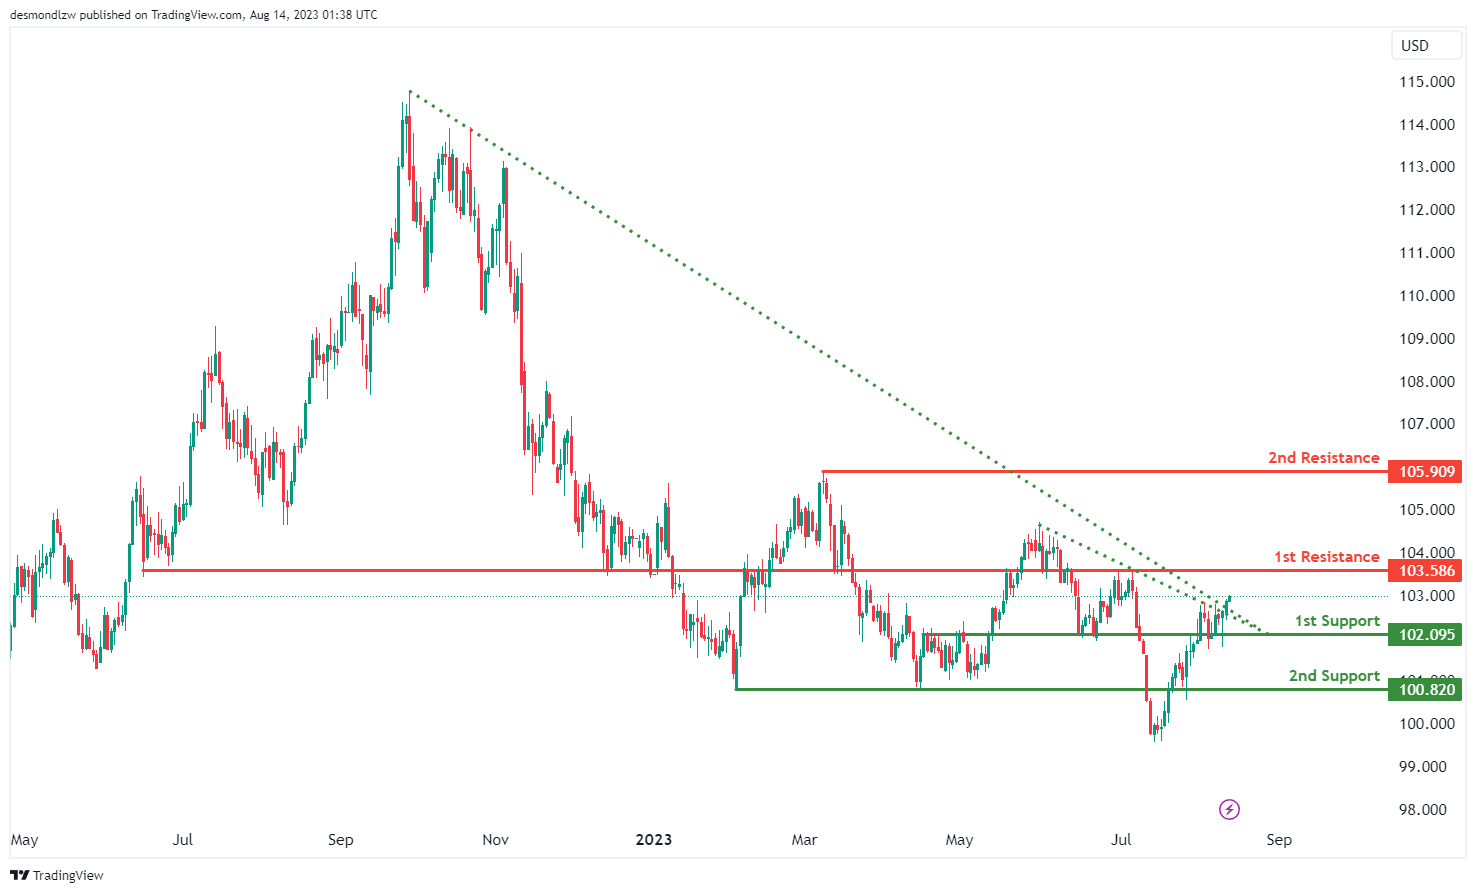
The DXY chart is currently exhibiting a bullish momentum driven by the price breaking above a descending resistance line, indicating a potential upward trend.
With this bullish sentiment, there is a possibility that the price could continue its upward movement towards the 1st resistance level at 103.58.
The significance of the 1st support level at 102.09 lies in its identification as an overlap support, while the 2nd support at 100.82 is reinforced by being a swing low support.
On the other hand, the 1st resistance level at 103.58 is noteworthy as an overlap resistance, and a 2nd resistance at 105.90 is identified as a swing high resistance, adding to its potential as a resistance level.
EUR/USD:
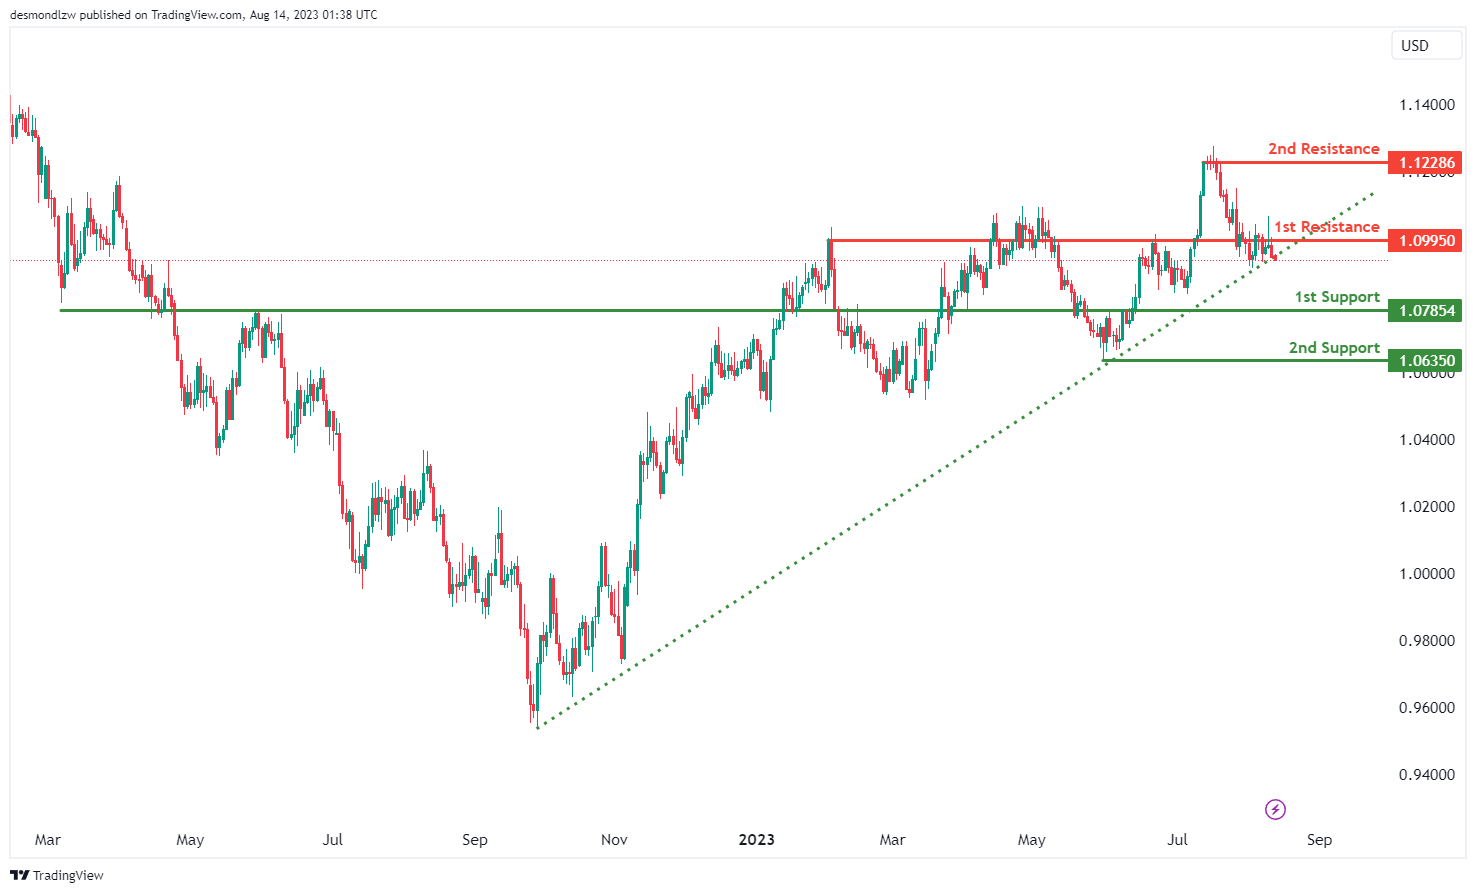
The EUR/USD chart currently exhibits a bearish momentum, indicating a predominant downward trend.
This bearish sentiment is driven by the price breaking below an ascending support line, suggesting the possibility of a further downward movement.
The potential scenario involves the price continuing its bearish trend towards the 1st support level at 1.0785.
The significance of the 1st support level at 1.0785 is due to its function as a pullback support, while the 2nd support at 1.0635 is further supported as a swing low support.
On the other hand, the 1st resistance level at 1.0995 holds importance as an overlap resistance, and a 2nd resistance at 1.1228 is identified as a multi-swing high resistance.
EUR/JPY:
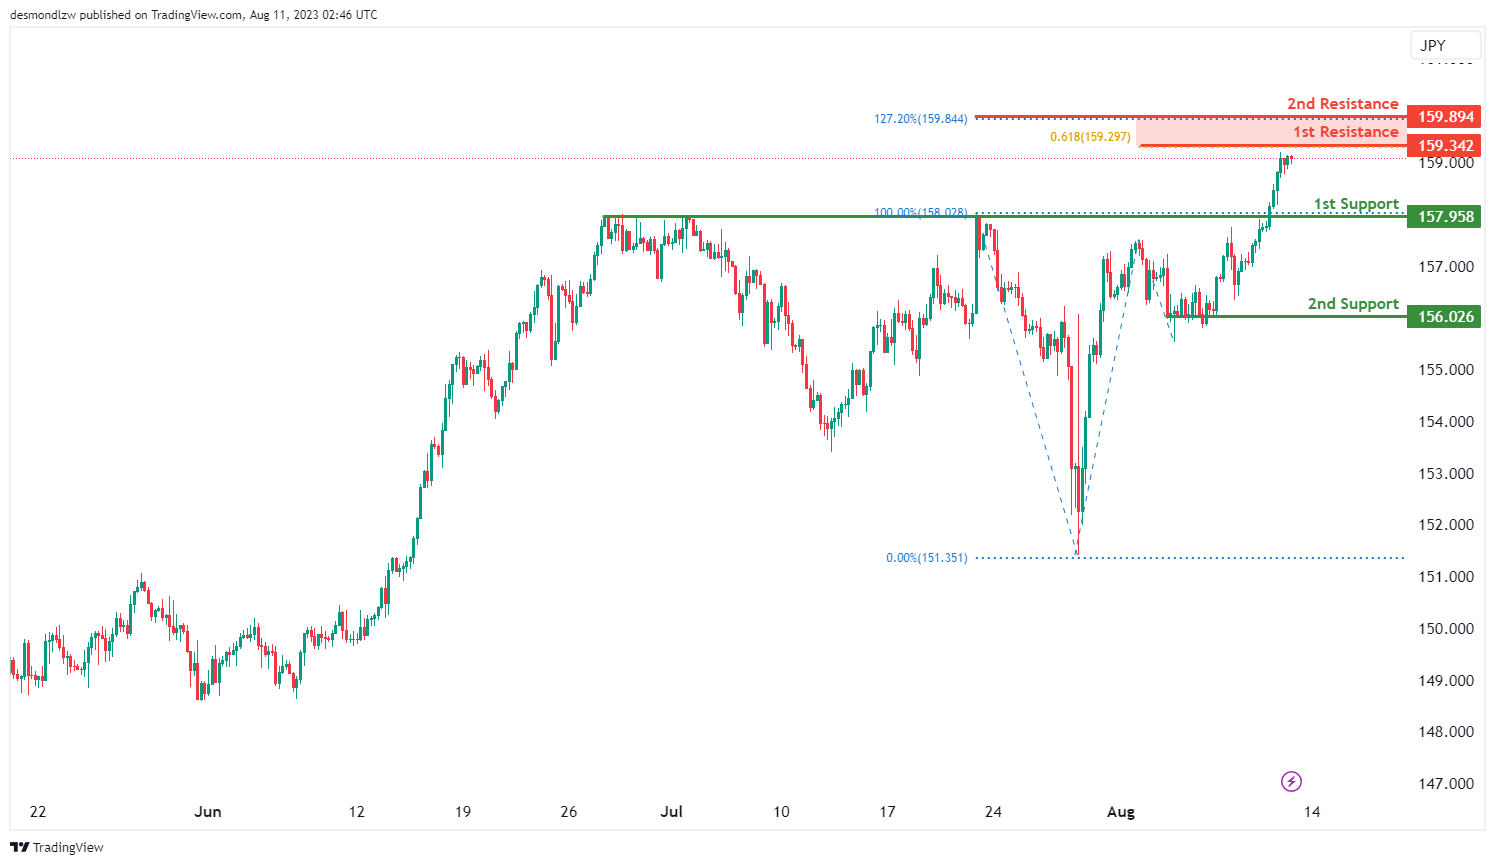
The current trend on the EUR/JPY chart indicates a bullish momentum, suggesting a prevailing upward movement. Within this context, there’s a potential for the price to continue its bullish trend towards the resistance level.
The significance of the support at 157.95 is in its capacity as a pullback support, while the 2nd support at 156.02 is identified as a support level during multiple swing lows.
On the other hand, the resistance at 159.34 gains importance due to its association with a 61.80% Fibonacci Projection.
Further indication of potential resistance is provided by the presence of a 2nd resistance at 159.89, which aligns with a 127.20% Fibonacci Extension.
EUR/GBP:
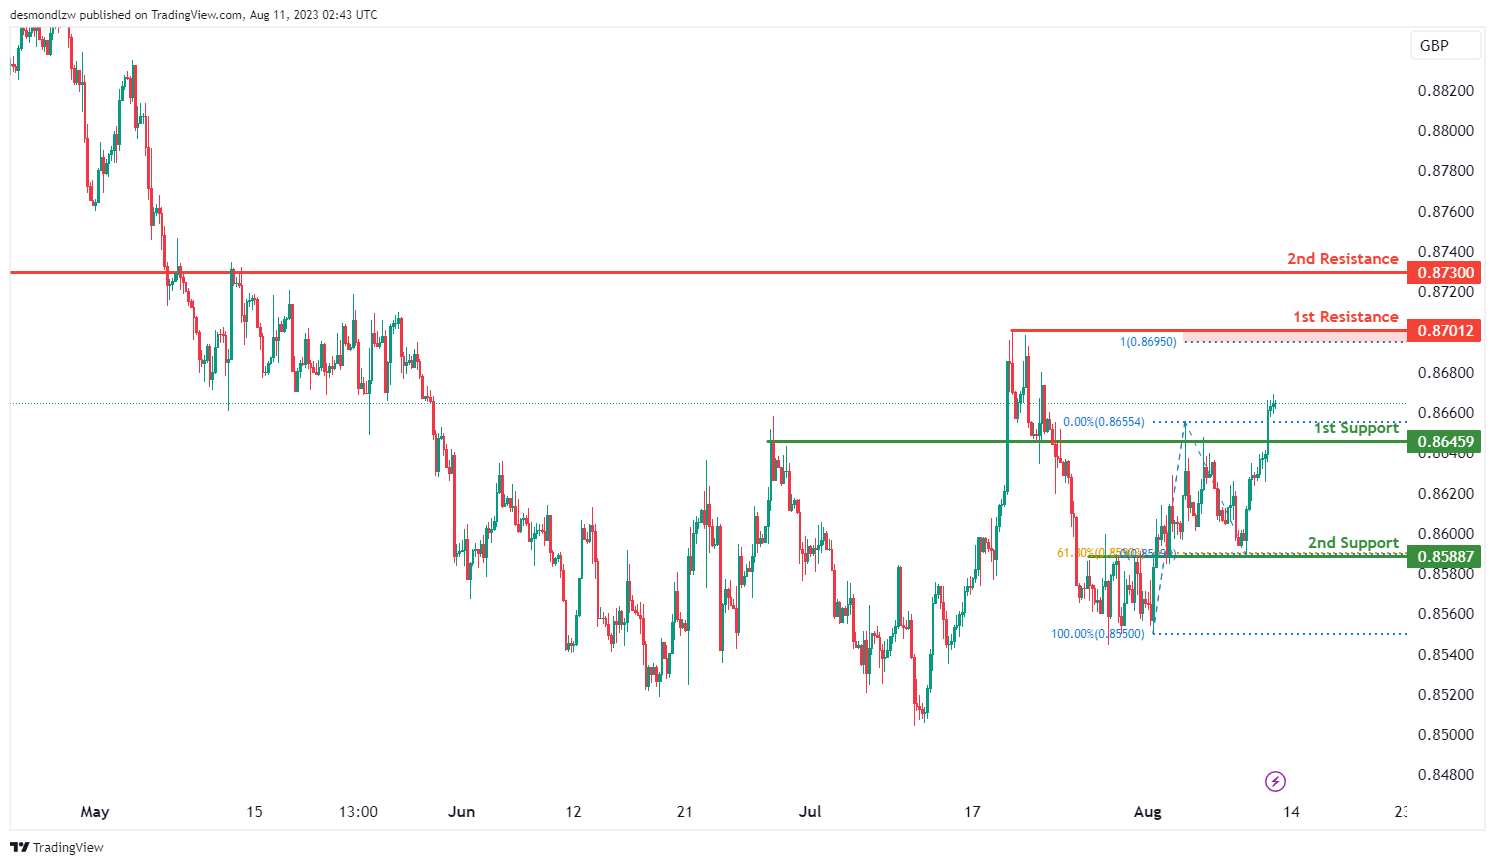
The EUR/GBP chart currently indicates a bullish momentum, suggesting an ongoing upward trend. In light of this bullish sentiment, there is potential for the price to continue its bullish movement towards the resistance level.
The support level at 0.8645 is noted as a pullback support, and there is an additional 2nd support at 0.8588, identified as a pullback support aligned with a 61.80% Fibonacci Retracement.
Conversely, the resistance level at 0.8701 is significant as it acts as a swing high resistance with the reinforcement of a 100% Fibonacci Projection.
Further reinforcement for potential resistance is provided by a 2nd resistance level at 0.8730, characterized as a pullback resistance.
GBP/USD:
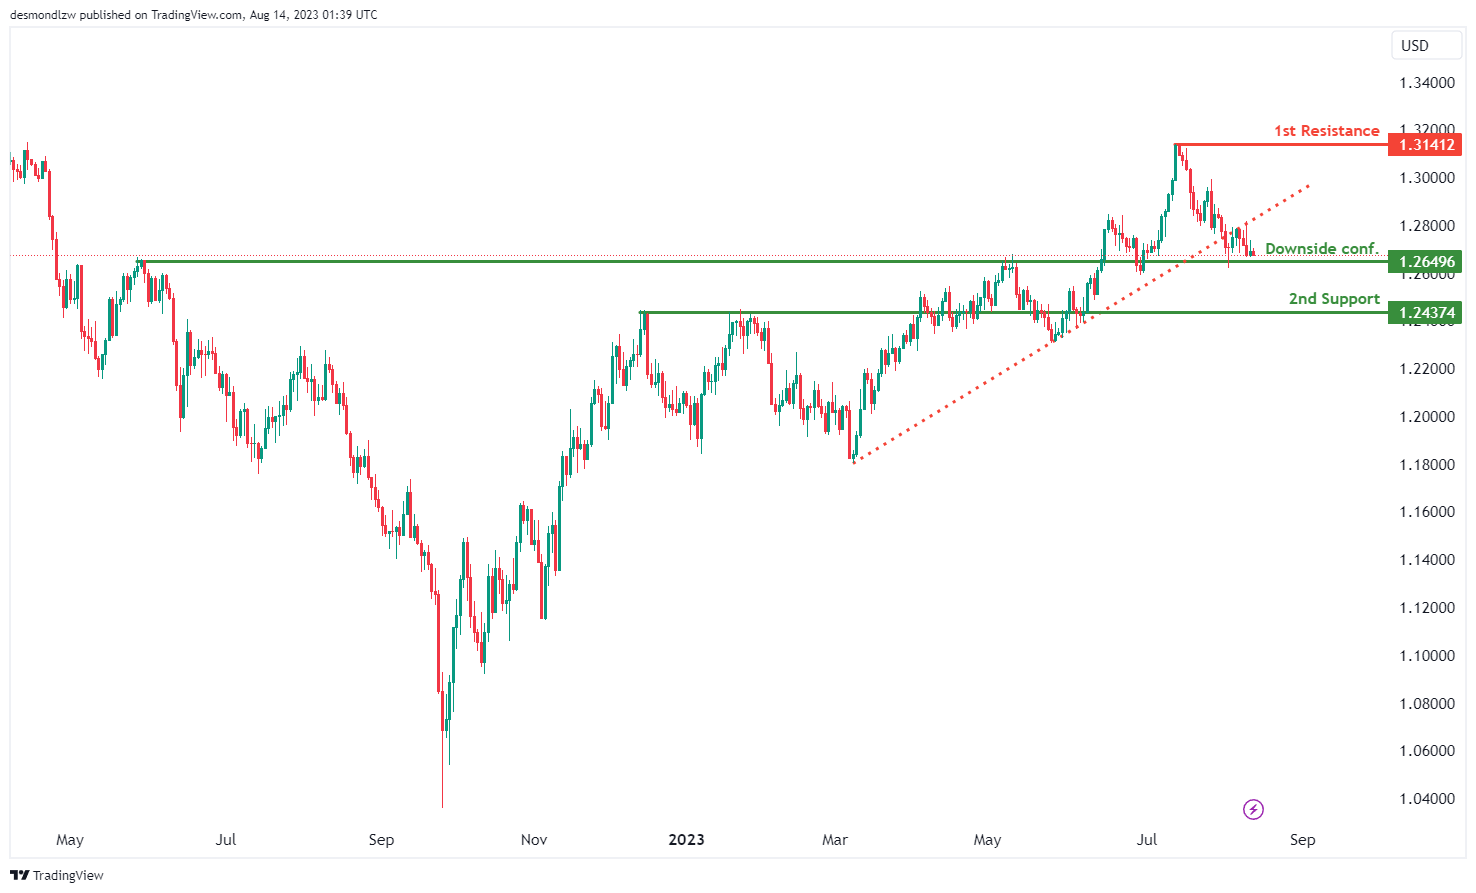
The GBP/USD chart currently exhibits a bearish momentum, indicating a prevailing downward trend.
This bearish momentum is supported by the price breaking below an ascending support line, suggesting the potential for a continued downward movement.
In the near term, there is a possibility for the price to experience a temporary rise towards the 1st resistance level at 1.3141 before reversing its direction and moving downward again.
The significance of the 1st support level at 1.2649 is due to its role as an overlap support, while the 2nd support at 1.2437 is reinforced as a pullback support. Conversely, the 1st resistance level at 1.3141 is noted as a swing high resistance.
GBP/JPY:
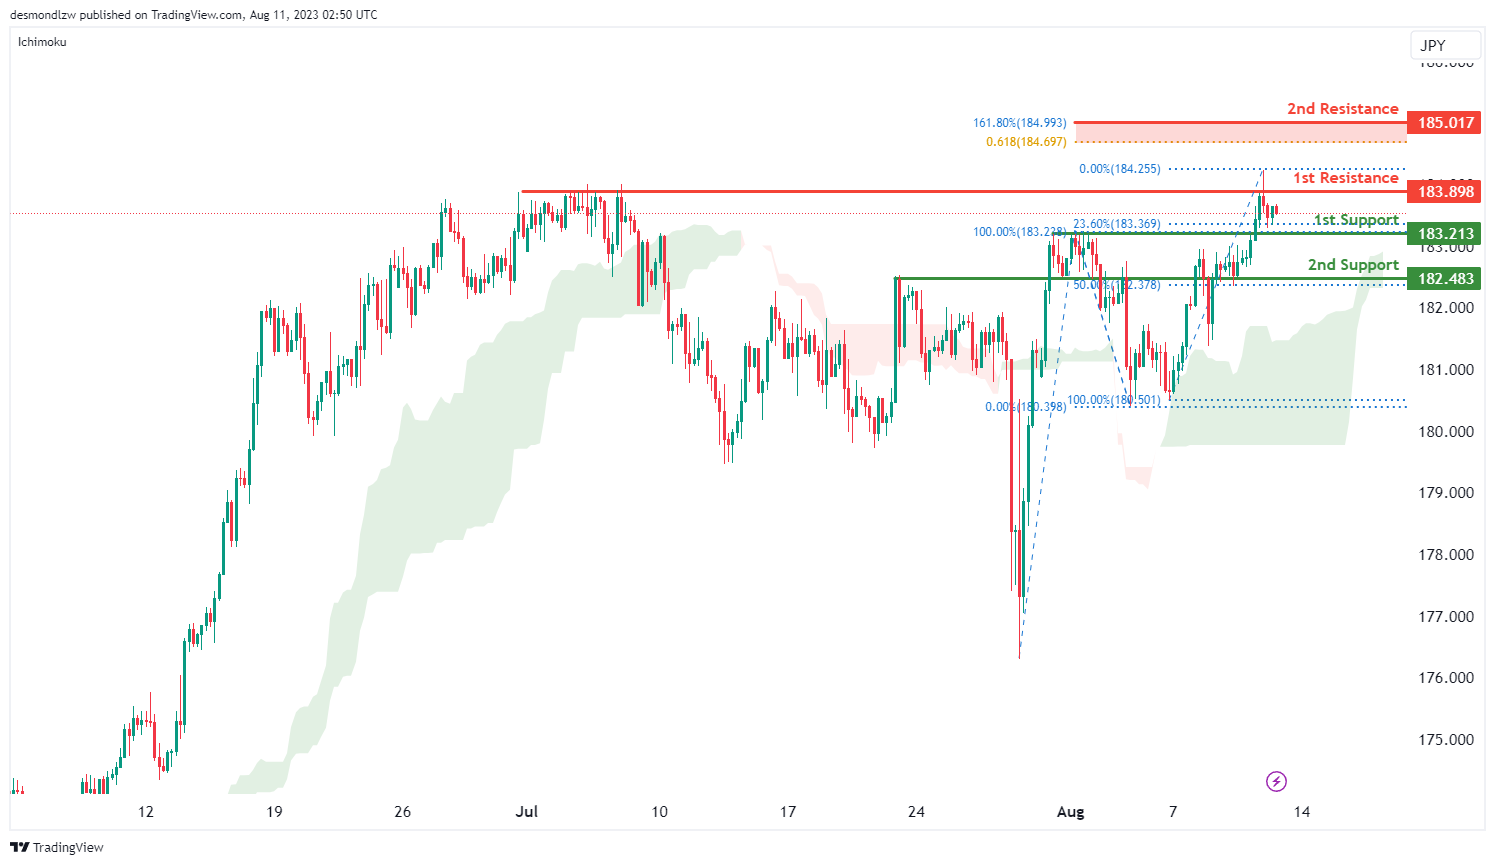
The current momentum of the GBP/JPY chart is bullish, indicating a predominant upward trend. This sentiment is supported by the fact that the price is currently trading above the bullish Ichimoku cloud.
In light of this bullish outlook, there is a potential opportunity for the price to continue its upward movement towards the resistance level at 183.89.
The support level at 183.21 holds importance as it serves as a pullback support, with additional reinforcement coming from a 2nd support level at 182.48.
Conversely, the resistance level at 183.89 is noteworthy as it is a multi-swing high resistance, which could potentially hinder further upward advancement.
The presence of a 2nd resistance level at 185.01, identified as a pullback resistance, adds further weight to the potential resistance areas on the chart.
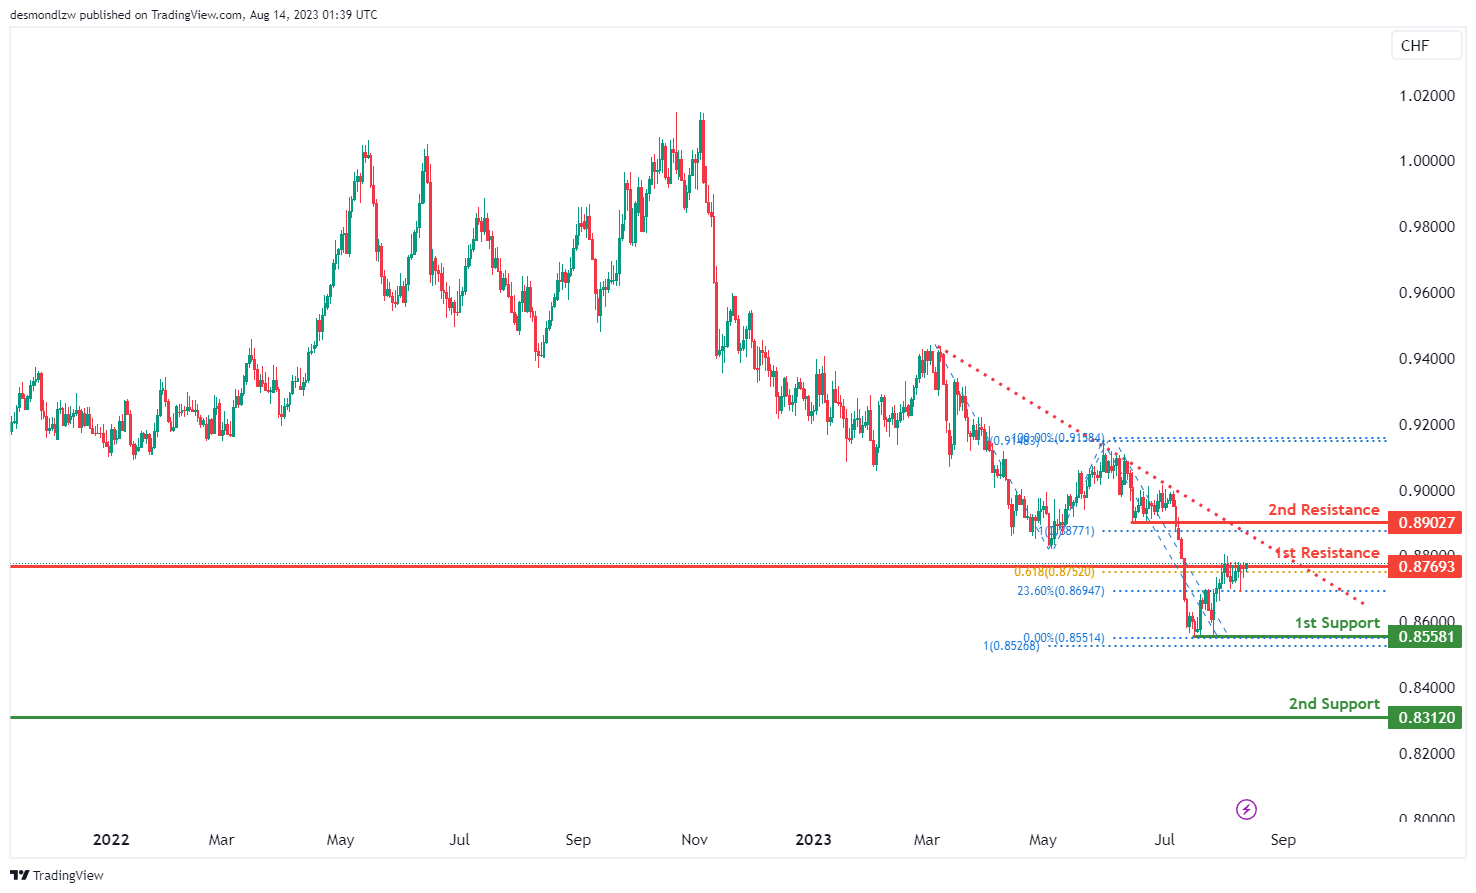
USD/CHF:
The USD/CHF chart currently reflects a bearish momentum, indicating a predominant downward trend.
Considering this bearish sentiment, there’s a possibility for the price to exhibit a bearish reaction upon reaching the 1st resistance level, leading to a potential decline towards the 1st support level.
The significance of the 1st support at 0.8558 lies in its role as a multi-swing low support. Additionally, a 2ndary support at 0.8312 reinforces the support structure.
Conversely, the 1st resistance level at 0.8769 is highlighted as an overlap resistance.
Moreover, a 2nd resistance at 0.8902 is identified as a pullback resistance, further contributing to the potential for resistance against upward movement.
USD/JPY:
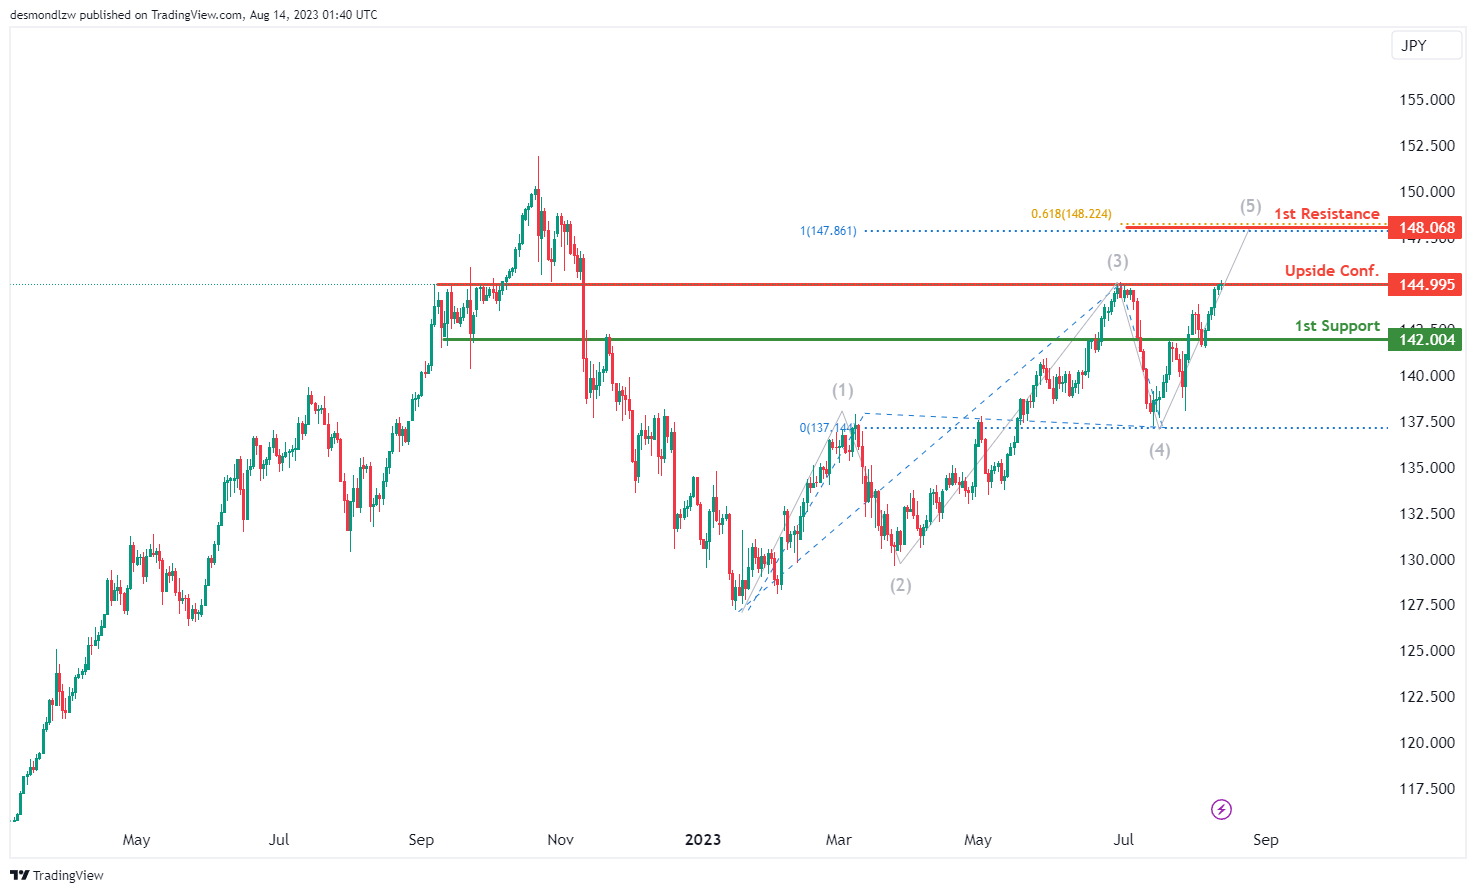
The current momentum of the USD/JPY chart suggests a bearish trend, indicating a potential downward movement. In this context, there is a potential scenario where the price reacts bearishly upon reaching the 1st resistance level and drops towards the 1st support.
The 1st support level at 142.00 holds significance as an overlap support.
On the other hand, the 1st resistance level at 148.06 is important due to its alignment with both a 100% Fibonacci Projection and a 61.80% Fibonacci Projection, which indicates a possible Fibonacci confluence.
Waiting for upside confirmation at 144.99 highlights this level as an overlap resistance, suggesting a potential reversal point.
USD/CAD:
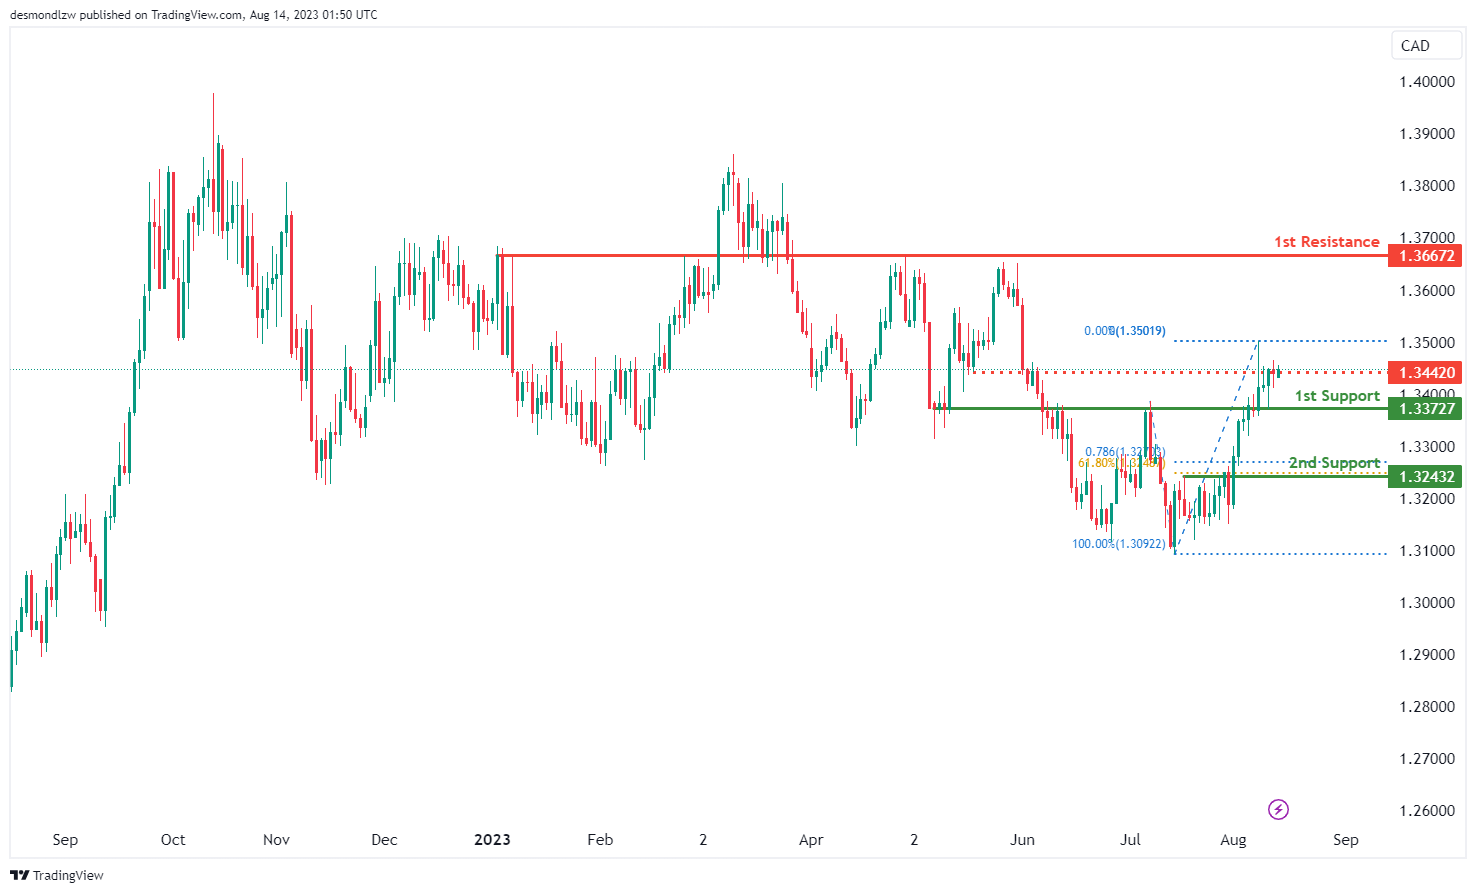
The current momentum of the USD/CAD chart indicates a bullish trend, suggesting a potential for further upward movement should price break through the intermediate resistance.
The intermediate resistance level at 1.3442 is recognized as a pullback resistance while the 1st resistance level at 1.3668 is recognized as an overlap resistance.
To the downside, the 1st support at 1.3373 is recognized as an overlap support level. The 2nd support level at 1.3243 is recognized as a pullback support that aligns with the 61.80% Fibonacci retracement and 78.60% Fibonacci projection levels, indicating a confluence of Fibonacci levels.
AUD/USD:
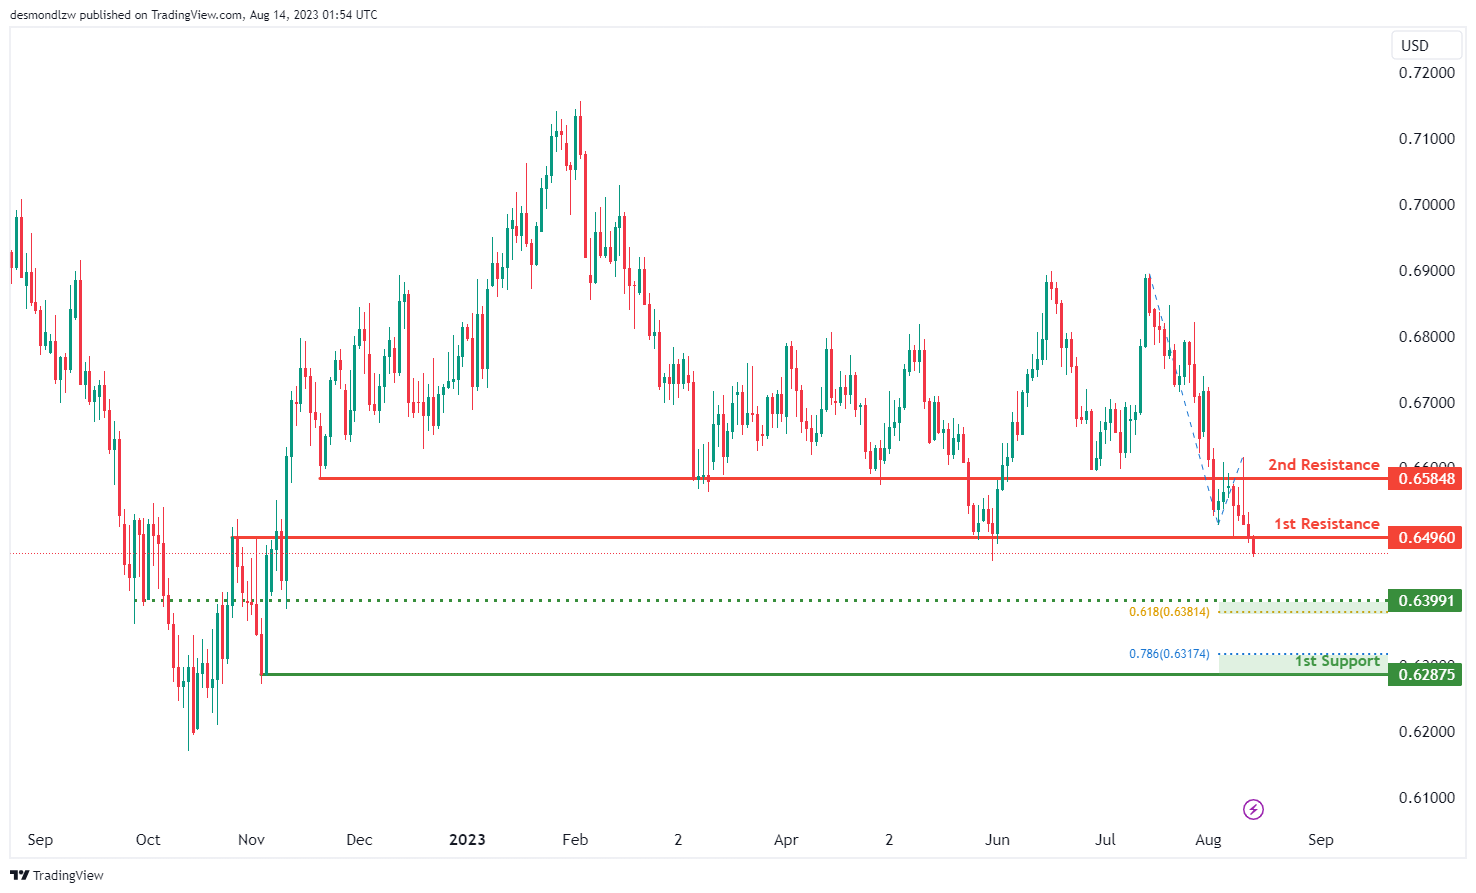
The current state of the AUD/USD chart indicates a bearish momentum, implying a downward movement towards the intermediate support level.
The intermediate support level at 0.6399 is supported by an overlap support that aligns closely with the 61.80% Fibonacci projection level. Further below, the 2nd support at 0.6288 is also recognized as a pullback support that is further reinforced by its alignment with the 78.60% Fibonacci projection level.
To the upside, the 1st resistance level at 0.6496 is marked by an overlap resistance. An additional barrier of resistance is observed at the 2nd resistance level of 0.6585 which is also identified as an overlap resistance.
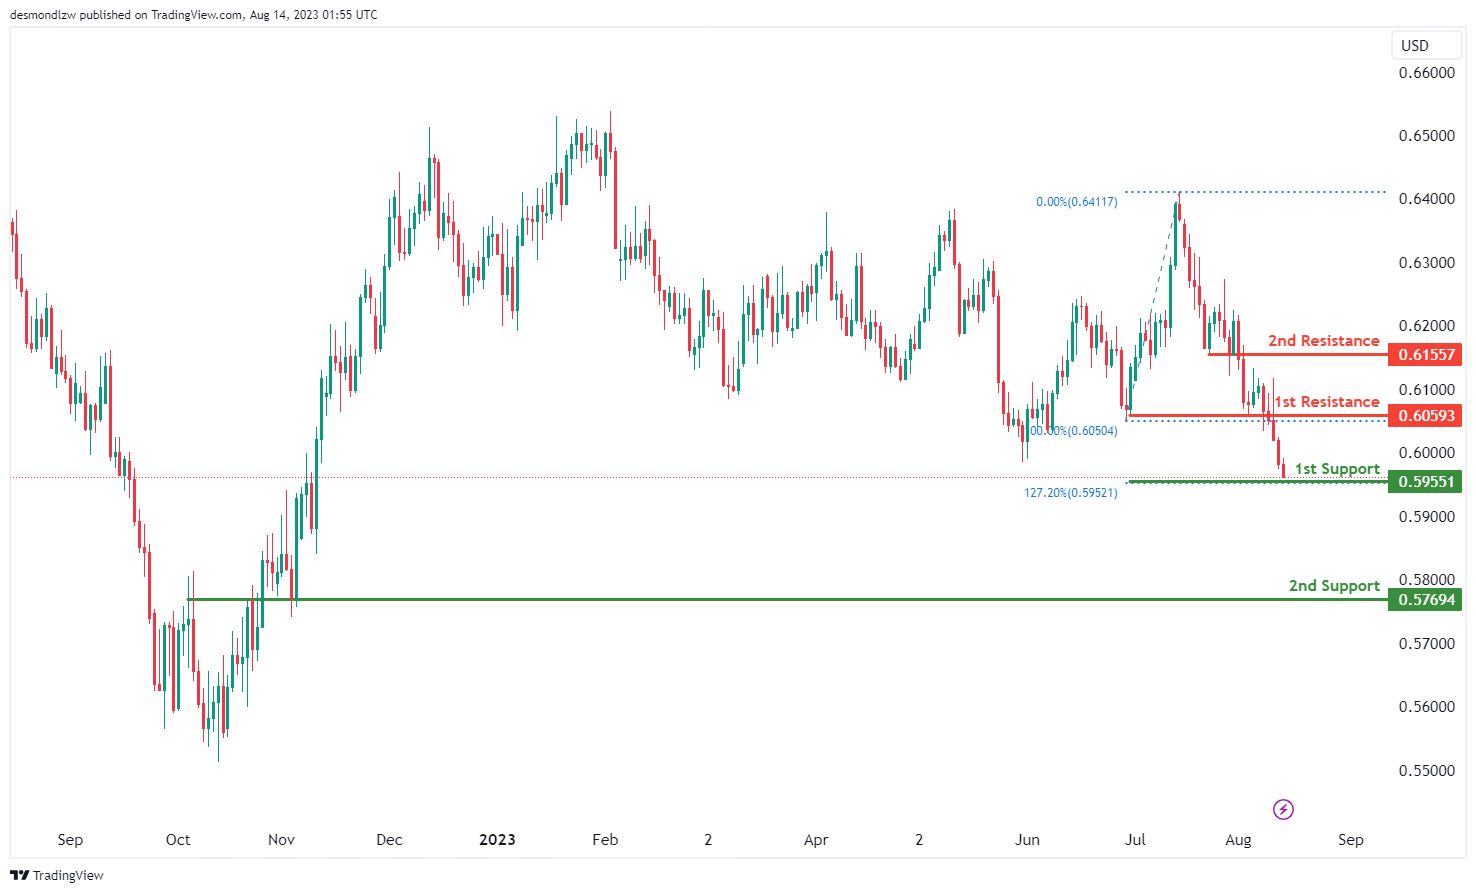
NZD/USD
The current trend of the NZD/USD chart indicates a bearish momentum, implying a downward movement. In this context, there is potential for the price to continue its bearish movement, targeting the 1st support level.
The 1st support level at 0.5955 is a support level that aligns with the 127.20% Fibonacci extension level. Additionally, the 2nd support is found at 0.5769 which is identified as a pullback support level.
To the upside, the 1st resistance level at 0.6059 is noteworthy as an overlap resistance. Furthermore, a 2nd resistance at 0.6156 is identified as a pullback resistance, acting as an additional barrier to upward price movement.
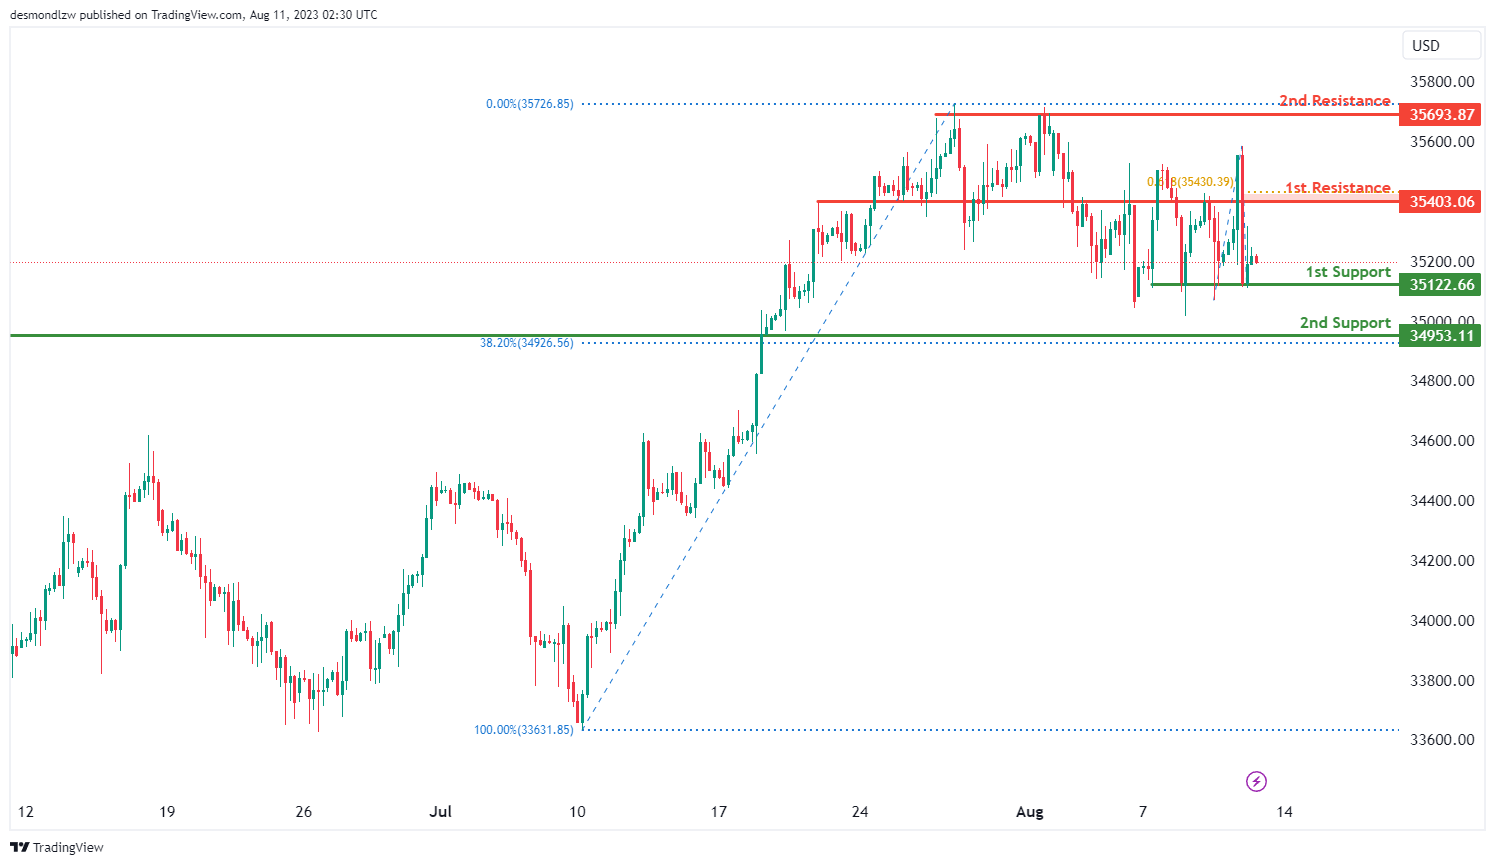
DJ30:
The current momentum of the DJ30 chart indicates a bearish direction, implying a prevailing downward trend.
In light of this bearish sentiment, the potential exists for the price to continue its bearish movement towards the support level at 35122.66, supported by multiple instances of swing low points. An additional support at 34953.11 is reinforced by pullback dynamics and a 38.20% Fibonacci retracement level.
On the flip side, the resistance at 35403.06 is notable for its overlap resistance and a 61.80% Fibonacci retracement level. Additionally, the presence of a 2nd resistance at 35693.87 gains importance due to its alignment with multiple instances of swing high resistance points.
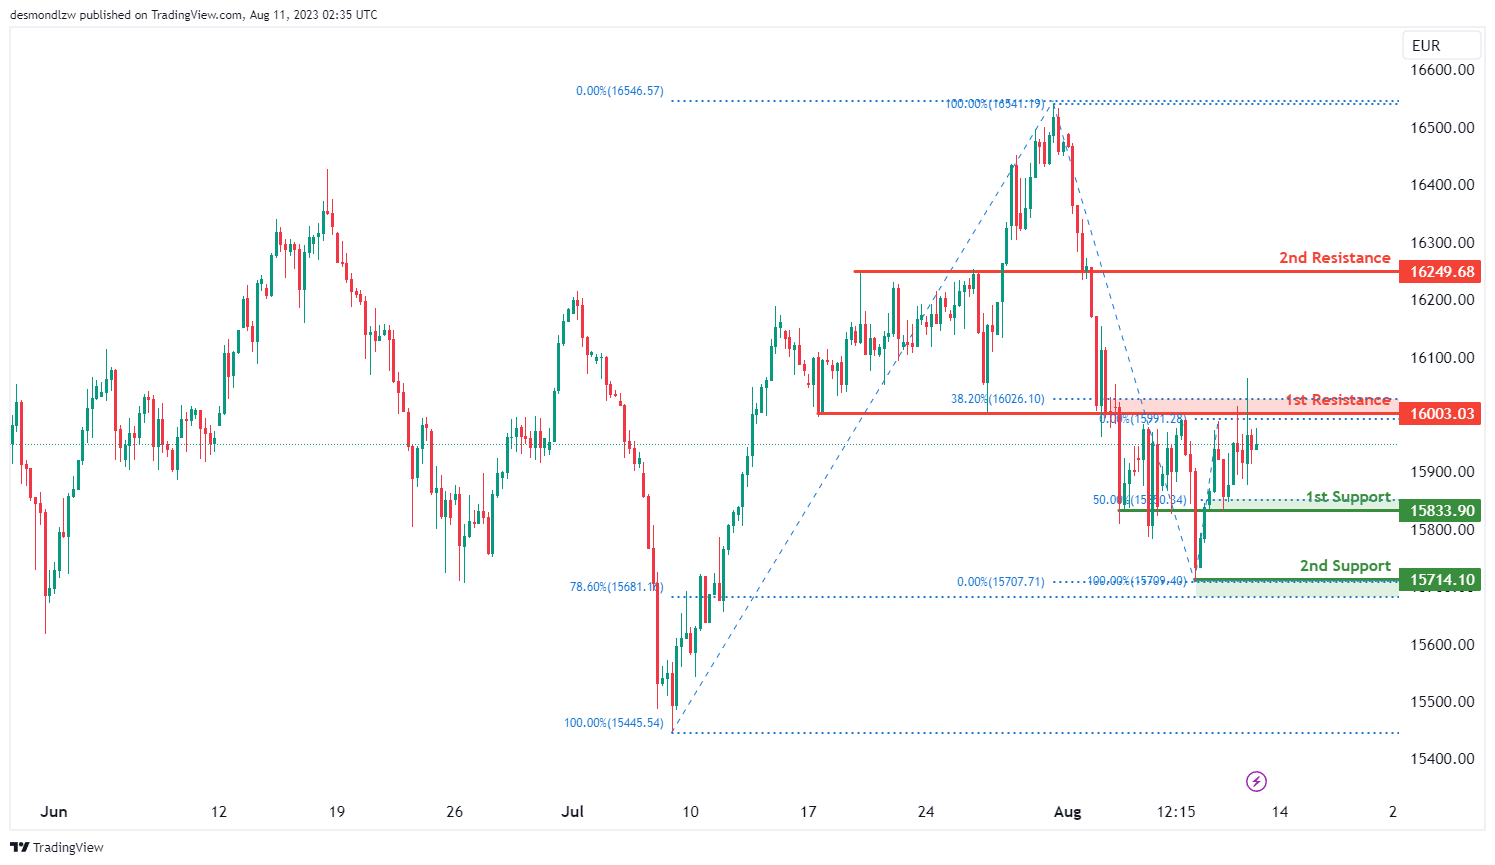
GER30:
The GER30 chart currently displays a bullish momentum, suggesting an ongoing upward trend.
In line with this bullish sentiment, there is potential for the price to continue its bullish movement towards the resistance level.
The support level at 15833.90 holds significance as it is marked by both an overlap support and a 50% Fibonacci retracement level. Further reinforcing the support structure, a 2ndary support is identified at 15714.10, characterized by its alignment with a 78.60% Fibonacci retracement level.
On the other hand, the resistance level at 16003.03 gains importance as it is associated with a pullback resistance and a 38.20% Fibonacci retracement level. Additionally, a 2nd resistance level at 16240.68 is notable for its overlap resistance, further contributing to its potential impact on price movements.
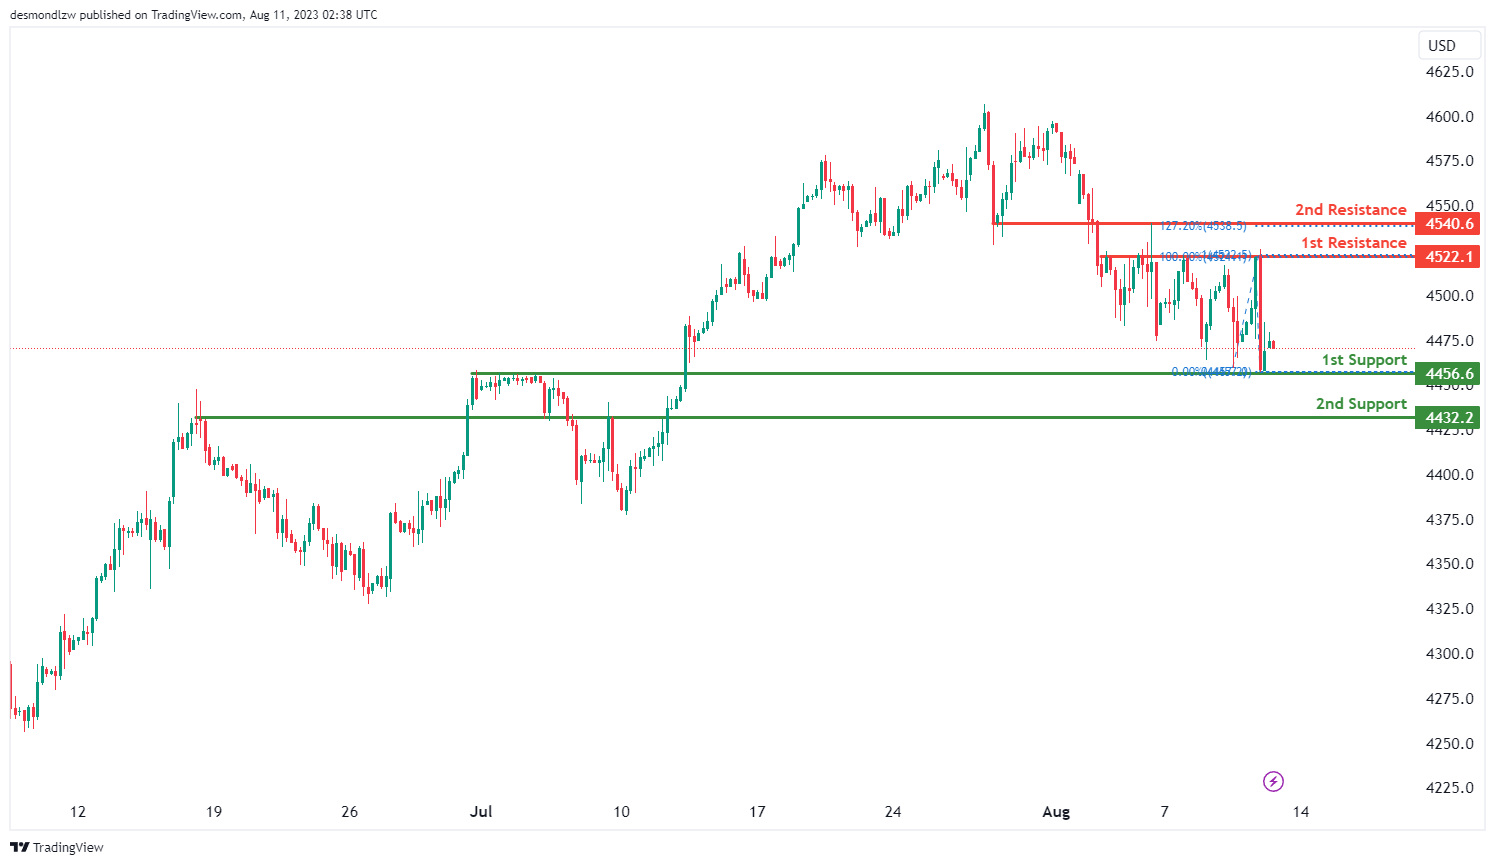
US500
The US500 chart currently exhibits a bullish momentum, indicating an ongoing upward trend. Given this bullish sentiment, there is potential for the price to continue its bullish movement towards the resistance level.
The support level at 4456.6 is highlighted as a pullback support. Additionally, there is a 2ndary support at 4432.2, identified as an overlap support.
On the other hand, the resistance level at 4522.1 holds significance as a multi-swing high resistance, reinforced by a 100% Fibonacci Projection.
Furthermore, a 2nd resistance level at 4540.6 is identified as a pullback resistance, which adds to its potential impact on potential price movement.
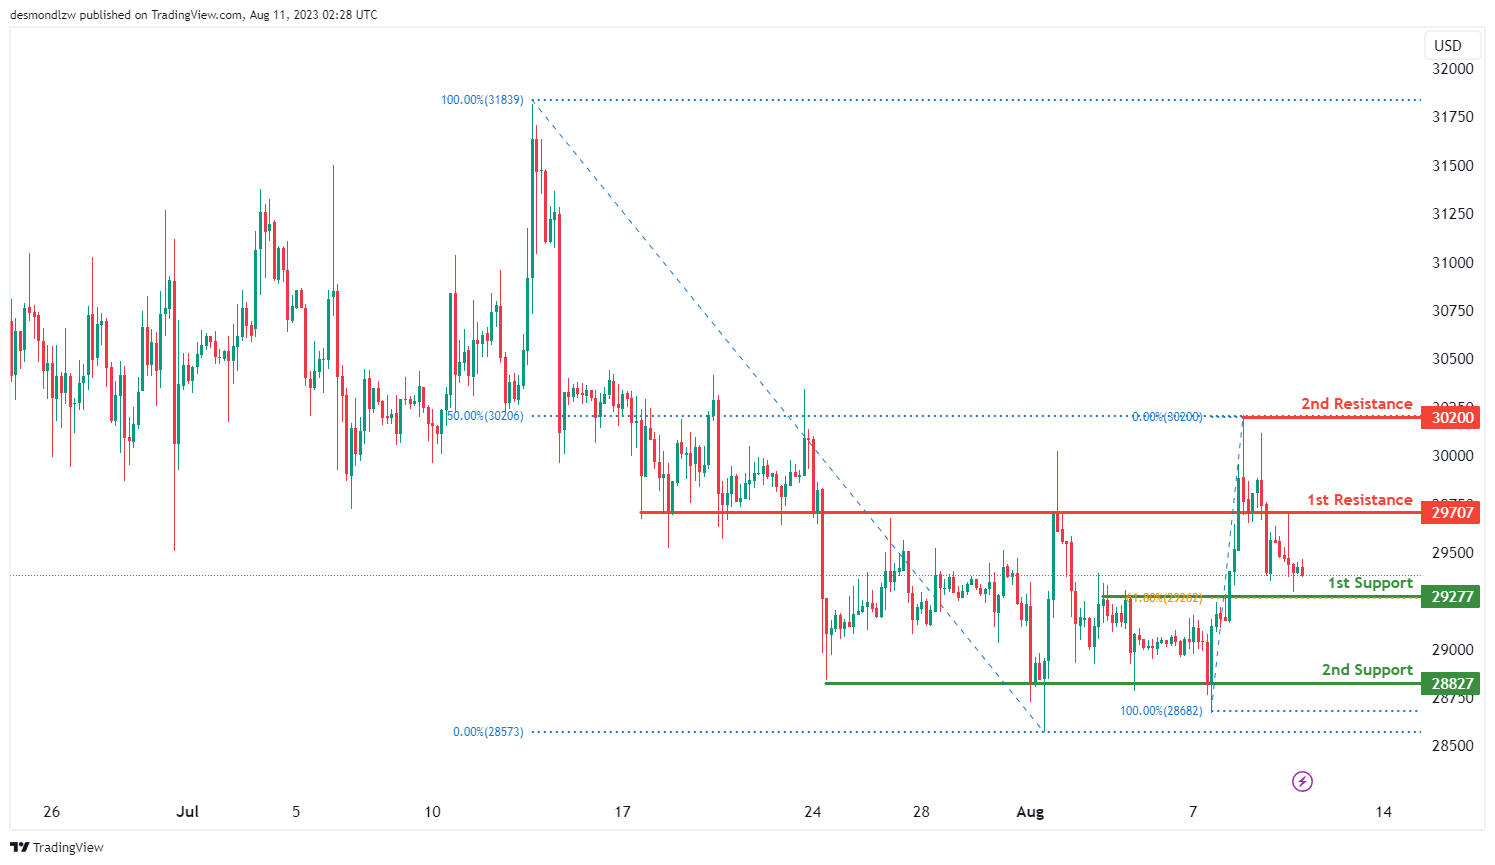
BTC/USD:
The BTC/USD chart shows a bearish overall momentum. There is a potential for a bearish continuation towards the 1st support level.
The 1st support is positioned at 29277 and is considered advantageous due to its pullback support and a 61.80% Fibonacci retracement. Furthermore, the 2nd support at 28827 is also seen as a valuable level because of its multi-swing low support characteristics.
On the resistance side, the 1st resistance level at 29707 is considered noteworthy as it represents an overlap resistance. Additionally, the 2nd resistance at 30200 is significant due to its swing high resistance and a 50% Fibonacci retracement.
ETH/USD:
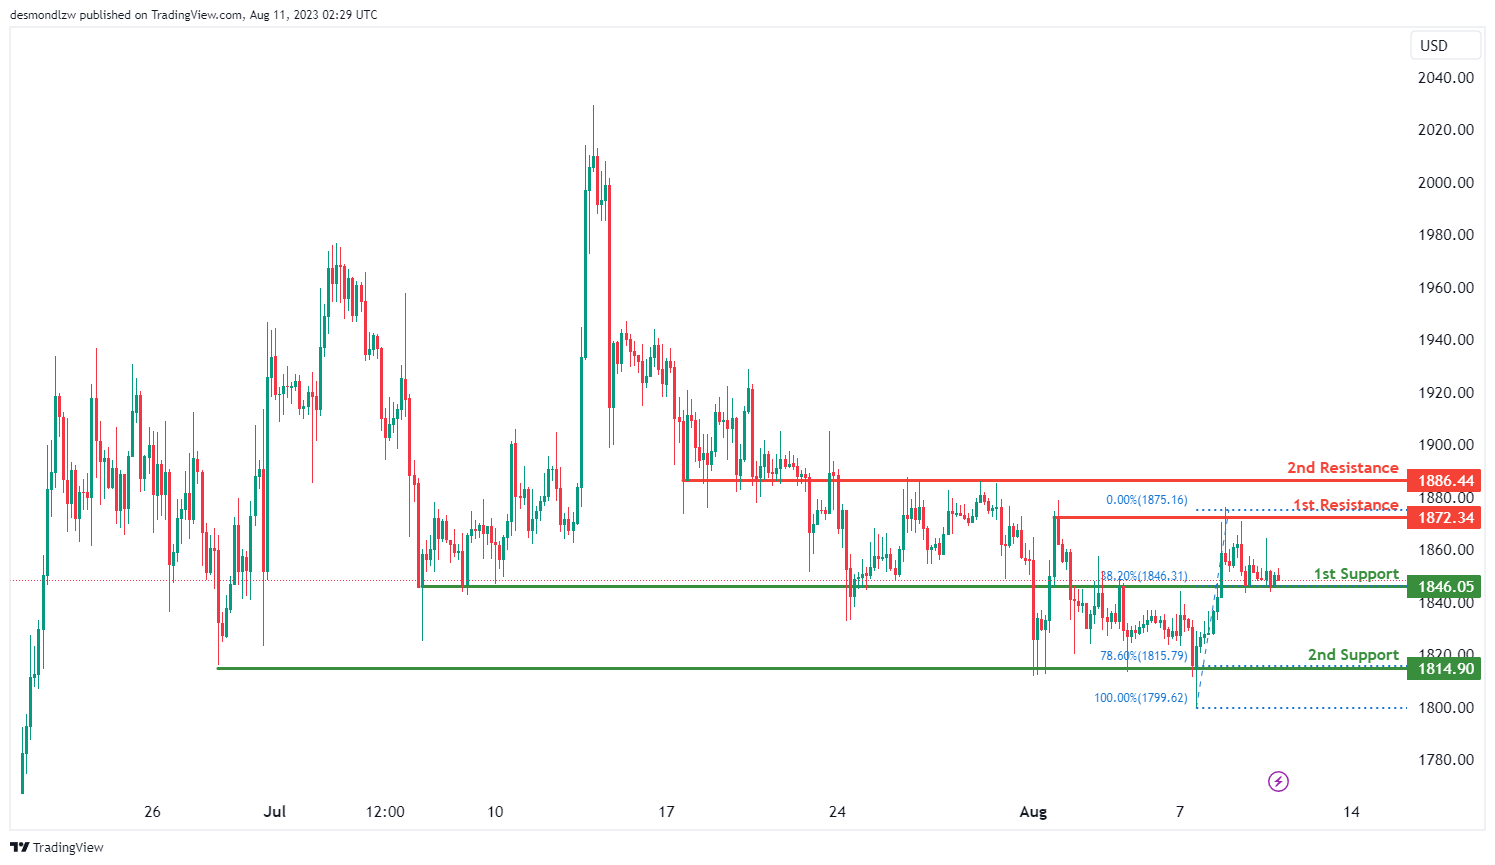
The ETH/USD chart indicates a bearish overall momentum. There is a potential for a bearish continuation towards the 1st support level.
The 1st support is located at 1816.05 and is considered favorable due to its overlap support and a 38.20% Fibonacci retracement. Additionally, the 2nd support at 1814.90 is also seen as a valuable level because of its multi-swing low support and a 78.60% Fibonacci retracement.
On the resistance side, the 1st resistance level at 1872.34 is noteworthy as it represents a multi-swing high resistance. Furthermore, the 2nd resistance at 1886.44 is considered significant due to its overlap resistance characteristics.
WTI/USD:
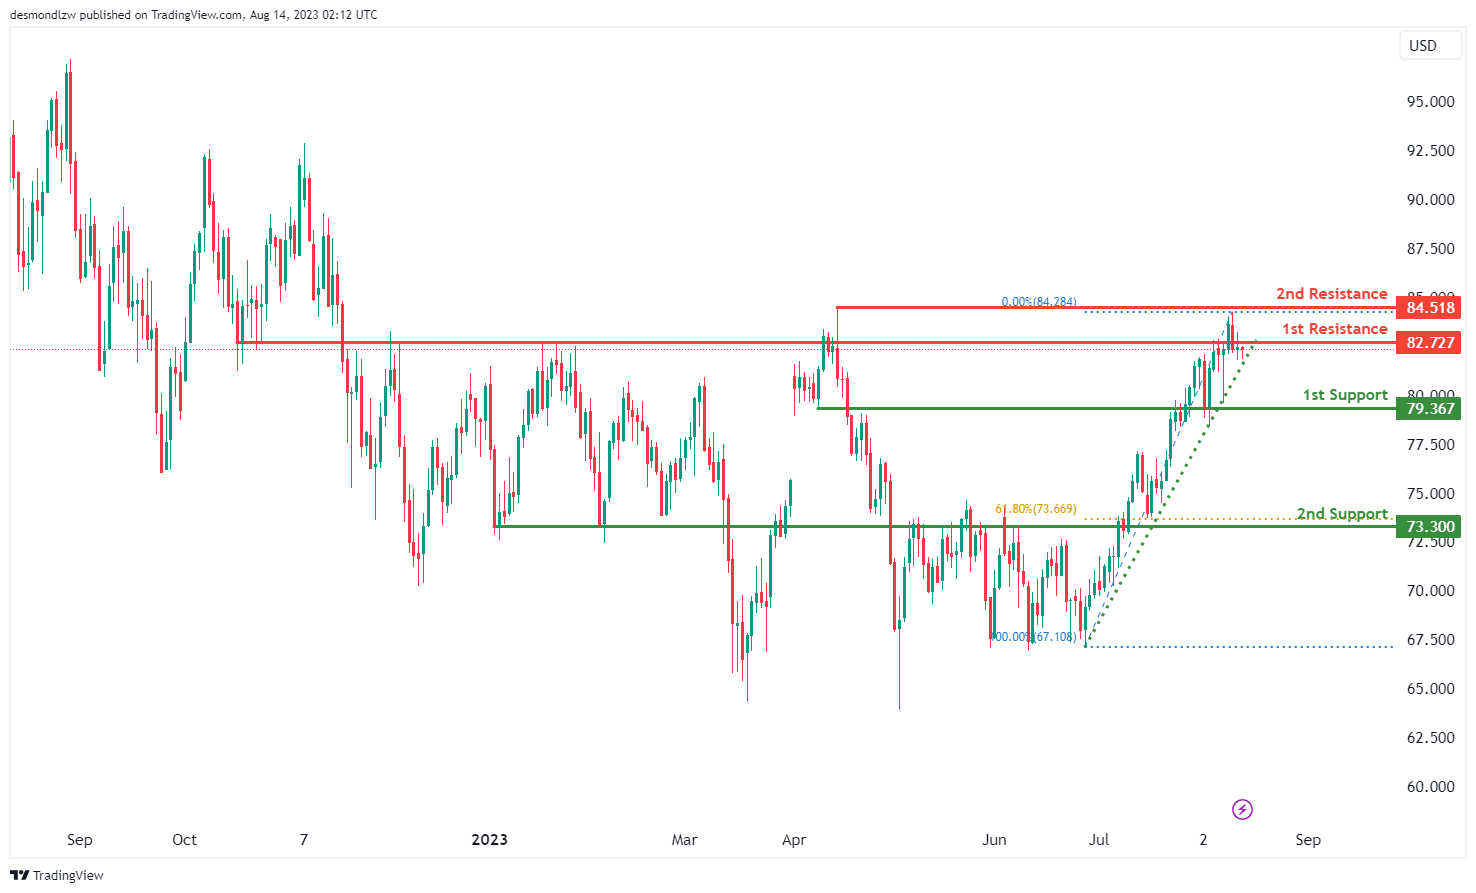
The current trend in the WTI/USD chart illustrates a weak bearish momentum, indicating a potential downward movement in the market. With this weak bearish sentiment, there is potential for the price to react off the 1st resistance and continue its downward momentum towards the 1st support level should the ascending trendline be broken.
The 1st support level at 79.37 is significant due to its alignment with a pullback support. Additionally, the 2nd support level at 73.30 is identified as an overlap support that aligns with the 61.80% Fibonacci retracement level.
To the upside, the 1st resistance level at 82.73 represents an overlap resistance. Furthermore, the presence of a 2nd resistance level at 84.52 represents a multi-swing high resistance.
XAU/USD (GOLD):
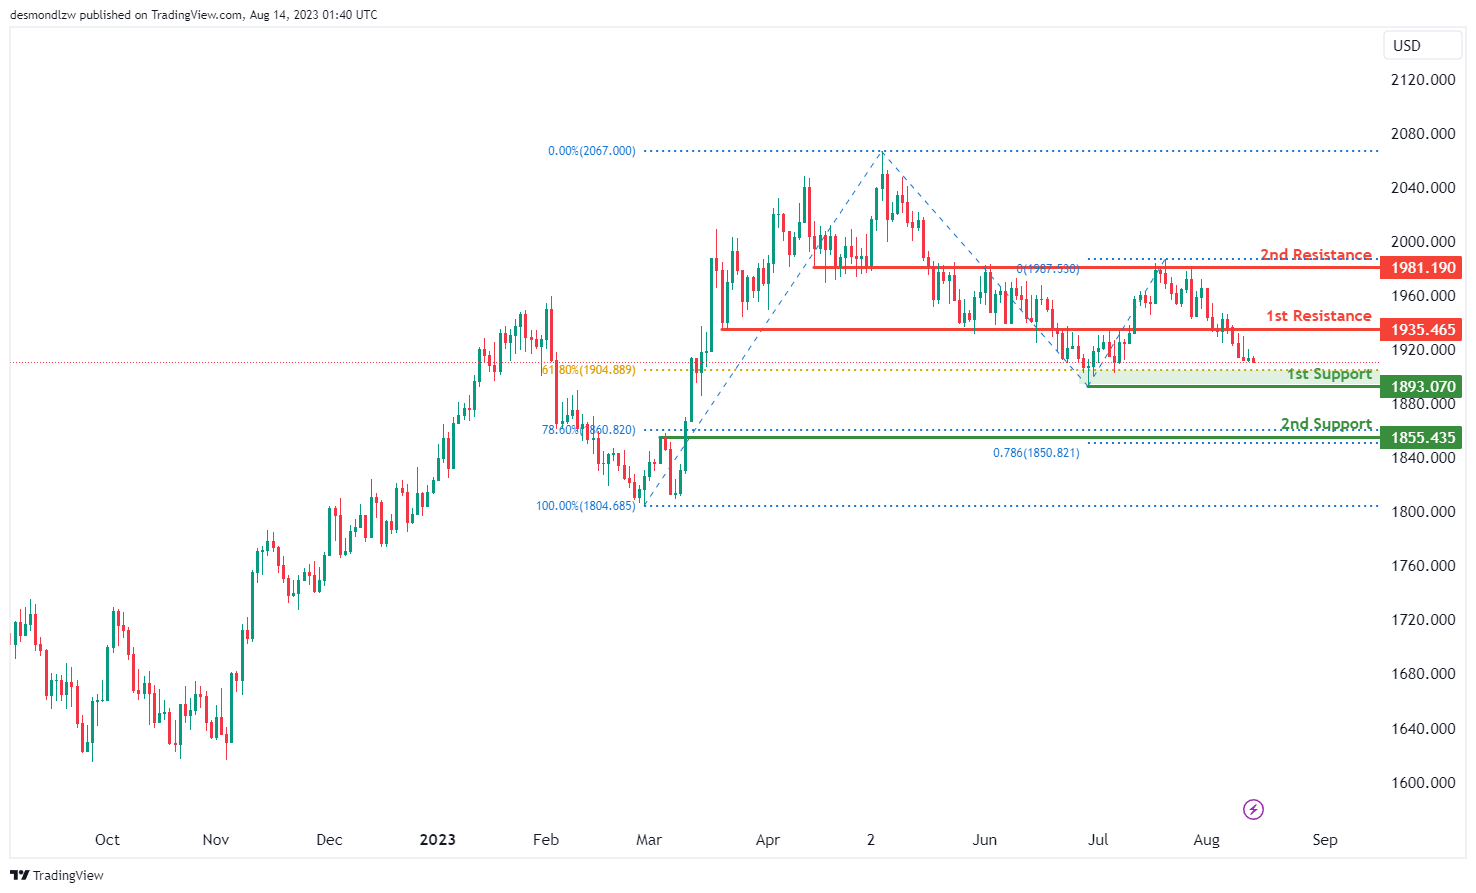
The XAU/USD chart currently displays a bullish momentum, indicating a prevailing upward trend. This momentum suggests the possibility of a bullish bounce off the 1st support level, leading to a potential movement towards the 1st resistance.
The significance of the 1st support at 1893.07 is reinforced by its alignment with a 61.80% Fibonacci Retracement, reflecting a strong support level. Additionally, a 2nd support at 1855.43 further strengthens the potential for a bounce, as it coincides with both a 78.60% Fibonacci Retracement and a 78.60% Fibonacci Projection, demonstrating a notable Fibonacci confluence.
In contrast, the 1st resistance level at 1935.46 gains importance as a pullback resistance.
Moreover, another resistance level at 1981.19 is identified as an overlap resistance, enhancing its potential to influence future price movement.
EUR/USD Drops Again and Could Revisit 1.0850
Key Highlights
- EUR/USD is moving lower below the 1.1000 support.
- It broke a rising channel with support near 1.0950 on the 4-hour chart.
- GBP/USD could extend losses toward 1.2550.
- Gold prices are moving lower below the $1,920 level.
EUR/USD Technical Analysis
The Euro started a fresh decline from well above 1.1120 against the US Dollar. EUR/USD traded below the 1.1050 support to move into a bearish zone.
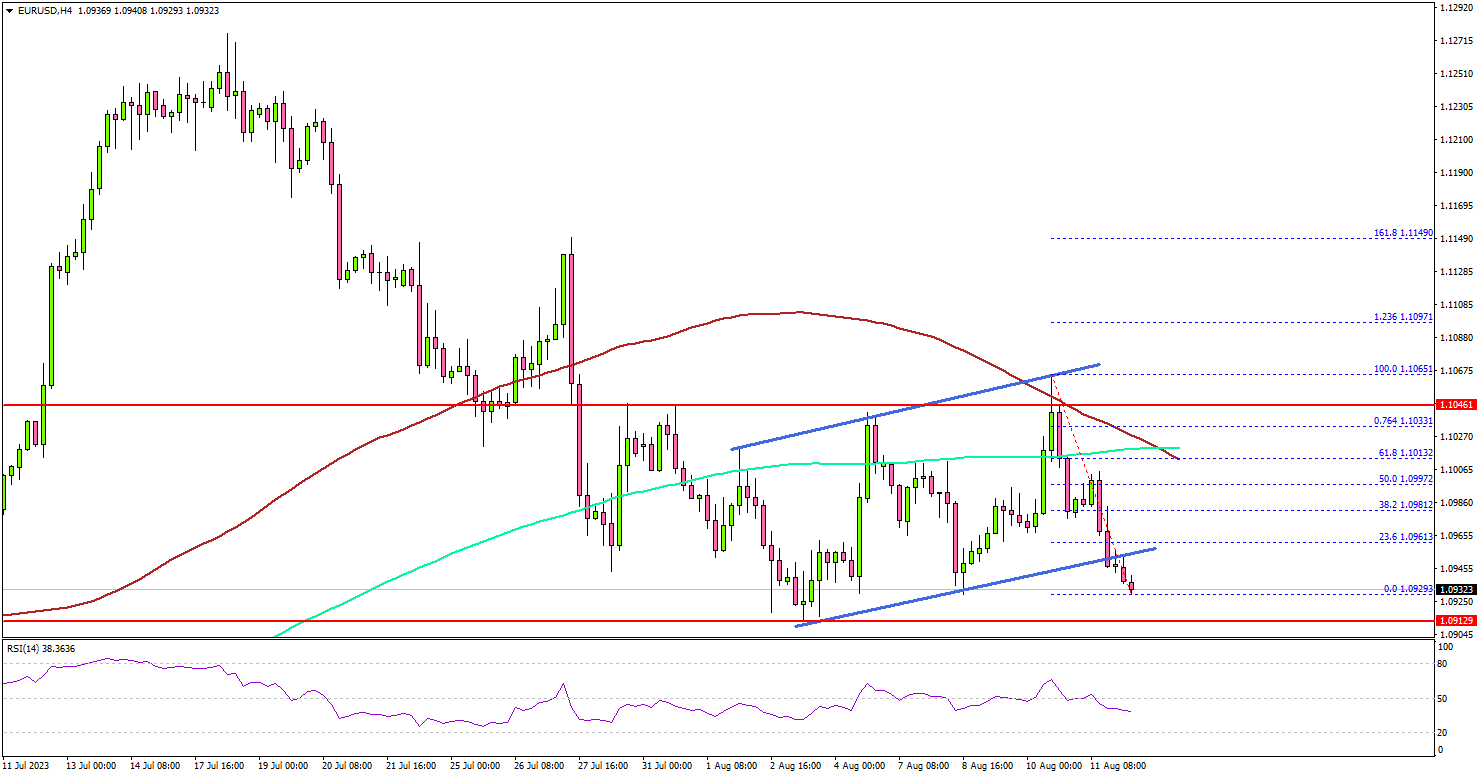
Looking at the 4-hour chart, the pair settled below the 1.1000 level, the 100 simple moving average (red, 4 hours), and the 200 simple moving average (green, 4 hours).
The pair also traded below a rising channel with support near 1.0950 on the same chart. The pair is now trading near 1.0930 with a bearish angle. Initial support is near the 1.0920 level. The next major support is near 1.0900, below which EUR/USD could gain bearish momentum.
In the stated case, the pair could test the 1.0850 support. On the upside, the pair could face resistance near the 1.0960 level. The next major resistance is near the 1.1000 level.
A close above the 1.0000 resistance could push the pair toward 1.1050. Any more gains could start a fresh increase toward the 1.1120 level.
Looking at GBP/USD, the pair is also moving lower and there is a risk of a drop toward the 1.2550 level in the near term.
Economic Releases
- German Wholesale Price Index for July 2023 (MoM) – Forecast -1.4%, versus -0.2% previous.
NZD/USD under siege on domestic data and Asian market risks
NZD/USD is having a notable decline today, pressured by dismal services data from New Zealand and an escalating sense of risk aversion throughout Asian markets. This downtrend also sets a tense backdrop leading up to this week's RBNZ rate decision, with the central bank widely anticipated to hold for the second consecutive month.
Last week's break of 0.5984 support should confirm resumption of whole decline from 0.6537. Near term outlook in NZD/USD will stay bearish as long as 0.6117 resistance holds. Next target is 100% projection of 0.6537 to 0.5894 from 0.6410 at 0.5857.
For now, the structure of the decline from 0.6537 is still favoring that it's a correction to rebound from 0.5511. Hence, strong support should emerge below 0.5857 to bring reversal. However, any downside acceleration below 0.5857 would raise the chance that it's indeed resuming the larger down trend through 0.5511.
NZ BNZ services plunges down to 47.8, deepening contraction as activity dives
New Zealand's service sector, as gauged by the BusinessNZ Performance of Services Index, experienced a marked decline in July, descending from 49.6 to a worrying 47.8. This latest reading is not only the lowest since January 2022 but also trails the long-term average of 53.5 significantly.
A detailed analysis of the index highlights concerning trends. The activity component has sharply dropped from 50.9 to 39.6, marking its worst performance since August 2021 and setting a gloomy record. Specifically, this month's reading stands as the worst non-lockdown related reading on record since 2007. New orders within businesses have taken a substantial hit, plummeting from 50.4 to 43.8.
Meanwhile, employment showed a marginal decrease, moving from 49.1 to 49.0. On a brighter note, stocks or inventories observed an increase, jumping from 47.2 to 54.0, with supplier deliveries also ticking up from 51.0 to 52.1.
BusinessNZ's Chief Executive, Kirk Hope, said. "The further fall into contraction during July also saw another lift in the proportion of negative comments," he remarked, drawing attention to the sharp increase in negative feedback, which escalated to 67% from 55.6% in June and 49.4% in May.
Hope continued, "Overall, negative comments received were strongly dominated by a general downturn in the economic conditions/slowing economy, as well as ongoing increased costs."
BNZ Senior Economist, Doug Steel, weighed in on the data, highlighting a distressing pattern. "The results all point to a sharp drop in demand in July, significantly accelerating the slowing trend that had been evident for many months," he said.
DJIA Technical: At the Risk of Shaping a Minor Downtrend
- Key technical elements are showing signs of bullish exhaustion below the 35,650 resistance.
- Potential downside mean reversion to test the 50-day moving average now acting as a support at 34,510.
In the past two weeks, the Dow Jones Industrial Average (DJIA) has been the outperformer among the major US benchmark stock indices, thanks to its lesser concentration of technology stocks that bore the brunt of the sell-off inflicted on the US stock market.
For the week of 31 July and 7 August, the DJIA recorded a weekly return of -1.11% and +0.62% respectively, in contrast, two consecutive weekly losses were seen in the S&P 500 (-2.27%, -0.31%), Nasdaq 100 (-3.02%, -1.62%), Russell 2000 (-1.21%, -1.65%) over the same period.
In the lens of technical analysis, the DJIA may start to evolve into a potential minor downtrend at this juncture as several key elements have started to exhibit bullish exhaustion.
Medium-term upside momentum has started to wane
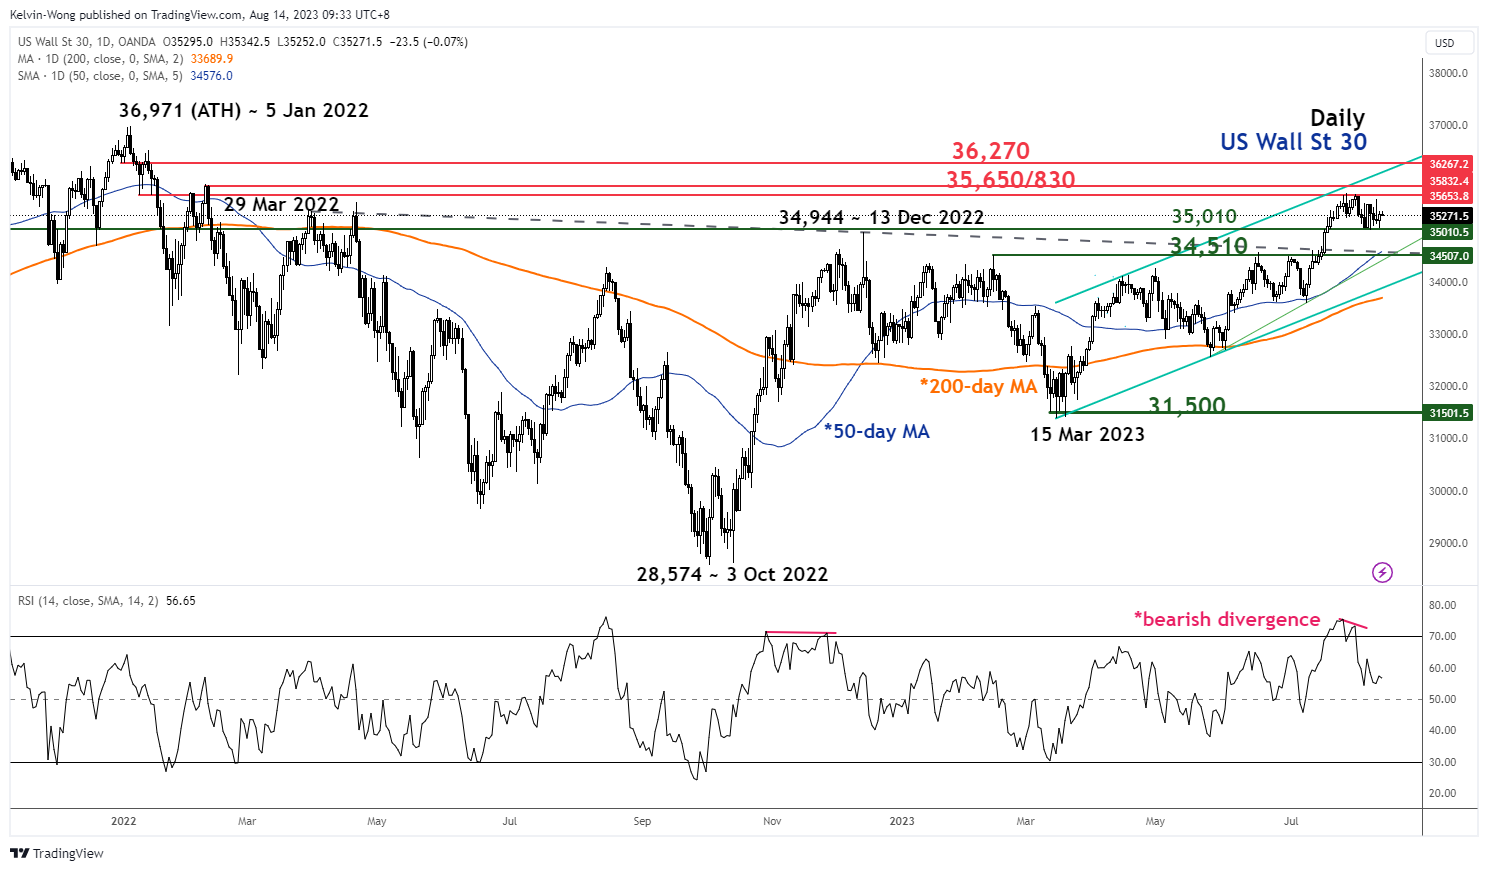
Fig 1: US Wall St 30 medium-term trend as of 14 Aug 2023 (Source: TradingView, click to enlarge chart)
In the past three weeks, the price actions of the US Wall St 30 Index (proxy of the Dow Jones Industrial Average futures) have failed to have a clear bullish breakout above the key swing high areas of 29 March/18 April 2023. These key swing-high areas have key psychological importance as they preceded the prior medium-term impulsive down move that recorded a loss of -19.20% on the Index to print an intraday low of 28,574 on 3 October 2022.
In conjunction, the daily RSI oscillator flashed a bearish divergence condition at its overbought region (above 70) on 1 August 2023, and a similar prior bearish divergence condition was seen on 25 November 2022 that led to a price decline of -10% on the Index from its 13 December 2022 high of 34,944 to 15 March 2023 low of 31,385.
Potential downside mean reversion to test 50-day moving average
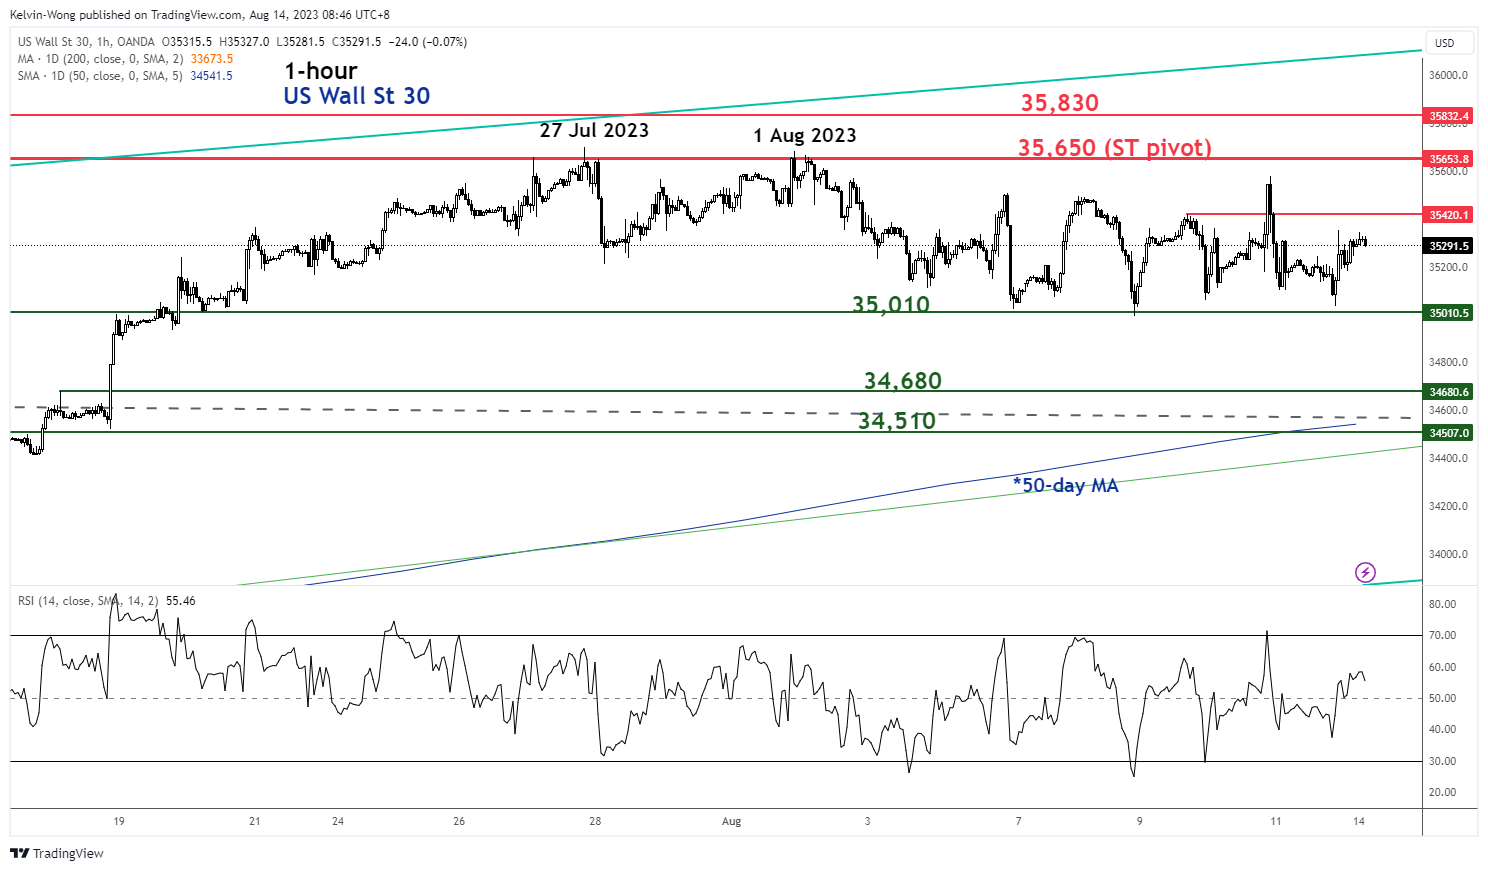
Fig 2: US Wall St 30 minor short-term trend as of 14 Aug 2023 (Source: TradingView, click to enlarge chart)
Watch the 35,650 key short-term pivotal resistance (also the recent swing highs of 27 July/1 August 2023) and a break below the near-term minor range support of 35,010 exposes the next supports at 34,680, and 34,510 (50-day moving average, trendline support from 25 May 2023 low & former range resistance from 29 March 2022 high).
However, a break above 35,650 invalidates the bearish tone to see the next 35,830 immediate resistance in the first step. A clearance above 35,830 sees the next resistance at 36,270.
CHFJPY Made The Rally After 3 Waves Pull Back
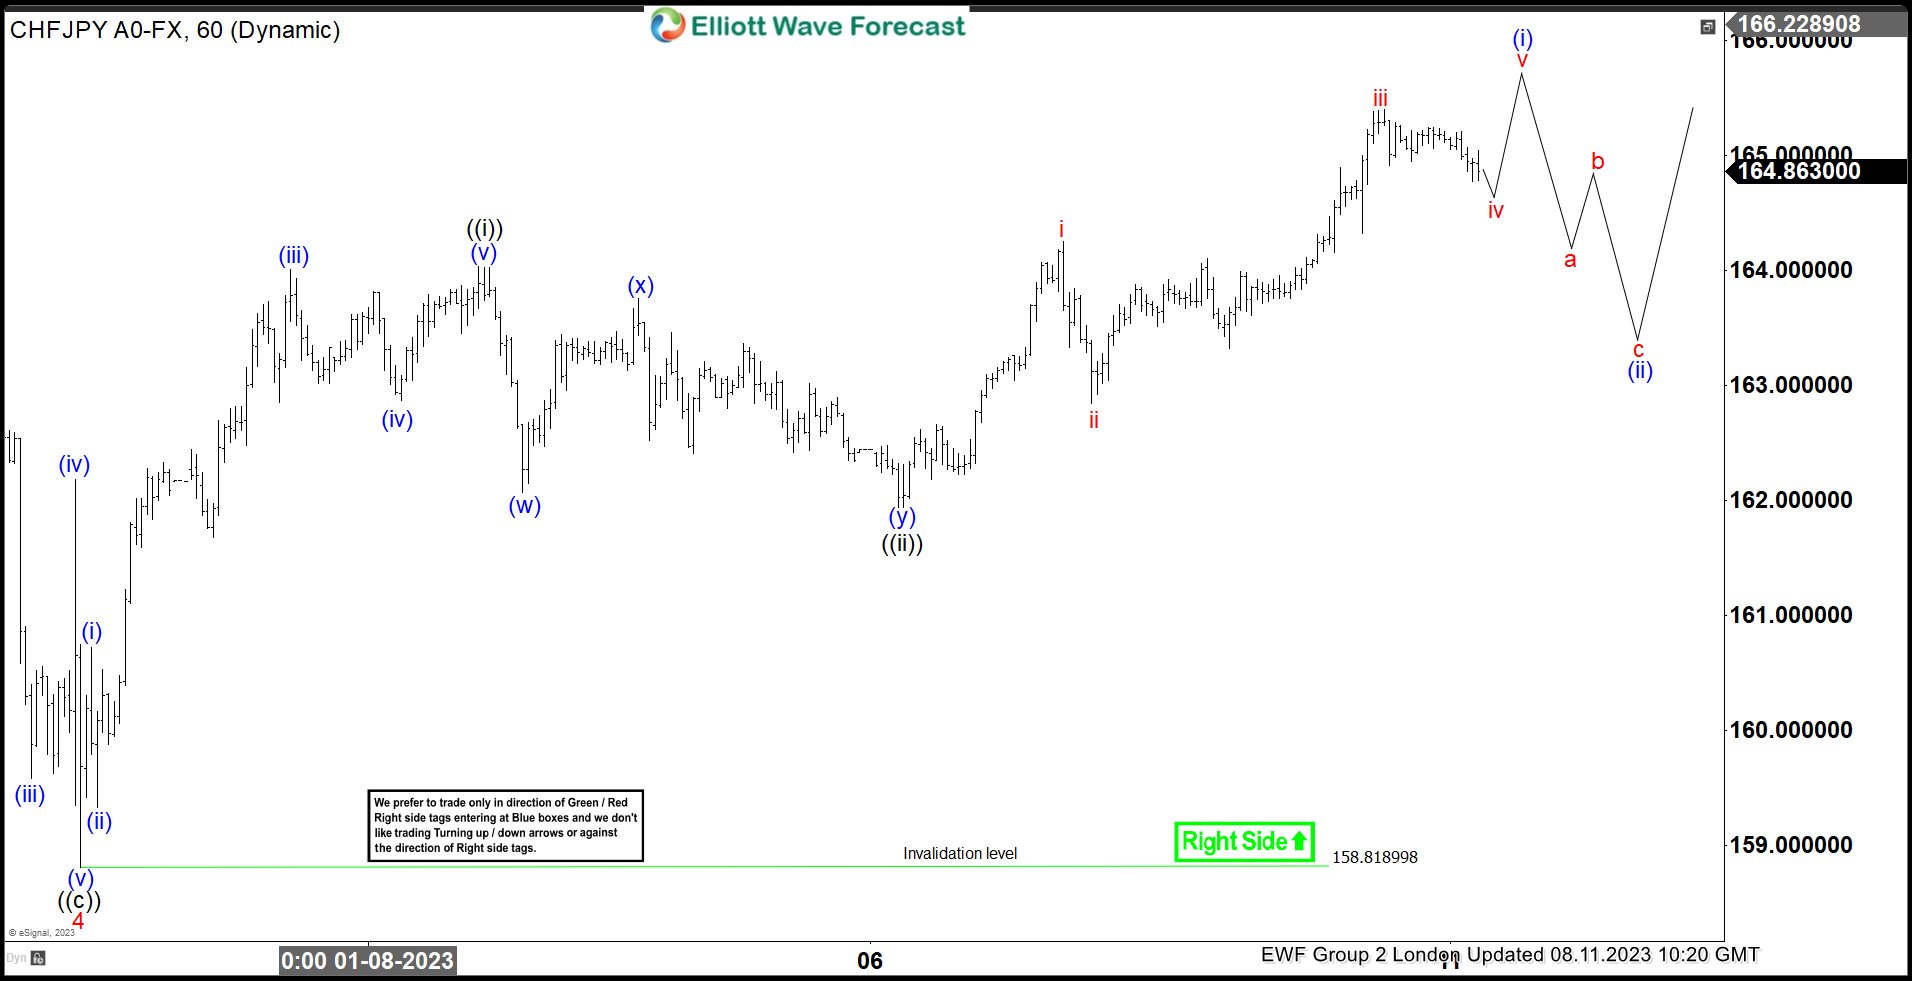
Hello fellow traders. In this technical article we’re going to take a look at the Elliott Wave charts charts of CHFJPY forex pair published in members area of the website. As our members know CHFJPY is showing impulsive bullish sequences in the cycle from the January 2023 low. The pair has recently made pull back against the 158.8 pivot. The pair made clear 3 waves correction and gave us rally toward new highs as expected. In further text we’re going to explain the Elliott Wave pattern and trading setup.
CHFJPY Elliott Wave 1 Hour Chart 08.06.2023
The pair has made 5 waves up in the rally from the 158.8 low which is labeled as wave ((i)) black. Current view suggests the pair can be still doing wave ((ii)). Pull back looks incomplete at the moment. So, we assume (c) blue leg is still in progress. The pair should ideally make another leg down toward 161.8-160.6 area – buyers zone. As our members know Blue boxes are based on 100% – 161.8% Fibonacci extension area , that we trade in 3, 7, or 11 swing corrective sequence. Once bounce reaches 50 Fibs against the(b)blue high , we will make long position risk free ( put SL at BE) and take partial profits. Invalidation for the long trades is break of 1.618 fib ext : 160.59
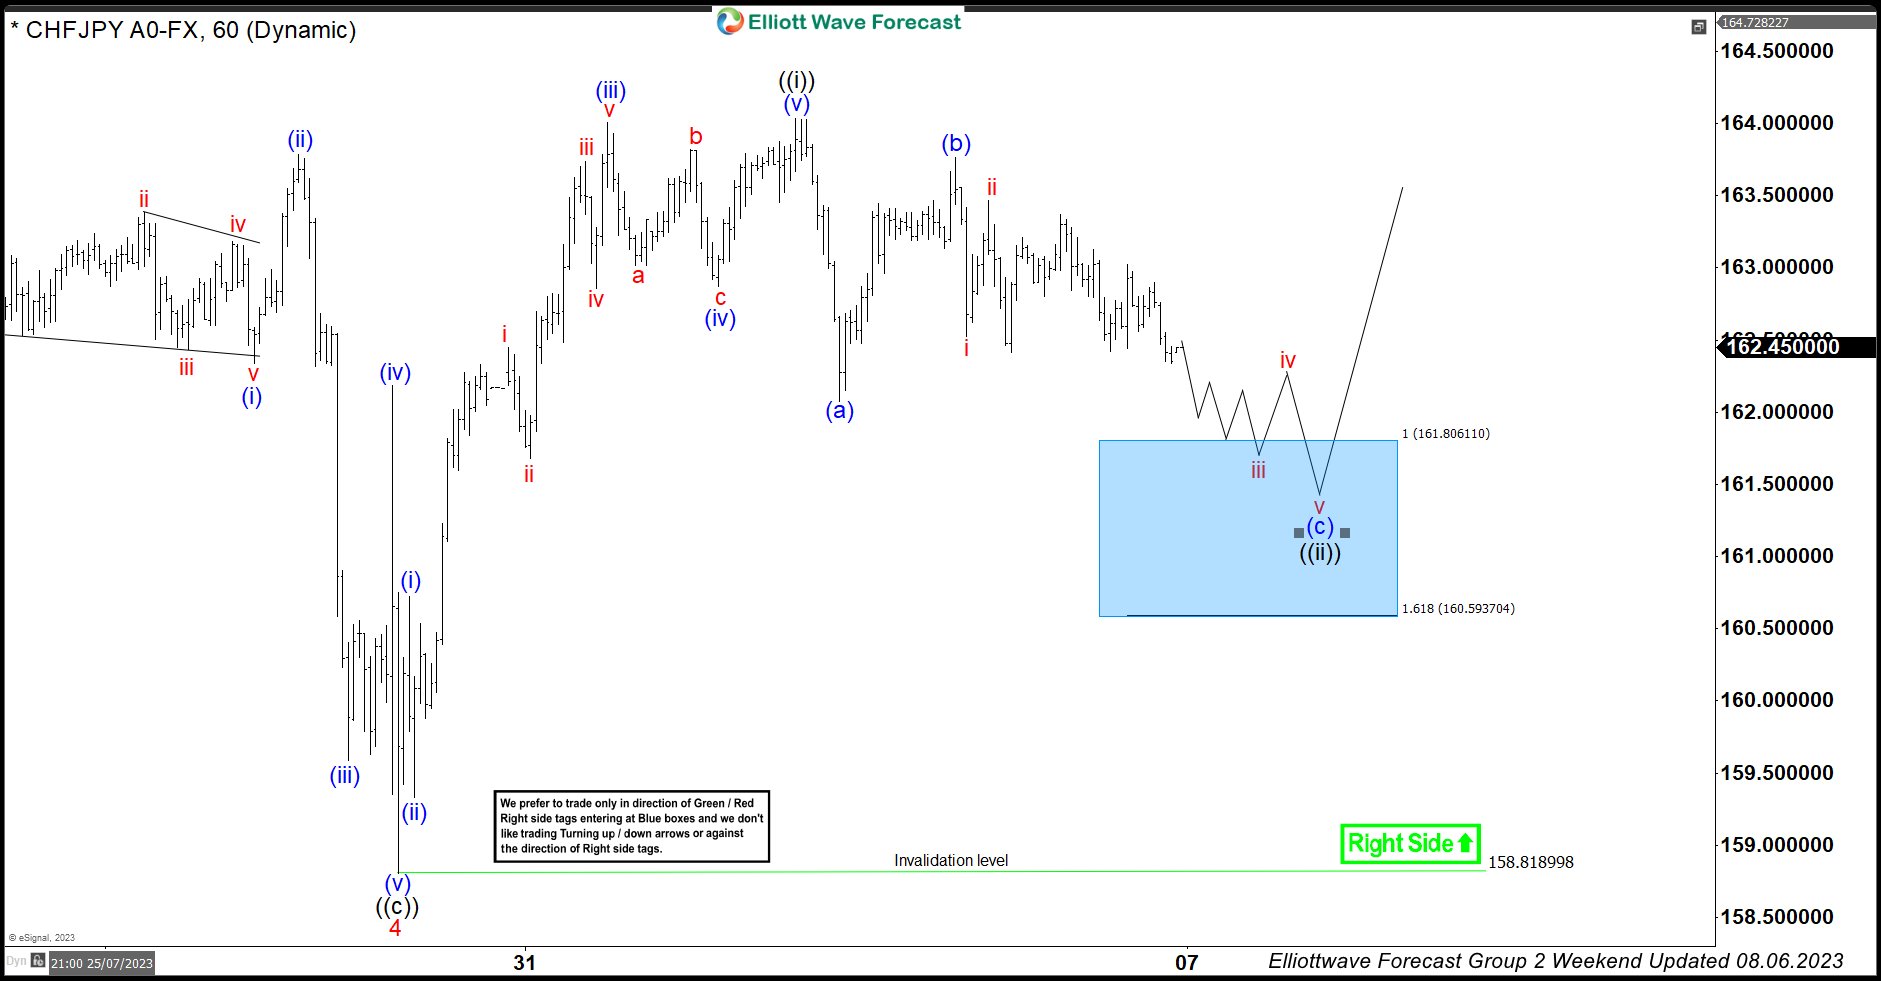
CHFJPY Elliott Wave 1 Hour Chart 08.06.2023
CHFJPY made another leg down as we expected. However pull back missed to reach equal legs area by a few points. Correction completed slightly above equal legs area ( 161.81) at 161.9 low. The pair left us without the trade this time. Eventually we got break toward new highs as expected. We don’t recommend selling it and favor the long side still. We expect the intraday pull backs to keep finding buyers in 3,7,11 swings.