Sample Category Title
Forex and Cryptocurrencies Forecast
EUR/USD: Inflation, GDP, and Prospects for Monetary Policy
Looking at the two-week flat trend on the EUR/USD chart, one is reminded that it's August, a vacation season. Even the US inflation data released on Thursday, August 10th, couldn't disrupt the relaxed demeanour of traders. And yet, they warrant close attention. The year-on-year Consumer Price Index (CPI) growth of 3.2% and core inflation at 4.7% came in below forecasts (3.3% and 4.8% respectively). The monthly CPI remained unchanged at 0.2%, marking the lowest figure in over two years. As for the GDP, previously released data confirmed a diminished risk of the national economy slipping into a recession. After a 2.0% year-on-year rise in the first quarter of 2023, the second quarter recorded a 2.4% growth, significantly surpassing market expectations of 1.8%.
Therefore, the US boasts a robust economy with a gradually cooling labour market and inflation steadily approaching the 2.0% target level. All of this suggests that the Federal Reserve's monetary policy has been bearing positive fruits. The regulator can now, at the very least, pause the tightening process. They might even conclude the current monetary restriction cycle. The likelihood of the dollar interest rate remaining at the current 5.50% level in September is estimated at 89%, whereas the odds of it increasing by 25 basis points (b.p.) by year's end stand at just 27%.
In such a situation, the dollar should have begun to relinquish its positions, but this did not occur. Of course, immediately after the inflation data release, EUR/USD spiked by approximately 50 points but soon reverted. Why did this happen? While the vacation season theory could be considered, there are two considerably more crucial reasons. The first is the disappointing results of the latest auction for the 30-year US Treasury bonds, which concluded with a yield of 4.199%, lower than rates in the secondary market. The second reason lies in the weakness of the dollar's European counterpart.
The best insight into how the Eurozone's economy is faring is provided by the "Economic Bulletin" published by the European Central Bank (ECB) on that same Thursday, August 10. Here are its key points:
"Inflation continues to decline, but it is expected to remain too high for an extended period." "The immediate economic outlook for the Eurozone has worsened, mainly due to weakening domestic demand. High inflation and tighter financing conditions are suppressing spending growth." "A modest production growth in the Eurozone is anticipated in the third quarter, largely driven by the services sector." "Upside risks for inflation include potential resurgence in energy and food prices, as well as risks associated with Russia's unilateral withdrawal from the Black Sea Grain Initiative." "The prospects for economic growth and inflation remain highly uncertain." According to a recent Reuters poll, such a bulletin from the ECB has left market participants guessing about their next moves.
Next week, Eurostat will present a report with revised GDP data for the Eurozone for Q2 2023, as well as figures for industrial production and inflation for July. The preliminary GDP estimate showed a growth of +0.3% (+0.6% year-on-year) after stagnant growth in Q4 2022 and a decline of -0.1% in Q1 2023. While inflation is on the decline (currently at 5.5%, compared to 10.6% in October 2022), it still exceeds the target level of 2.0%. If the ECB continues to maintain a strict monetary policy and energy prices rise, many economists believe this could lead to a 5.0% drop in the Eurozone's GDP in 2024.
The comparison of the provided data suggests that the US currency currently has a greater chance of prevailing. The dollar's role as a safe-haven asset also plays in its favour. Naturally, a lot hinges on the actions of the Fed and the ECB this fall. As for the past week, after the release of the US production inflation data (PPI), the dollar further strengthened its position, and the EUR/USD pair concluded the week at 1.0947.
At the time of writing this review, on the evening of August 11, 35% of analysts have voiced in favour of the pair's rise in the near term, 50% sided with the dollar and took the opposite stance, and the remaining 15% voted for the continuation of the sideways trend. Among the oscillators on D1, the majority, 80%, favor the US currency (with 15% in the oversold zone), 10% point northward, and 10% are in the neutral zone. Among the trend indicators, 65% recommend selling, and the remaining 35% suggest buying. The nearest support for the pair is located around 1.0895-1.0925, followed by 1.0845-1.0865, 1.0780-1.0805, 1.0740, 1.0665-1.0680, and 1.0620-1.0635. Bulls will encounter resistance around 1.0985, then at 1.1045, 1.1090-1.1110, 1.1150-1.1170, 1.1230, 1.1275-1.1290, 1.1355, 1.1475, and 1.1715.
For the upcoming week, notable events include the release of U.S. retail sales data on Tuesday, August 15. On Wednesday, August 16, the Eurozone's GDP figures will be revealed, and the minutes from the latest FOMC (Federal Open Market Committee) meeting will also be published. Data on U.S. unemployment and manufacturing activity will be presented on Thursday. To cap off the week, on Friday, August 18, we'll get insights into the inflation (CPI) situation in the Eurozone.
GBP/USD: Day X – August 16
According to data released on Friday, August 11, by the UK's Office for National Statistics (ONS), the country's economic growth for the second quarter was 0.2%, compared to a 0.1% increase in the first quarter (with a forecast of 0.0%). Year-on-year, while forecasts were at 0.2%, the actual GDP growth was 0.4% (with the previous figure being 0.2%). The total volume of industrial production in June also rose, registering a +1.8% compared to a forecast of +0.1% and a -0.6% decline in May. Overall, the upward momentum is evident. This reduces the risks of recession and heightens the likelihood that the Bank of England (BoE) will maintain its hawkish stance at least until the end of 2023. Especially given that the country's inflation remains relatively high, with the year-on-year CPI at 7.9%. To combat this, according to predictions, the BoE might increase the key interest rate in 2-3 steps from the current 5.25% to 6.00% this year, giving the British currency a distinct edge.
Strategists at the Netherlands' largest banking group, ING, believe that the positive GDP figures won't be the defining factor for the Bank of England. "The June GDP growth numbers for the UK surpassed expectations," they agree. "However, we believe that the implications for the Bank of England are likely to be quite limited, as the numbers aren't significantly different from its forecasts. The primary focus will be on next week's service sector inflation and wage growth figures, [...] which are crucial for the pound."
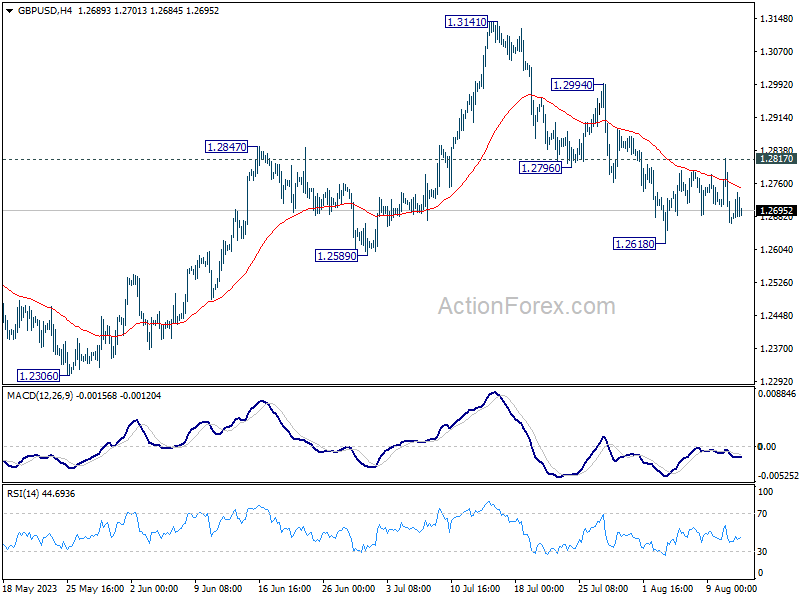
GBP/USD closed at the 1.2695 mark on Friday, August 11. The near-term forecast from experts is as follows: 60% are bearish on the pair, 20% are bullish, and the same percentage chose to remain neutral. On the D1 oscillators, bears have a unanimous 100% backing, with 15% of these indicating an oversold condition. Trend indicators display a 65% to 35% split in favour of the bears (red). Should the pair trend downwards, it will encounter support levels and zones at 1.2675, 1.2620-1.2635, 1.2575-1.2600, 1.2435-1.2450, 1.2300-1.2330, 1.2190-1.2210, 1.2085, 1.1960, and 1.1800. In the event of an upward movement, resistance can be expected at 1.2760, followed by 1.2800-1.2815, 1.2880, 1.2940, 1.2980-1.3000, 1.3050-1.3060, 1.3125-1.3140, 1.3185-1.3210, 1.3300-1.3335, 1.3425, and 1.3605.
As for the UK macroeconomic statistics, a flurry of data from the national labour market awaits us on Tuesday, August 15, including indicators such as wage growth and unemployment rates. The next day, on Wednesday, August 16, key inflation (CPI) figures for the United Kingdom will be released. Lastly, on Friday, August 18, we'll receive statistics on retail sales in the country.
USD/JPY: The Pair Returns to its Moonshot
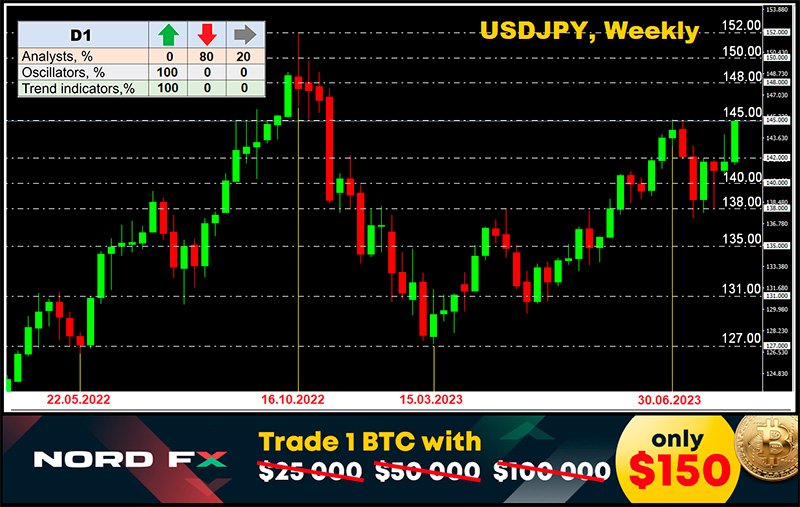
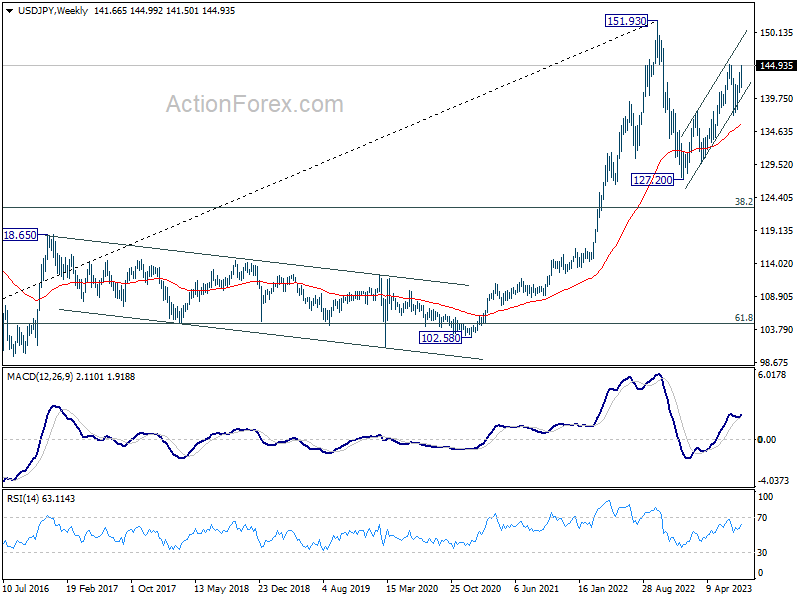
While EUR/USD and GBP/USD spent the week trading sideways, USD/JPY once again soared into the stratosphere. On Friday, it reached a height of 144.995, almost touching the peak of June 30. It last traded at such levels over a year ago, in June 2022. The week concluded slightly lower, settling at 144.93. Neither the Bank of Japan's (BoJ) recent decision to shift from a rigid yield curve targeting for government bonds to a more flexible approach, nor the interventions conducted by the Japanese regulator, were able to support the yen.
Inflation data is crucial for most central banks. To combat rising prices, regulators in the US, EU, and the UK are tightening monetary policy and raising interest rates. However, the BoJ disregards such methods, even as inflation in the country continues to climb. Moreover, the country's government has recommended a 4% increase in the minimum wage, and spring wage negotiations have resulted in the highest wage growth in three decades. Against this backdrop, there's mounting evidence that businesses are ready to pass on these increases to consumers, which could lead to a rise in CPI.
At Japan's MUFG Bank, they forecast that the Bank of Japan might only decide on its first rate hike in the first half of the following year. Only then will there be a shift towards strengthening the yen. As for the recent change in the yield curve control policy, MUFG believes it's insufficient on its own to prompt a recovery of the Japanese currency.
Analysts at Germany's Commerzbank feel that the lack of clarity in the Bank of Japan's policy further depresses the yen and hinders its growth. Over the recent months, when all Central Banks, except the Japanese one, have raised their key rates, one thing has become clear: the monetary policy of the Bank of Japan will not be favourable for the yen in the foreseeable future, Commerzbank shares. They add that the yen is a complex currency to understand, possibly linked to the BoJ's monetary policy.
Strategists at Societe Generale opine that if the USD/JPY pair consolidates above 144.50-145.00, growth may continue to 146.10 (76.4% correction of the movement from last October) and then even higher to 147.90.
Analysts at Credit Suisse also maintain a bullish outlook on the pair and aim higher in their forecasts. "We continue to anticipate a retest of our interim target of 145.00-145.12," they write. "Although this mark is expected to hold again, our core forecast remains bullish, and we anticipate that it will ultimately be breached. This will lead the market to resistance at 146.54-146.66, and eventually, to a target of 148.57.".
Concerning the near-term perspective, the median forecast of experts greatly diverges from the aforementioned opinions. An overwhelming majority of them (80%) expect a correction of USD/JPY downwards. (One possible reason for the decline could be another currency intervention.) The remaining 20% chose to remain neutral. The number of those expecting further growth of the pair this time was zero. Both trend indicators and oscillators on D1 are 100% green, although a quarter of the latter signals overbought conditions. The nearest support level is located at 144.50, followed by 143.75-144.04, 142.90-143.05, 142.20, 141.40-141.75, 140.60-140.75, 139.85, 138.95-139.05, 138.05-138.30, 137.25-137.50. The closest resistance stands at 145.30, followed by 146.85-147.15, 148.85, and finally, the October 2022 high of 151.95.
Among the events of the upcoming week in the calendar, one can note Tuesday, August 15, when data on consumer spending, industrial production volumes, and Japan's GDP will be published. The next day, the value of the Reuters Tankan Business Confidence Index will be known, and on Friday, August 18, we will learn the values of the National Consumer Price Index (CPI).
CRYPTOCURRENCIES: The Search for a Trigger Continues
Two weeks ago, we titled our review "In Search of the Lost Trigger". Over the days that have passed since then, the trigger has still not been found. After the drop on July 23-24, BTC/USD moved to another phase of sideways movement, moving along the Pivot Point around $29,500. According to some analysts, market participants avoided sharp movements in anticipation of inflation data in the US, which was published on Thursday, August 10. Which, as a result, the crypto market completely ignored.
Bitcoin network indicators suggest accumulation in anticipation of a price breakthrough. According to the Blockware Intelligence newsletter, the volume of liquid and highly liquid supply has dropped to its lowest level since 2018. As noted in Blockware, speculative traders are exchanging a decreasing amount of coins back and forth, while long-term holders have tucked their reserves into cold wallets.
Opinions on which direction this breakthrough may take, as usual, are divided. For instance, trader, analyst, and founder of the venture firm Eight, Michael Van De Poppe, refuted suggestions about the first cryptocurrency's price dropping to the $12,000 mark and reassured those talking about a complete capitulation of altcoins.
"The bear market has been ongoing for more than two years," he wrote, making it the longest market in cryptocurrency history. However, this is not surprising given the hacks, bankruptcies, and litigations in the crypto industry. From the analyst's observations, the most bearish sentiments are often found among those who first invested in digital assets specifically in 2021. "For them, the slow loss of money feels extremely painful, and they only expect further portfolio value decreases," the expert noted.
In his opinion, the second stage of capitulation is now taking place: the most boring period of the cycle, during which it seems that nothing at all is happening in the markets. "Be patient, enjoy the realization that you are still in the market, accumulate positions. [...] Big companies are getting into the game, and the wisest thing you can do is to follow them," Van De Poppe advised.
A considerably less optimistic forecast was given by another renowned trader, Tone Vays. He noted that selling pressure is increasing and the price of the first cryptocurrency might significantly decline. "Bitcoin continues to struggle, but I'd say there's a high chance the BTC price could drop to the next moving average. And, if daily candles keep closing below the previous ones, I would advise reducing the position by 50% because I can't predict how low bitcoin might fall. It could easily drop to $25,000. There are enough people in the market who, for some reason, keep selling their coins," the analyst writes.
Tone Vays is convinced: if bitcoin does indeed drop to $25,000, there's a high likelihood of further long-term decline. From the expert's perspective, the first cryptocurrency is "on the edge of a cliff, and things look bad." "The price needs to turn around immediately, I mean - this month. We don't have the luxury to drop another month, otherwise, panic will spread in the market, and I won't be surprised if BTC trades below $20,000. Miners will also start liquidating their holdings, which is very dangerous," warns the specialist. (It's worth noting that at the end of May, Vays spoke about the imminent rise of the first cryptocurrency above $30,000. The forecast turned out to be correct, but BTC couldn't maintain that level.).
A potential trigger for the start of a bullish rally could have been the news of payment giant PayPal issuing its own stablecoin, PayPal USD (PYUSD). This was announced on Monday, August 7. The founder of the charity The Bitcoin Foundation, Charlie Shrem (Charles Shrem), quickly stated that this event would lead to a rise in bitcoin's price to at least $250,000. Moreover, this will happen much faster than expected. In his opinion, ETH will also appreciate at an accelerated pace to $18,000, as PYUSD is issued on the Ethereum blockchain. Consequently, the price of this altcoin may increase due to a rise in the number of network users from PayPal's clientele.
However, unlike Charlie Shrem, most experts reacted sceptically to the news, as the tool doesn't offer anything new or useful for users. It also remains a mystery why Shrem suddenly decided that PYUSD would positively affect the price of bitcoin. Logically, the issuance of stablecoins should, on the contrary, cause a decrease in BTC's value, as it would enhance the investment appeal of a competitor - ETH. Nonetheless, PYUSD did not act as a trigger for either bitcoin or Ethereum, which is evident from the BTC/USD and ETH/USD charts.
As a result, investors have three events in "reserve" that can potentially push the crypto market upward. These are: 1) a radical easing of the monetary policy of the US Federal Reserve, 2) the approval by the Securities and Exchange Commission (SEC) to launch spot bitcoin ETFs, and 3) the bitcoin halving.
It should be noted that the next halving is tentatively scheduled for April 12, 2024. Every 210,000 blocks or once every 4 years, it halves the reward that miners receive for mining a block. This is done to create a deflationary environment and support the value of BTC by reducing the rate of new coin issuance. (The total emission limit is set at 21 million coins). Initially, from 2009, miners received 50 BTC for each generated block. In 2012, the reward was reduced to 25 BTC, in 2016 to 12.5 BTC, and after 2020, to 6.25 BTC. When the 2024 halving occurs, the mining reward will decrease to 3.125 coins.
As a result of this event, miners will have to adapt to the new reality. They will need to acquire more powerful and energy-efficient equipment or upgrade existing ones. According to forecasts, many small companies will likely leave the market or be acquired by larger players. Consequently, a centralization of the mining market can be expected, which will be taken over by a few large pools. This will make the network more susceptible to manipulations and hacker attacks. However, a sharp increase in the price of BTC can at least partially offset these negative factors.
Many market participants expect that after this event, the bitcoin price might skyrocket once again, as evidenced by historical data. After the 2012 halving, the BTC price rose from $11 in November 2012 to $1,100 in November 2013. The 2016 halving: the price increased from $640 in July to $20,000 in December 2017. The 2020 halving allowed the coin's price to rise from $9,000 in May 2020 to a peak of $69,000 in November 2021. However, despite these statistics, experts warn that past results do not guarantee their repetition in the future.
One of the leading figures in the crypto industry and CEO of Blockstream, Adam Back, placed a bet of one million satoshi (0.01 BTC) that the price of bitcoin would reach $100,000 a month before the halving. The bet was made as a result of a wager with a user of platform X (formerly Twitter) under the nickname Vikingo, who believes that the digital gold quotes will not reach this height until 2025.
Back's former colleague at Blockstream, and now CEO of Jan3, Samson Mow, agreed with him. Experts from Seeking Alpha mention almost the same figure. They believe that the cryptocurrency should be worth about $98,000 for miners to stay afloat after the halving. However, a popular analyst known as PlanB, based on his S2F model, stated that by the time of the halving, BTC will be worth much less - only about $55,000.
As of the time of writing this review, on the evening of Friday, August 11, BTC/USD is trading around $29,400, ETH/USD is around $1,840. The total market capitalization of the crypto market has grown and is now $1.171 trillion ($1.157 trillion a week ago). The Crypto Fear & Greed Index remains in the Neutral zone at 51 points (54 points a week ago).
Dollar Holds Up, Storm Brewing in Commodity Currencies
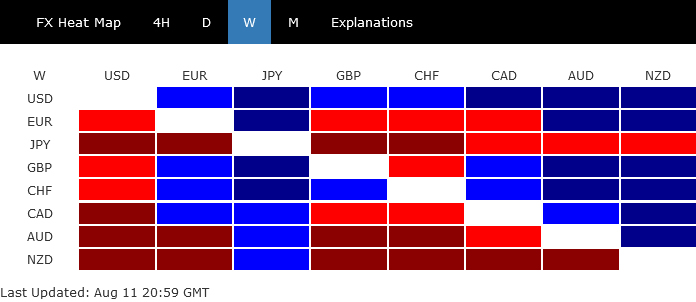
Dollar emerged notably resilient in a week of highly anticipated inflation data, clinching the top spot among currency performers. With the next FOMC meeting still more than a month away, the greenback's trajectory now rests heavily on the prevailing market risk sentiment. Critical to this equation is the capability of major stock indexes to bounce back after a fortnight of retractions, coupled with the potential continuation of the recent surge in treasury yields.
Diverging paths were evident as Yen grappled with its persistent near-term decline, wrapping up the week at the bottom of the performance ladder. Yet, it's the brewing storm in commodity currencies that's capturing significant attention. Directly tying to this is the turbulence in Chinese markets. Escalating investor concerns around real estate crises, looming deflation, and the dive in trade have cast shadows over the financial landscape. This anxiety is palpably evident in the sharp declines witnessed in Chinese stocks and Yuan, with ripples also touching Aussie and Copper markets.
In Europe, major currencies presented a mixed bag. While Euro closed slightly weaker when juxtaposed against Sterling and Swiss Franc, they largely danced within their familiar terrains, with traders keeping an eagle eye out for potential breakouts.
Dollar survived inflation data, with help from NASDAQ and 10-year yield
For the first time this year, NASDAQ has recorded back-to-back weekly declines, drawing significant attention from investors. While S&P 500 also ticked down, DOW managed to close with marginal gains within its recent range. Contrary to some assumptions, the inflation metrics, with CPI and PPI largely in line with expectations, may not be the chief culprits behind the market movements. It seems the major indices just digesting recent gains, potentially with investors recalibrating their positions ahead of the crucial FOMC meeting come September.
Technically, however, NASDAQ is now pressing 55 D EMA (now at 13606.77). Strong rebound from around current level will keep the price actions from 14446.55 as a near term correction only. Break of last week's high at 13997.15 should push NASDAQ for a new high above 14446.55 before forming a medium term top.
However, sustained break of 55 D EMA will argue that it's at least in correction to the whole up trend from 10088.82. In this case, deeper fall would seen to 38.2% retracement of 10088.82 to 14446.55 at 12781.89 before forming a bottom.
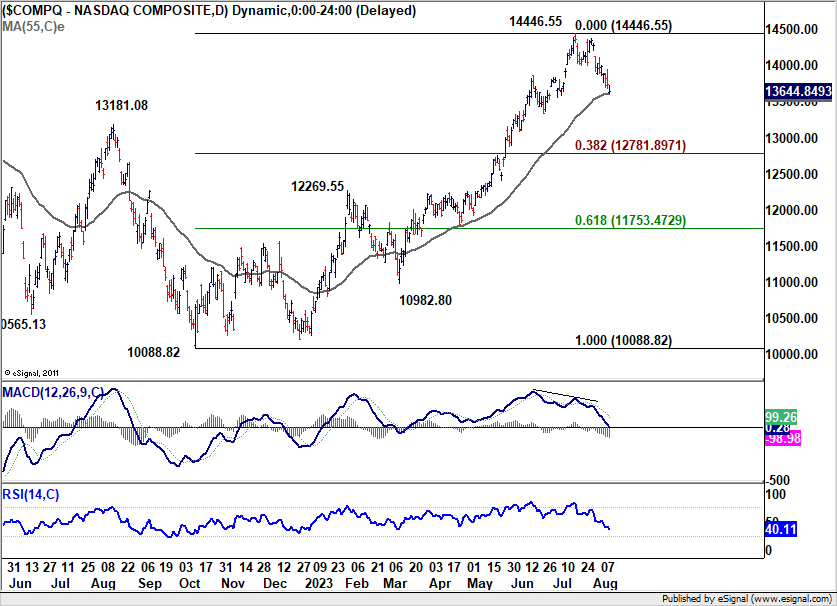
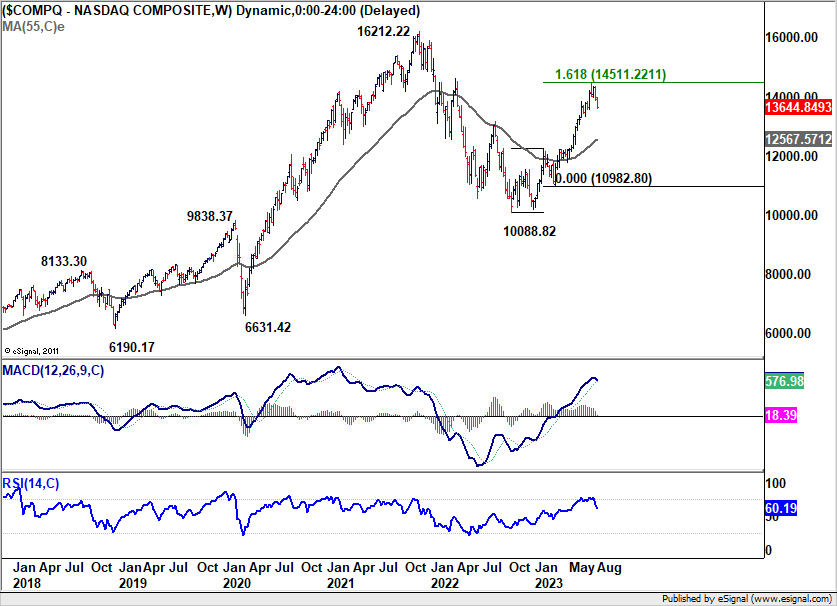
Meanwhile, it should also be noted that rise from 10088.82 could be just the second leg of the whole pattern from 16212.22 (2021 high). It's premature to conclude but this rise could have completed with three waves up, after just missing target of 161.8% projection 10088.82 to 12269.55 from 10982.80 at 14511.22 by an inch. It's plausible that a bearish reversal is already underway. But of course, NASDAQ will have to sustain below 55 D EMA first, before we dig deeper into this scenario.
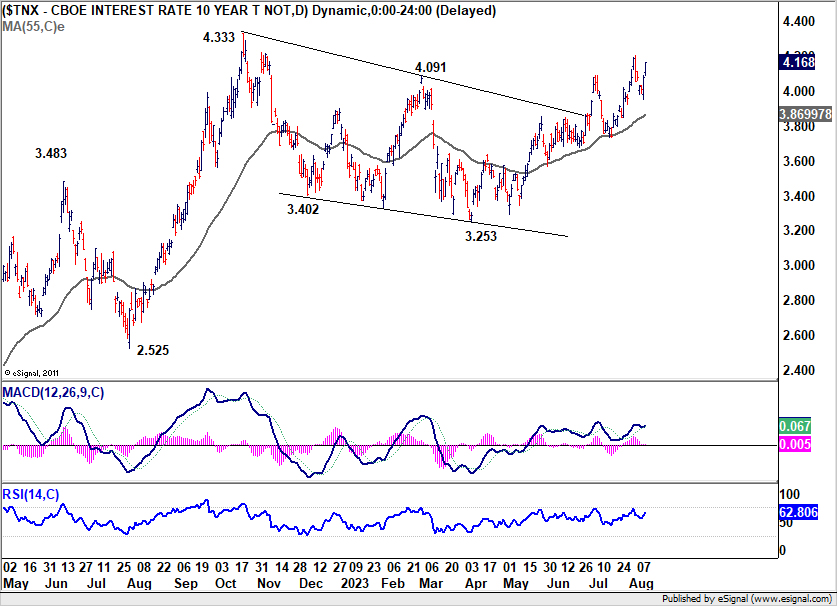
As for 10-year yield, despite some intra-week jitters, the development is largely as expected. Rise from 3.253 remains in good shape even though there is notable pick up in upside momentum. Further rally would be expected as long as 55 D EMA (now at 3.869) holds, to retest 4.333 high.
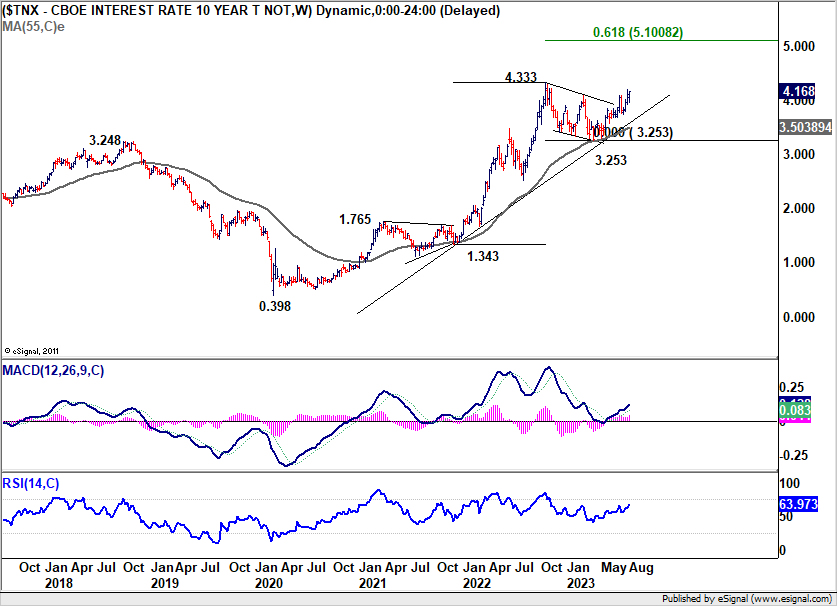
The question remains on whether current rally in TNX is resuming larger up trend from 0.398 (2020 low). If that's the case, firm break of 4.333 would set the stage for TNX to head through 5% handle towards 61.8% projection of 1.343 to 4.333 from 3.253 at 5.100.
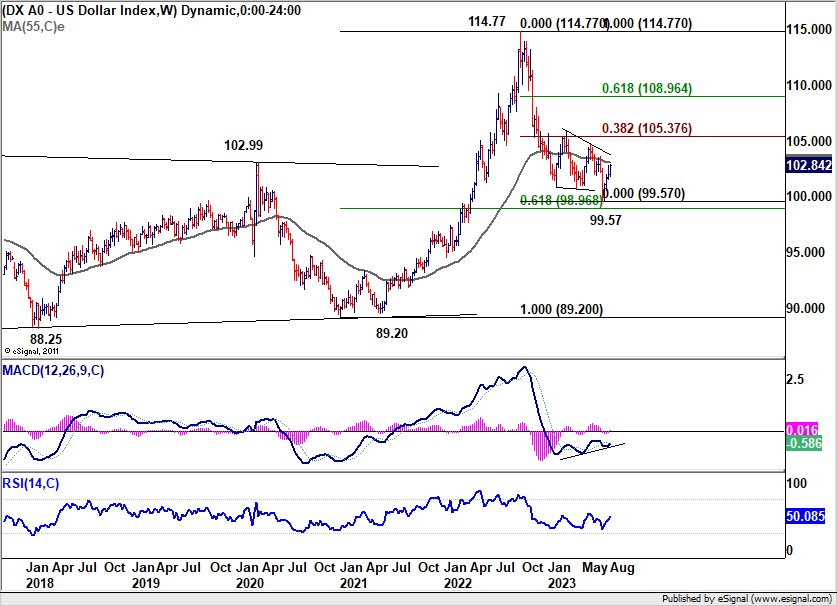
While Dollar dipped initially following US CPI release, it showed commendable resilience and quickly recovered. Dollar Index has indeed closed the week slightly higher, defended 55 D EMA (now at 102.17) and made a little progress in extending the rebound from 99.57 low.
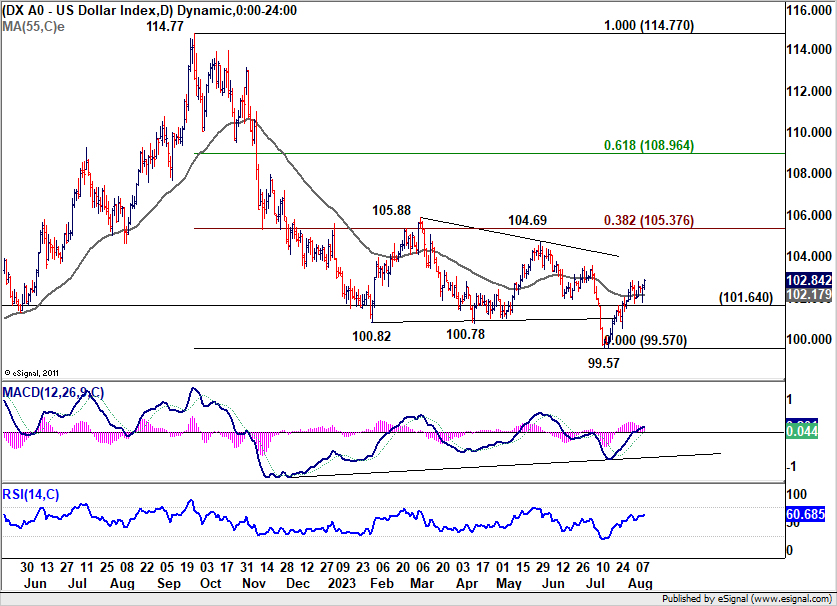
For now, further rally in DXY is expected as long as 101.64 support holds. Rise from 99.57 (which is seen as a medium term bottom) should target 38.2% retracement of 114.77 to 99.57 at 105.37. For this move to happen, ideally, there should be extended fall in stocks and rally in 10-year yield as mentioned above.
As for the rally to be reversing the trend from 114.77, rather than correcting it, there needs to be substantial decline in stocks, like NASDAQ breaking through 12781.89 fibonacci support, or has 10-year yield breaking through 4.333 high decisively at least.
Real estate crisis, deflation, trade downturn in China
In a tumultuous week, Chinese markets witnessed severe declines, spurred by growing anxieties over another looming real estate crisis and heightened fears of deflation and trade downturns.
US President Joe Biden's characterization of China as a "ticking time bomb" intensified speculations. Though the validity of his comments on China's internal economic and societal issues can be debated, the apprehensive investor sentiment is undeniable.
Amplifying these concerns was the disclosure that Country Garden, a leading Chinese private-sector developer, defaulted on interest payments for two of its Dollar-denominated bonds. Subsequently, the firm projected a loss of between CNY 45B to CNY 55B for the first half of the year.
The scale of Country Garden's debt has drawn inevitable comparisons to Evergrande, previously known as the world's most indebted property company. Analysts suggest that the repercussions of a Country Garden crisis might overshadow the impact of Evergrande's previous downfall.
Adding to the economic unease, China's new loans in July plummeted by a staggering 89% mom, hitting their lowest since 2009, and falling well below anticipated levels. With China's July CPI dropping by 0.3% year-on-year, steepest drop since February 2020, and significant contractions in both exports and imports, the economic outlook appears increasingly bleak.
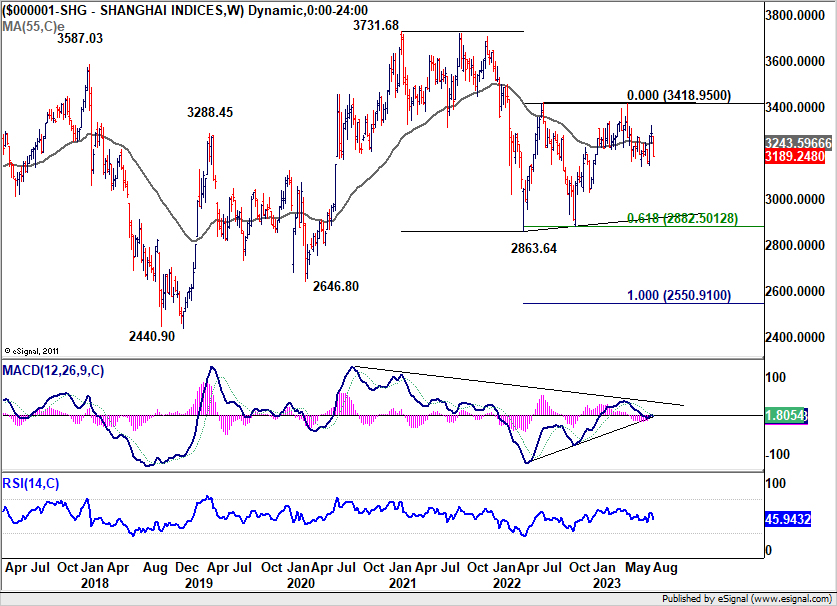
Reflecting the overarching investor sentiment, Shanghai SSE tumbled sharply on Friday to close at 3189.24 on Friday. Current development suggests that recovery from 3144.24 has completed at 3322.12 already. Deeper fall is now in favor as long as 55 D EMA (now at 3237.84) holds.
Firm break of 3144.24 will affirm the case that whole rise from 2885.08 has completed, just ahead of 3424.83 medium term resistance. In this case, next target would be 100% projection of 3418.95 to 3144.24 from 3322.12 at 3047.41.
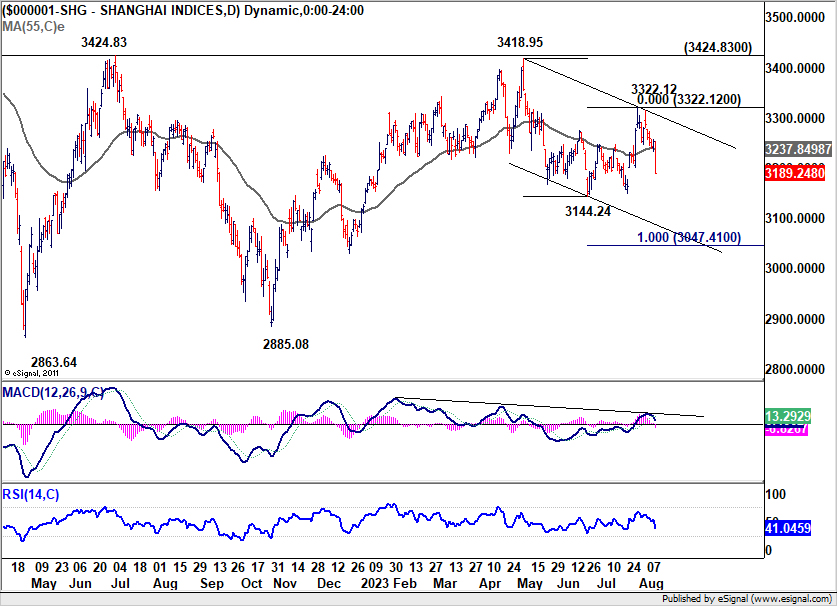
The more important question is whether SSE is already trying to resume the down trend from 3731.68 (2021 high). The structure of the fall from 3418.95 doesn't warrant this bearish scenario yet. But the chance could be raised if there is significant downside acceleration after breaking through 3144.24 support.
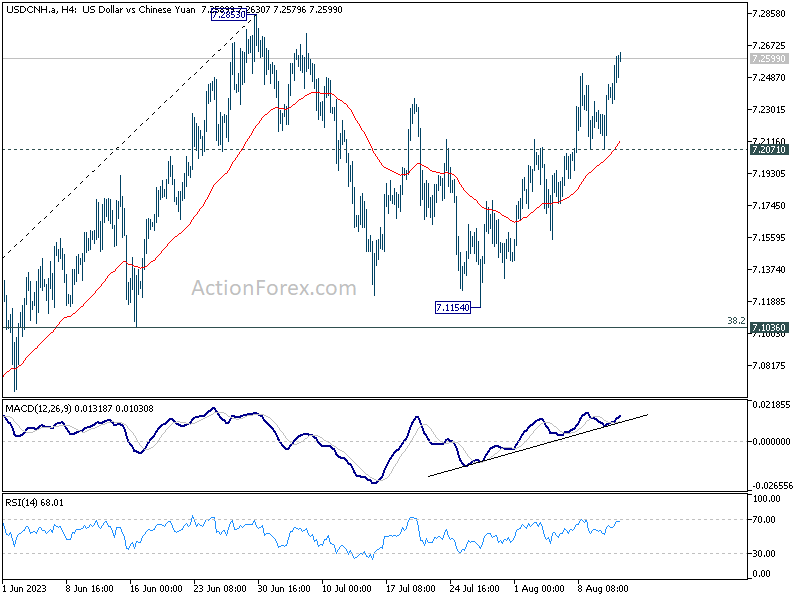
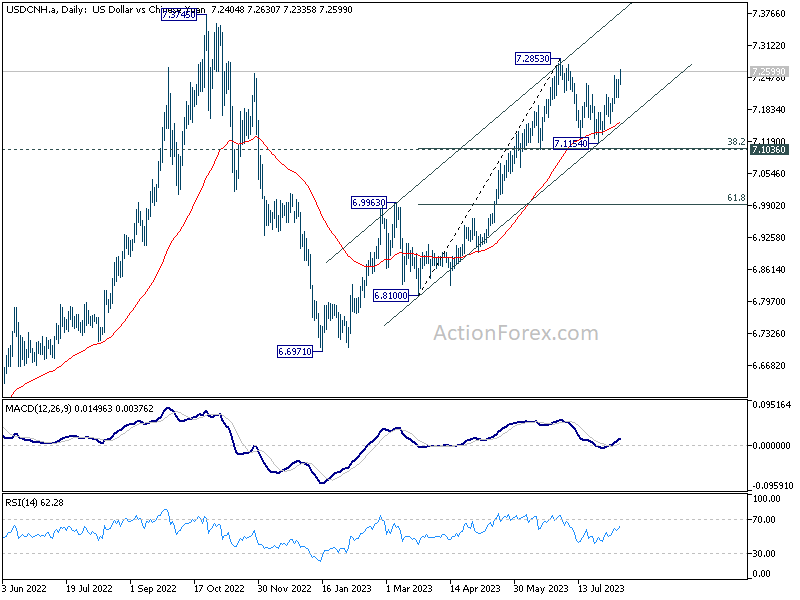
USD/CNH resumed the rally from 7.1154 as offshore Yuan was under pressure. Further rise is now expected in the pair as long as 7.2071 support holds, for retesting 7.2853 high. The strong support from 55 D EMA argues that whole up trend from 6.6971 is possibly ready to resume too. Break of 7.2853 will confirm this bullish case, and target 7.3745 (2022 high). But as it's always, the move would depend on when the Chinese authority would come in and intervene.
Aussie and Copper looking vulnerable
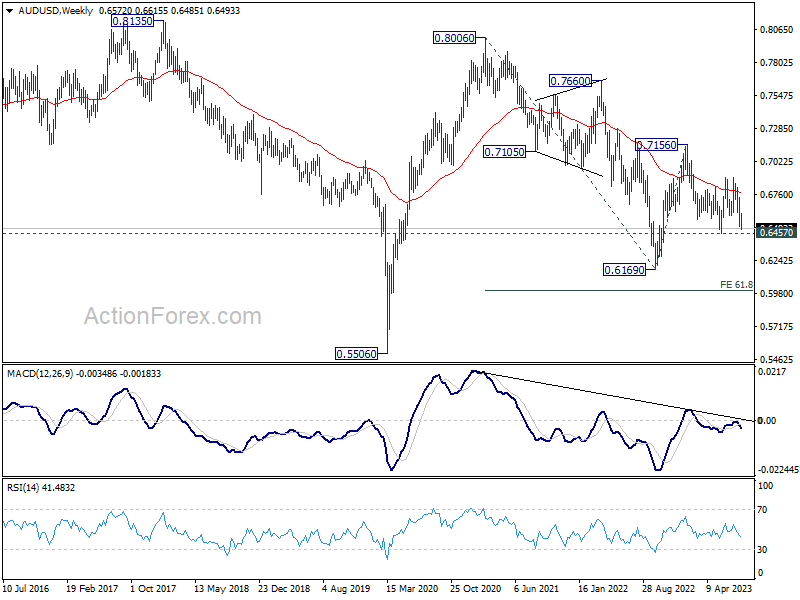
Australian Dollar ended as one of the worst performers last week, just next to Yen and New Zealand Dollar. Considering the overall development surrounding China, Aussie was indeed rather resilient already. Yet, current development argues that fall from 0.7156 is ready to resume through 0.6457 low.
In any case, outlook will now stay bearish as long as 0.6615 resistance holds. Firm break of 0.6457 will confirm this bearish case and target 100% projection of 0.7156 to 0.6457 from 0.6894 at 0.6195.
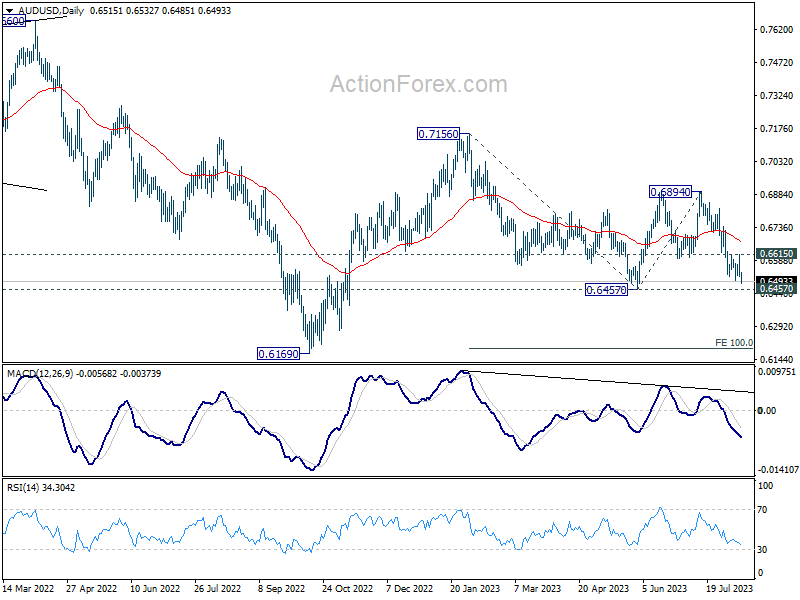
Any downside acceleration on breaking through 0.6457 would raise the chance of resumption of whole down trend from 0.8006 (2021 high). In this bearish scenario, AUD/USD might only be able to find a bottom after hitting 61.8% projection of 0.8006 to 0.6169 from 0.7156 at 0.6021.
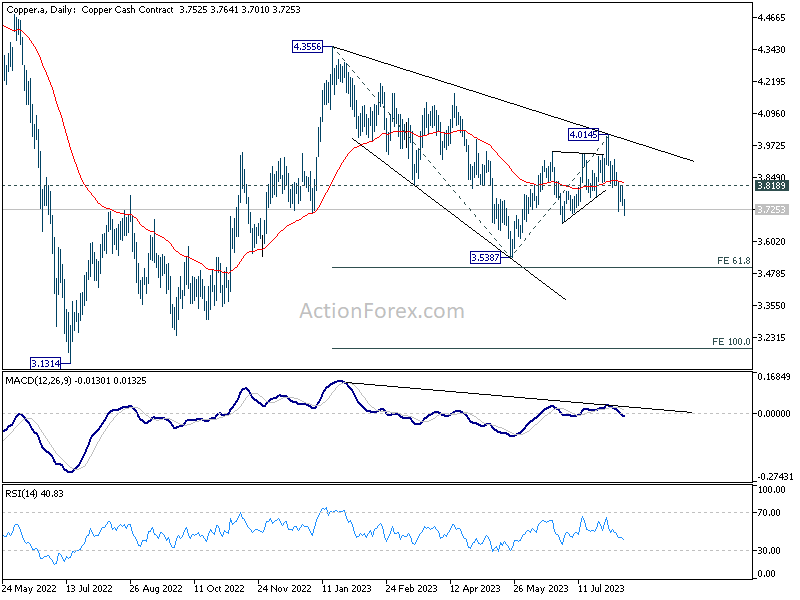
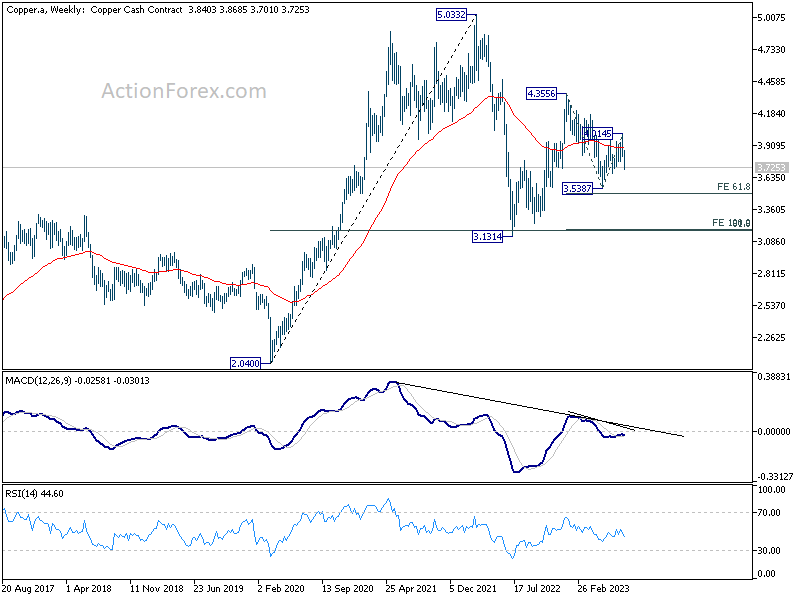
Aussie's fate remains tightly intertwined with Copper prices, further influenced by Chinese market dynamics. Last week's fall further affirm the case that recovery from 3.5387 has completed at 4.0145. Deeper decline is expected as long as 3.8189 resistance holds, for 3.5387, and possibly further to 61.8% projection of 4.3556 to 3.5387 from 4.0145 at 3.5097. Sustained break there could prompt downside acceleration to 100% projection at 3.1976, pulling Aussie down in its wake.
USD/CAD Weekly Outlook
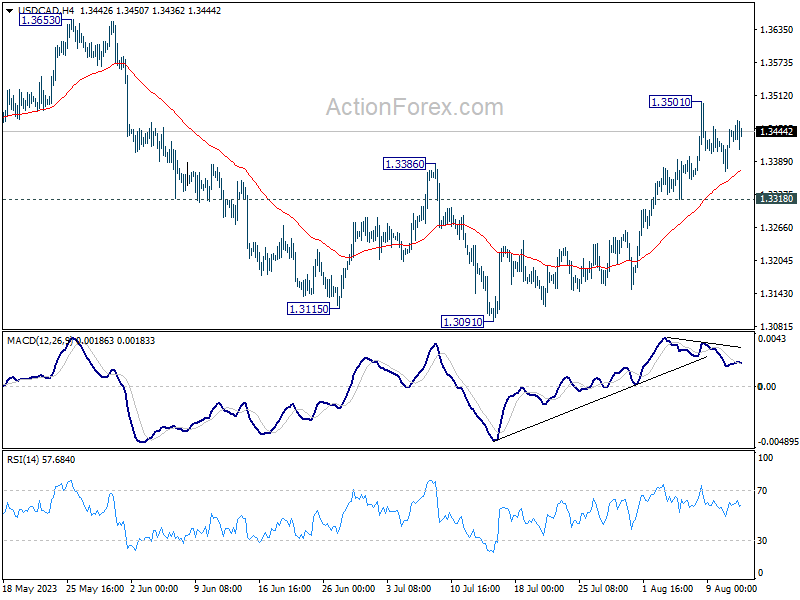
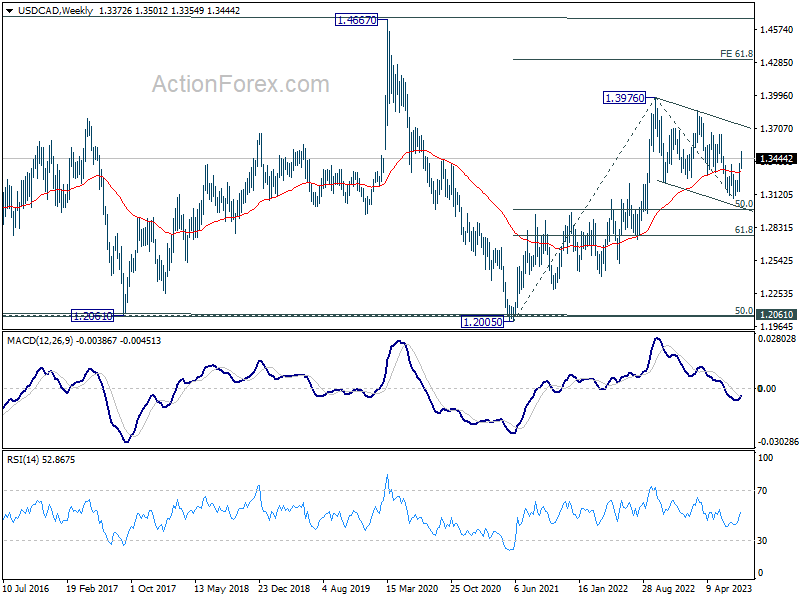
USD/CAD's rebound from 1.3091 extended higher last week and it's now pressing 1.3386 resistance. Sustained break of 1.3386 will argue that whole correction from 1.3976 has completed with three waves down to 1.3091. Further rally would then be seen to 1.3653 resistance next. Nevertheless, rejection by 1.3386, followed by break of 1.3260 minor support, should resume larger decline through 1.3091 low.
In the bigger picture, price actions from 1.3976 are viewed as a corrective fall only. Upon completion, rise from 1.2005 (2021 low) would resume through 1.3976 towards 1.4667/89 long term resistance zone. In case of another fall, downside should be contained by 61.8% retracement of 1.2005 to 1.3976 at 1.2758.
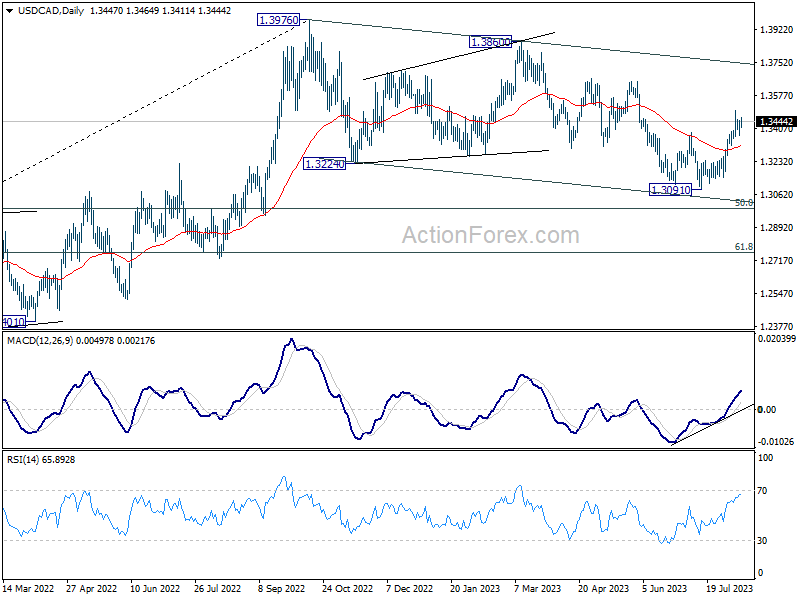
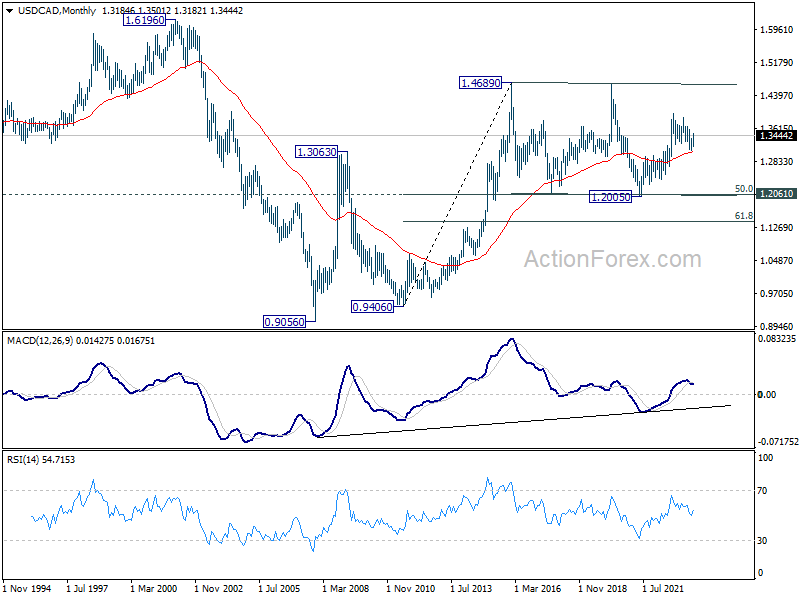
In the longer term picture, price actions from 1.4689 (2016 high) are seen as a consolidation pattern only, which might have completed at 1.2005. That is, up trend from 0.9506 (2007 low) is expected to resume at a later stage. This will remain the favored case as 55 M EMA (now at 1.3057) holds.
EUR/USD Weekly Outlook
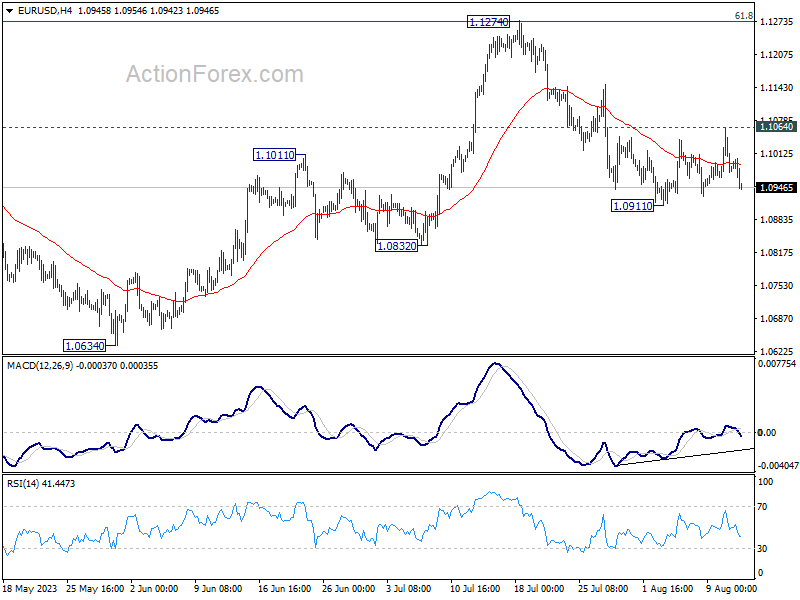
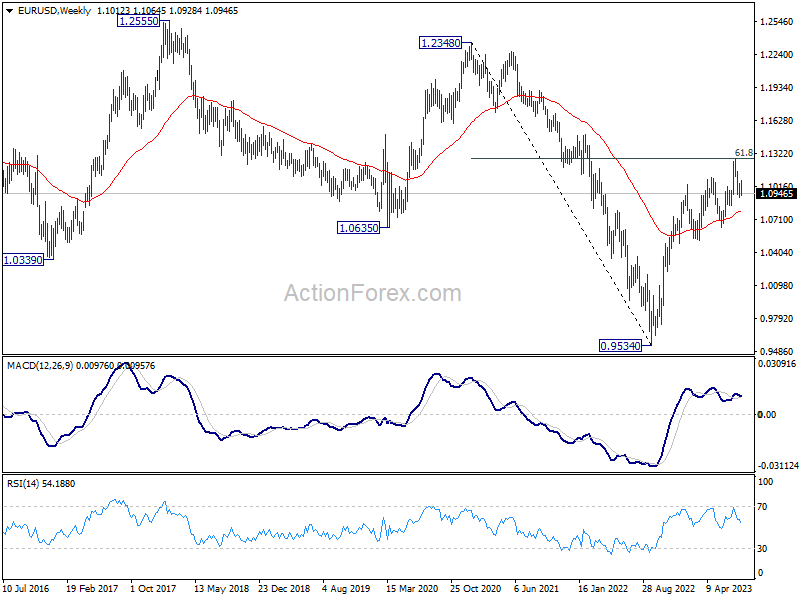
While EUR/USD's recovery from 1.0911 was slightly stronger than expected, it settled back into established range. Outlook is unchanged and initial bias stays neutral this week first. On the downside, break of 1.0911 will resume the fall from 1.1274 to 1.0832 support. Sustained trading below there will target 1.0609/34 cluster support. However, firm break of 1.1064 minor resistance will argue that pull back from 1.1274 has completed, and bring stronger rebound.
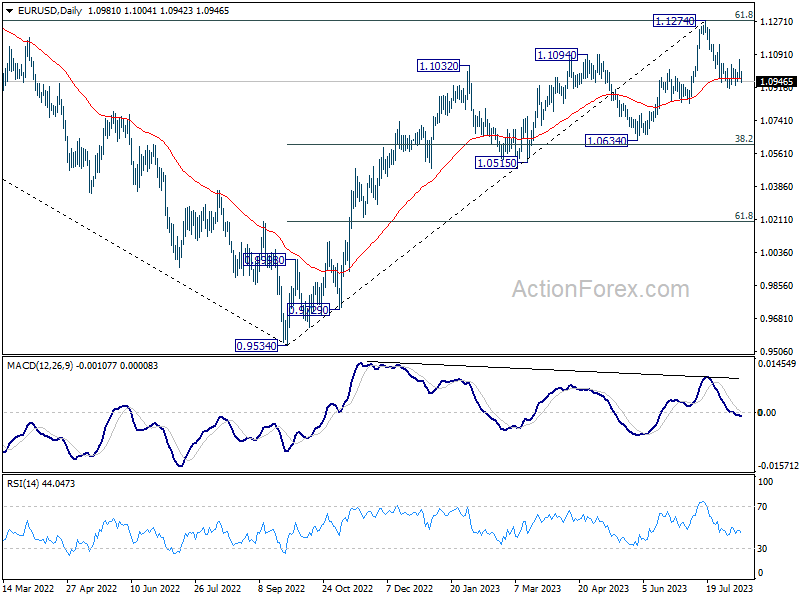
In the bigger picture, a medium term top could be formed at 1.1274, after failing to break through 61.8% retracement of 1.2348 (2021 high) to 0.9534 at 1.1273 decisively, on bearish divergence condition in D MACD. Sustained trading below 55 D EMA (now at 1.0966) will bring deeper correction to 1.0634 cluster support (38.2% retracement of 0.9534 to 1.1274 at 1.0609). Strong support could be seen there, at least on first attempt, to set the range for consolidation.
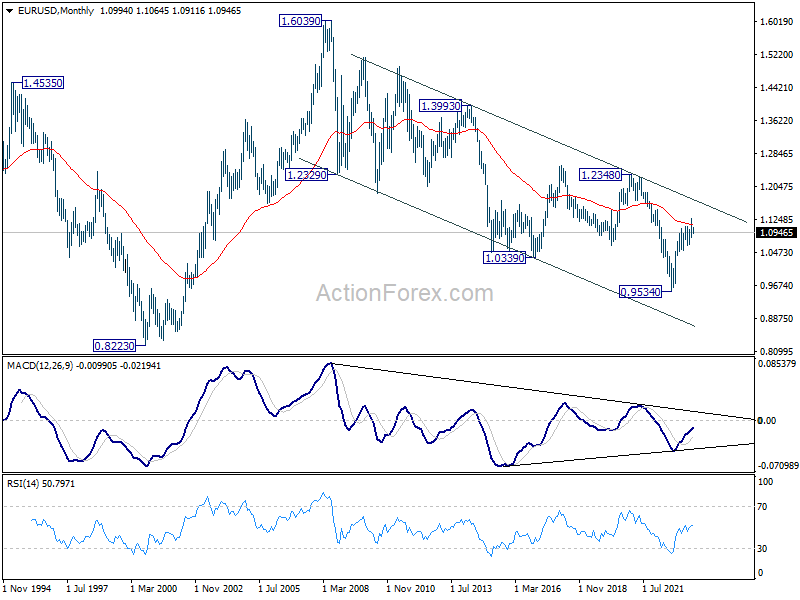
In the long term picture, focus stays on 55 M EMA (now at 1.1129). Rejection by this EMA will revive long term bearishness. However, sustained break above here will be affirm the case of long term bullish reversal and target 1.2348 resistance for confirmation.
USD/JPY Weekly Outlook
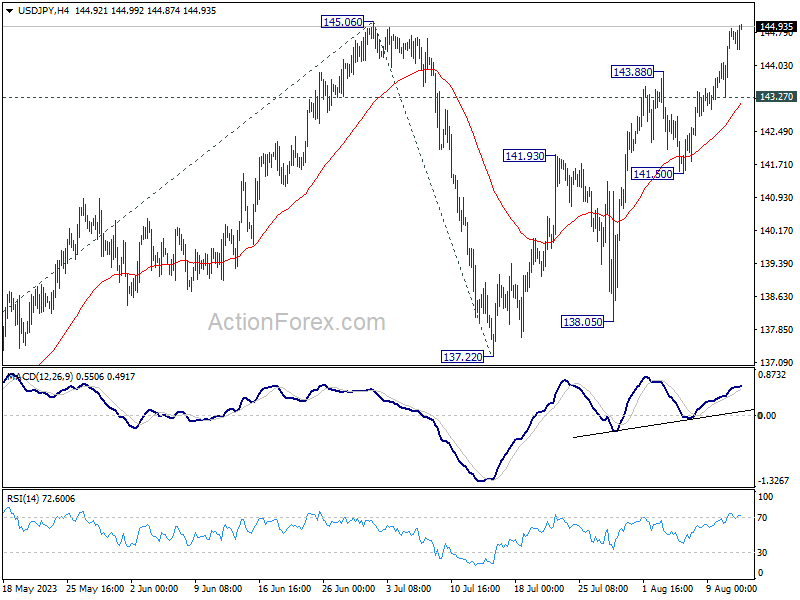
USD/JPY's rally extended higher last week and breach of 145.06 argues that whole rise from 127.20 is resuming. Initial bias stays on the upside this week. Sustained trading above 145.06 will confirm this case, and target 61.8% projection of 129.62 to 145.06 from 137.22 at 146.76. On the downside, however, below 143.27 minor support will delay the bullish case and turn intraday bias neutral again.
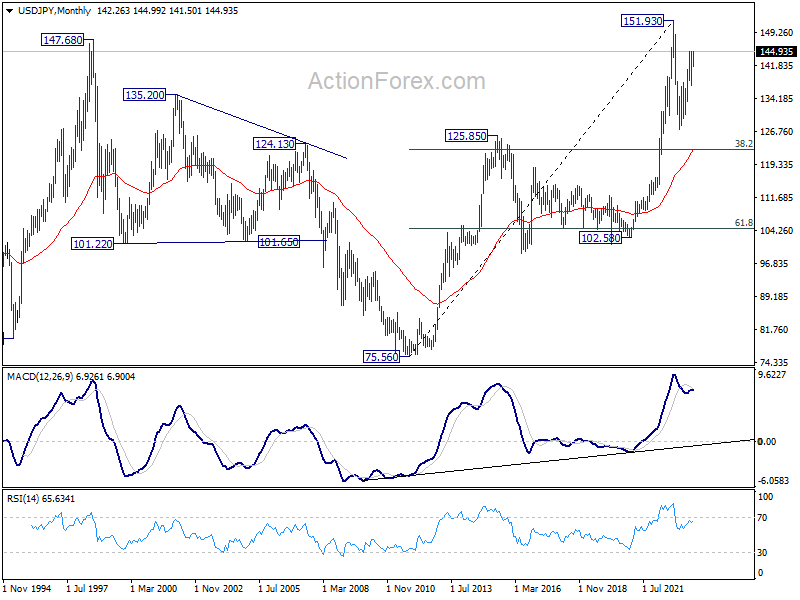
In the bigger picture, overall price actions from 151.93 (2022 high) are views as a corrective pattern. Rise from 127.20 is seen as the second leg of the pattern and could still be in progress. But even in case of extended rise, strong resistance should be seen from 151.93 to limit upside. Meanwhile, break of 137.22 support should confirm the start of the third leg to 127.20 (2023 low) and below.
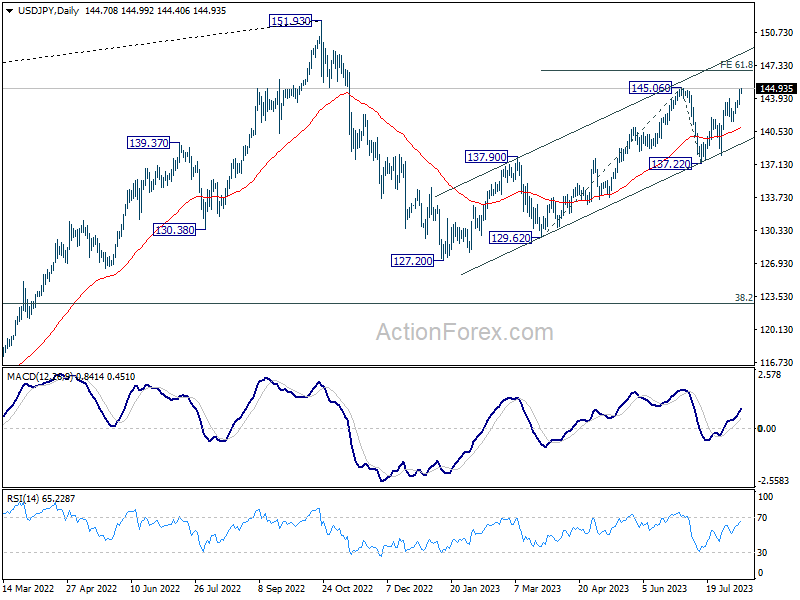
In the long term picture, price action from 151.93 is seen as developing into a corrective pattern to up trend from 75.56 (2011 low). While deeper decline cannot be ruled out, downside should be contained by 38.2% retracement of 75.56 to 151.93 at 122.75.
GBP/USD Weekly Outlook
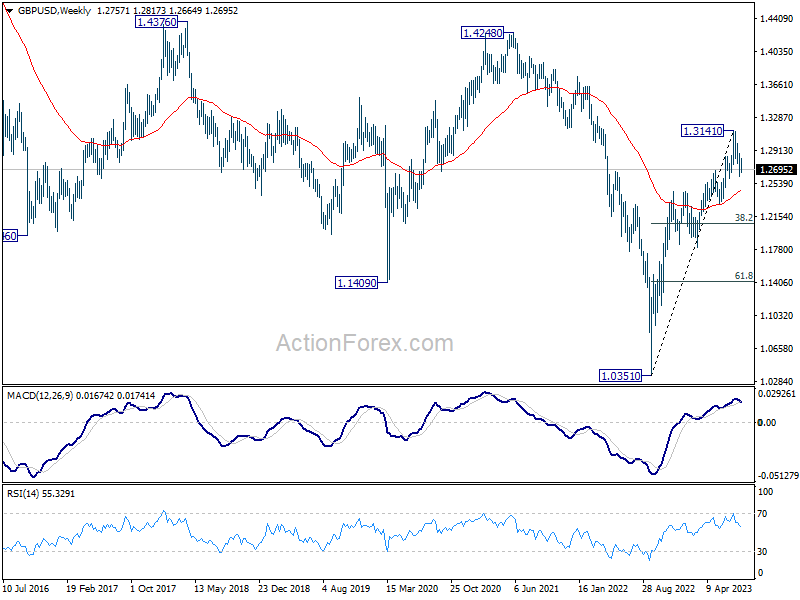
GBP/USD's recovery last week was slightly stronger than expected, but it eventually settled back in established range. Initial bias stays neutral this week. On the downside, below 1.2618, and sustained trading below 1.2678 resistance turned support will argue that it's already in a larger correction. Deeper decline would then be seen to 1.2306 support next. Nevertheless, firm break of 1.2817 minor resistance will indicate that the pull back has completed, and turn bias back to the upside for stronger rebound.
In the bigger picture, a medium term top could be in place at 1.3141 already, on bearish divergence condition in D MACD. Sustained trading below 55 D EMA (now at 1.2725) should confirm this case, and bring deeper fall to 38.2% retracement of 1.0351 to 1.3141 at 1.2075, as a correction to up trend from 1.0351 (2022 low). For now, rise will stay mildly on the downside as long as 1.3141 resistance holds, in case of strong rebound.
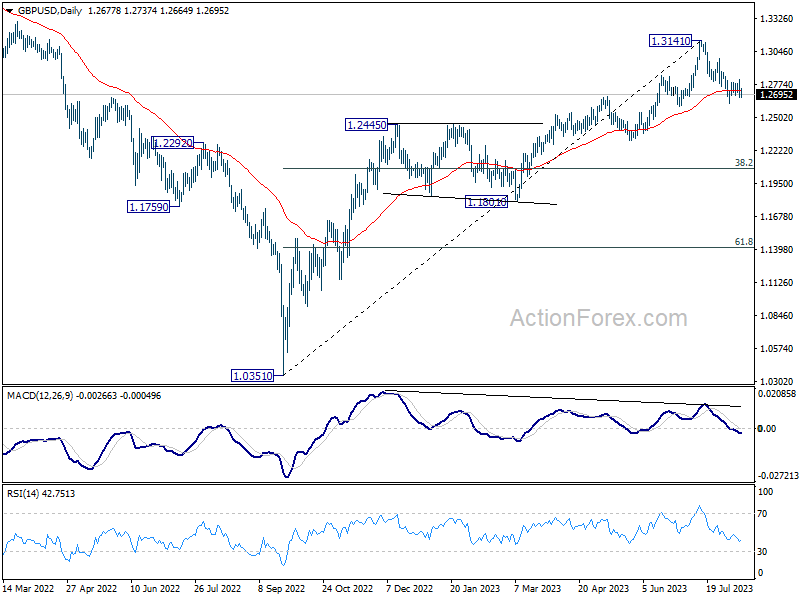
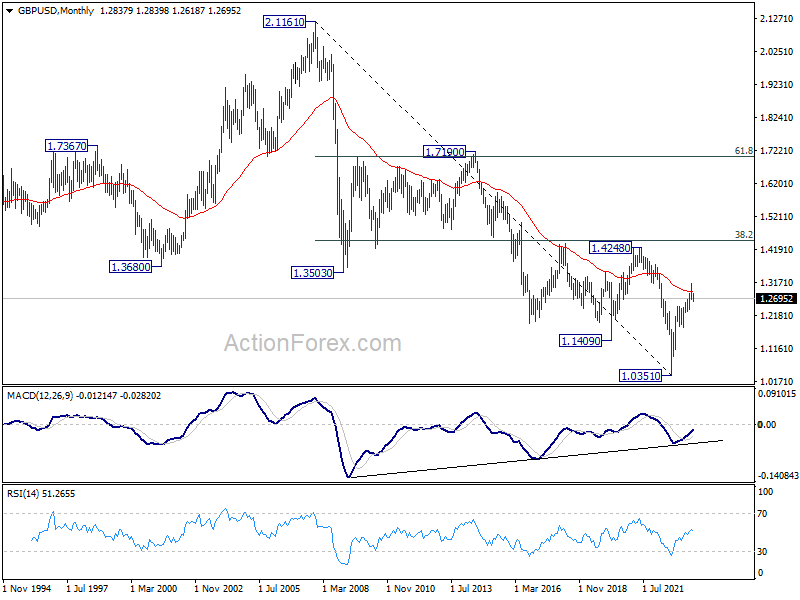
In the long term picture, sustained trading above 55 M EMA (now at 1.2902) will add to the case of long term bullish reversal, and target 1.4248 cluster resistance (38.2% retracement of 2.1161 (2007 high) to 1.0351 at 1.4480) for confirmation. Nevertheless, rejection by 55 M EMA will maintain long term bearishness for downside resumption at a later stage.
USD/CHF Weekly Outlook
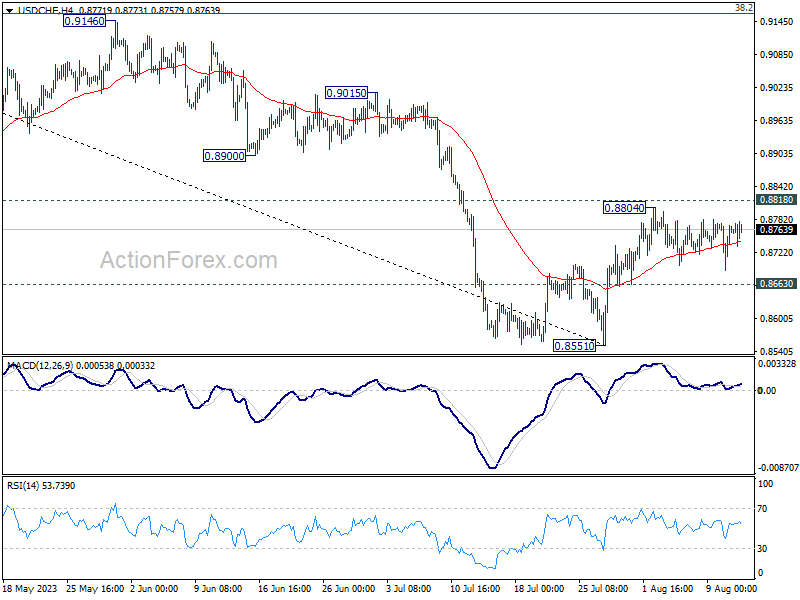
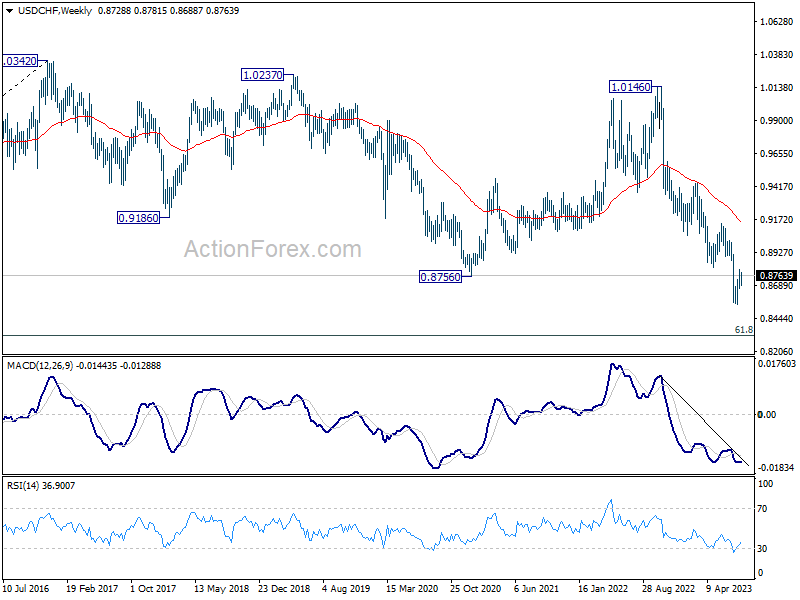
USD/CHF stayed in range trading last week and outlook is unchanged. Initial bias remains neutral this week first. On the upside, decisive break of 0.8818 support turned resistance will carry larger bullish implication, and target 0.9146 cluster resistance next. Nevertheless, break of 0.8863 support will retain bearishness and resume larger down trend through 0.8851 low.
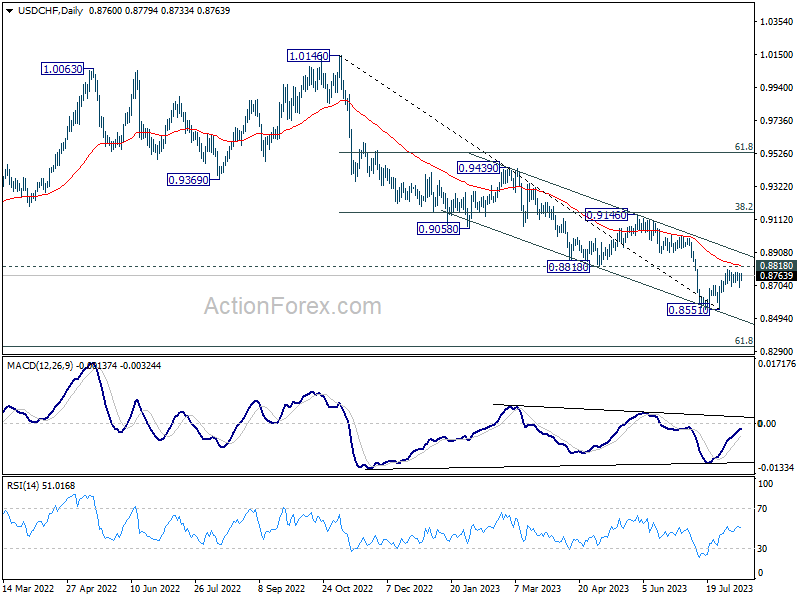
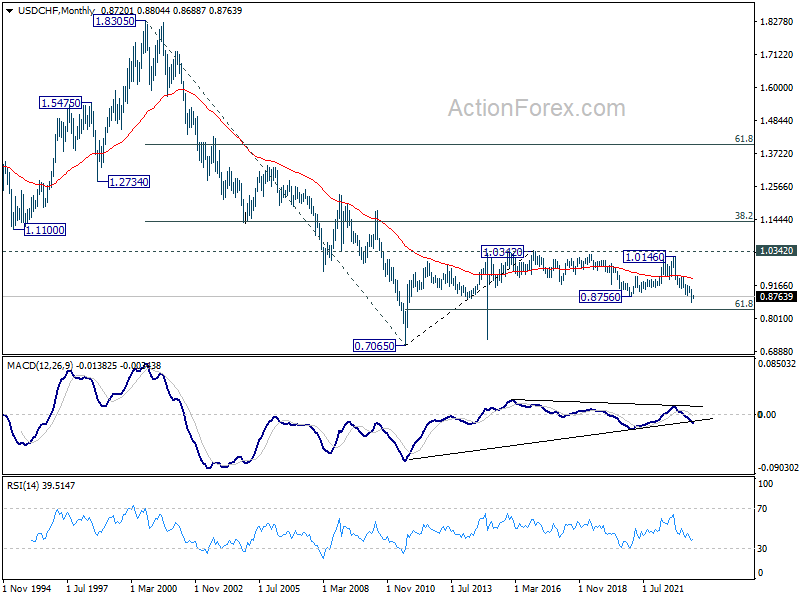
In the bigger picture, down trend from 1.0146 is seen as in progress as long as 0.8188 support turned resistance holds. Next target is 61.8% retracement of 0.7065 (2011 low) to 1.0342 (2016 high) at 0.8317. However, sustained break of 0.8818 should indicate medium term bottoming, and bring stronger rise back to 0.9146 cluster resistance (38.2% retracement of 1.0146 to 0.8551 at 0.9160), even as a correction.
In the long term picture, there is no clear sign that down trend from 1.8305 (2000 high) has completed. With 38.2% retracement of 1.8305 to 0.7065 at 1.1359 intact, outlook is neutral at best. Sustained break of 61.8% retracement of 0.7065 (2011 low) to 1.0342 (2016 high) at 0.8317 will bring retest of 0.7065 low.
AUD/USD Weekly Report
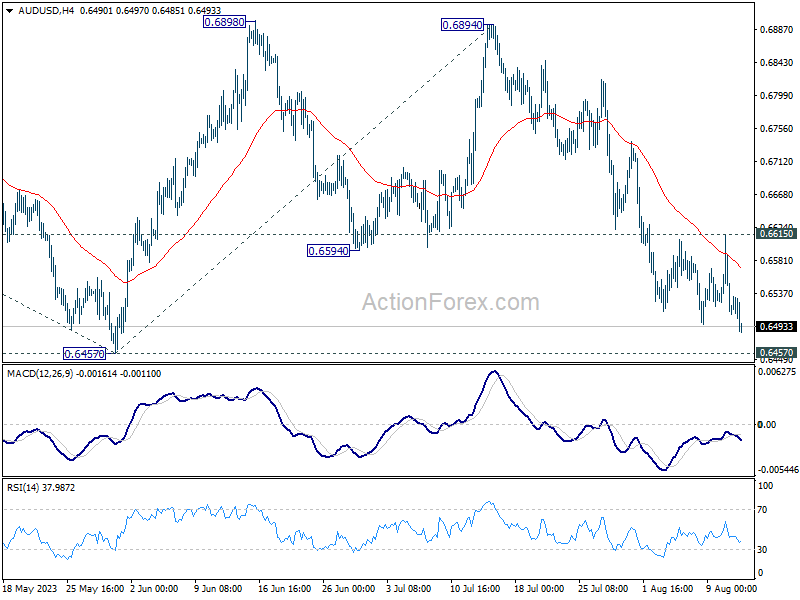
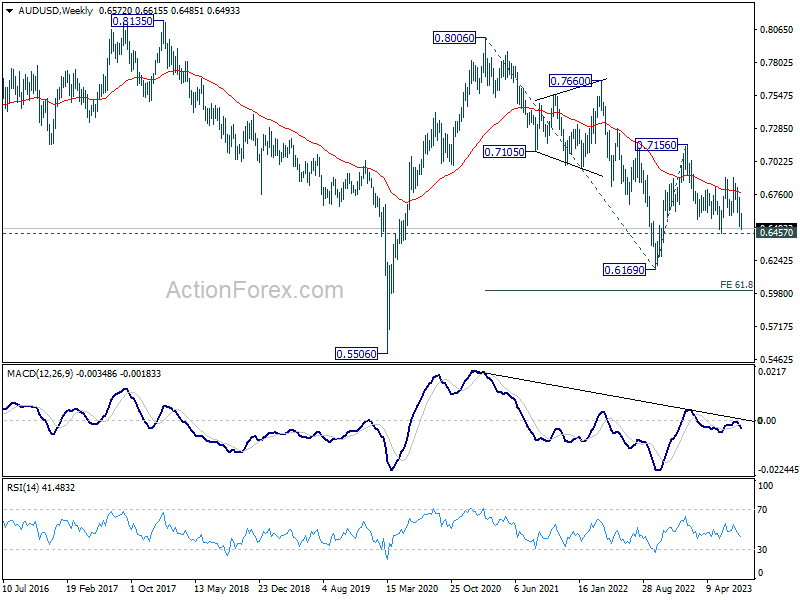
AUD/USD's decline from 0.6894 continued last week and outlook is unchanged. Decisive break of 0.6457 support will confirm resumption of whole fall from 0.7156. Next target is 100% projection of 0.7156 to 0.6457 from 0.6894 at 0.6195. Nevertheless, firm break of 0.6615 minor resistance will dampen this view, and turn bias back to the upside for stronger rebound.
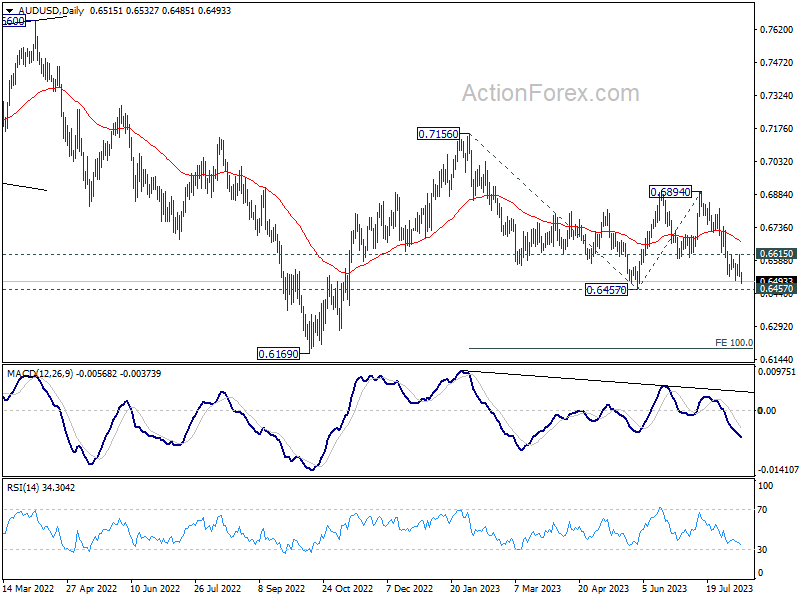
In the bigger picture, the down trend from 0.8006 (2021 high) could still be in progress. Break of 0.6457 will affirm this bearish case. Further break of 0.6169 will target 61.8% projection of 0.8006 to 0.6169 to 0.7156 at 0.6021. This will now remain the favored case as long as 0.6894, in case of strong rebound.
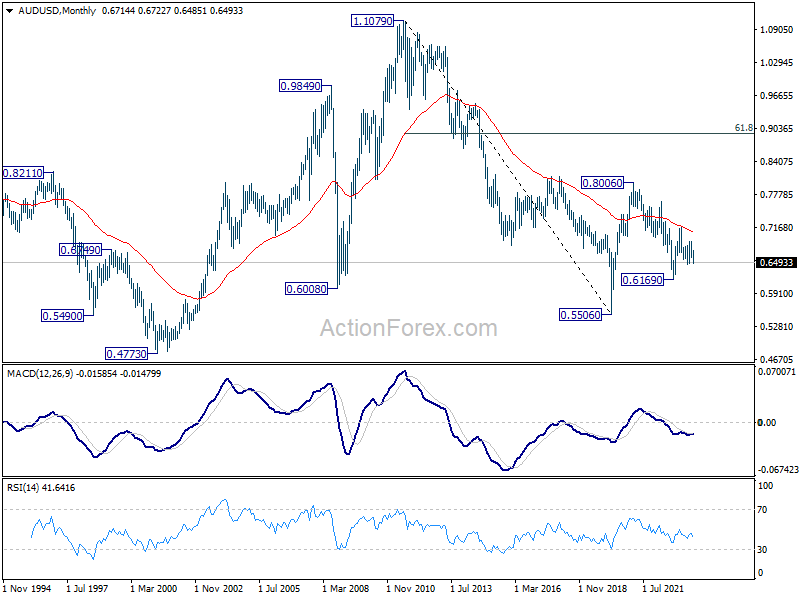
In the long term picture, while fall from 0.8006 might extend lower, the structure argues that it's merely a correction to rise from 0.5506 (2020 low). In case of downside extension, strong support should emerge above 0.5506 to bring reversal. But still, momentum of the next move will be monitored to adjust the assessment.
USD/CAD Weekly Outlook
USD/CAD's strong break of 1.3386 resistance last week affirms the case that correction from 1.3976 has completed with three waves down to 1.3091. But as a temporary top was formed, initial bias remains neutral for consolidations first. Downside of retreat should be contained by 1.3318 to bring rebound. Break of 1.3501 will resume the rise from 1.3091 to 1.3653 resistance next. Break there will further confirm this case and target 1.3976 high.
In the bigger picture, price actions from 1.3976 are viewed as a corrective fall only. Upon completion, rise from 1.2005 (2021 low) would resume through 1.3976 towards 1.4667/89 long term resistance zone. In case of another fall, downside should be contained by 61.8% retracement of 1.2005 to 1.3976 at 1.2758.
In the longer term picture, price actions from 1.4689 (2016 high) are seen as a consolidation pattern only, which might have completed at 1.2005. That is, up trend from 0.9506 (2007 low) is expected to resume at a later stage. This will remain the favored case as 55 M EMA (now at 1.3044) holds.
GBP/JPY Weekly Outlook
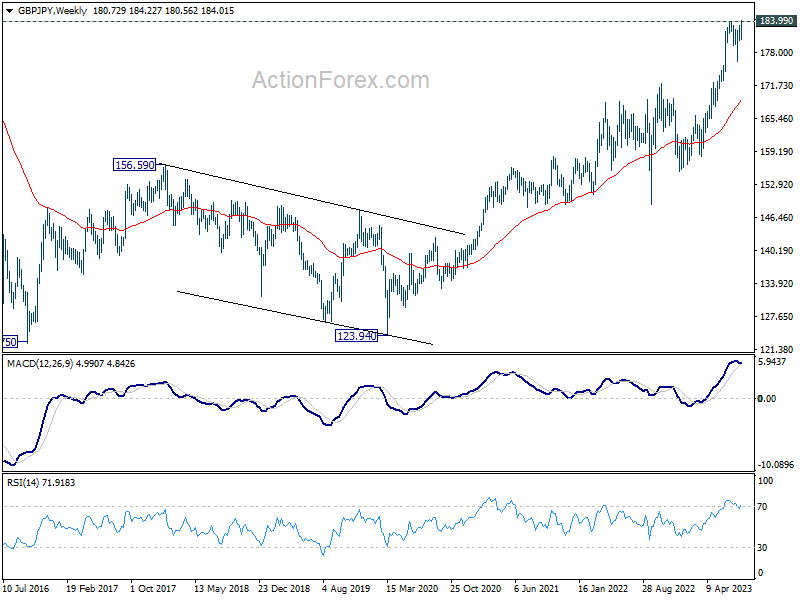
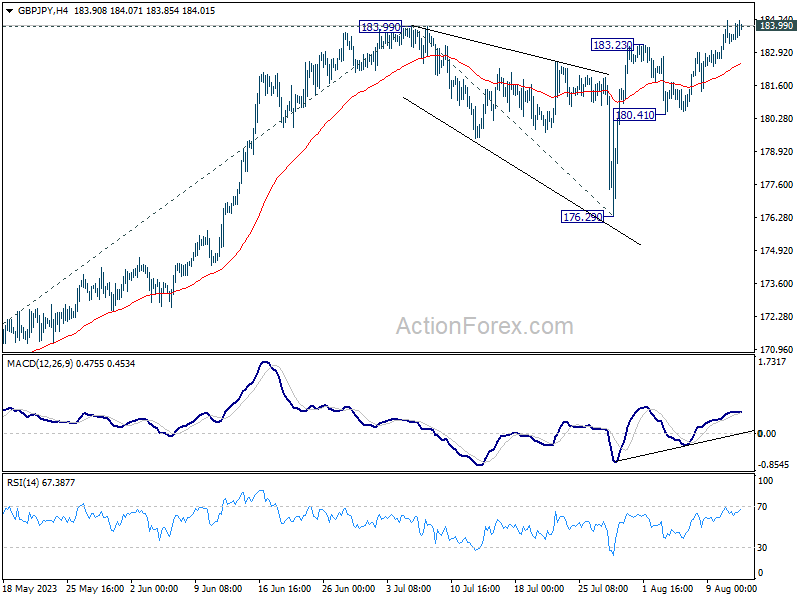
GBP/JPY's rally resumed last week and it's now pressing 183.99 high. Initial bias remains on the upside this week. Sustained break of 183.99 will confirm larger up trend resumption. Next target is 61.8% projection of 158.24 to 183.99 from 176.29 at 192.20. For now, near term outlook will stay bullish as long as 180.41 support holds, in case of retreat.
In the bigger picture, up trend from 123.94 (2020 low) is in progress. Next target is 195.86 (2015 high). This will now remain the favored case as long as 176.29 support holds, even in case of deeper pull back.
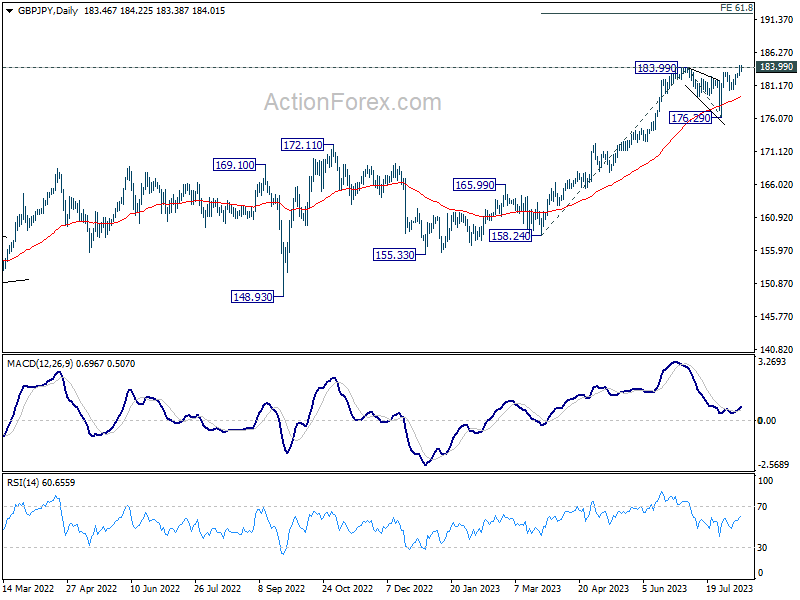
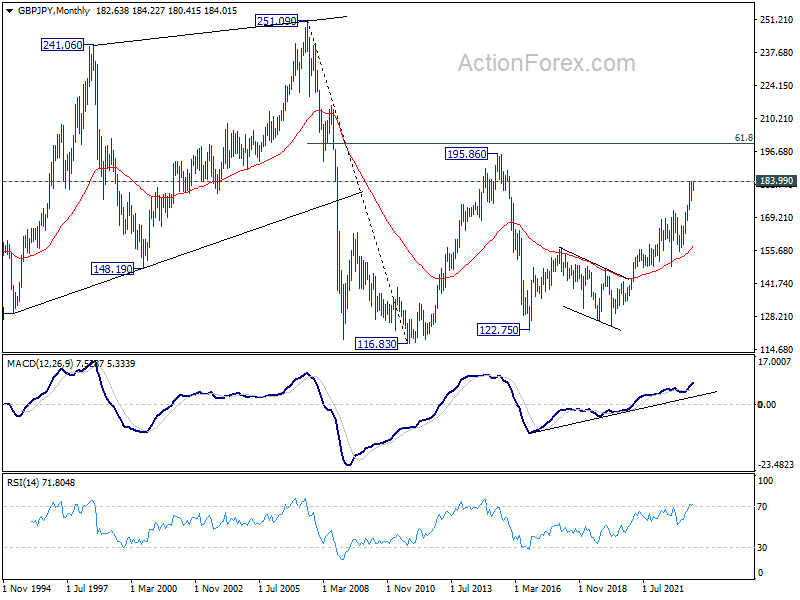
In the longer term picture, rise from 122.75 (2016 low) in still in progress to retest 195.86 (2015 high). Based on current momentum, break of 195.86 is in favor. But strong resistance could still be seen from 61.8% retracement of 251.09 (2007 high) to 116.83 (2011 low) at 199.80 to limit upside on first attempt.