
Dollar emerged notably resilient in a week of highly anticipated inflation data, clinching the top spot among currency performers. With the next FOMC meeting still more than a month away, the greenback’s trajectory now rests heavily on the prevailing market risk sentiment. Critical to this equation is the capability of major stock indexes to bounce back after a fortnight of retractions, coupled with the potential continuation of the recent surge in treasury yields.
Diverging paths were evident as Yen grappled with its persistent near-term decline, wrapping up the week at the bottom of the performance ladder. Yet, it’s the brewing storm in commodity currencies that’s capturing significant attention. Directly tying to this is the turbulence in Chinese markets. Escalating investor concerns around real estate crises, looming deflation, and the dive in trade have cast shadows over the financial landscape. This anxiety is palpably evident in the sharp declines witnessed in Chinese stocks and Yuan, with ripples also touching Aussie and Copper markets.
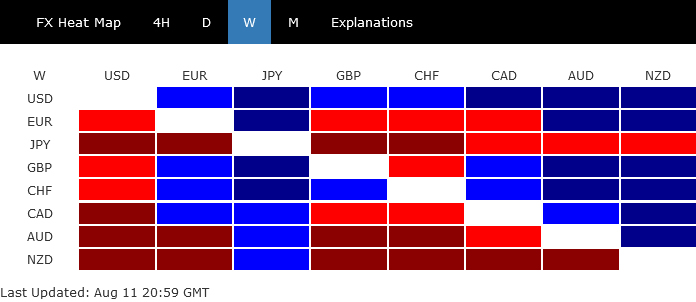
In Europe, major currencies presented a mixed bag. While Euro closed slightly weaker when juxtaposed against Sterling and Swiss Franc, they largely danced within their familiar terrains, with traders keeping an eagle eye out for potential breakouts.
Dollar survived inflation data, with help from NASDAQ and 10-year yield
For the first time this year, NASDAQ has recorded back-to-back weekly declines, drawing significant attention from investors. While S&P 500 also ticked down, DOW managed to close with marginal gains within its recent range. Contrary to some assumptions, the inflation metrics, with CPI and PPI largely in line with expectations, may not be the chief culprits behind the market movements. It seems the major indices just digesting recent gains, potentially with investors recalibrating their positions ahead of the crucial FOMC meeting come September.
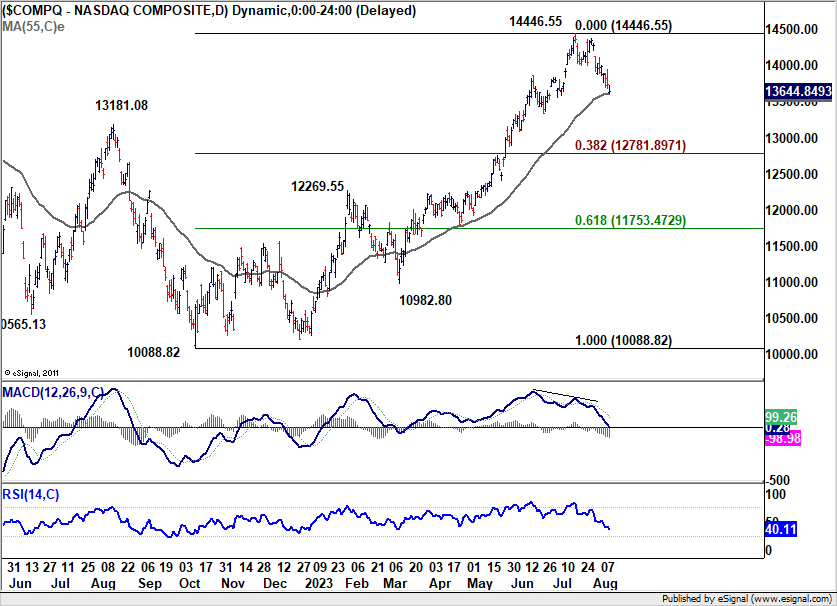
Technically, however, NASDAQ is now pressing 55 D EMA (now at 13606.77). Strong rebound from around current level will keep the price actions from 14446.55 as a near term correction only. Break of last week’s high at 13997.15 should push NASDAQ for a new high above 14446.55 before forming a medium term top.
However, sustained break of 55 D EMA will argue that it’s at least in correction to the whole up trend from 10088.82. In this case, deeper fall would seen to 38.2% retracement of 10088.82 to 14446.55 at 12781.89 before forming a bottom.
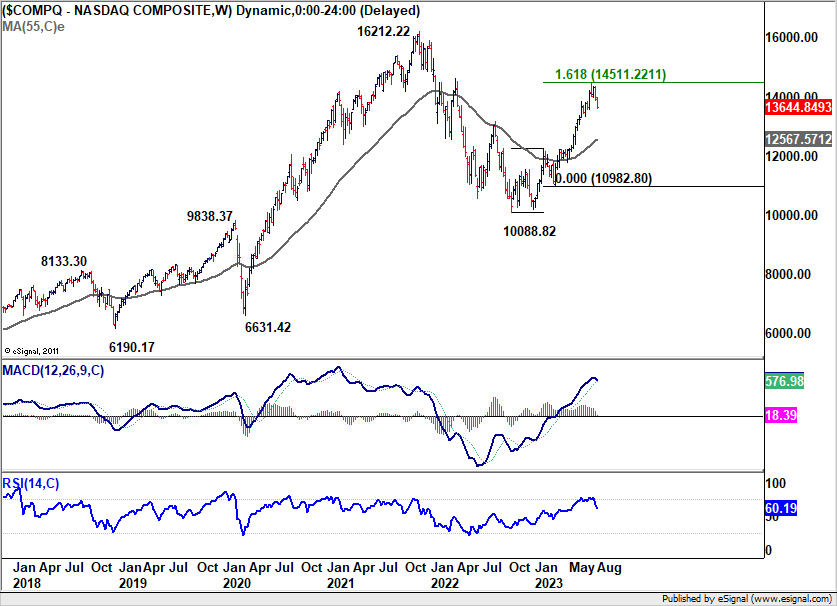
Meanwhile, it should also be noted that rise from 10088.82 could be just the second leg of the whole pattern from 16212.22 (2021 high). It’s premature to conclude but this rise could have completed with three waves up, after just missing target of 161.8% projection 10088.82 to 12269.55 from 10982.80 at 14511.22 by an inch. It’s plausible that a bearish reversal is already underway. But of course, NASDAQ will have to sustain below 55 D EMA first, before we dig deeper into this scenario.
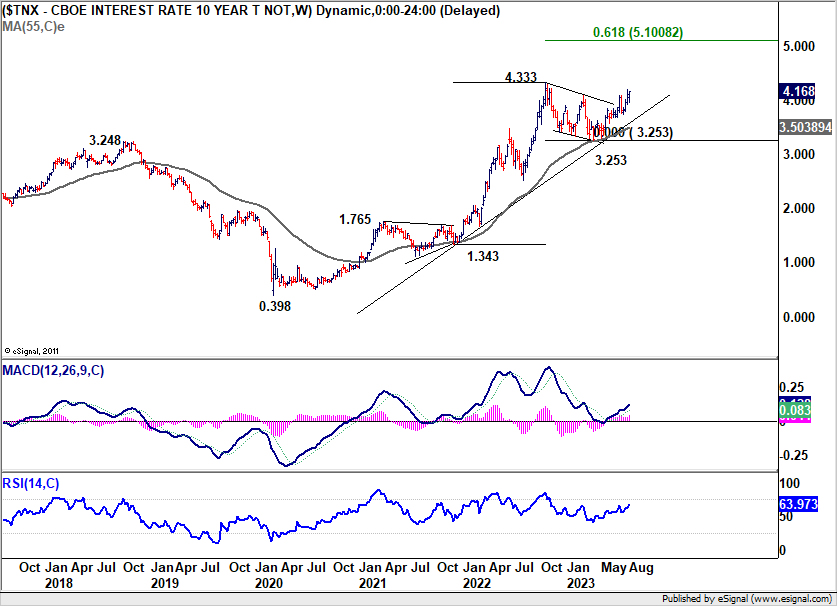
As for 10-year yield, despite some intra-week jitters, the development is largely as expected. Rise from 3.253 remains in good shape even though there is notable pick up in upside momentum. Further rally would be expected as long as 55 D EMA (now at 3.869) holds, to retest 4.333 high.
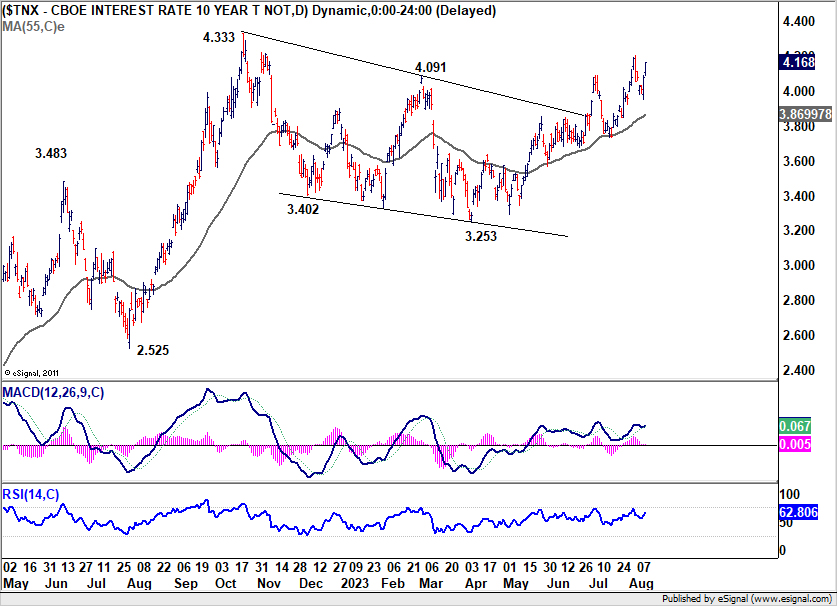
The question remains on whether current rally in TNX is resuming larger up trend from 0.398 (2020 low). If that’s the case, firm break of 4.333 would set the stage for TNX to head through 5% handle towards 61.8% projection of 1.343 to 4.333 from 3.253 at 5.100.
While Dollar dipped initially following US CPI release, it showed commendable resilience and quickly recovered. Dollar Index has indeed closed the week slightly higher, defended 55 D EMA (now at 102.17) and made a little progress in extending the rebound from 99.57 low.
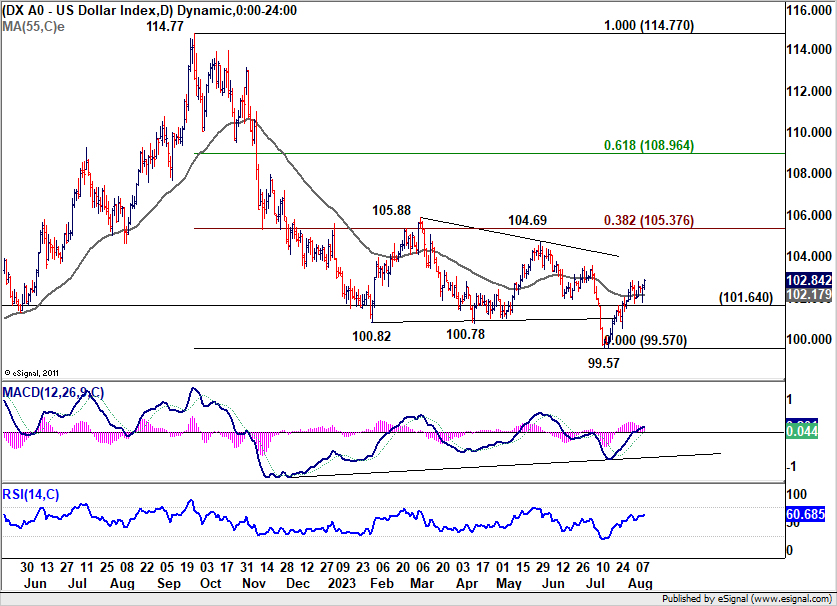
For now, further rally in DXY is expected as long as 101.64 support holds. Rise from 99.57 (which is seen as a medium term bottom) should target 38.2% retracement of 114.77 to 99.57 at 105.37. For this move to happen, ideally, there should be extended fall in stocks and rally in 10-year yield as mentioned above.
As for the rally to be reversing the trend from 114.77, rather than correcting it, there needs to be substantial decline in stocks, like NASDAQ breaking through 12781.89 fibonacci support, or has 10-year yield breaking through 4.333 high decisively at least.

Real estate crisis, deflation, trade downturn in China
In a tumultuous week, Chinese markets witnessed severe declines, spurred by growing anxieties over another looming real estate crisis and heightened fears of deflation and trade downturns.
US President Joe Biden’s characterization of China as a “ticking time bomb” intensified speculations. Though the validity of his comments on China’s internal economic and societal issues can be debated, the apprehensive investor sentiment is undeniable.
Amplifying these concerns was the disclosure that Country Garden, a leading Chinese private-sector developer, defaulted on interest payments for two of its Dollar-denominated bonds. Subsequently, the firm projected a loss of between CNY 45B to CNY 55B for the first half of the year.
The scale of Country Garden’s debt has drawn inevitable comparisons to Evergrande, previously known as the world’s most indebted property company. Analysts suggest that the repercussions of a Country Garden crisis might overshadow the impact of Evergrande’s previous downfall.
Adding to the economic unease, China’s new loans in July plummeted by a staggering 89% mom, hitting their lowest since 2009, and falling well below anticipated levels. With China’s July CPI dropping by 0.3% year-on-year, steepest drop since February 2020, and significant contractions in both exports and imports, the economic outlook appears increasingly bleak.
Reflecting the overarching investor sentiment, Shanghai SSE tumbled sharply on Friday to close at 3189.24 on Friday. Current development suggests that recovery from 3144.24 has completed at 3322.12 already. Deeper fall is now in favor as long as 55 D EMA (now at 3237.84) holds.
Firm break of 3144.24 will affirm the case that whole rise from 2885.08 has completed, just ahead of 3424.83 medium term resistance. In this case, next target would be 100% projection of 3418.95 to 3144.24 from 3322.12 at 3047.41.
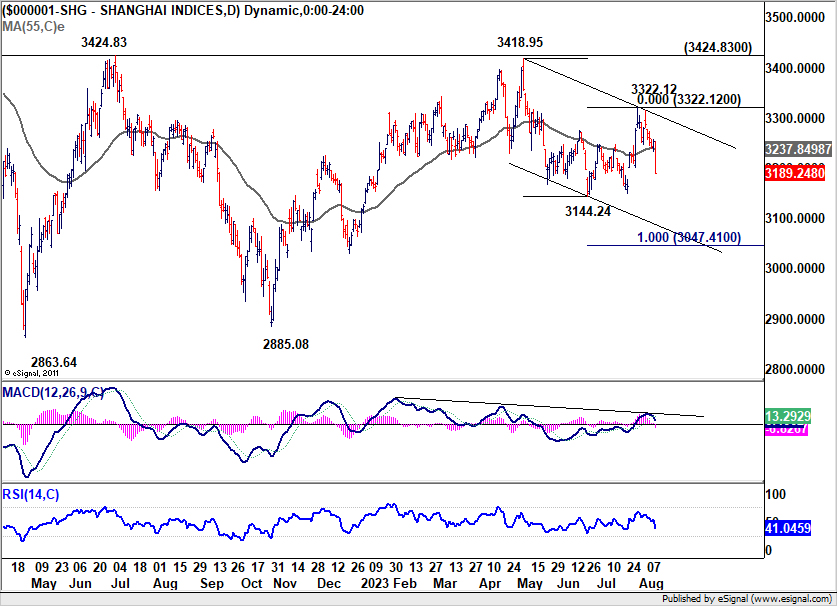
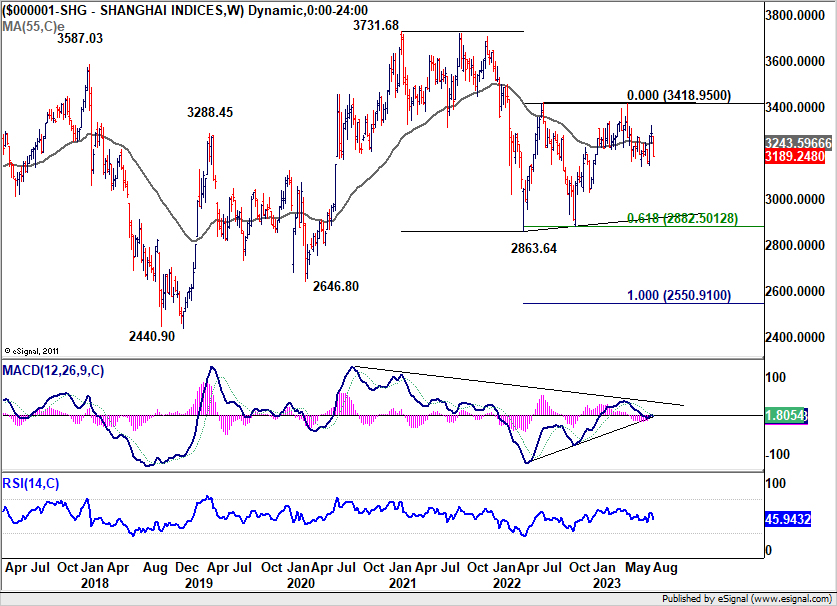
The more important question is whether SSE is already trying to resume the down trend from 3731.68 (2021 high). The structure of the fall from 3418.95 doesn’t warrant this bearish scenario yet. But the chance could be raised if there is significant downside acceleration after breaking through 3144.24 support.
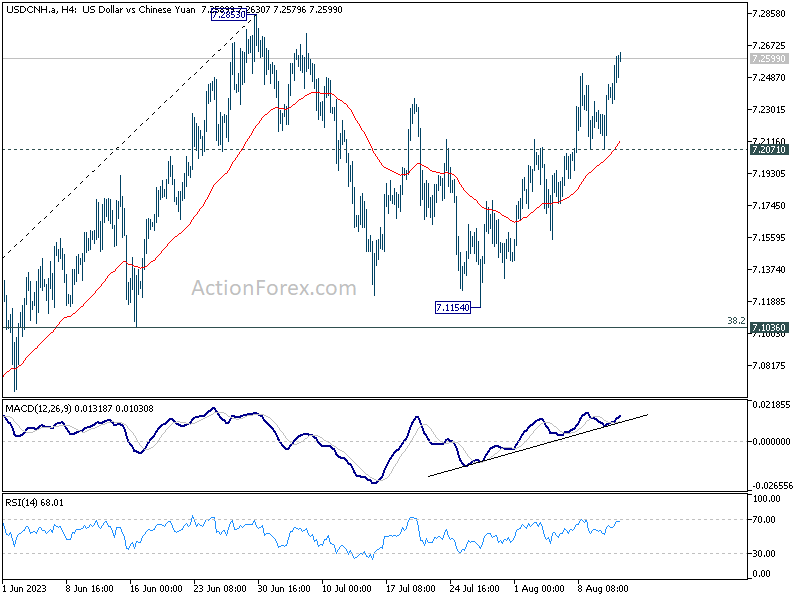
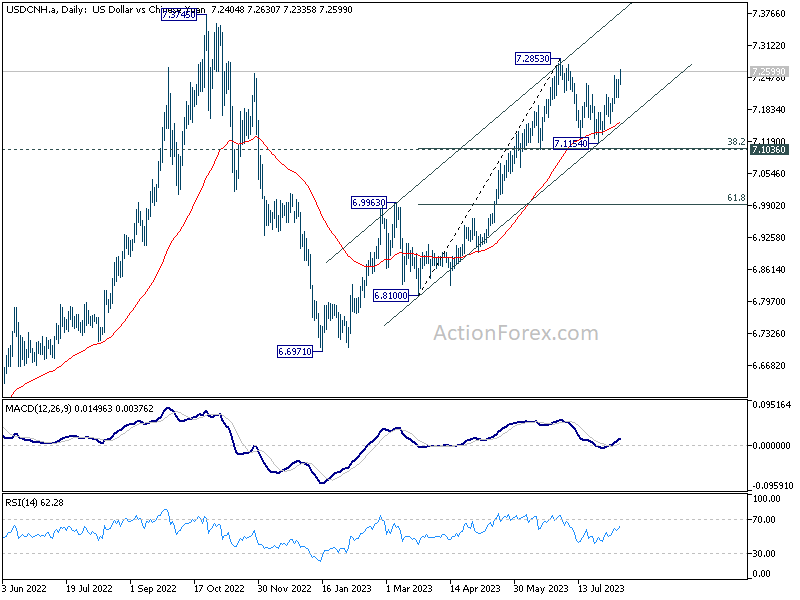
USD/CNH resumed the rally from 7.1154 as offshore Yuan was under pressure. Further rise is now expected in the pair as long as 7.2071 support holds, for retesting 7.2853 high. The strong support from 55 D EMA argues that whole up trend from 6.6971 is possibly ready to resume too. Break of 7.2853 will confirm this bullish case, and target 7.3745 (2022 high). But as it’s always, the move would depend on when the Chinese authority would come in and intervene.
Aussie and Copper looking vulnerable
Australian Dollar ended as one of the worst performers last week, just next to Yen and New Zealand Dollar. Considering the overall development surrounding China, Aussie was indeed rather resilient already. Yet, current development argues that fall from 0.7156 is ready to resume through 0.6457 low.
In any case, outlook will now stay bearish as long as 0.6615 resistance holds. Firm break of 0.6457 will confirm this bearish case and target 100% projection of 0.7156 to 0.6457 from 0.6894 at 0.6195.
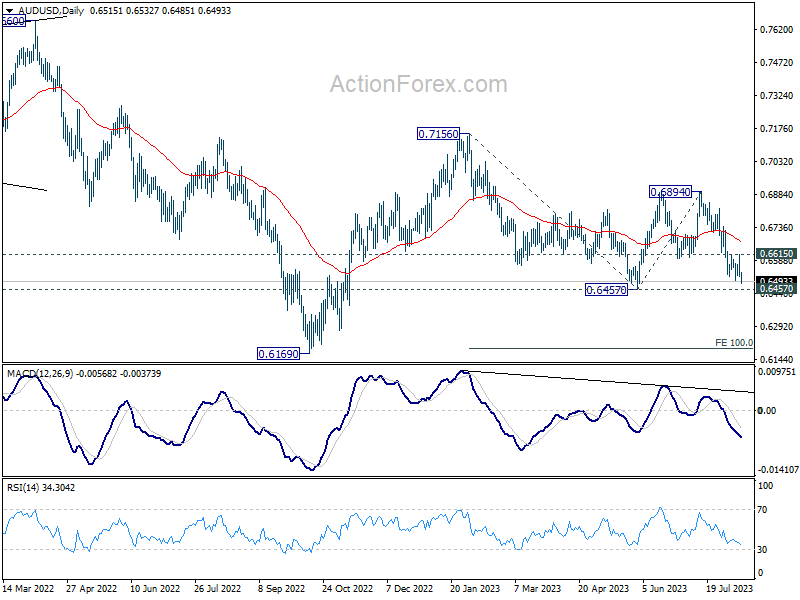
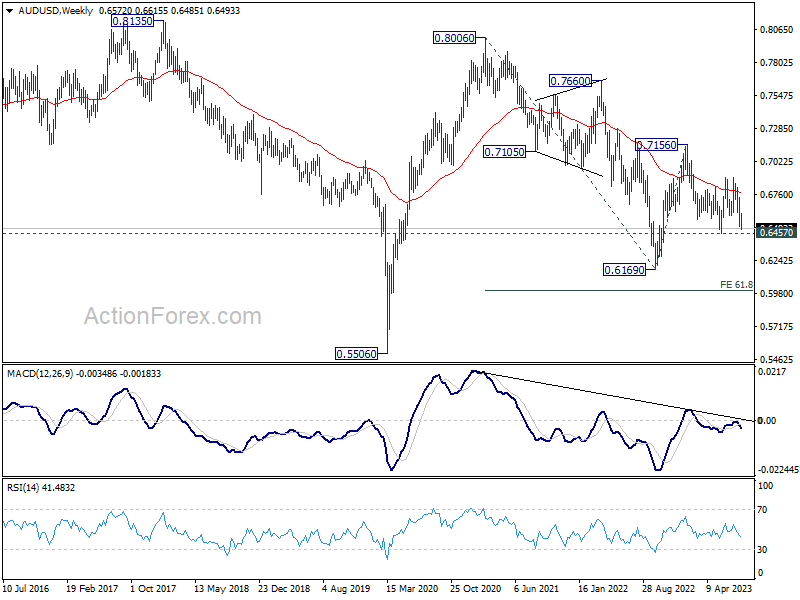
Any downside acceleration on breaking through 0.6457 would raise the chance of resumption of whole down trend from 0.8006 (2021 high). In this bearish scenario, AUD/USD might only be able to find a bottom after hitting 61.8% projection of 0.8006 to 0.6169 from 0.7156 at 0.6021.
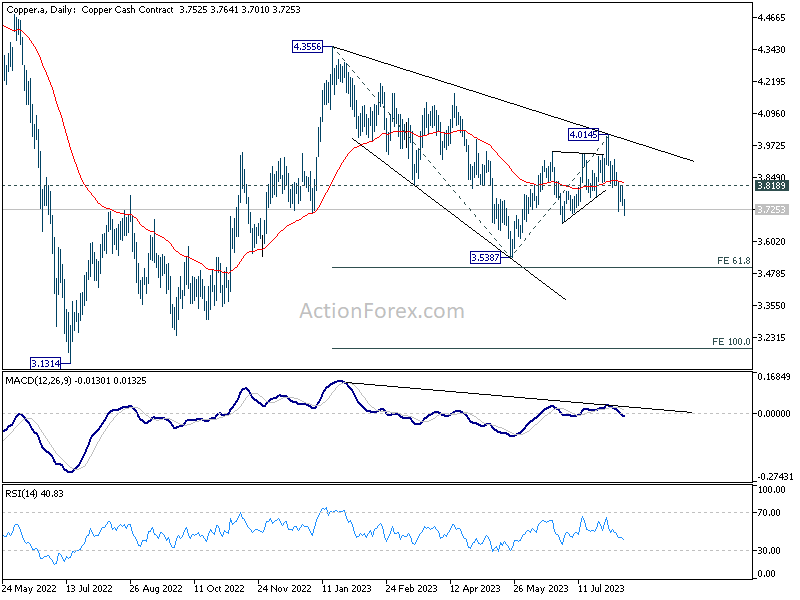
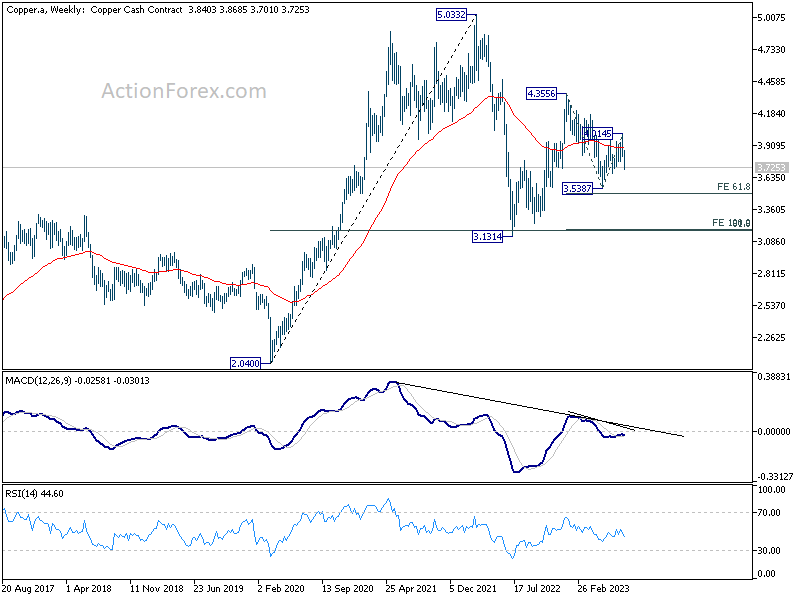
Aussie’s fate remains tightly intertwined with Copper prices, further influenced by Chinese market dynamics. Last week’s fall further affirm the case that recovery from 3.5387 has completed at 4.0145. Deeper decline is expected as long as 3.8189 resistance holds, for 3.5387, and possibly further to 61.8% projection of 4.3556 to 3.5387 from 4.0145 at 3.5097. Sustained break there could prompt downside acceleration to 100% projection at 3.1976, pulling Aussie down in its wake.
USD/CAD Weekly Outlook
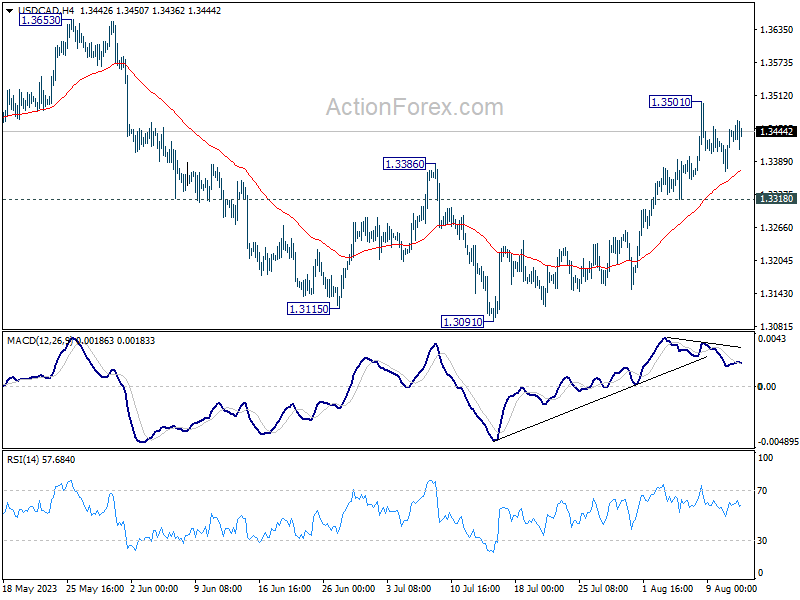
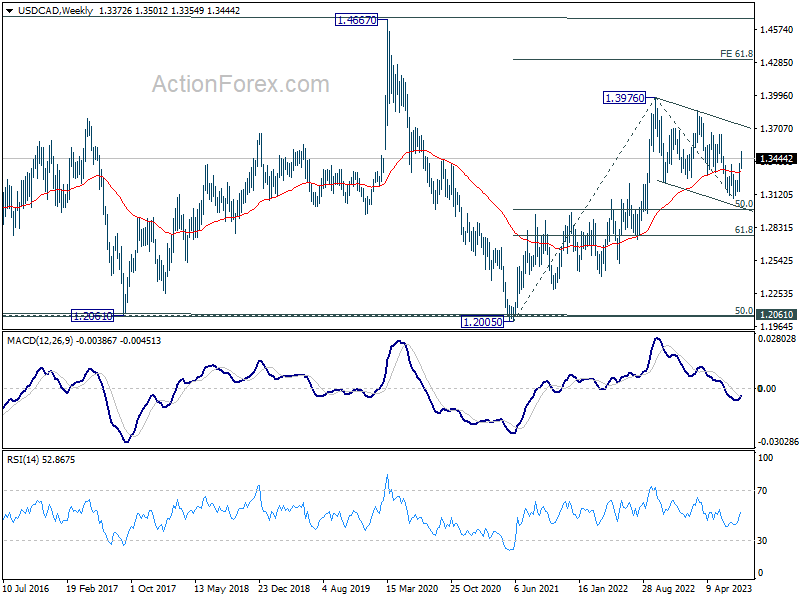
USD/CAD’s rebound from 1.3091 extended higher last week and it’s now pressing 1.3386 resistance. Sustained break of 1.3386 will argue that whole correction from 1.3976 has completed with three waves down to 1.3091. Further rally would then be seen to 1.3653 resistance next. Nevertheless, rejection by 1.3386, followed by break of 1.3260 minor support, should resume larger decline through 1.3091 low.
In the bigger picture, price actions from 1.3976 are viewed as a corrective fall only. Upon completion, rise from 1.2005 (2021 low) would resume through 1.3976 towards 1.4667/89 long term resistance zone. In case of another fall, downside should be contained by 61.8% retracement of 1.2005 to 1.3976 at 1.2758.
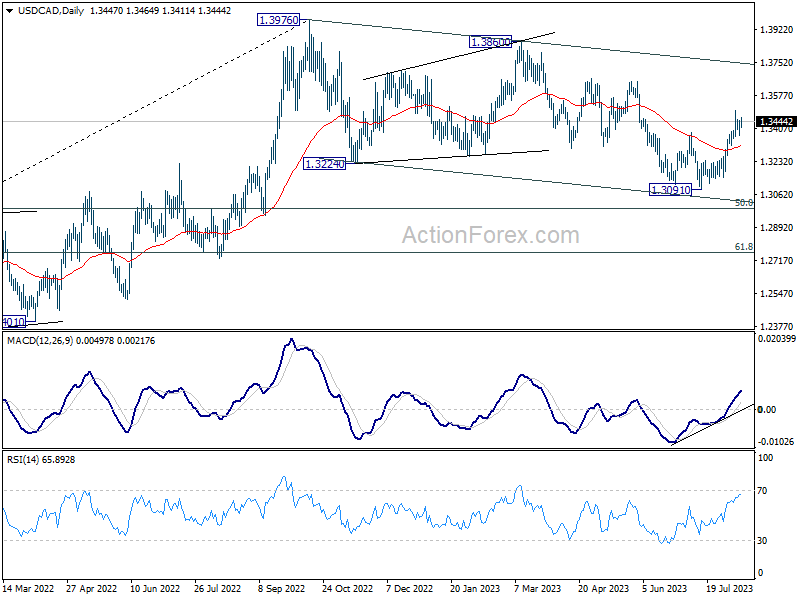
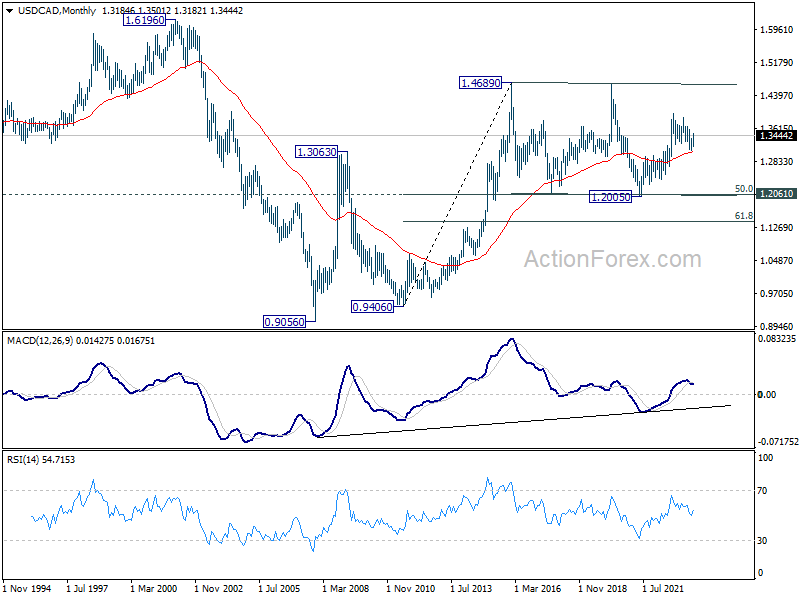
In the longer term picture, price actions from 1.4689 (2016 high) are seen as a consolidation pattern only, which might have completed at 1.2005. That is, up trend from 0.9506 (2007 low) is expected to resume at a later stage. This will remain the favored case as 55 M EMA (now at 1.3057) holds.


