

Sample Category Title
Hawkish Fed Speak Boosts Dollar Across All the Board
- Fed’s Bowman reiterates that more hikes might be need to bring down inflation
- German Industrial Production fell to a 6-month low
- US inflation data expected to support a September pause, but possible coin flip for the November meeting
The US dollar is stronger across the board as the bond market selloff returns, sending the 10-year Treasury yield 6.9 basis points higher to 4.103%. After a mixed jobs report (slower job growth pace but higher wages) this week is all about an inflation report that will probably show moderate price growth. The focus for many traders is all about the end of tightening and this weekend’s Fed speak supported the higher for longer stance. Fed’s Bowman noted that it will likely need to raise interest rates further to bring down inflation. A New York Times article this morning reported that Fed’s Williams stated that the central bank’s work to cool the economy is almost done and that he expects rate cuts could happen next year.
Heading into Thursday’s US inflation report, expectations are for headline CPI to rise from 3.0% to 3.3%, mainly due to base effects, but snapping a long streak of declines that has been in place since last August. Fixed income markets are growing confident that the September FOMC will support a rate pause. The core readings are also expected to hold steady, but any hot surprises could keep the pressure on for a November hike.
At the end of last week, the euro saw some volatility after the Bundesbank said domestic government deposits would not receive any interest, sparking a move into bills and other high-yielding markets. This decision surprised many traders and could lead to significant outflows for German debt. Today’s disappointing German industrial production data also sent the euro lower as recession risks continue to rise. Output continues to drop, falling to a 6-month low.
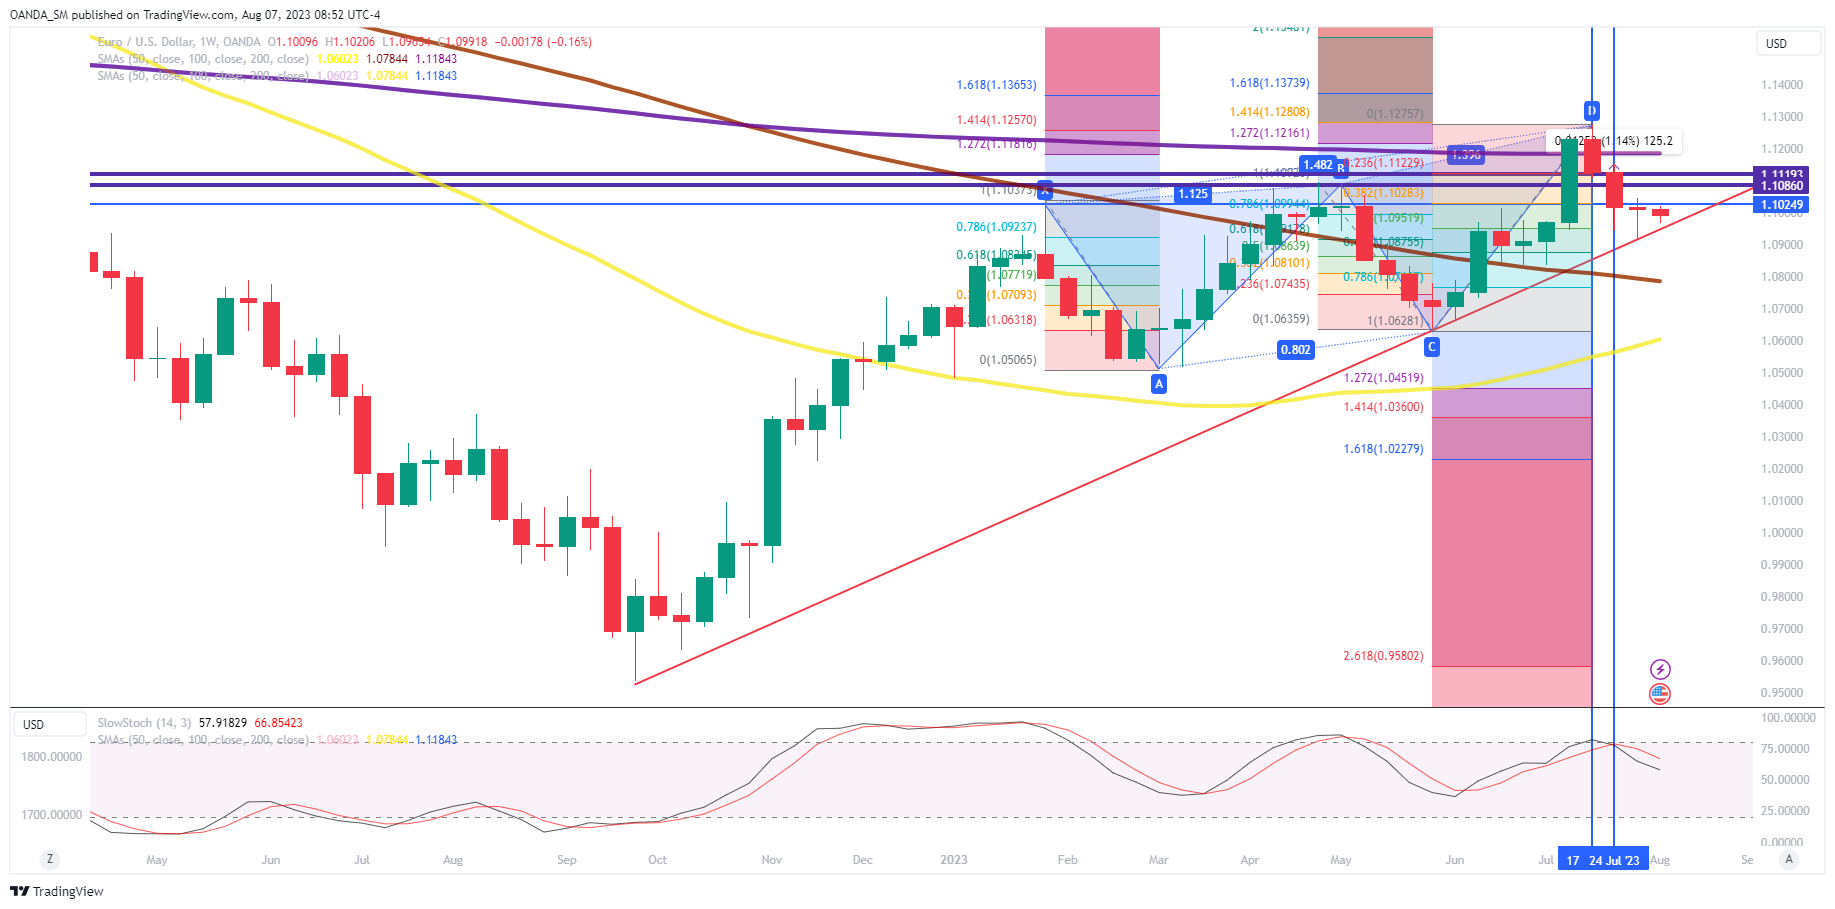
The weekly EURUSD chart shows price is approaching key trendline support at 1.0930. If downward momentum accelerates, downside targets include the 1.0850 region followed by 1.07667 level. To the upside the 1.1050 provides initial resistance followed by the 1.1135 level.
Stocks
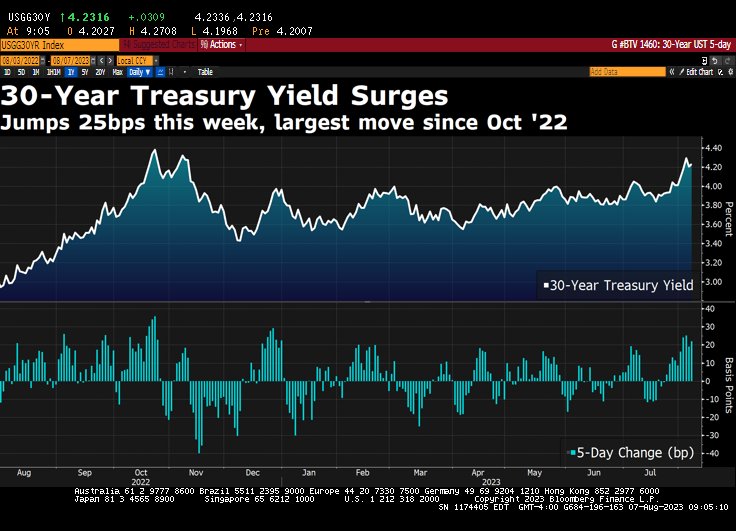
US stocks are slightly higher following Friday’s selloff as Wall Street embraces a very solid earnings season, but the harsh reality that the US economy is still recession bound. As we get the last batch of earnings, so far 84% of the companies in the S&P 500 have provided results, around 80% have delivered topped market expectations. Stocks are also surging alongside Treasury yields, which might prove difficult to continue if last week’s Treasury yield high is surpassed.
EURUSD Muted Bearish Pressure in Place
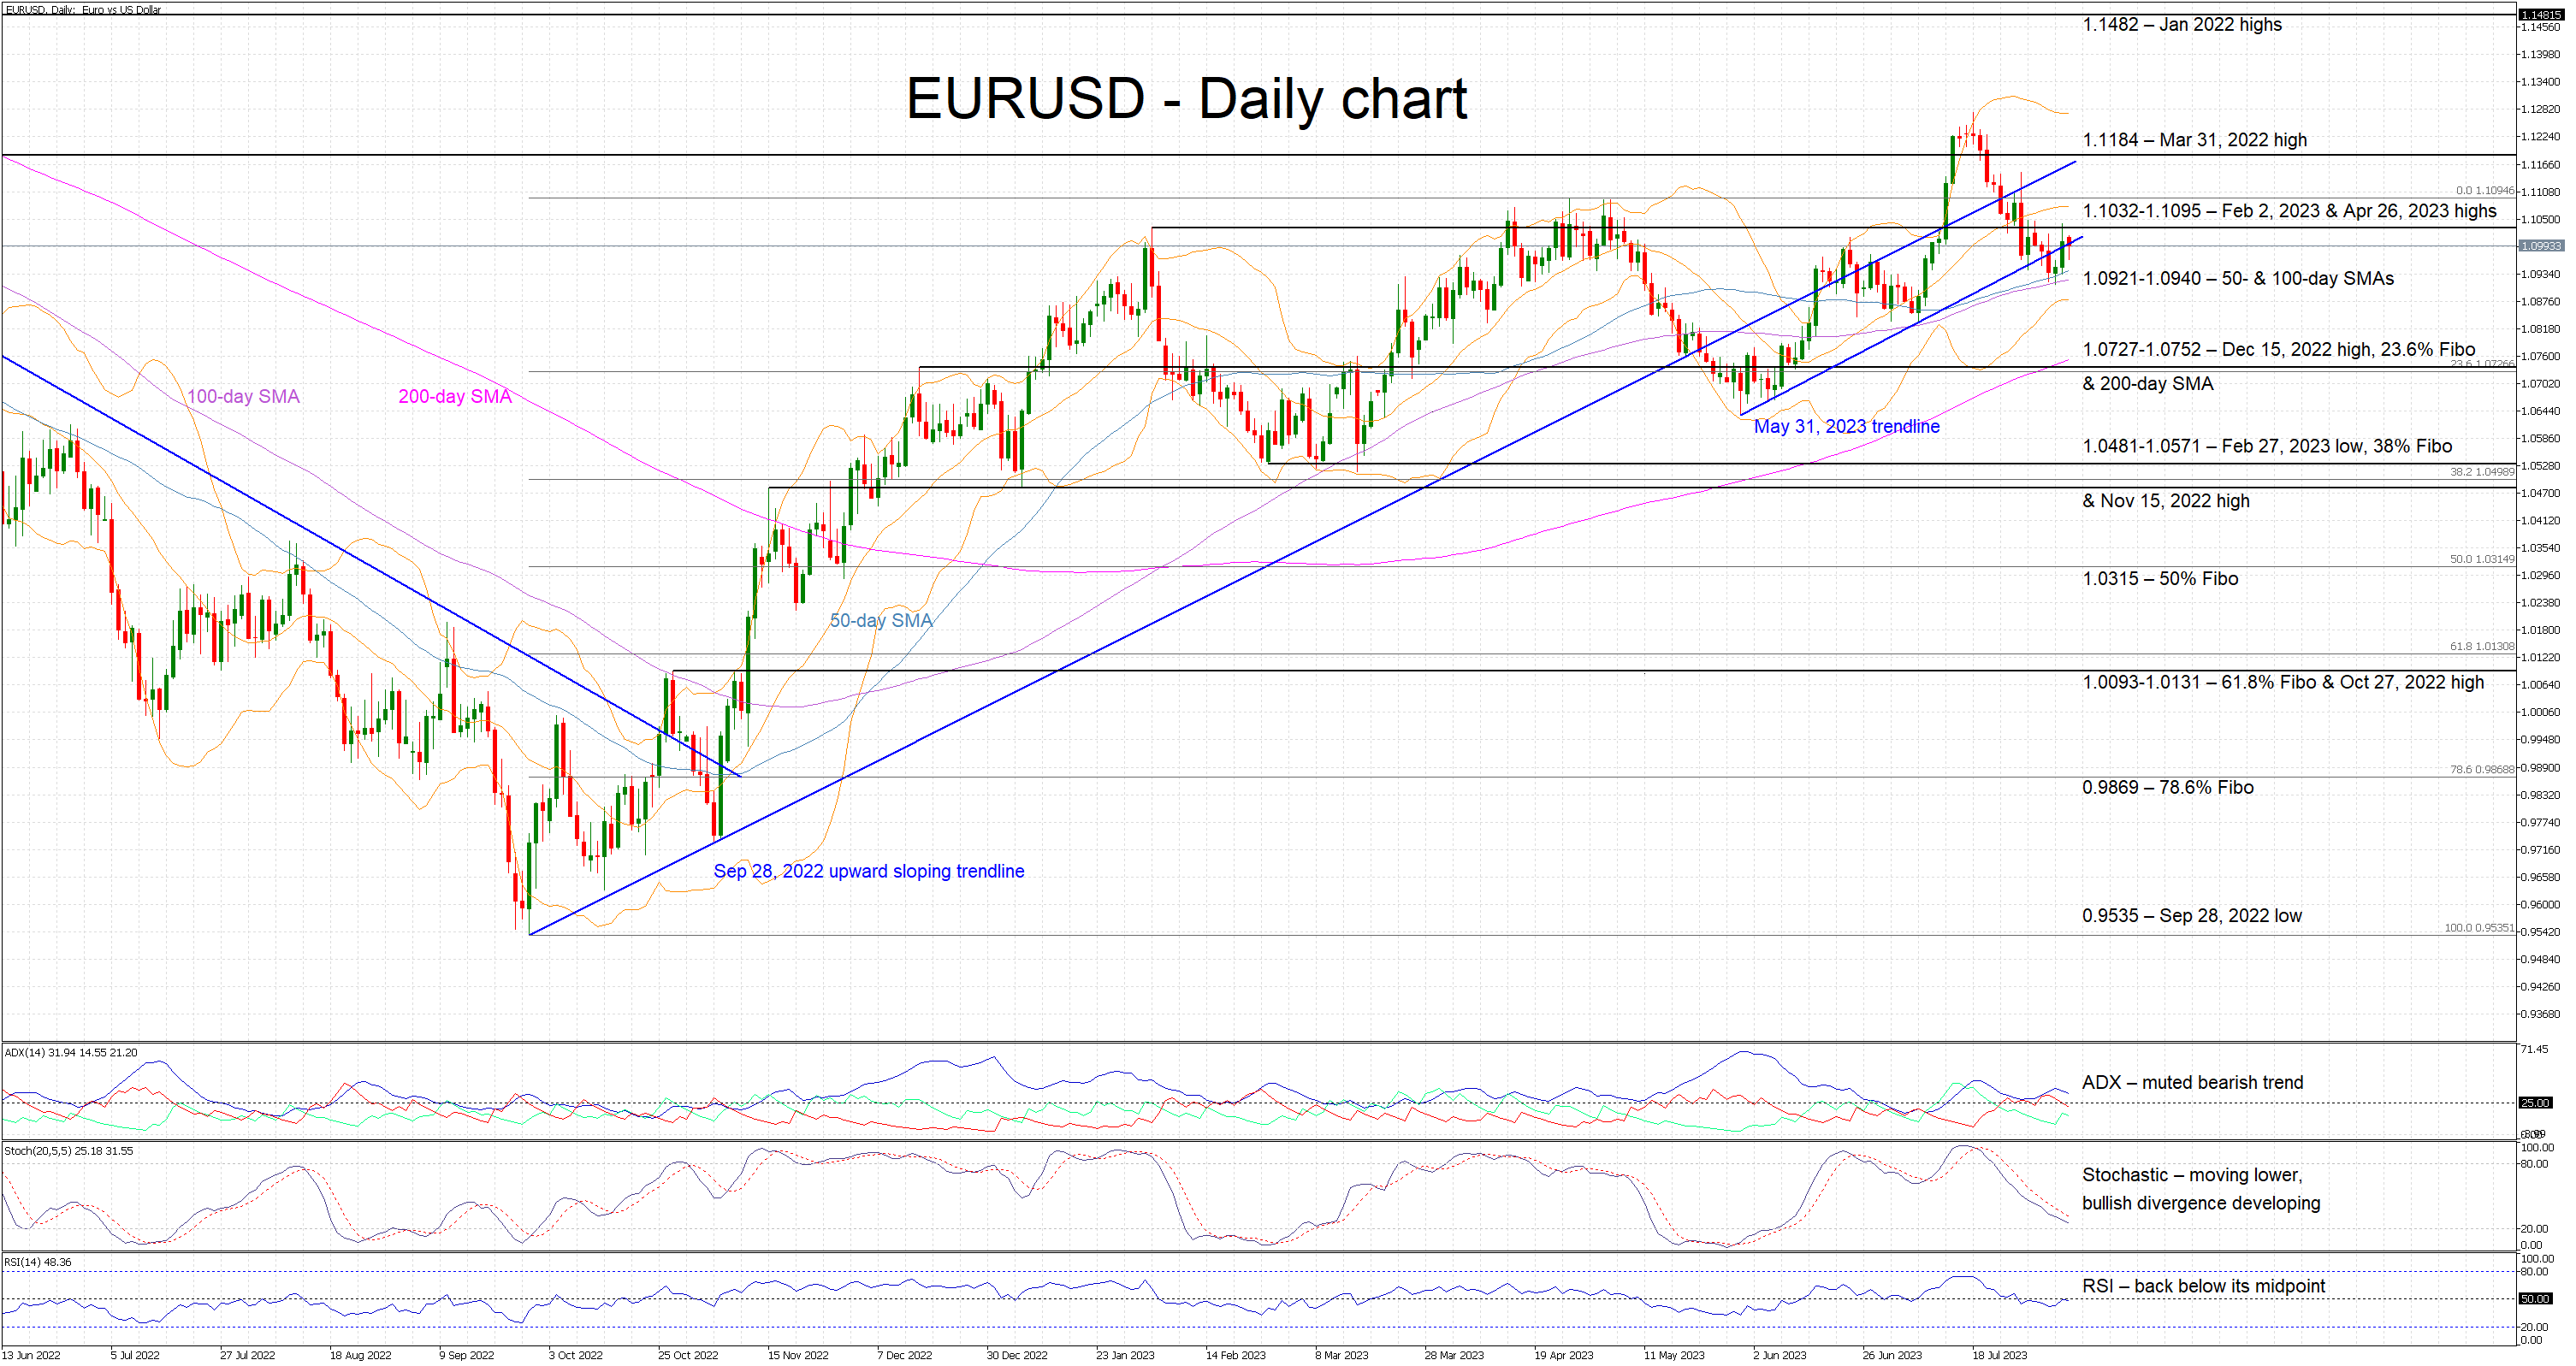
EURUSD is edging lower today as it appears to be affected by the summer lull. The pair is actually hovering a tad above the 1.0921-1.0940 area and currently battling with the May 31, 2023 upward sloping trendline. In the meantime, the continued convergence of the 50- and 100-day simple moving averages (SMAs) has yet to play a role.
Amidst this environment, most momentum indicators confirm the presence of bearish pressure. The Average Directional Movement Index (ADX) is slightly above its 25-threshold and thus pointing to a muted bearish trend in the market, and the RSI is again trading below its midpoint. More interestingly, the stochastic oscillator is moving lower and has built a good gap from its moving average. However, the current lower low in the stochastic has been met by a higher low in EURUSD and thus is pointing to a developing bullish divergence.
Should the bears attempt to stage a pullback, they would try to overcome the support set by the 50- and 100-day (SMAs) at the 1.0921-1.0940 range. They could then have a look at the busier 1.0727-1.0752 area that is populated by the December 15, 2022 high, the 200-day SMA and the 23.6% Fibonacci retracement of the September 28, 2022 – April 26, 2023 uptrend respectively.
On the flip side, if the bulls try to take advantage of the stochastics’ developing divergence, they could aim for a move above the May 31, 2023 trendline and the busy 1.1032-1.1095 range, which is defined by the February 2, 2023 and April 26, 2023 highs respectively. They would then have a go at testing the resistance set by the September 28, 2022 upward sloping trendline, a tad below the March 31, 2022 high at 1.1184.
To conclude, calmer market conditions appear to favour EURUSD bears at this juncture with the bulls appearing determined to defend the busy 1.0921-1.0940 area.
EUR/USD Mid-Day Outlook
Daily Pivots: (S1) 1.0949; (P) 1.0995; (R1) 1.1056; More...
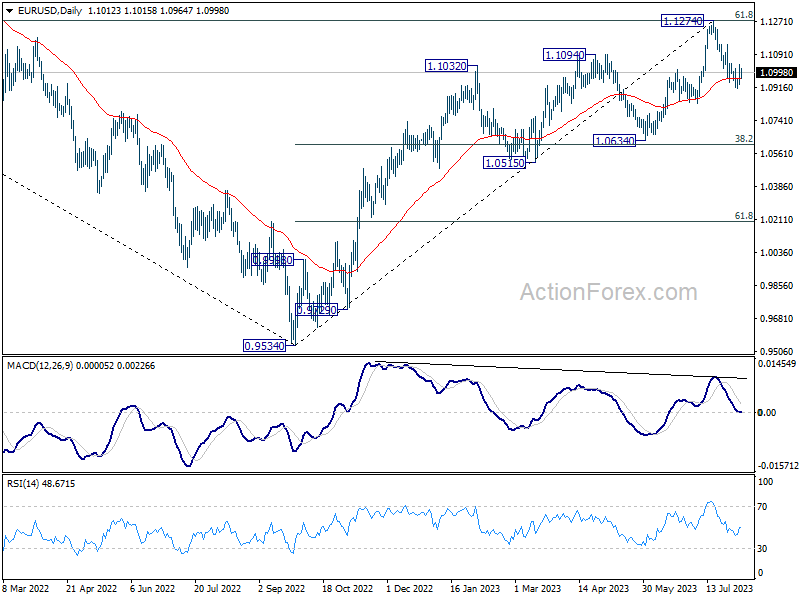
Range trading continues in EUR/USD and intraday bias stays neutral. On the downside, break of 1.0911 will resume the decline from 1.1274 to 1.0832 support. Sustained trading below there will target 1.0609/34 cluster support. However, firm break of 1.1046 minor resistance will argue that pull back from 1.1274 has completed, and bring stronger rebound.
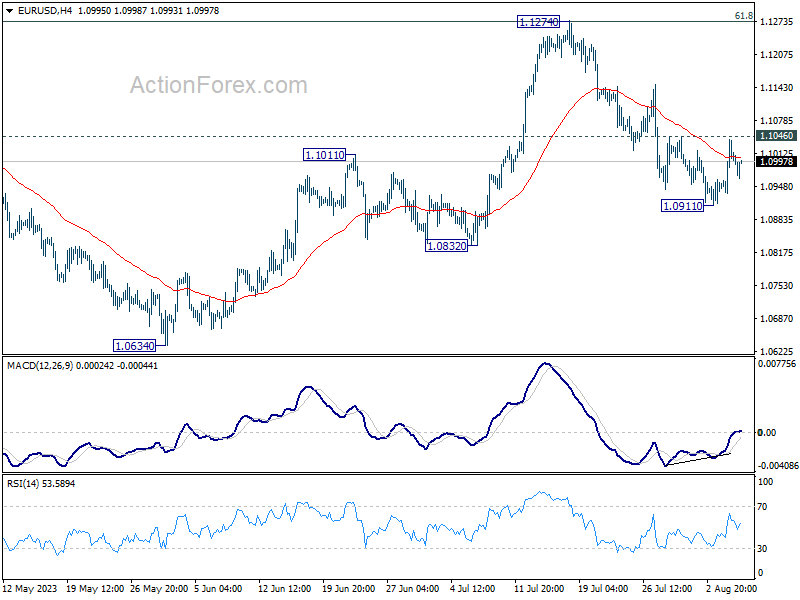
In the bigger picture, a medium term top could be formed at 1.1274, after failing to break through 61.8% retracement of 1.2348 (2021 high) to 0.9534 at 1.1273 decisively, on bearish divergence condition in D MACD. Sustained trading below 55 D EMA (now at 1.0966) will bring deeper correction to 1.0634 cluster support (38.2% retracement of 0.9534 to 1.1274 at 1.0609). Strong support could be seen there, at least on first attempt, to set the range for consolidation.
USD/CHF Mid-Day Outlook
Daily Pivots: (S1) 0.8692; (P) 0.8737; (R1) 0.8775; More....
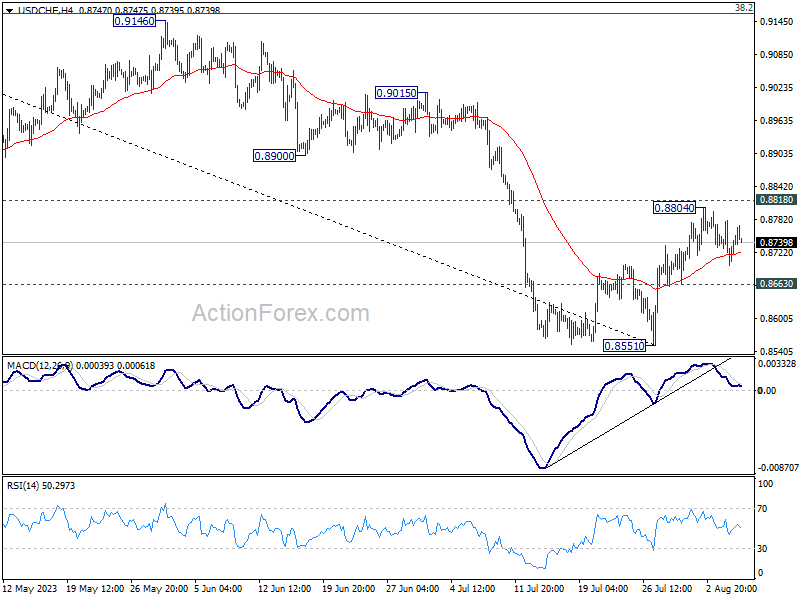
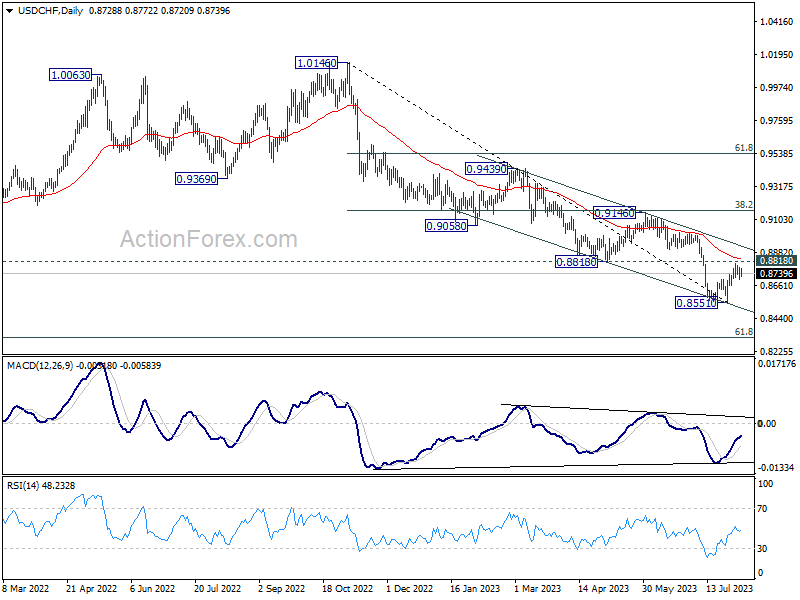
Range trading continues in USD/CHF and intraday bias stays neutral at this point. On the downside break of 0.8663 minor support should confirm rejection by 0.8818 and turn intraday bias back to the downside for retesting 0.8551 first. Nevertheless, decisive break of 0.8818 will carry larger bullish implication, and target 0.9146 cluster resistance next.
In the bigger picture, down trend from 1.0146 is seen as in progress as long as 0.8188 support turned resistance holds. Next target is 61.8% retracement of 0.7065 (2011 low) to 1.0342 (2016 high) at 0.8317. However, sustained break of 0.8818 should indicate medium term bottoming, and bring stronger rise back to 0.9146 cluster resistance (38.2% retracement of 1.0146 to 0.8551 at 0.9160), even as a correction.
USD/JPY Mid-Day Outlook
Daily Pivots: (S1) 141.26; (P) 142.07; (R1) 142.59; More...
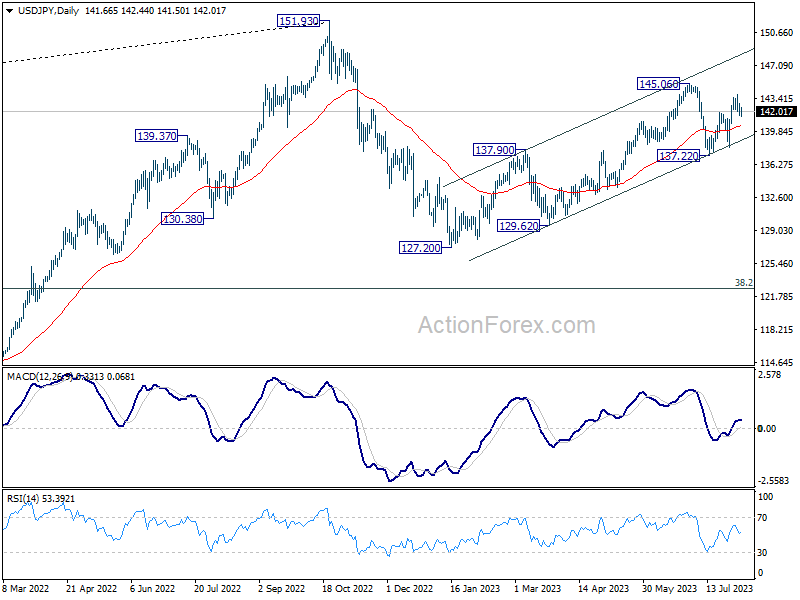
Intraday bias in USD/JPY stays mildly on the downside for the moment. Fall from 143.88 could be the third leg of the pattern from 145.06. Deeper fall would be seen to 55 D EMA (now at 140.50). On the upside, though, above 143.88 will resume the rise from 137.22 to retest 145.06 resistance instead.
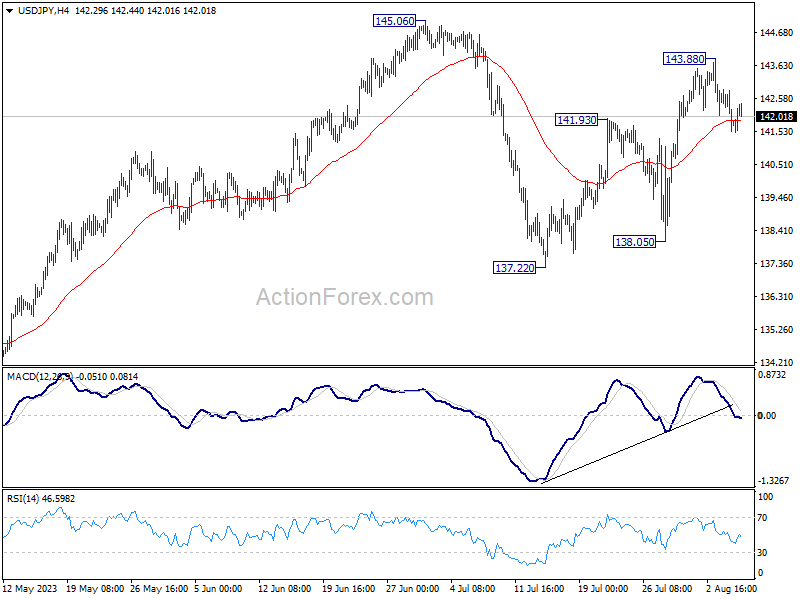
In the bigger picture, overall price actions from 151.93 (2022 high) are views as a corrective pattern. Rise from 127.20 is seen as the second leg of the pattern and could still be in progress. But even in case of extended rise, strong resistance should be seen from 151.93 to limit upside. Meanwhile, break of 137.22 support should confirm the start of the third leg to 127.20 (2023 low) and below.
Euro Shrugs Confidence Data, Quiet Markets with Eyes on Yen
Today's financial markets exhibited subdued activity, with few standout movements. Notably, even as Eurozone's investor confidence data outperformed expectations, Euro lagged, moving in tandem with Swiss Franc. On the other hand, Sterling is trading mildly higher, echoing the rise of commodity currencies, while Dollar is steady, devoid of fresh buying enthusiasm.
The spotlight shifts to Yen in the upcoming Asian session, as data on labor cash earnings and household spending take center stage. BoJ has consistently underscored the centrality of wage growth in securing a sustainable inflation target. Recent updates on wage negotiations appear promising. Strong data sets could further bolster BoJ's inclination to reconsider its ultra-accommodative monetary stance.
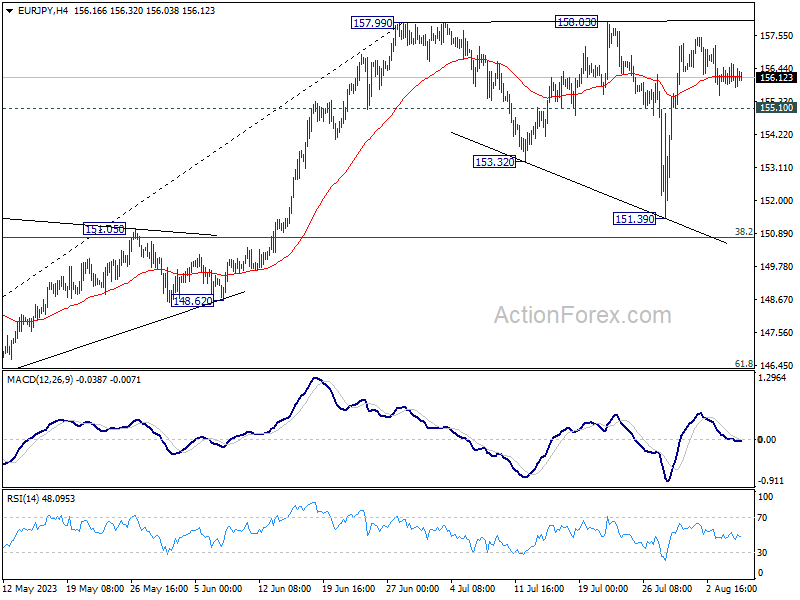
Despite railing to break through 157.99/158.03 resistance on first attempt, EUR/JPY has been relatively resilient. As long as 155.10 minor support holds, another take on the resistance is expected in the near term. Decisive break will confirm larger up trend resumption. However, break of 155.10 will align to outlook with other Yen crosses, and argue that the corrective pattern from 157.99 is extending with another downleg. Deeper fall could then be seen back towards 151.39 support.
In Europe, at the time of writing, FTSE is down -0.49%. DAX is down -0.34%. CAC is down -0.10%. Germany 10-year yield is up 0.0219 at 2.591. Earlier in Asia, Nikkei rose 0.19%. Hong Kong HSI dropped -0.01%. China Shanghai SSE dropped -0.59%. Singapore Strait Times rose 0.53%. Japan 10-year JGB yield dropped -0.018 to 0.628.
Fed Williams: It's an open question on additional rate hikes
In a candid interview with the New York Times, New York Fed President John Williams deemed the present monetary policy as being "in a good place". It's an "open question" on whether Fed needs additional rate hikes.
He emphasized the need to "watch the data". "Are we seeing the supply-demand imbalances continue to shrink, move in the right direction? Are we seeing the inflation data move in the right direction?"
He anticipates that the need for a restrictive monetary stance will persist for a while. He contemplates, "I think we're pretty close to what a peak rate would be, and the question will really be — once we have a good understanding of that, how long will we need to keep policy in a restrictive stance, and what does that mean."
Also, highlighting his approach towards monetary policy, Williams thought of monetary policy primarily in terms of "real interest rates", rather than "nominal rates" set by Fed. He stressed the potential consequences if inflation rates declined as projected by numerous forecasts: "if we don't cut interest rates at some point next year then real interest rates will go up, and up, and up. And that won't be consistent with our goals." Hence, "to keep maintaining a restrictive stance may very well involved cutting the federal funds rate next year, or year after".
Eurozone Sentix rose to -18.9, but no joy about this development
Eurozone Sentix Investor Confidence rose from -22.5 to -18.9 in August, much better than expectation of -25.0. Current Situation Index was unchanged at -20.5. Expectations Index rose from -24.5 to -17.3. Inflation theme barometer rose to -11, indicating a decline in inflationary pressure. Central bank policy barometer also rose to -13.
Nevertheless, Sentix noted, "Investors are thus by no means positive about economic developments, the expected rate of deterioration is merely easing. Thus, at the beginning of August 2023, the economy in the euro zone remains in recession mode. There can therefore be no joy about this development."
In Germany, Sentix Investor Confidence fell from -28.4 to -30.4, lowest since October 2022. Current Situation Index dropped from -28.0 to -35.3. worst since July 2020. Expectations index rose slightly from -28.8 to -26.0.
BoJ opinions: Flexible YCC needed while maintaining monetary easing
In the Summary of Opinions at the July 27-28 meeting, BoJ reinforced its commitment to monetary easing but highlighted a pressing need for more "flexibility" in its yield curve control approach policy.
The bank's primary stance was evident among board members: Achieving a 2% price stability target "has not yet come in sight", necessitating continued monetary easing and the preservation of the current YCC framework.
"There is still a significantly long way to go before revising the negative interest rate policy, and the framework of yield curve control needs to be maintained," one member noted.
However, there will be potential market disruptions by strictly capping 10-year JGB yields at 0.5%, another opinion noted.
Also, given the "increasingly significant upside and downside risks" to prices outlook, flexible YCC is needed for allowing market-driven interest rates, ensuring liquidity, and preventing abrupt rate shifts.
The bank also remarked on the current inflation trends, suggesting they primarily stem from import inflation. A rise in earning power, especially for small and medium-sized firms, was emphasized as crucial before instituting broader YCC flexibility.
At the meeting, BoJ permitted a rise in the 10-year yield beyond its usual 0.5% limit, reaching up to 1%.
USD/JPY Mid-Day Outlook
Daily Pivots: (S1) 141.26; (P) 142.07; (R1) 142.59; More...
Intraday bias in USD/JPY stays mildly on the downside for the moment. Fall from 143.88 could be the third leg of the pattern from 145.06. Deeper fall would be seen to 55 D EMA (now at 140.50). On the upside, though, above 143.88 will resume the rise from 137.22 to retest 145.06 resistance instead.
In the bigger picture, overall price actions from 151.93 (2022 high) are views as a corrective pattern. Rise from 127.20 is seen as the second leg of the pattern and could still be in progress. But even in case of extended rise, strong resistance should be seen from 151.93 to limit upside. Meanwhile, break of 137.22 support should confirm the start of the third leg to 127.20 (2023 low) and below.
Economic Indicators Update
| GMT | Ccy | Events | Actual | Forecast | Previous | Revised |
|---|---|---|---|---|---|---|
| 23:50 | JPY | BoJ Summary of Opinions | ||||
| 05:00 | JPY | Leading Economic Index Jun P | 108.9 | 108.9 | 109.2 | |
| 06:00 | EUR | Germany Industrial Production M/M Jun | -1.50% | -0.40% | -0.20% | -0.10% |
| 07:00 | CHF | Foreign Currency Reserves (CHF) Jul | 698B | 725B | ||
| 08:30 | EUR | Eurozone Sentix Investor Confidence Aug | -18.9 | -25 | -22.5 |
GBP/USD Mid-Day Outlook
Daily Pivots: (S1) 1.2695; (P) 1.2743; (R1) 1.2797; More...
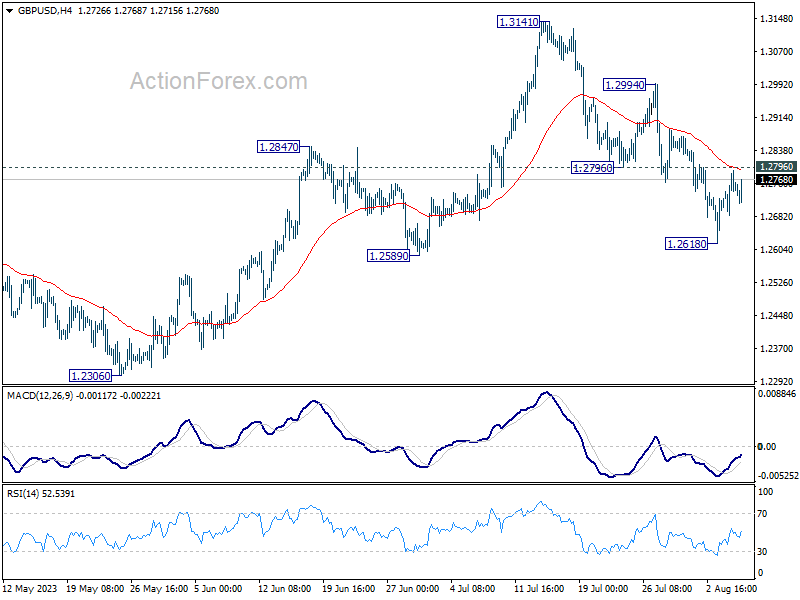
Intraday bias in GBP/USD stays neutral as range trading continues above 1.2618. On the downside, below 1.2618, and sustained trading below 1.2678 resistance turned support will argue that it's already in a larger correction. Deeper decline would then be seen to 1.2306 support next. Nevertheless, firm break of 1.2796 will indicate that the pull back has completed, and turn bias back to the upside for stronger rebound.
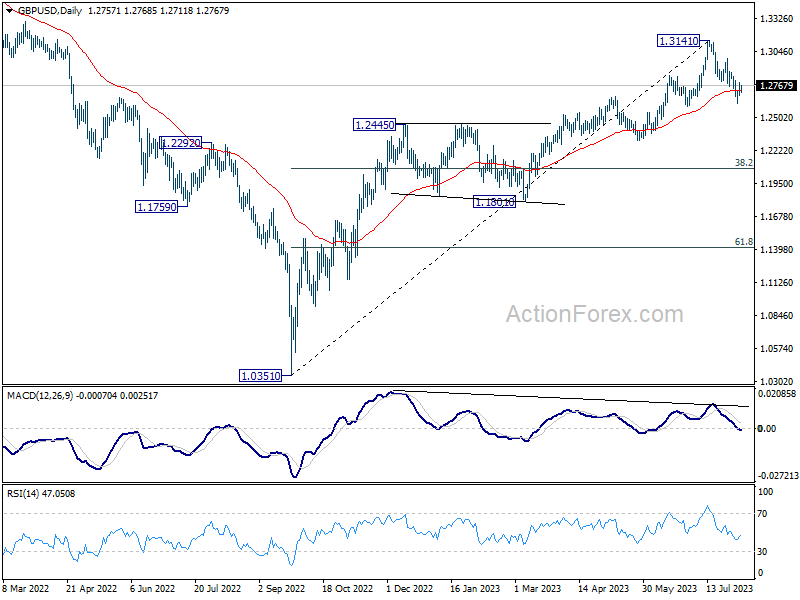
In the bigger picture, a medium term top could be in place at 1.3141 already, on bearish divergence condition in D MACD. Sustained trading below 55 D EMA (now at 1.2726) should confirm this case, and bring deeper fall to 38.2% retracement of 1.0351 to 1.3141 at 1.2075, as a correction to up trend from 1.0351 (2022 low). For now, rise will stay mildly on the downside as long as 1.3141 resistance holds, in case of strong rebound.
Dollar Index (DXY) Elliott Wave Zig Zag Pattern Forecasting The Path
Hello fellow traders. In this technical blog we’re going to take a quick look at the Elliott Wave charts of Dollar Index. As our members know, DXY has recently given us correction against the 104.72 peak. Recovery formed Elliott Wave Wave Zig Zag Pattern. In the further text we are going to explain the Elliott Wave Pattern and the Forecast.
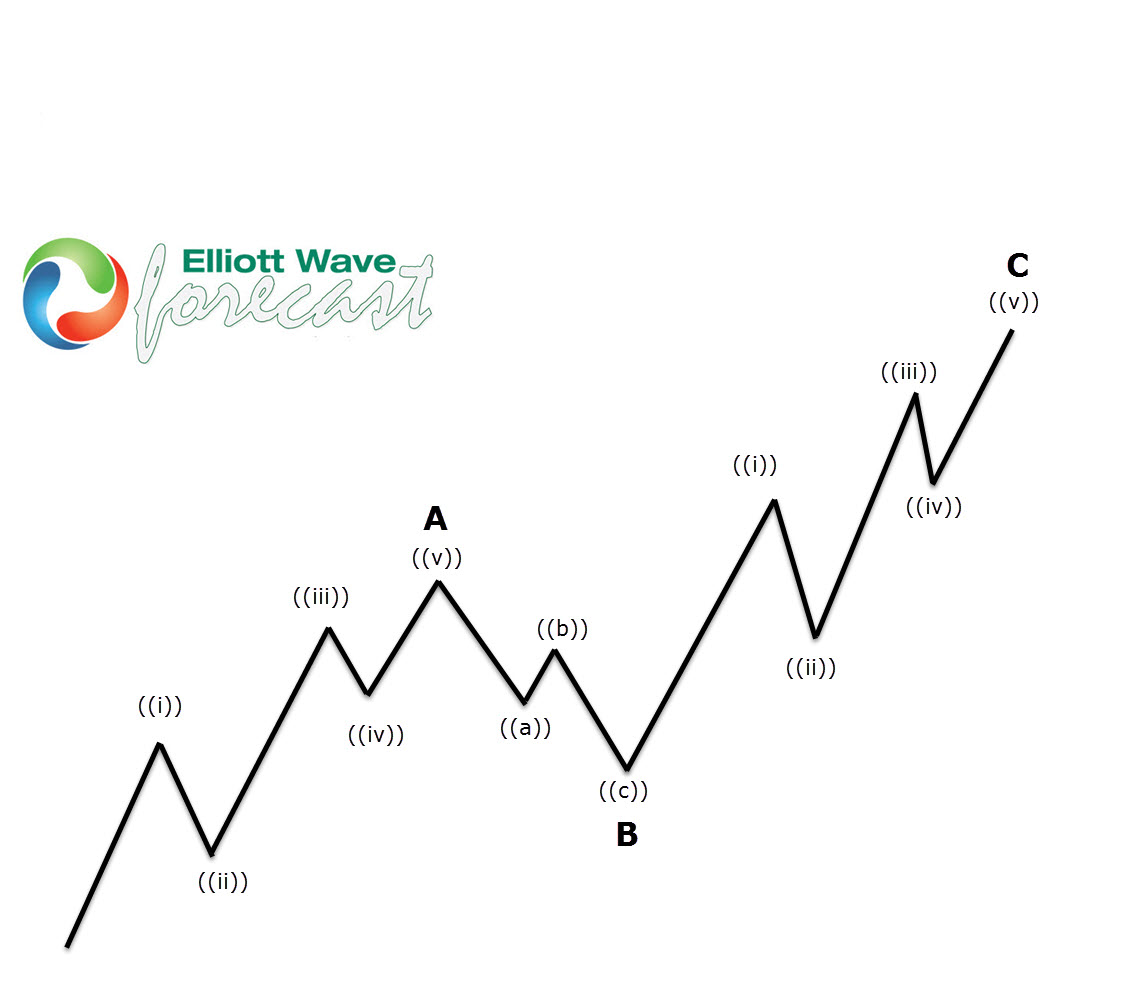
Before we take a look at the real market example, let’s explain Elliott Wave Zigzag pattern.
Elliott Wave Zigzag is the most popular corrective pattern in Elliott Wave theory . It’s made of 3 swings which have 5-3-5 inner structure. Inner swings are labeled as A,B,C where A =5 waves, B=3 waves and C=5 waves. That means A and C can be either impulsive waves or diagonals. (Leading Diagonal in case of wave A or Ending in case of wave C) . Waves A and C must meet all conditions of being 5 wave structure, such as: having RSI divergency between wave subdivisions, ideal Fibonacci extensions and ideal retracements.
DXY H4 Elliott Wave Analysis 07.27.2023
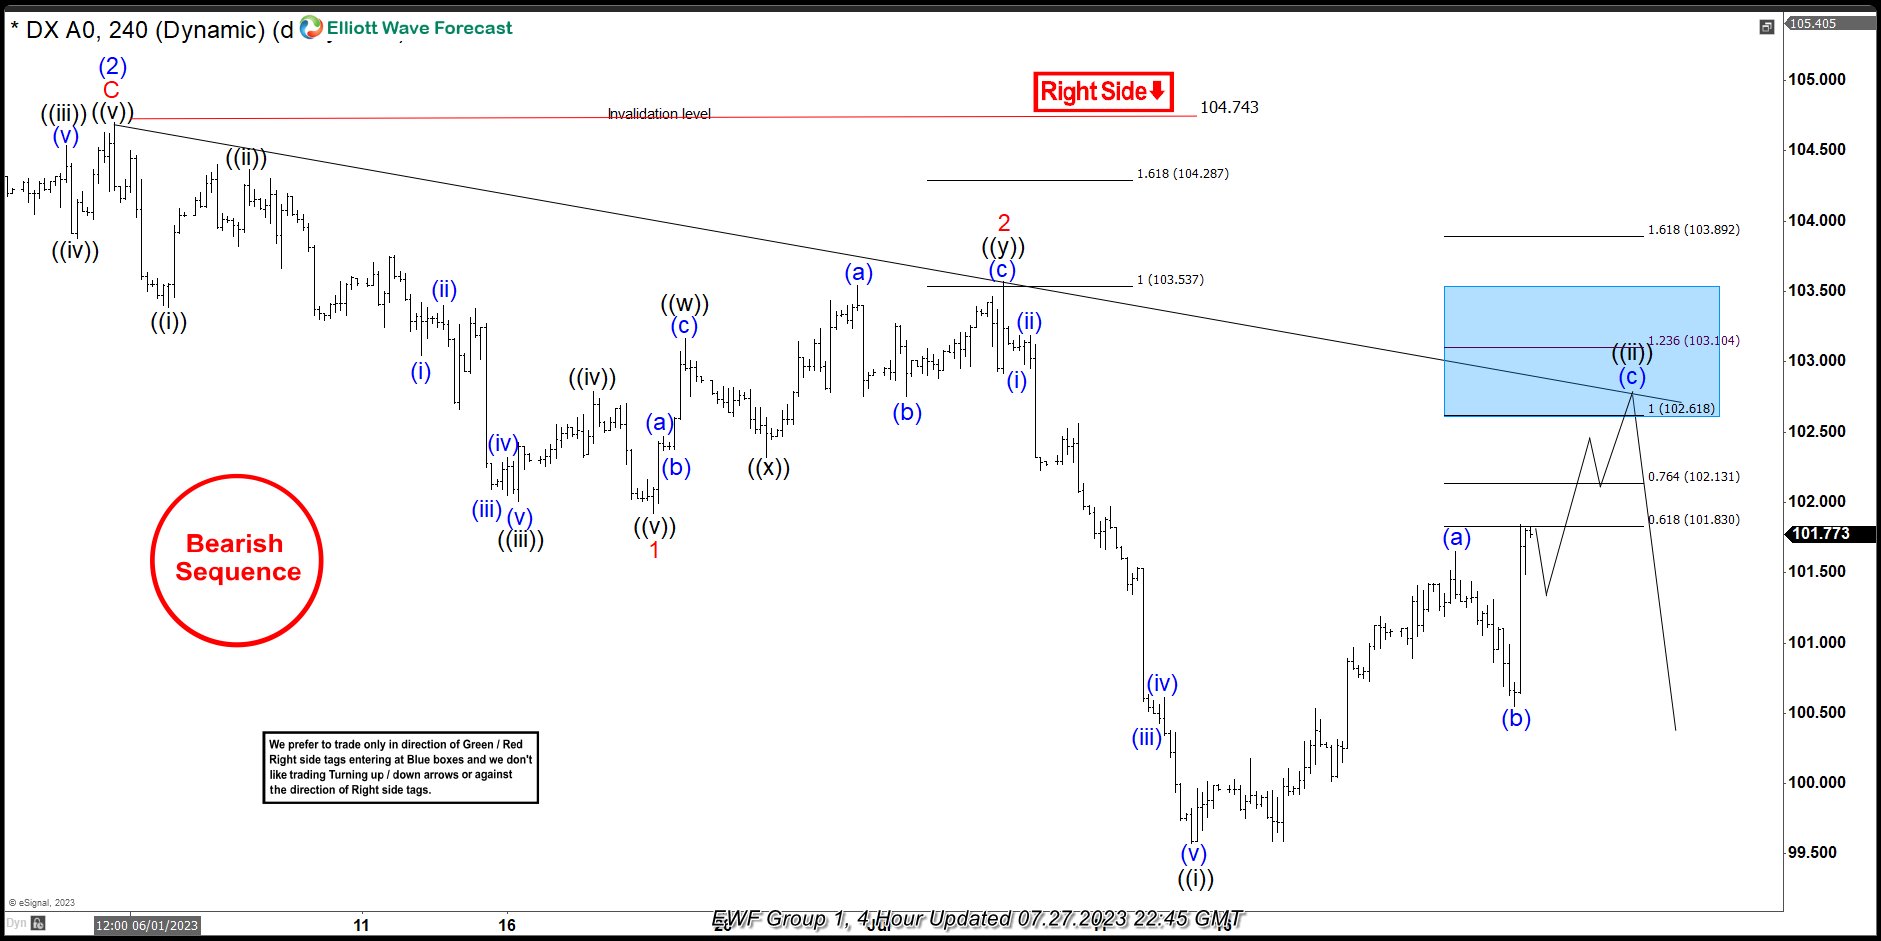
DXY is showing higher high sequences from the 07/13 low. We got 5 waves up in the first leg (a). Then the price has given us corrective pattern in (b) blue, after which we got rally toward new highs again. At the moment Dollar index is showing higher high sequences. Recovery looks incomplete, calling for further strength toward 102.61-103.1 area. More upside should ideally follow in DXY as far as the price stays above (b) blue low : 100.55. As the first leg of correction has 5 waves structure, we assume recovery is having form of Elliott Wave Zig Zag. Consequently we expect to see 5 waves up in the (c) leg as well.
DXY H4 Elliott Wave Analysis 07.27.2023
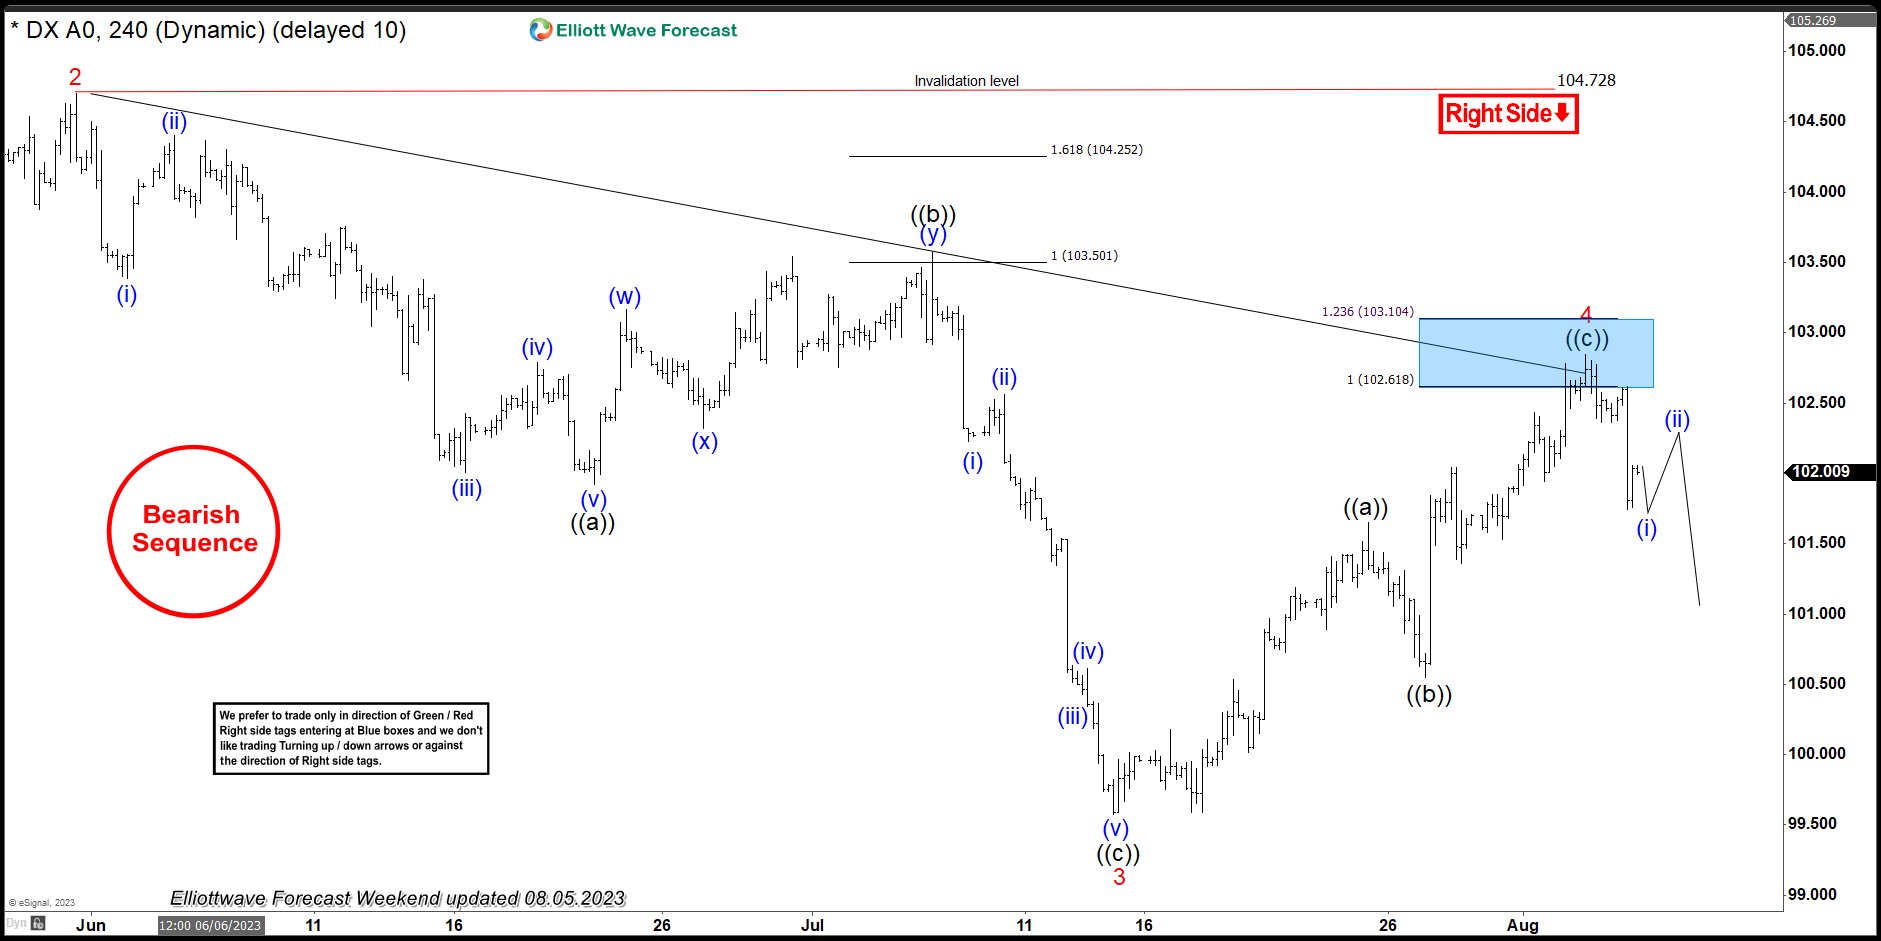
100.55 pivot held well during the short term correction and Dollar found further support as we expected. We got rally in Dollar index and target area is already reached at 102.61-103.1. As far as the price stays below 102.84 high, we can count correction completed. However , we would like to see further separation lower from that high to confirm next leg down is in progress.
Fed Williams: It’s an open question on additional rate hikes
In a candid interview with the New York Times, New York Fed President John Williams deemed the present monetary policy as being "in a good place". It's an "open question" on whether Fed needs additional rate hikes.
He emphasized the need to "watch the data". "Are we seeing the supply-demand imbalances continue to shrink, move in the right direction? Are we seeing the inflation data move in the right direction?"
He anticipates that the need for a restrictive monetary stance will persist for a while. He contemplates, "I think we're pretty close to what a peak rate would be, and the question will really be — once we have a good understanding of that, how long will we need to keep policy in a restrictive stance, and what does that mean."
Also, highlighting his approach towards monetary policy, Williams thought of monetary policy primarily in terms of "real interest rates", rather than "nominal rates" set by Fed. He stressed the potential consequences if inflation rates declined as projected by numerous forecasts: "if we don't cut interest rates at some point next year then real interest rates will go up, and up, and up. And that won't be consistent with our goals." Hence, "to keep maintaining a restrictive stance may very well involved cutting the federal funds rate next year, or year after".
Is Recession Coming? Framework Says Yes
Summary
Last year, we released a three-report series that outlined a couple methods to predict recessions and monetary policy pivots. Today, all three major tools still signal a recession within the next year. Despite the odds of a soft landing rising amid resilient economic data, the framework aligns with our base case expectation for a mild recession in early 2024.
Three's a Trend
Last year, we released a three-report series entitled Is Recession Coming? that outlined a couple methods to predict recessions and monetary policy pivots. The economic landscape has shifted since we published that series—the fundamental components of the economy have performed better than anticipated in recent months despite the aggressive pace of policy tightening from the Federal Reserve. Economists are growing broadly divided on the prospects of a near-term recession, so we take this opportunity to update and revisit the series' major tools.
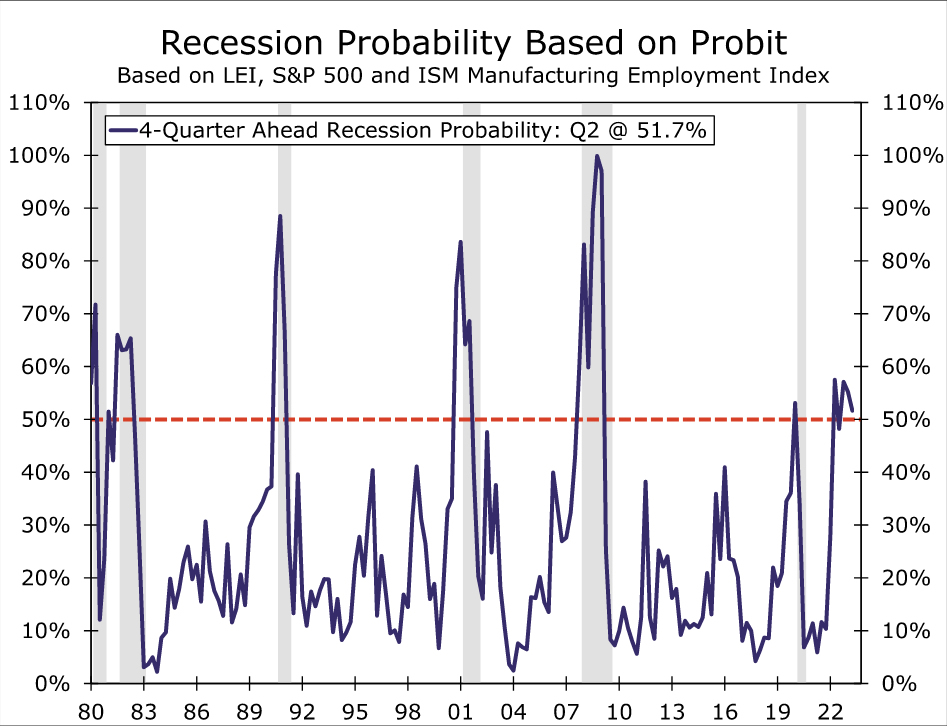
The first tool is our preferred Probit method, which is based on the Leading Economic Index, the S&P 500 and the employment component of the ISM manufacturing index. The method estimates that the probability of a recession fell to 52% in Q2, down from 55% in Q1 (Figure 1). While the probability has slipped, it has been above 50% in four of the past five quarters. Historically, when this Probit's probability has surpassed 50%, the economy experienced a recession within the next four quarters. In short, our Probit framework suggests that recession within the next year is still more likely than not.
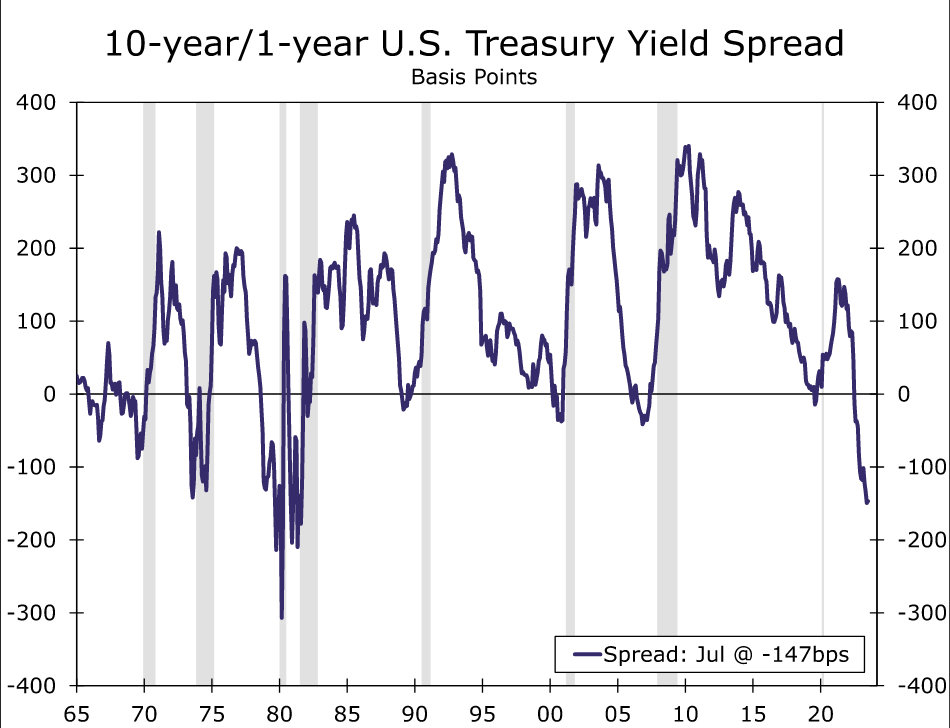
The second tool is the spread on the 10-year and 1-year Treasury yields. Using a recession-prediction threshold of two consecutive months of inversion, the yield spread has predicted all the past 10 recessions, with an average lead time of 12 months. Through July, the spread has been negative for 13 straight months (Figure 2), signaling a recession is indeed on the horizon.
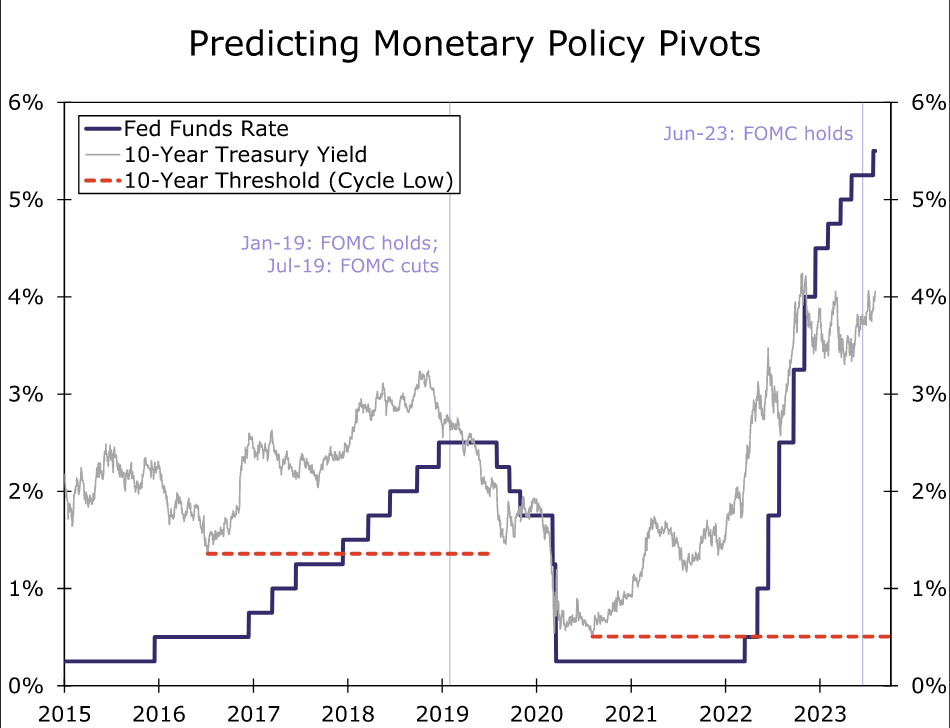
The final tool is a threshold method that uses the 10-year Treasury yield and the federal funds rate (FFR). In a rising interest rate environment, we found that when the FFR crosses the lowest 10-year yield in that cycle (the threshold), a monetary policy pivot is likely to ensue in the next 18 months. As shown in Figure 3, the FFR crossed the 10-year's current cycle low back in March 2022, when the FOMC kicked off its tightening cycle. The FOMC decided to hold rates steady in June, 16 months following the threshold breach. While the FOMC elected to hike the FFR by 25 bps to a target range of 5.25%-5.50% in July, the threshold approach suggests a pivot to an accommodative stance is in the offing, which historically occurs amid slowing economic growth.
In sum, all three tools signal a recession within the next year. Despite the odds of a soft landing rising amid resilient economic data, the framework aligns with our base case expectation for a mild recession in early 2024.