

Sample Category Title
EUR/USD Could Restart Increase Above 1.0950
Key Highlights
- EUR/USD corrected gains from the 1.1000 resistance zone.
- It traded below a key bullish trend line with support near 1.0930 on the 4-hour chart.
- GBP/USD also corrected gains from the 1.2840 resistance.
- Bitcoin price saw a strong increase above the $30,000 resistance.
EUR/USD Technical Analysis
The Euro gained pace after it broke the 1.0920 resistance against the US Dollar. EUR/USD even spiked above 1.1000 before the bears appeared.
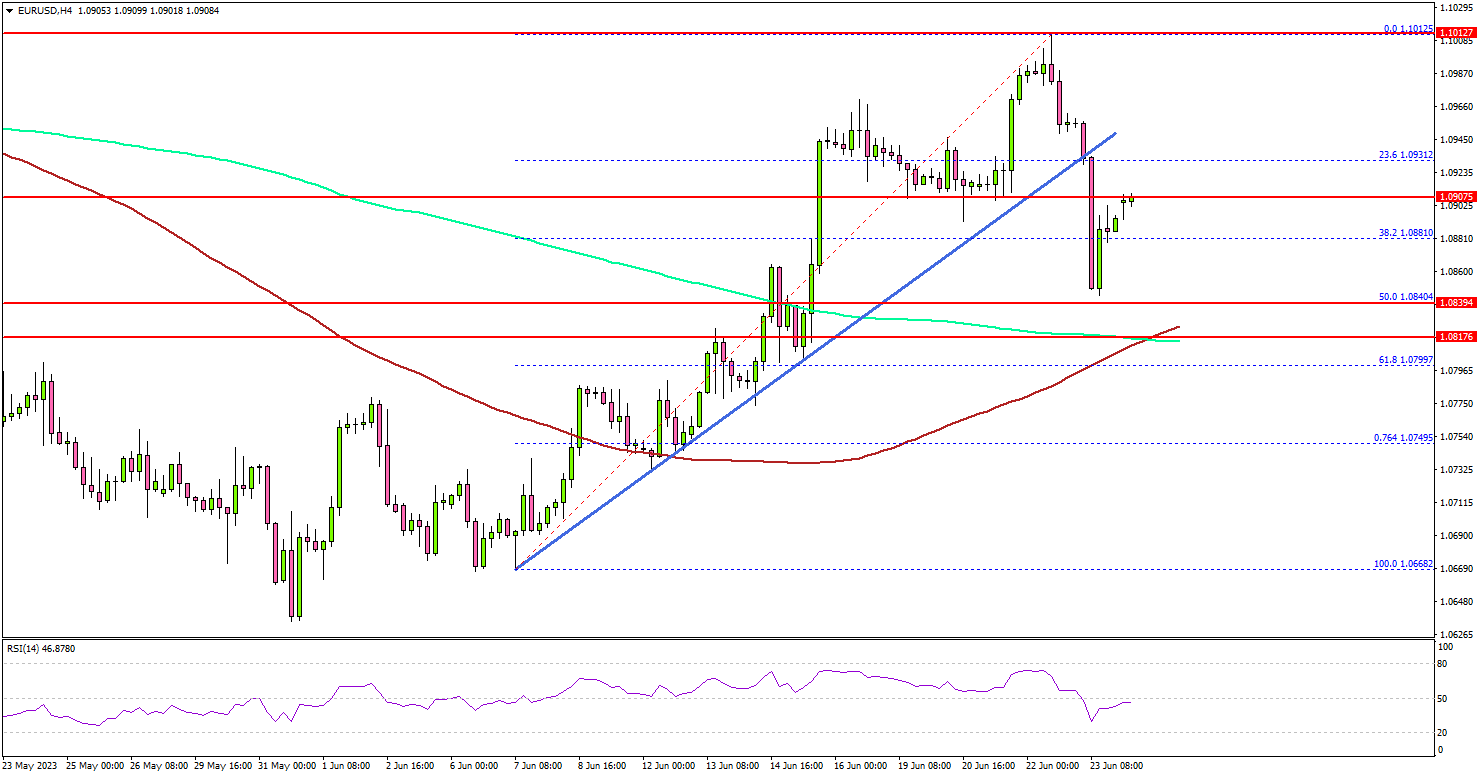
Looking at the 4-hour chart, the pair saw a downside correction from the 1.1010 zone. It traded below a key bullish trend line with support near 1.0930. There was a break below the 38.2% Fib retracement level of the upward move from the 1.0668 swing low to the 1.1012 high.
However, the bulls were active above the 1.0840 level and the 50% Fib retracement level of the upward move from the 1.0668 swing low to the 1.1012 high.
The pair is also above the 100 simple moving average (red, 4 hours) and the 200 simple moving average (green, 4 hours). If there is a fresh increase, the pair might struggle near 1.0930.
The first major resistance is near the 1.0950 zone. If there is a move above the 1.0950 resistance, the pair could rise toward 1.1000. Any more gains might send EUR/USD toward the 1.1050 level.
Immediate support is near the 1.0840 level. The next major support is near the 1.0800 level and the 100 simple moving average (red, 4 hours). If there is a downside break below the 1.0800 support, the pair could decline toward the 1.0750 support. The main support sits at 1.0665.
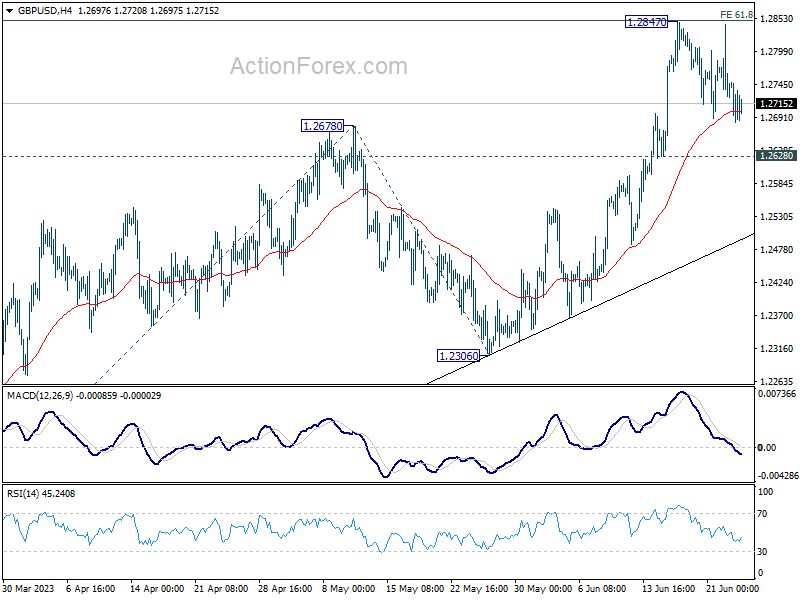
Looking at GBP/USD, the pair failed to clear the 1.2840 resistance on two occasions and recently saw a downside correction.
Economic Releases
- German IFO Business Climate Index for June 2023 – Forecast 90.7, versus 91.7 previous.
- German IFO Current Assessment Index for June 2023 - Forecast 93.5, versus 94.8 previous.
- German IFO Expectations Index for June 2023 – Forecast 88.0, versus 88.6 previous.
Ethereum (ETHUSD) Buying The Dips At The Blue Box Area
Hello fellow traders. In this technical article we’re going to take a quick look at the Elliott Wave charts of ETHUSD published in members area of the website. As our members know, Ethereum has given us good buying opportunity recently . Our team recommended members to avoid selling , while keep favoring the long side and buying the dips against the 1370 pivot. We got correction that reached our buying zone. ETHUSD found buyers and made reaction from the blue box as expected. In the further text we are going to explain the Elliott Wave Forecast and trading strategy.
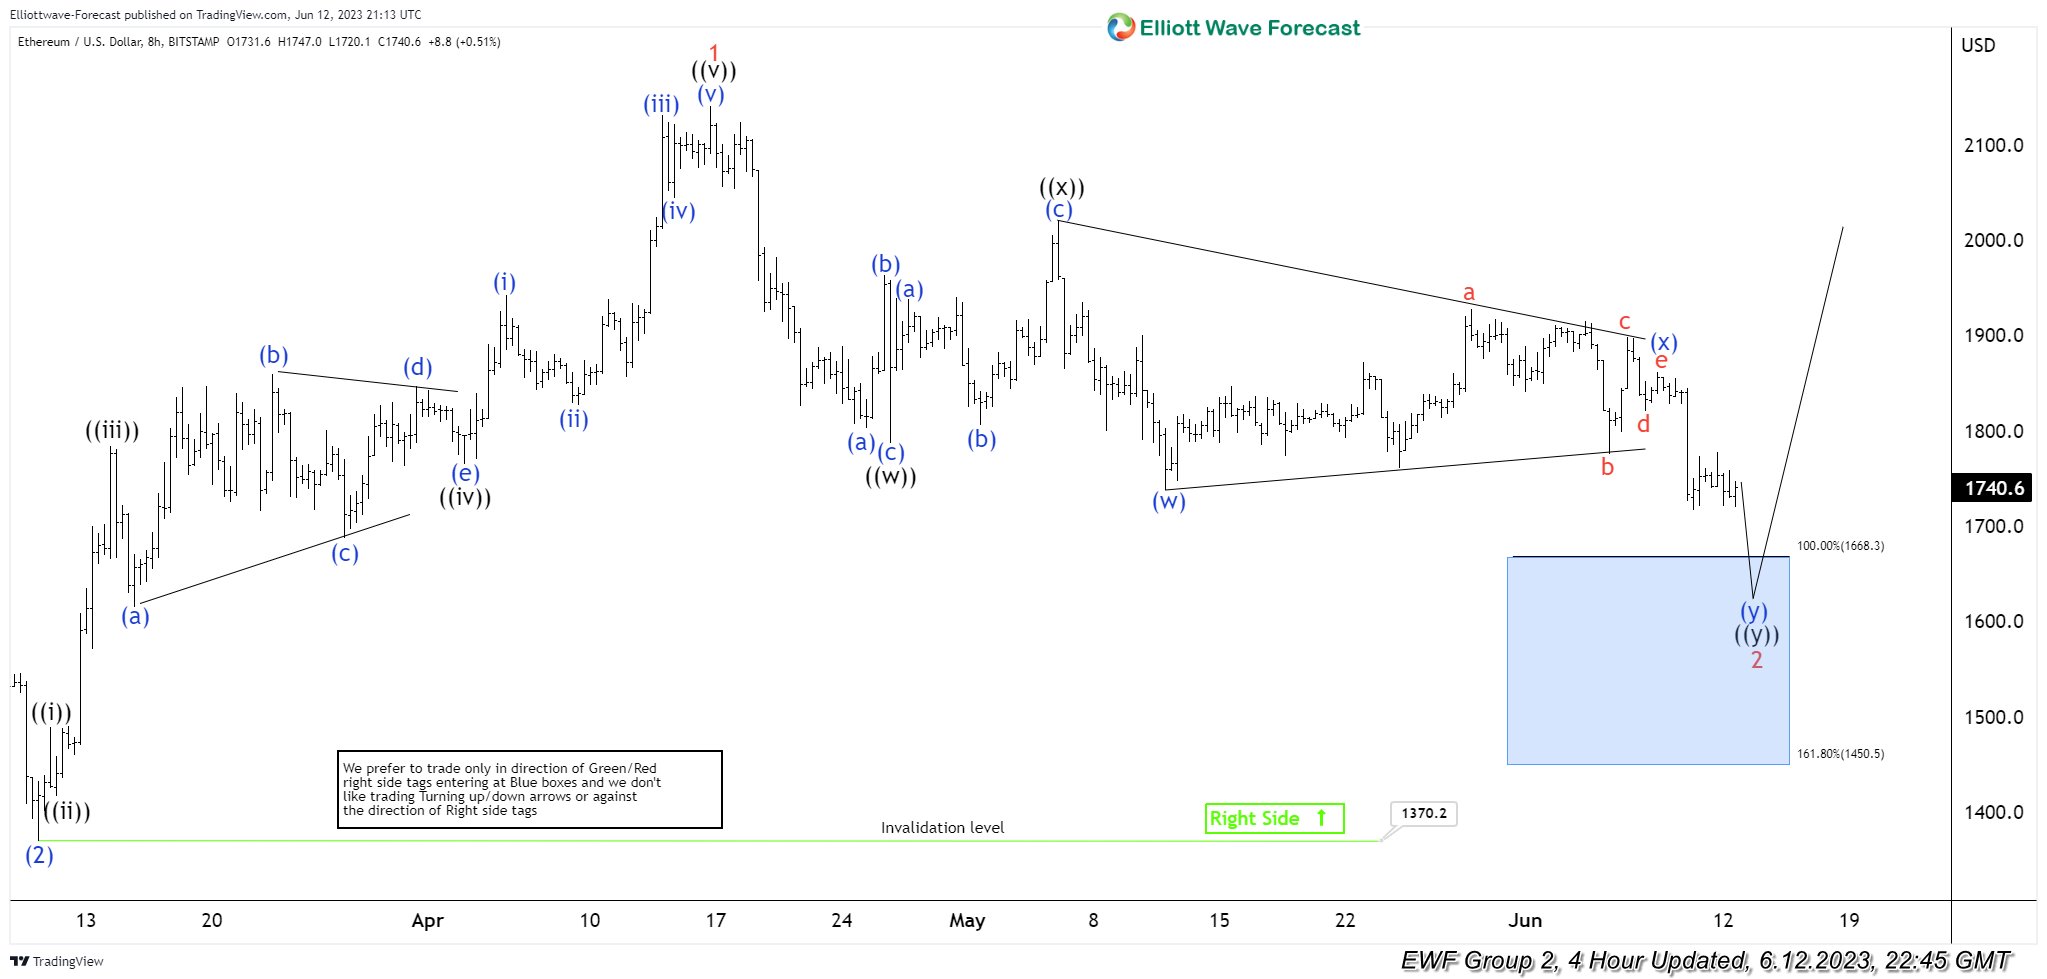
ETHUSD Elliott Wave 4 Hour Chart 06.12.2023
ETHUSD is showing incomplete sequences from the peak. Structure of the pull back looks incomplete at the moment. We expect to see more weakness toward 1668.3-1450.5 area which will be our buying zone. We don’t recommend selling ETHUSD against the main bullish trend. Strategy is waiting for the price to reach blue box- equal legs zone, before entering the long trades again. Once bounce reaches 50 Fibs against the ((x)) high , we will make long position risk free ( put SL at BE) and take partial profits. Invalidation for the long trades is break of 1.618 fib ext : 1450.5
Quick reminder:
Our charts are easy to trade and understand:
Red bearish stamp+ blue box = Selling Setup
Green bullish stamp+ blue box = Buying Setup
Charts with Black stamps are not tradable. 🚫
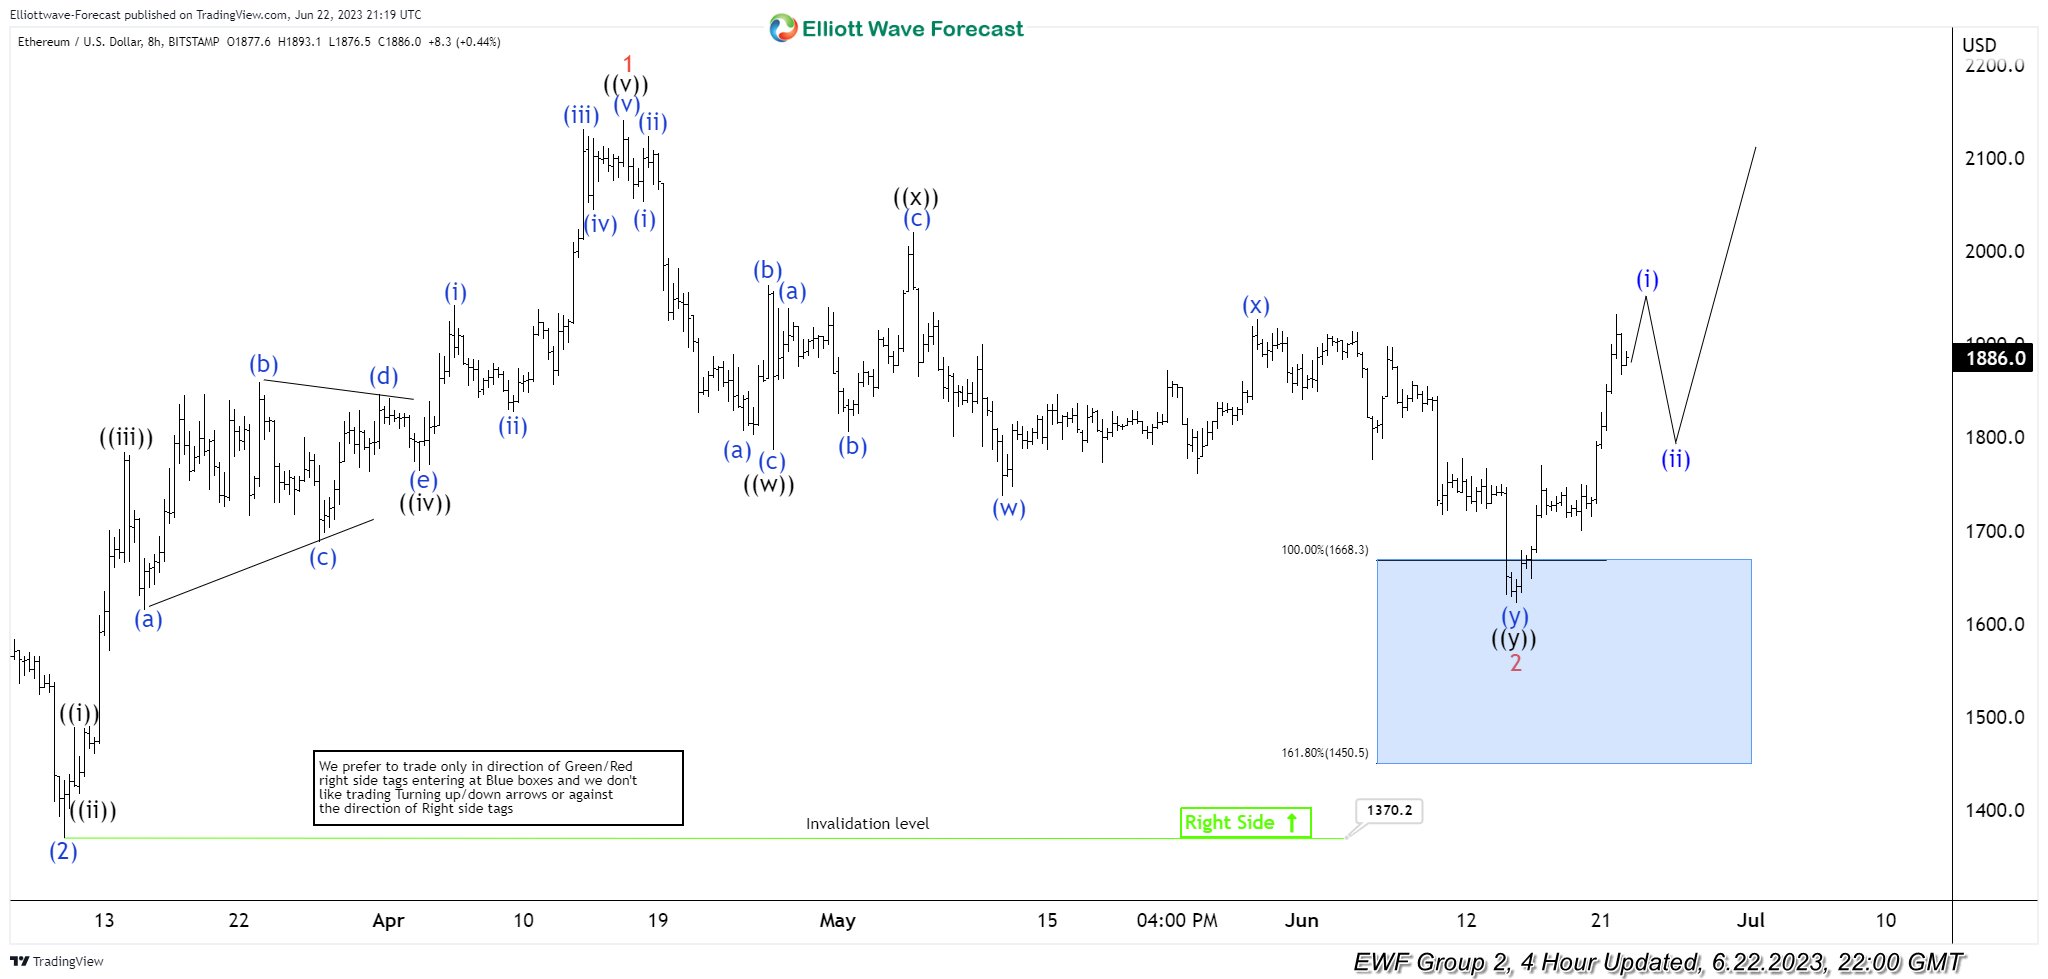
ETHUSD Elliott Wave 4 Hour Chart 06.12.2023
ETHUSD made decline and reached buying zone at 1668.3-1450.5 area ( blue box) . Pull back completed at the 1622.7 low and we are getting good reaction from the buying zone. Bounce reached and exceeded 50 fibs against the connector’s high. So members who took the long trade are enjoying profits now in a risk free positions.
Forex and Cryptocurrencies Forecast
EUR/USD: Officials' Words Drive the Markets
Just a reminder, the Federal Open Market Committee (FOMC) of the US Federal Reserve decided on Wednesday, June 14 to pause the process of monetary tightening and left the interest rate unchanged at 5.25%. The following day, on Thursday, June 15, the European Central Bank (ECB) raised the euro interest rate by 25 basis points from 3.75% to 4.00%. ECB President Christine Lagarde noted that the tightening of credit and monetary policy would continue in July.
The firm rhetoric was supported by other ECB representatives. According to comments from ECB Governing Council member Olli Rehn, the underlying inflation in the Eurozone is declining too slowly, necessitating additional efforts from the regulator to stabilize prices. The intentions of the regulator to continue raising rates were also confirmed by ECB Chief Economist Philip Lane and ECB Governing Council member Isabel Schnabel. In their view, the regulator has significant work to do before inflation stabilizes around 2%. (According to the latest data, annual inflation in the Eurozone remained at 6.1%, and the Core Consumer Price Index stood at 5.3%).
Against the backdrop of these hawkish statements from European officials, the markets concluded that at least two more rate hikes should be expected for the euro, in July and September, each by 25 basis points. This continued to push the euro currency higher, and EUR/USD reached a peak at 1.1011 on Thursday, June 22.
However, the financial world doesn't revolve solely around the ECB. On June 21 and 22, market participants' attention was focused on Federal Reserve Chairman Jerome Powell's semi-annual testimony before the U.S. Congress. While the overall rhetoric was nearly identical to the press conference on June 14, this time Powell placed more emphasis on the prospects of further rate hikes in the near future. This sentiment became particularly evident on the second day of his testimony. The hawkish stance of the Fed Chair and the market's risk-averse atmosphere helped the American currency outperform its competitors. On Thursday, the U.S. Dollar Index (DXY) reversed its course and started moving upwards again, while EUR/USD declined.
The growing concerns of a recession in the Eurozone also played against the euro. On Friday, June 23, the European currency came under significant bearish pressure as data from Germany and the Eurozone indicated that business activity (PMI) in the manufacturing sector continued to decline at an accelerated pace. Following the release of the PMI statistics, according to Reuters calculations, the likelihood of the ECB's final rate reaching 4.25% decreased to nearly 0%, and EUR/USD reached a local minimum at the level of 1.0844.
However, the situation for the European currency is not as dire, at least in the medium term. For instance, economists at ANZ (The Australia and New Zealand Banking Group) believe that while the Federal Reserve may reduce its key interest rate by 20 basis points by the end of the year, market expectations suggest that the ECB will not lower its rates until early 2024. As a result, the ECB's easing cycle will be later and less significant compared to the Fed's, which is favorable for the euro. Consequently, in Q3, EUR/USD could rise to 1.1200. Overall, according to ANZ, the exchange rates are expected to fluctuate in the range of 1.0500 to 1.1400 throughout 2023.
After the release of PMI data for the manufacturing and services sectors in the United States, EUR/USD concluded the five-day period at 1.0893. As for the immediate prospects, at the time of writing this review on the evening of June 24, the forecast appears highly uncertain: 45% of analysts favored a decline in the pair, while an equal percentage expected its growth, and the remaining 10% adopted a neutral position. Among the oscillators on the daily timeframe, 90% lean towards bullish signals, while 10% remain neutral-grey. Regarding the trend indicators, 80% are coloured green, while 20% are in red. The nearest support levels for the pair are located around 1.0865, followed by 1.0790-1.0800, 1.0745, 1.0670, and finally the May 31 low at 1.0635. Bulls will encounter resistance around 1.0900-1.0925, followed by 1.0960-1.0985, 1.1010, and 1.1045, with further resistance at 1.1090-1.1110.
The upcoming week brings a cascade of macroeconomic data from the United States. We can expect housing market data on Tuesday, June 27, as well as the release of durable goods orders and capital goods orders. Additionally, the Consumer Confidence Index (CCI) from the Conference Board, a leading indicator, will be announced. The results of the country's bank stress tests will be revealed on the following day, Wednesday, June 28, which is particularly interesting given the banking crisis that followed the Fed's interest rate hikes. Furthermore, on the same day, Federal Reserve Chair Jerome Powell will deliver a speech. Thursday will bring labour market statistics and GDP data for the country. Finally, on Friday, June 30, the Core Personal Consumption Expenditures (PCE) Index, a key measure of inflation, will be released for US residents. As for the Eurozone economy, preliminary inflation figures (CPI) for Germany and the Eurozone as a whole, which will be published on June 29 and 30, respectively, are of interest.
GBP/USD: Bank of England's Delayed Surprise
The economic data released during the past week concerning the UK appeared quite mixed. A significant inflation indicator, the Consumer Price Index (CPI), remained unchanged for the month, standing at 8.7% YoY, surpassing market expectations of 8.4%. Retail sales showed a positive outlook as they unexpectedly grew by 0.3% for the month, contrary to the anticipated decline of -0.2% and the previous value of 0.5%. The core retail sales, excluding automotive fuel, increased by 0.1% against the negative forecast of -0.3% and the previous month's 0.7%. However, the business activity indicators in the country were disappointing. The preliminary Services Purchasing Managers' Index (PMI) decreased to 53.7 in June, compared to the expected 54.8. The Manufacturing PMI also fell short of expectations, dropping from 47.1 to 46.2 (forecast: 46.8).
The inflation data released on June 21 not only exceeded market expectations but also surpassed the Bank of England's (BoE) own forecasts. Against this backdrop, the central bank surprised the markets during its meeting on Thursday, June 22, by raising the base rate not by 25 basis points but by 50 basis points, bringing it to 5.00%.
Following conventional logic, such a move should have significantly supported the British currency. However, that was not the case. GBP/USD initially jumped 60 pips to 1.2841 within 10 minutes of the BoE decision, but then declined by over 100 pips to 1.2737. Analysts believe that the initial upward movement was driven by news headline-reactive algorithmic trading, but the bullish momentum was later dampened as sellers encountered resistance near 14-month highs recorded on June 16.
Strategists from the largest banking group in the Netherlands, ING, believe that a 150 basis point rate hike was already priced in before the Central bank meeting. The 50-basis point increase has occurred, and now markets are anticipating a further 100 basis point rise to 6.00%. Along with the aggressive rate hike, market speculation is growing that the Bank of England, in order to avoid an economic collapse, may be compelled to begin easing its monetary policy starting from the summer of 2024 (or even earlier).
Economists at Commerzbank argue that the BoE started raising the key rate too late and too slowly, putting itself in a position of playing catch-up. According to their view, the regulator is chasing inflation rather than actively combating it through monetary policy, which could have a negative impact on the British currency.
However, different opinions exist. Scotiabank economists, for example, anticipate that GBP/USD could rise to 1.3000 in the near future. Colleagues at ING share this view, stating, "Looking at the charts, it seems that there are no significant levels between current levels and 1.3000, which suggests that the latter is not far away."
GBP/USD ended the past week at the level of 1.2714. Given the current volatility, theoretically, it could cover the remaining distance to 1.3000 in just a few weeks or even days. Currently, 45% of surveyed experts support this scenario, while 25% hold the opposite view, and 30% prefer to refrain from commenting. In terms of technical analysis, both oscillators and trend indicators on the daily timeframe mirror the readings of their counterparts for EUR/USD. In the event of a southward movement in the pair, it will encounter support levels and zones at 1.2685-1.2700, 1.2625, 1.2570, 1.2480-1.2510, 1.2330-1.2350, 1.2275, and 1.2200-1.2210. In the case of an upward movement, the pair will face resistance levels at 1.2760, 1.2800-1.2815, 1.2850, 1.2940, 1.3000, 1.3050, and 1.3185-1.3210.
One notable event in the upcoming week's calendar is Friday, June 30, when the GDP data for the United Kingdom will be released.
USD/JPY: The Journey to the Moon Continues
We issued a "Ticket to the Moon" for USD/JPY a few weeks ago, and it continues to be in effect. The pair reached a height of 143.86 last week. According to Commerzbank, "the yen's weakness is gradually taking on a dramatic character." Economists at Singapore's United Overseas Bank (UOB) forecast that the dollar is likely to continue rising in the next 1-3 weeks. They state, "The next significant level is 144.00. It is still too early to determine whether the dollar's strength [...] will break above this barrier. On the other hand, our strong support level has been adjusted to 141.60 from 141.00."
Economists at MUFG Bank believe that the increasing divergence in monetary policy between the Bank of Japan and other major central banks is a recipe for further weakening of the yen. "The widening yield differentials between Japan and foreign countries, along with the reduction in currency and rate volatility, contribute to the yen becoming increasingly undervalued," write analysts at MUFG. According to their counterparts at the French financial conglomerate Societe Generale, if there is another interest rate hike in the United States in July, the USD/JPY pair could rise to 145.00.
It is clear that the yen is suffering not only from the persistently "dovish" stance of the Bank of Japan (BoJ) but also from the overall rise in global yields. The pressure on the Japanese currency can only be alleviated by the hope that the BoJ will eventually take the first step towards ending its ultra-loose monetary policy. For instance, economists at Danske Bank hope that USD/JPY exchange rate will fall below 130.00 within a 6–12-month horizon. Similar forecasts are made by strategists at BNP Paribas, with targets of 130.00 by the end of the current year and 123.00 by the end of 2024.
As for the Japanese government and the Bank of Japan, it seems that they are not yet ready for any significant changes. Last week, Finance Minister Shunichi Suzuki stated that while they closely monitor currency movements, they have no intention of commenting on them. He added that "sharp currency movements are undesirable" and that "currency rates should be determined by the market, reflecting fundamental indicators." However, it appears to us that the head of the finance ministry is being deceptive. We only need to recall the unexpected currency interventions carried out by the Bank of Japan last year, prompted by the Ministry of Finance. Through these interventions, the yen was able to strengthen against the dollar by over 1,500 pips. Is it not possible for a similar surprise to occur now?
After reaching another high at 143.86, the pair concluded the past five-day period at 143.71. At the time of writing this review, 60% of analysts anticipate that the yen will recover at least some of its losses and push the pair lower, while 30% of experts point to the west. Although the number of supporters for pair growth this time stands at just 10%, it's worth noting that even the minority can be right. Moreover, it is supported by technical analysis, as all 100% of trend indicators and oscillators on the daily timeframe point upwards. However, a quarter of the oscillators actively signal overbought conditions for the pair. The nearest support level is located in the 143.00-143.20 zone, followed by 142.20, 1.4140, 140.90-141.00, 1.4060, 139.85, 1.3875-1.3905, 138.30, and 137.50. The closest resistance is at 143.85, and then bulls will need to overcome barriers at 144.90-145.30, 146.85-147.15, 148.85, and potentially reach the October 2022 high at 151.95.
There is no significant economic information related to the Japanese economy expected to be released during the upcoming week.
CRYPTOCURRENCIES: Influencers Betting on Bitcoin
Bears dominated the crypto market for nine consecutive weeks. However, the situation abruptly changed on June 15 as bitcoin unexpectedly demonstrated a rapid growth. It broke through resistance levels at $25,000, $26,500, and surpassed $30,000, reaching a peak of $31,388 on June 23. The increase during these days amounted to over 26%. Altcoins also followed bitcoin's upward trend, with ethereum gaining approximately 19% in weight.
Bitcoin's surge was fuelled by a series of positive news. The main highlight was the announcement that investment giant BlackRock filed an application to launch a spot bitcoin trust, aiming to simplify institutional access to the crypto market. However, this news wasn't the only one. One of Germany's largest financial conglomerates, Deutsche Bank, declared its entry into the digital asset market and its involvement in cryptocurrency custody services. Wall Street financial giants Citadel and Fidelity joined forces to launch a decentralized crypto exchange called EDX Markets on June 20. Another investment giant, Invesco, which manages assets worth $1.4 trillion, filed an application for a spot Bitcoin ETF. (MicroStrategy believes that such an ETF could attract trillions of dollars). Lastly, the issuance of a new batch of Tether (USDT) stablecoins may have also contributed to the growth of BTC/USD.
It is worth noting that the surge of the flagship cryptocurrency occurred despite the U.S. Securities and Exchange Commission's (SEC) crackdown on the digital market. Previously, the SEC filed lawsuits against Binance and Coinbase, accusing the platforms of selling unregistered securities. In the court documents, the Commission classified over a dozen tokens as securities. According to experts, a victory for the regulator could lead to the delisting of these coins and restrict the potential development of their blockchains. The regulator has already included over 60 coins on its blacklist.
Preston Pysh, the author of popular investment books, believes that the regulatory pressure was a planned campaign. Its aim is to provide major players with the opportunity to enter the digital asset market under favourable conditions. He supports his viewpoint with the bold moves made by Wall Street giants, as mentioned earlier.
The TV host and billionaire, Mark Cuban, and former SEC executive, John Reed Stark, discussed the ongoing crackdown on the crypto industry. Stark believes that the actions taken by the SEC are necessary. According to him, the regulator is trying to protect investors from potential fraud and scams in this sector. He is also convinced that the SEC's actions will ultimately benefit the industry by filtering out dishonest participants and increasing transparency. As for Mark Cuban, he drew parallels with the early days of the internet. In the billionaire's opinion, "90% of blockchain companies will fail. 99% of tokens will fail. Just like 99% of early internet companies."
It is worth noting that many influencers are skeptical about cryptocurrencies and are putting bitcoin aside. We have already quoted Benjamin Cowen, the founder of Into The Cryptoverse, who believes that altcoins "will face reckoning while bitcoin dominance continues to grow." A similar sentiment was expressed by renowned trader Gareth Soloway, who stated that he has always compared the crypto market to the dot-com bubble. According to him, a collapse similar to the early 2000s will occur in this industry. Soloway reassured that "the system needs to be cleared of junk" in order to thrive. He believes that 95% of all tokens "will strive towards zero.".
Robert Kiyosaki, the author of the book "Rich Dad Poor Dad," has recently warned about an impending real estate market crash. According to the expert, California mortgage lender LoanDepot is already on the verge of bankruptcy, and the upcoming real estate market collapse is likely to be much worse than the 2008 crisis. In this situation, Kiyosaki once again advised his followers to prepare for the disaster and accumulate precious metals and bitcoin.
Mike Novogratz, CEO of Galaxy Digital, also believes that in the fight against inflation, the demand for alternative instruments will increase, and one of them is Bitcoin, which he predicts will reach $500,000 in the long term. Max Keiser, a former trader and television host who is now an advisor to Salvadoran President Nayib Bukele, mentioned an even higher figure of $1 million per coin. Cathy Wood, CEO of ARK Invest, also believes that the $1 million target is achievable.
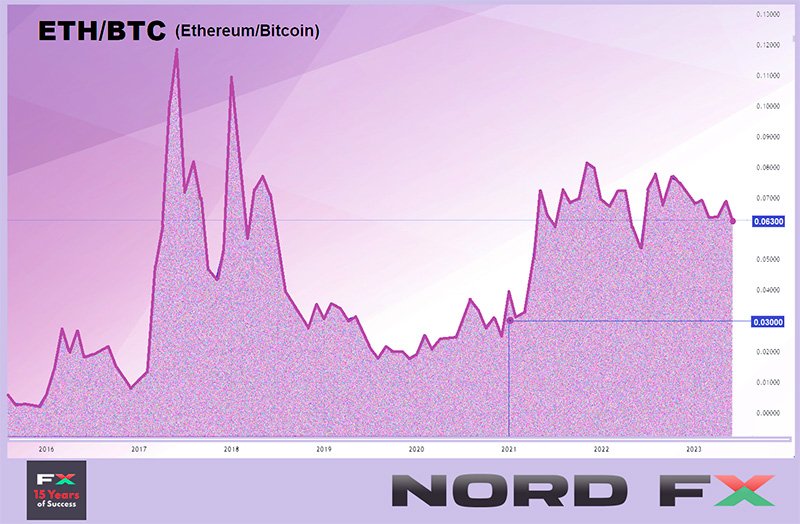
Peter Brandt, known as the "Mysterious Market Wizard," has joined the ranks of bitcoin praise, expressing doubts about all coins except Bitcoin. This legendary trader and analyst stated that bitcoin is the only cryptocurrency that will successfully finish this marathon. He later added that ethereum (ETH) is likely to survive, but the real legacy belongs to bitcoin. Benjamin Cowen, mentioned earlier, also predicts difficulties for ethereum, suggesting that ETH/BTC may plummet to Q1 2021 levels in the near future, potentially losing up to 45% of its current value.
Chris Burniske, a partner at venture capital firm Placeholder, has noted that cryptocurrencies often experience growth when the Nasdaq 100 (NDX) index takes a breather. Cooling off in stocks prompts capital to flow into riskier assets, and bitcoin begins a bullish rally. Burniske refers to observations made by Glassnode's founders, Jan Happel and Yann Allemann. According to their findings, since 2019, bitcoin has shown strong growth after signs of bullish exhaustion in the NDX. Currently, bitcoin is just a few steps away from surpassing the NDX once again as the index nears a local peak.
Popular investor and founder of venture company Eight, Michael Van De Poppe, believes that the current market conditions make it impossible for the negative forecasts for BTC to come true, as some authors predict a drop in the cryptocurrency to $12,000. According to his opinion, investors should now "fill their pockets" in anticipation of further growth.
BTC dominance reached 50% on Thursday, June 21. This means that half of the entire cryptocurrency market capitalization is accounted for by this asset. The last time the index was this high was two years ago in May 2021. The current rise is attributed to the pressure from the SEC on altcoins and the application for a spot bitcoin trust by BlackRock. Michael Saylor, the CEO of MicroStrategy, believes that bitcoin dominance will continue to grow and reach 80% in the coming years. "Currently, there are 25,000 tokens of varying quality in the market, which confuses large investors," he says. "After removing unnecessary assets through the SEC, major capital will be more willing to invest in the leading cryptocurrency.".
At the time of writing the review, on the evening of Friday, June 23, BTC/USD is trading at around $30,840. The total market capitalization of the cryptocurrency market stands at $1.196 trillion ($1.064 trillion a week ago). The Crypto Fear & Greed Index has returned to mid-April levels, jumping from the Neutral zone to the Greed zone over the week, and rising from 47 to 65 points.
Recession Concerns Eclipsed a Week Laden with Key Event; Aussie Bear the Brunt
A cloud of recession fears dominated a week full of significant events, with disappointing PMI data, particularly from Eurozone and US, dampening sentiment towards the end. Investors also grappled with mismatched expectations concerning Chinese fiscal stimulus, which added additional pressure on global stock indexes, driving them lower by the end of the week. Nevertheless, the retreat in US market was relatively mild in comparison.
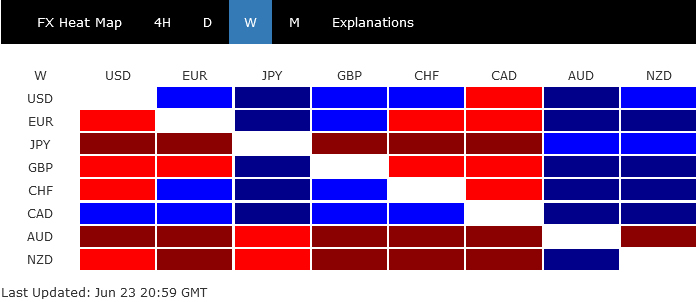
In the Forex market, Australian and New Zealand Dollars faced a rough week, ending as the worst performers. While Japanese Yen continued its near-term downtrend, triggering verbal interventions from the Japanese government, it stood as only the third weakest. Canadian Dollar emerged as the top performer, backed by strong retail sales data. Dollar clinched the second spot, followed by Swiss Franc - a clear reflection of the overall risk sentiment. Meanwhile, Euro and Sterling showed mixed results for the week.
Dollar Index finds respite amid risk-off sentiment
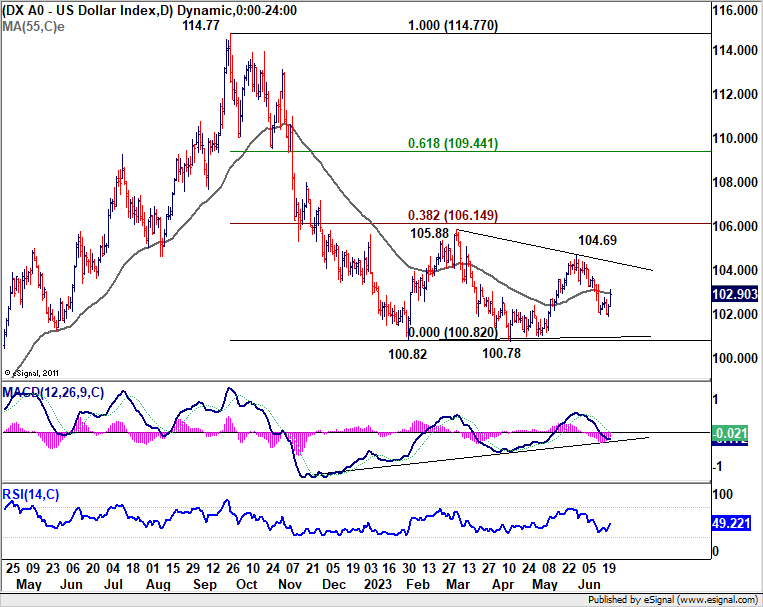
Boosted by an increasing risk-off sentiment, particularly following a series of weak PMI data released last Friday from various countries, Dollar Index closed on a high note. Despite this uptick, the prevailing analysis remains unchanged; price action from 100.82 appears to be a consolidation pattern, which may have completed with three waves to 104.69.
Short-term bearish outlook was neutralized somewhat by breach of 55 D EMA, now at 102.96. Yet, any failure to sustain above the EMA, followed by a dip below last week's low of 101.92, could trigger resurgence of bearish sentiment and bring deeper decline to retest 100.82 low. On the flip side, sustained trading above the EMA might fuel a more robust rise to 104.69 and potentially higher, elongating the consolidation from 100.82.
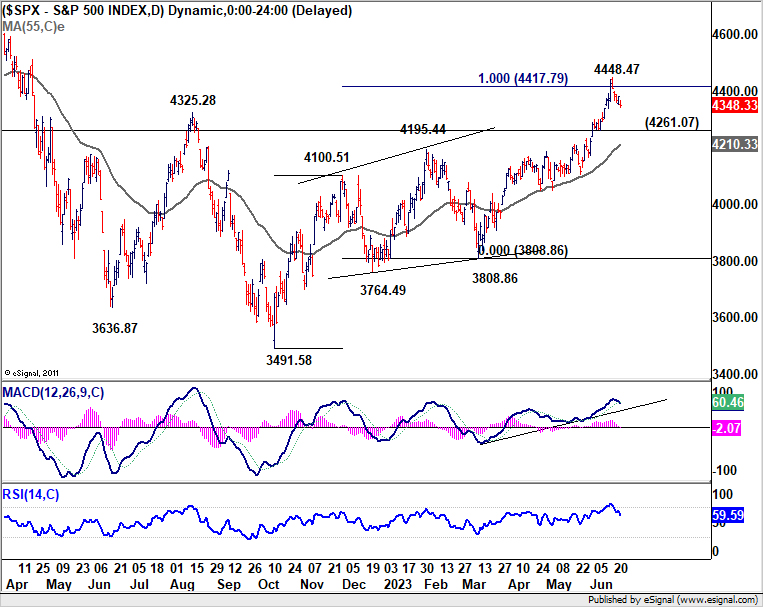
For the near term, the developments in risk markets could be a key factor shaping the trajectory of the greenback, at least until release of PCE inflation data this coming Friday. Last week's dip in S&P 500, was relatively shallow, and didn't threaten the rise from 3808.86. Still, extended correction could provide some support for Dollar.
As it stands, near-term outlook for S&P 500 remains bullish as long as 4261.07 support level holds. A break above 4448.47 would reignite the broader rally from 3491.58 towards 161.8% projection of 3491.58 to 4100.51 from 3808.86 at 4794.11, which is just shy of the record high at 4818.62.
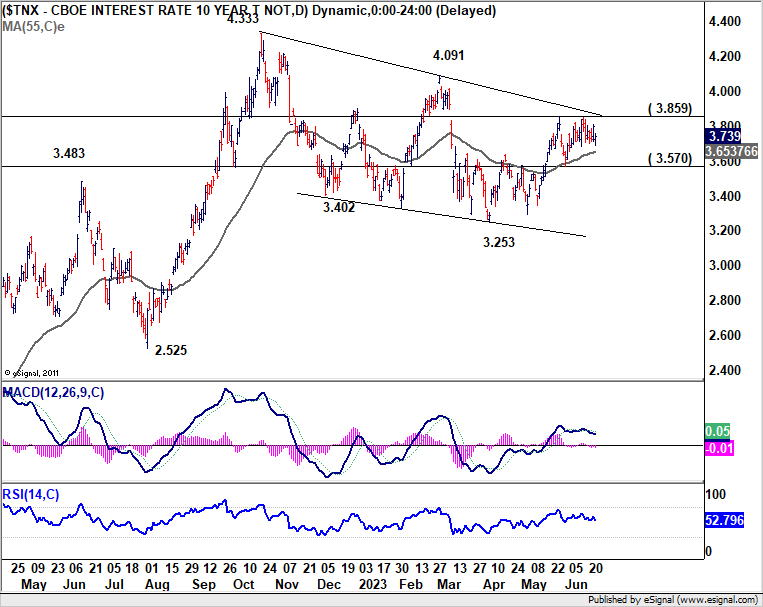
US 10-year yield trades sideways while USD/JPY rallies: awaiting potential catalysts
US 10-year yield continued to trade in sideway trading below 3.859 resistance last week. Breach of 55 D EMA (now at 3.653) cannot be ruled out consolidation extends. But further rally will remain in favor as long as 3.570 support holds. Corrective fall from 4.333 could have completed with three waves down to 3.253 already. Above 3.859 will target 4.091 resistance next. Firm break there should confirm this case and bring retest of 4.333 high.
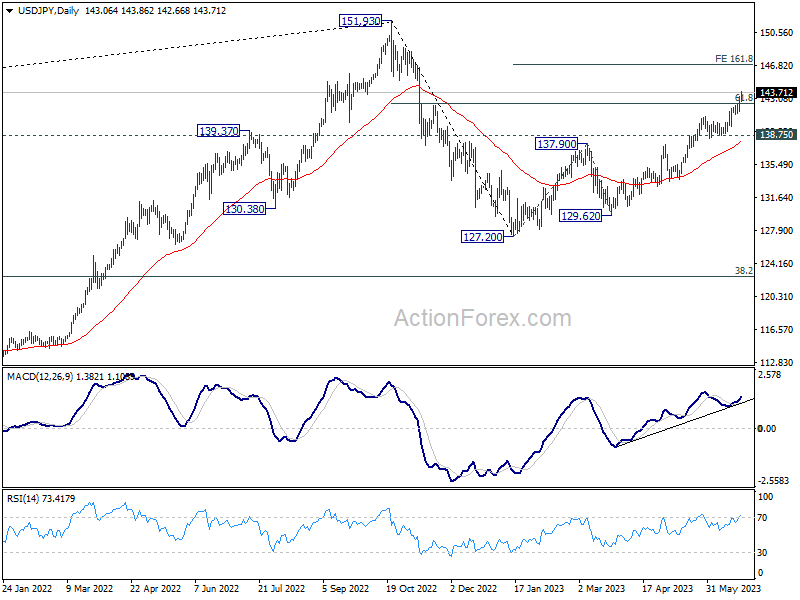
USD/JPY's rally from 127.20 extended to as high as 142.66 last week. From a pure technical point of view, the strong break of 61.8% retracement of 151.93 to 127.20 at 142.48 could now set the stage for retesting 151.93 high. In particular, USD/JPY could accelerate from here if 10-year yield manages to break through 3.859 resistance to resume recent rally. And in case of retreat, near term bullish should be retained as long as 138.75 support holds. But then of course, there is risk of intervention by Japan.
Aussie down with Hong Kong HSI and Copper
Australian Dollar ended the week as the worst performer, reversing nearly half of the gains made this earlier this month, on a couple of developments. RBA minutes indicated that a hold was indeed considered at last meeting, and the arguments were finely balanced. That raised some doubts regarding the chance of another rate hike in July, and made the coming monthly CPI reading crucial.
Then Aussie was dragged down by selloff in Yuan and stocks in China and Hong Kong. The impact of PBoC's rate cut has been very brief and mild. The rumors regarding massive stimulus from the Chinese government didn't really realize.
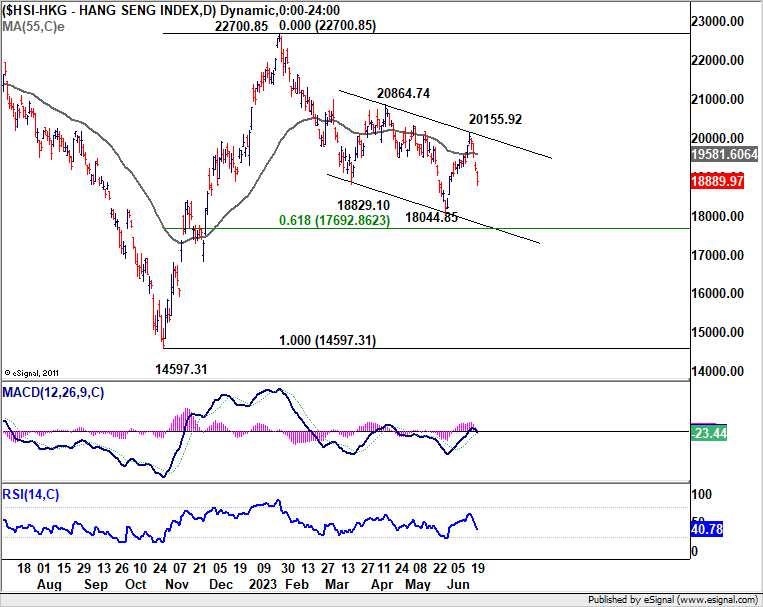
Hong Kong HSI's steep decline last week suggests that rebound from 18044.85 has completed at 20155.92, after rejection by medium term channel resistance. More importantly, the down trend from 22700.85 is probably still in progress, and it's now in favor to continue through 18044.85 to 61.8% retracement of 14597.31 to 22700.85 at 17692.86 before completion.
In corresponding development, Copper also tumbled notably on worries regarding China's economic recovery. While rebound from 3.5393 was stronger than expected, it appeared to have faced strong resistance from 50% retracement of 4.3556 to 3.5393. Immediate focus is back on 3.7341 support in the coming days. Break there will argue that whole down trend from 4.3556 is ready to resume through 3.5393 low.
Extended decline in HSI and Copper will put additional pressure to Aussie.

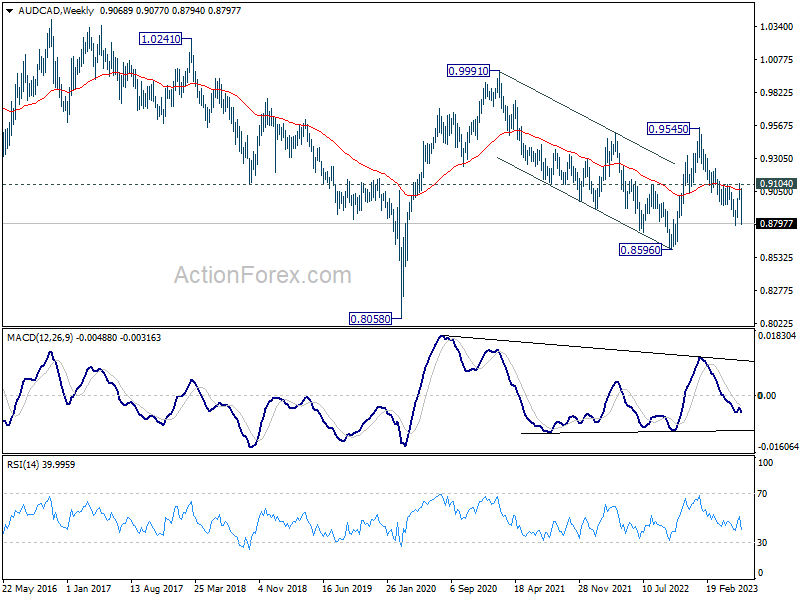
AUD/CAD was the top mover last week, losing as much as -3.15%. the development should confirmed that rebound from 0.8781 has completed at 0.9114, after rejection by 0.9104 resistance.
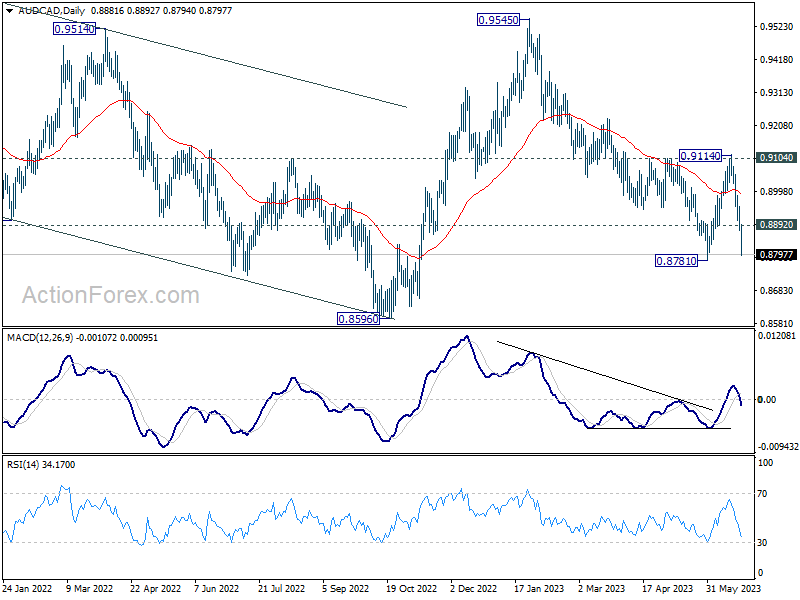
Immediate focus is now on 0.8781 support in the coming days. Firm break there will resume whole down trend from 0.9545 to retest 0.8595 low. There is prospect of resuming whole down trend from 0.9991 (2021 high) in this bearish scenario.
Nevertheless, rebound from current level, followed by break of 0.8892 minor resistance will turn bias neutral first.
AUD/USD Weekly Report
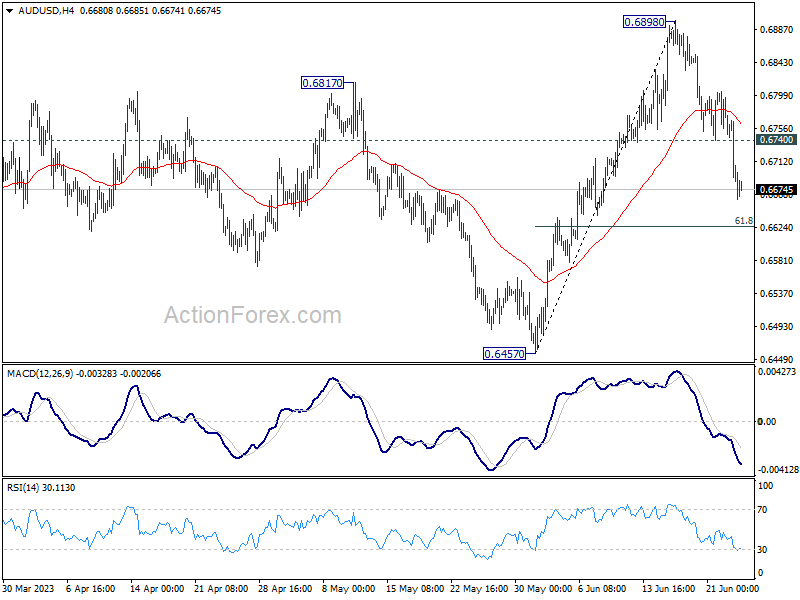
AUD/USD's steep decline last week mixed up the near term outlook. But for now, further fall is in favor this week as long as 0.6740 minor resistance holds. Next target is 61.8% retracement of 0.6457 to 0.6898 at 0.6625. On the upside, above 0.6740 will turn intraday bias neutral first.
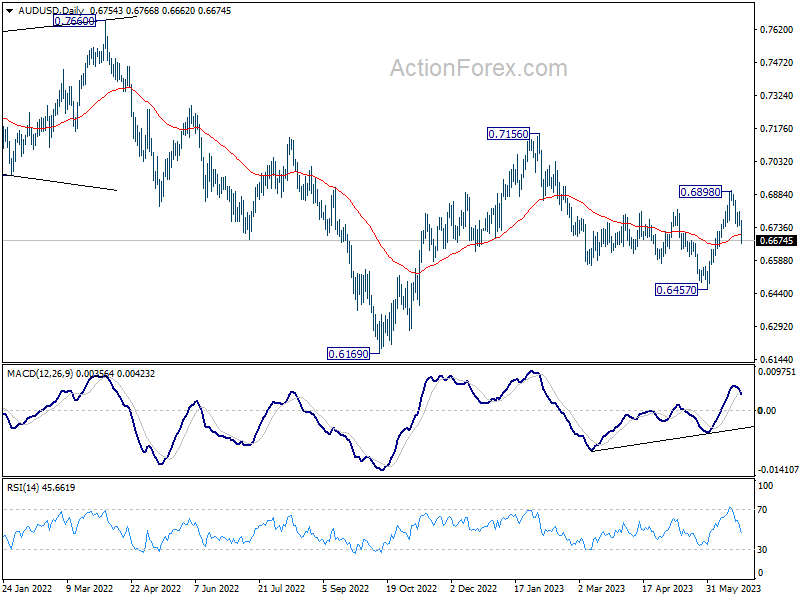
In the bigger picture, price actions from 0.7156 are seen as a correction to the rebound from 0.6169 for now. Break of 55 D EMA (now at 0.6701) raises the chance that it's in progress. Break of 0.6457 will resume the fall form 0.7156. On the upside, though, break of 0.6898 resistance will argue that rise form 0.6169 is ready to resume through 0.7156.
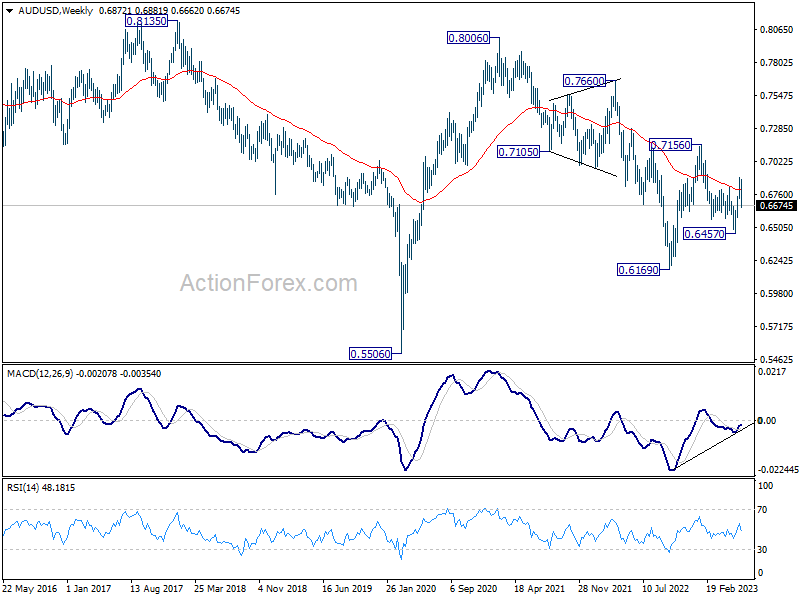
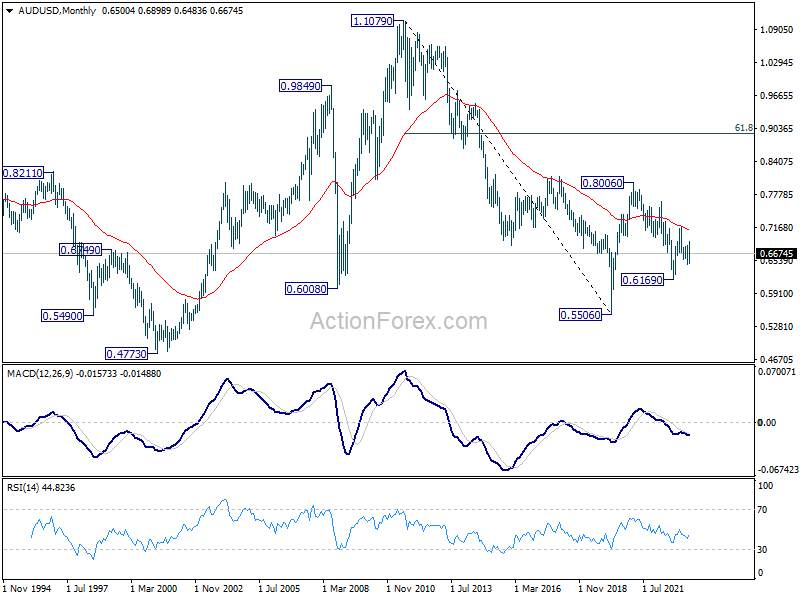
In the long term picture, focus is back on 55 M EMA (now at 0.7119), which is relatively close to 0.7156 resistance. Rejection by this level will maintain medium term bearishness for resuming the down trend from 0.8006 (2021 high) at a later stage. However, sustained break there will argue that the trend has reversed, and rise from 0.5506 (2020 low) might be on track to resume.
EUR/USD Weekly Outlook
EUR/USD's late decline last week suggests that a short term top was formed at 1.1011 on bearish divergence condition in 4H MACD. Decline from there is tentatively viewed as the third leg of the corrective pattern from 1.1094. Initial bias is now on the downside this week. Sustained break of 55 D EMA (now at 1.0838) will target 1.0634 support and below. Nevertheless, rebound from current level, followed by break of 1.1011 will target a test on 1.1094 high instead.
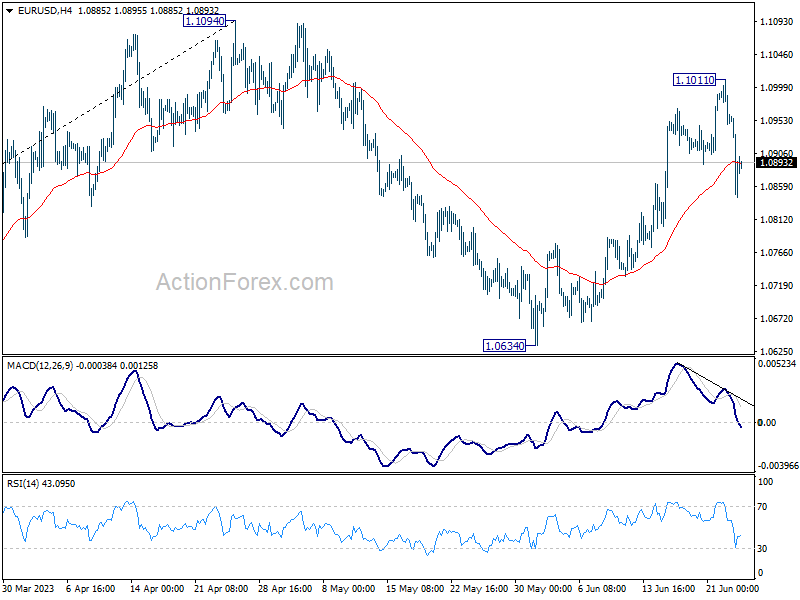
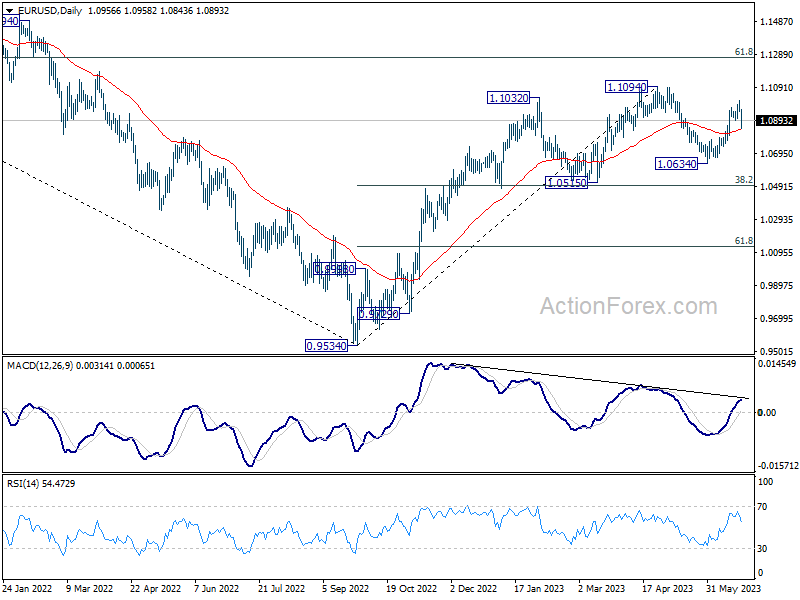
In the bigger picture, as long as 1.0515 support holds, rise from 0.9534 (2022 low) would still extend higher. Sustained break of 61.8% retracement of 1.2348 (2021 high) to 0.9534 at 1.1273 will solidify the case of bullish trend reversal and target 1.2348 resistance next (2021 high).
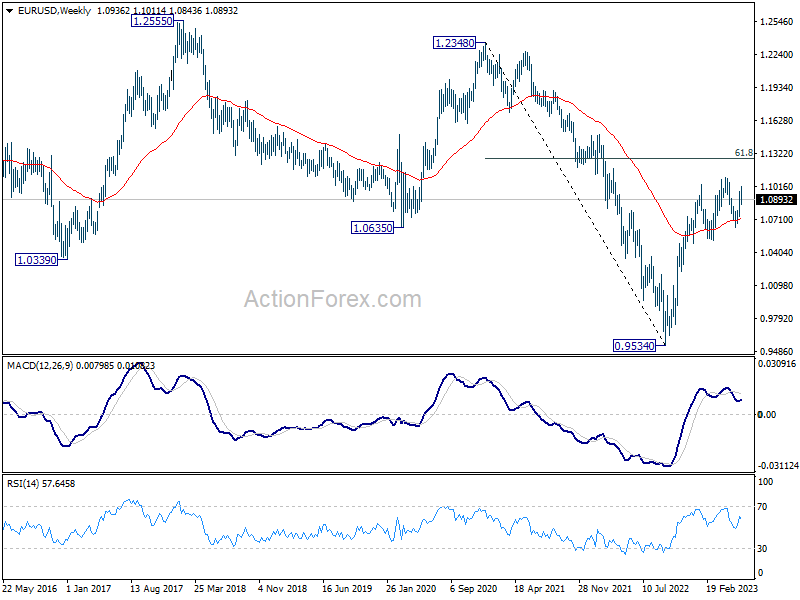
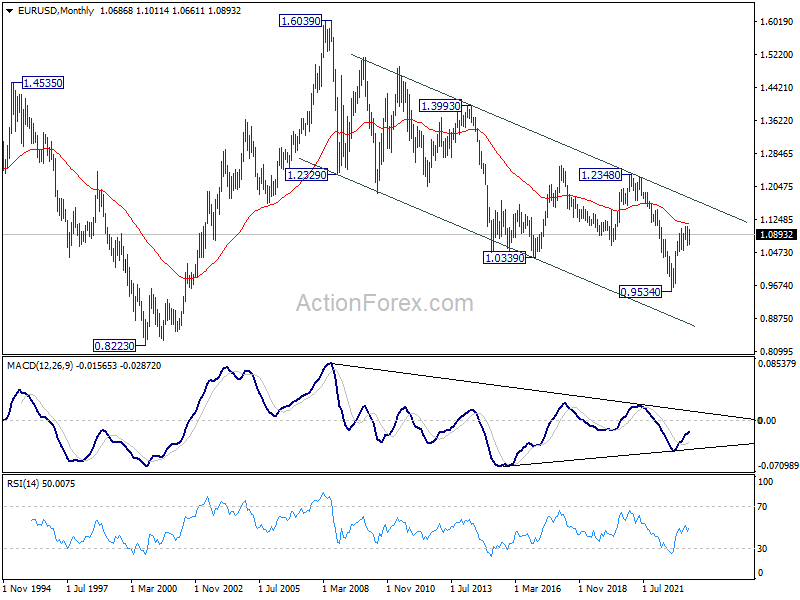
In the long term picture, focus stays on 55 M EMA (now at 1.1131). Rejection by this EMA will revive long term bearishness. However, sustained break above here will be affirm the case of long term bullish reversal and target 1.2348 resistance for confirmation.
USD/JPY Weekly Outlook
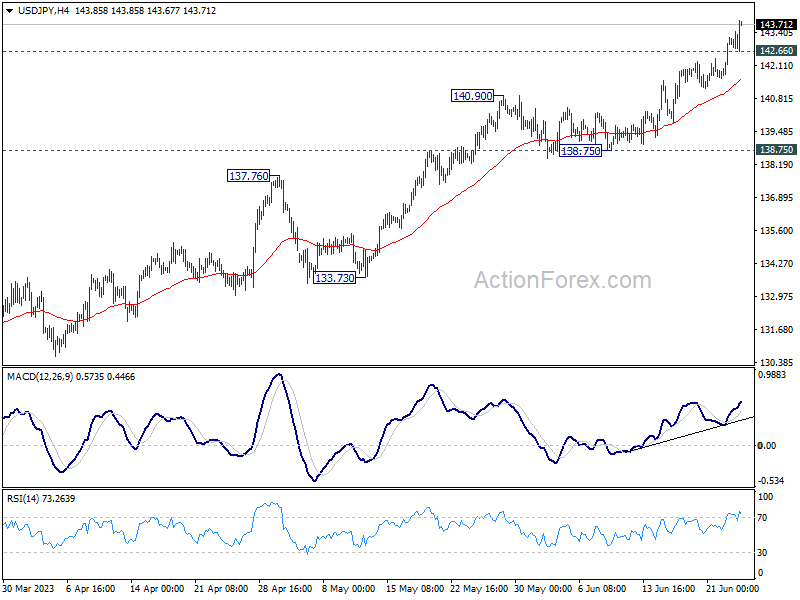
USD/JPY's rally from 127.20 continued last week and hit as high as 143.86. Initial bias stays on the upside this week for 161.8% projection of 127.20 to 137.90 from 129.62 at 146.93. On the downside, below 142.66 minor support will turn intraday bias neutral first. But further rally will now remain in favor as long as 137.90 resistance turned support holds.
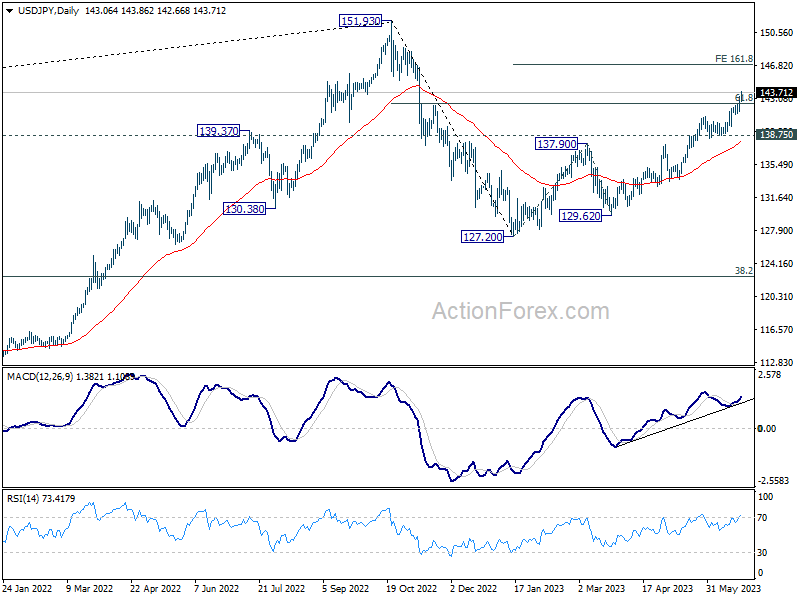
In the bigger picture, rise from 127.20 is currently seen as the second leg of the corrective pattern from 151.93 high. Further rally is expected as long as 137.90 resistance turned support holds, to retest 151.93. But strong resistance could be seen there to limit upside. Break of 137.90 will indicate the the third leg has started back towards 127.20.
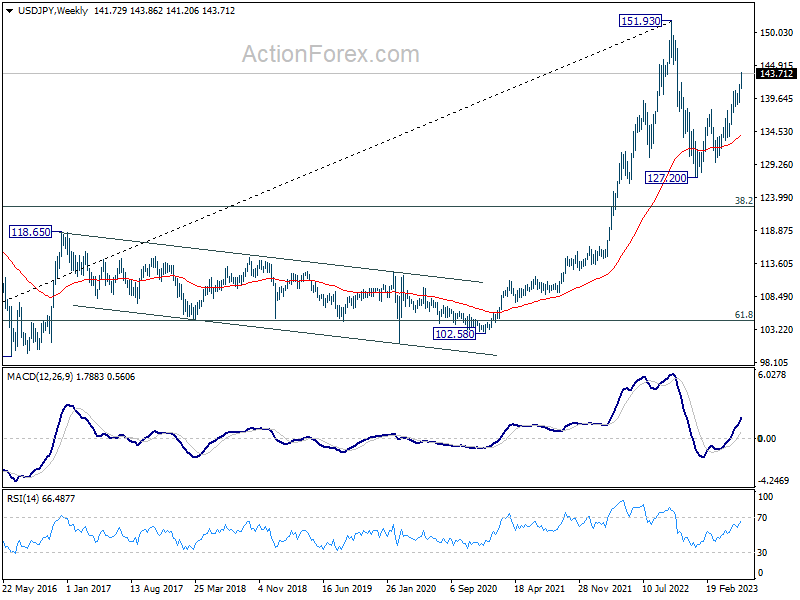
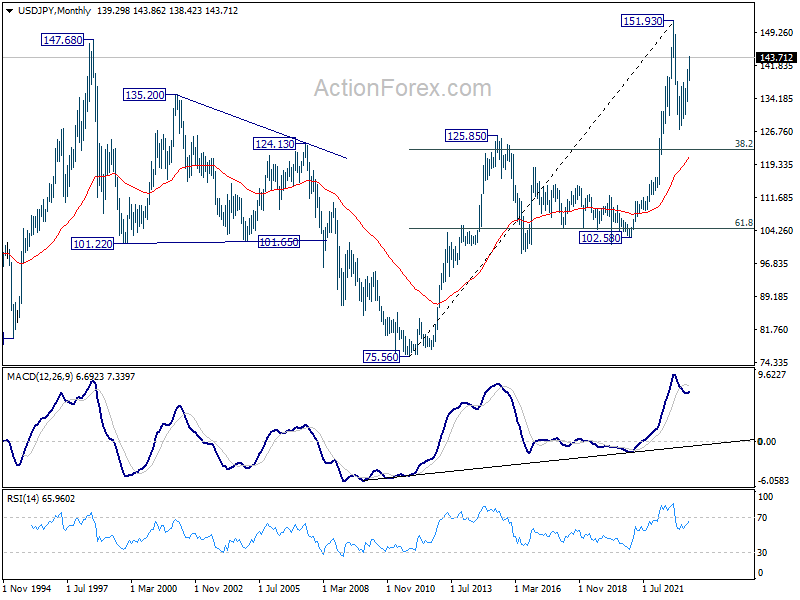
In the long term picture, price action from 151.93 is seen as developing into a corrective pattern to up trend from 75.56 (2011 low). While deeper decline cannot be ruled out, downside should be contained by 38.2% retracement of 75.56 to 151.93 at 122.75.
GBP/USD Weekly Outlook
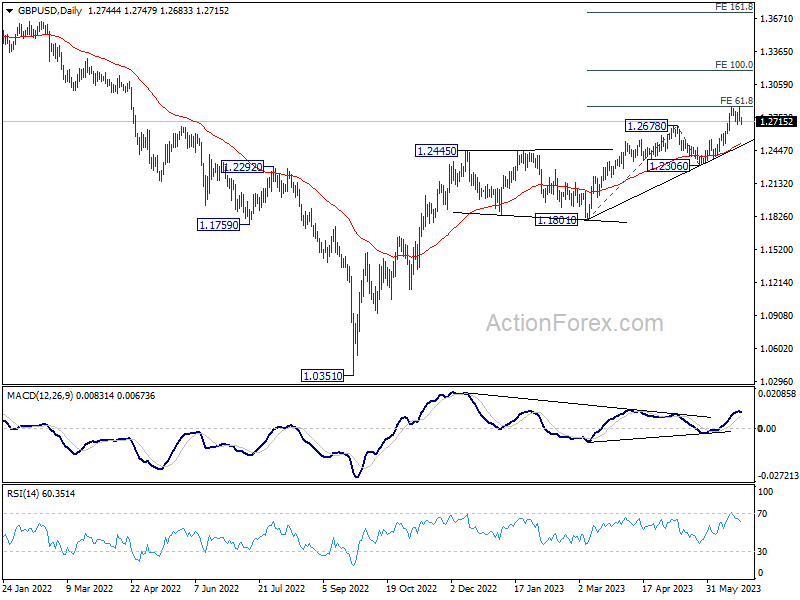
GBP/USD stayed in consolidation below 1.2847 last week and outlook is unchanged. Initial bias remains neutral this week first. Further rally is expected as long as 1.2628 support holds. On the upside, firm break of 1.2847 will resume larger up trend and target 100% projection of 1.1801 to 1.2678 from 1.2306 at 1.3183 next. However, firm break of 1.2628 will turn bias to the downside, for deeper fall to 1.2306 support instead.
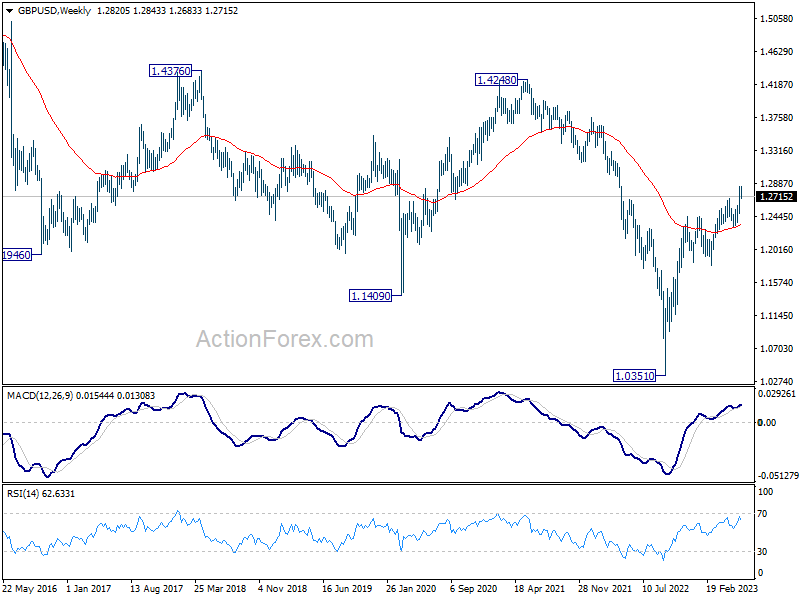
In the bigger picture, the strong support from 55 W EMA (now at 1.2341) is a medium term bullish sign. Outlook will stay bullish as long as 1.2306 support holds. Rise from 1.0351 medium term bottom (2022 low) is expected to extend further to retest 1.4248 key resistance (2021 high).
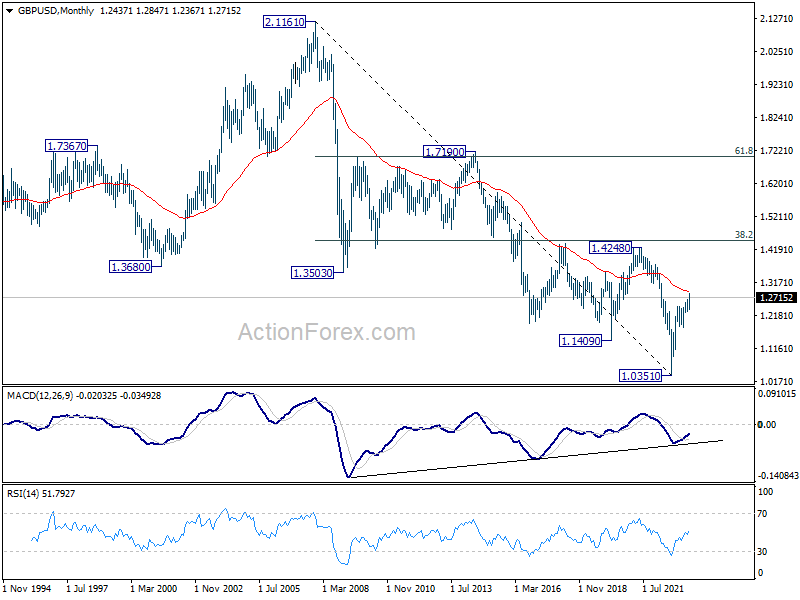
In the long term picture, immediate focus is on 55 M EMA (now at 1.2919). Sustained trading above there add to the case of long term bullish reversal. Nevertheless, break of 1.4248 resistance (2021 high), and 38.2% retracement of 2.1161 (2007 high) to 1.0351 at 1.4480 is needed to confirm. Otherwise, long term outlook is just neutral at best.
USD/CHF Weekly Outlook
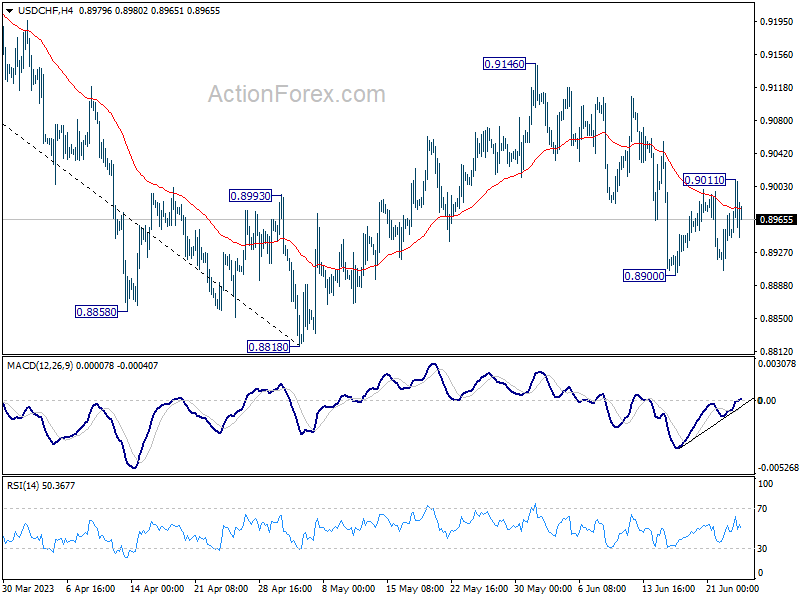
USD/CHF fell further to 0.8900 last week but turned sideway since then. Initial bias remains neutral this week first. On the upside, above 0.9011 will bring stronger rise towards 0.9146 resistance. On the downside, through, break of 0.8900 will target 0.8818 and possibly below.
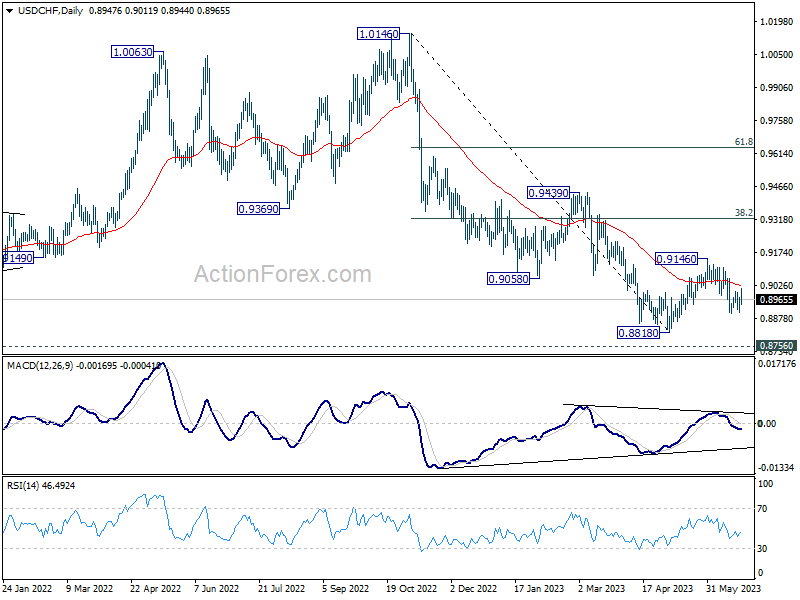
In the bigger picture, fall from 1.1046 (2022 high) is seen as a leg in the long term range pattern from 1.0342 (2016 high), which might have completed at 0.8818 already, just ahead of 0.8756 long term support. Sustained trading above 0.9058 support turned resistance should confirm medium term bottoming.
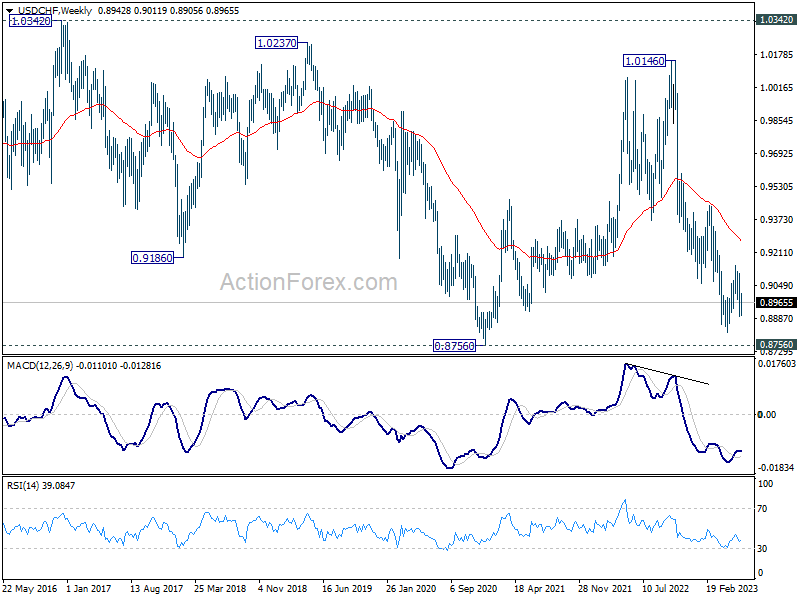
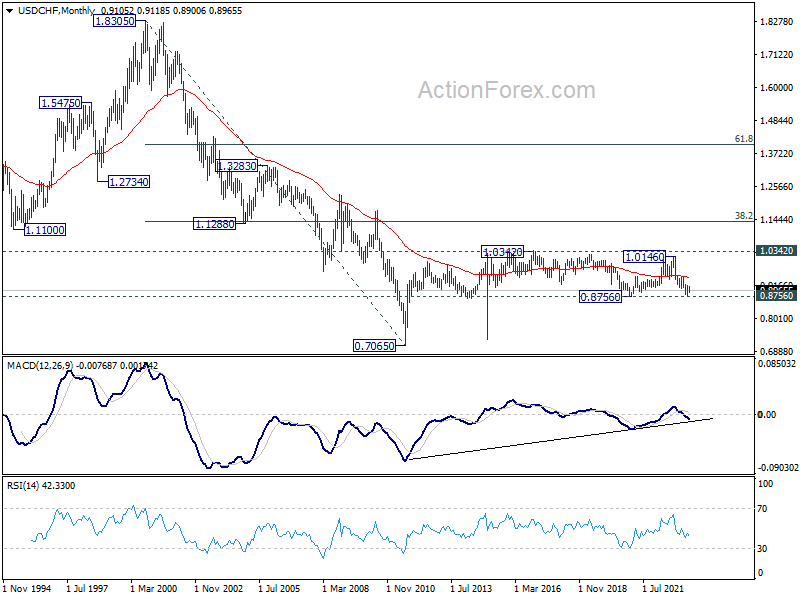
In the long term picture, long term sideway pattern from 1.0342 (2016 high) is expected to continue between 0.8756/1.0342. However, sustained break of 0.8756 will open up deeper fall back towards 0.7065 (2011 low).
AUD/USD Weekly Report
AUD/USD's steep decline last week mixed up the near term outlook. But for now, further fall is in favor this week as long as 0.6740 minor resistance holds. Next target is 61.8% retracement of 0.6457 to 0.6898 at 0.6625. On the upside, above 0.6740 will turn intraday bias neutral first.
In the bigger picture, price actions from 0.7156 are seen as a correction to the rebound from 0.6169 for now. Break of 55 D EMA (now at 0.6701) raises the chance that it's in progress. Break of 0.6457 will resume the fall form 0.7156. On the upside, though, break of 0.6898 resistance will argue that rise form 0.6169 is ready to resume through 0.7156.
In the long term picture, focus is back on 55 M EMA (now at 0.7119), which is relatively close to 0.7156 resistance. Rejection by this level will maintain medium term bearishness for resuming the down trend from 0.8006 (2021 high) at a later stage. However, sustained break there will argue that the trend has reversed, and rise from 0.5506 (2020 low) might be on track to resume.