

Sample Category Title
Germany Ifo down to 88.5, manufacturing weakness steering economy into turbulent waters
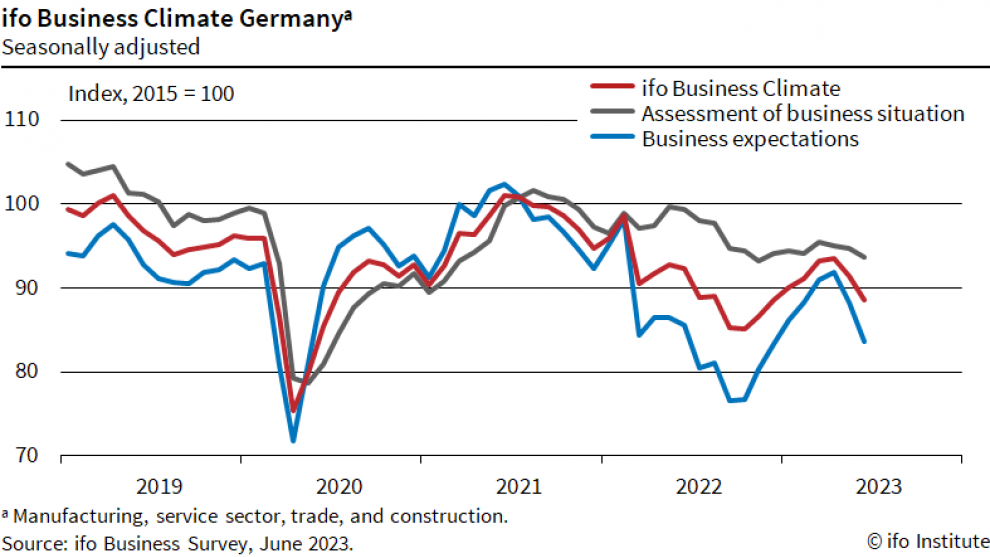
Germany Ifo Business Climate fell from 91.5 to 88.5 in June, below expectation of 91.2. Current Assessment Index dropped form 94.8 to 93.7, slightly above expectation of 93.5. Expectations Index tumbled further from 88.3 to 83.6, below expectation of 88.0.
By sector, manufacturing fell sharply from -0.1 to -6.6, lowest since November. Services dropped from 6.8 to 2.7. Trade edged down from -19.1 to -20.2. Construction decreased from -18.5 to -20.1.
Ifo said: "Sentiment in the German economy has clouded over considerably... Above all, the weakness in the manufacturing sector is steering the German economy into turbulent waters."
EUR/USD Daily Outlook
Daily Pivots: (S1) 1.0835; (P) 1.0903; (R1) 1.0960; More...
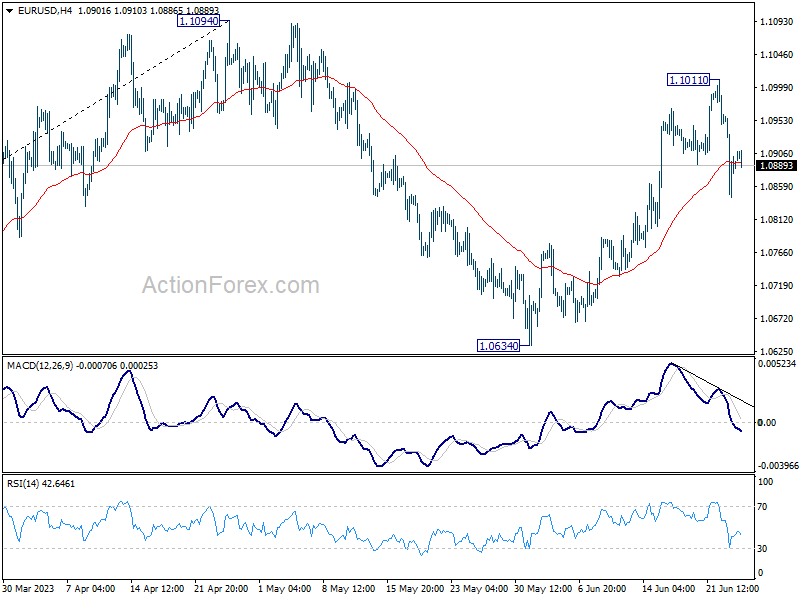
Intraday bias in EUR/USD stays mildly on the downside at this point. Fall from 1.1101 is seen as the third leg of the corrective pattern from 1.1094. Sustained break of 55 D EMA (now at 1.0838) will target 1.0634 support and below. Nevertheless, rebound from current level, followed by break of 1.1011 will target a test on 1.1094 high instead.
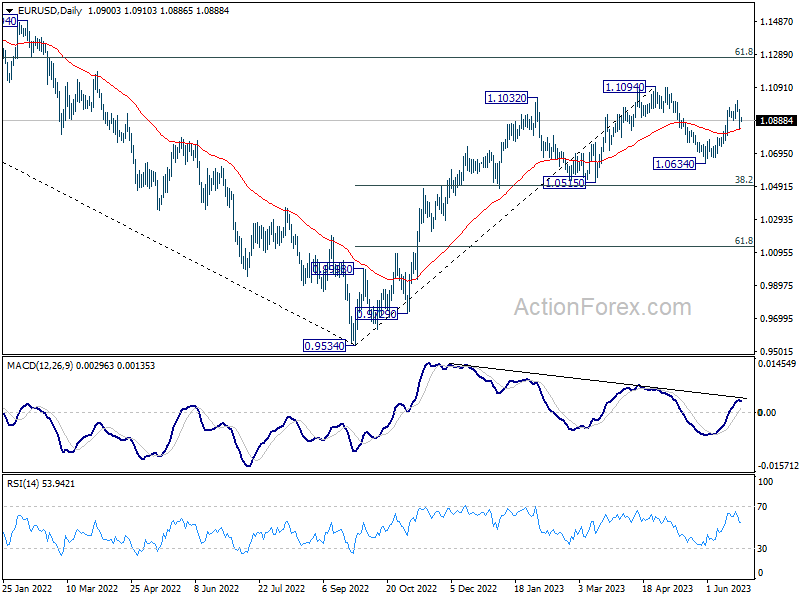
In the bigger picture, as long as 1.0515 support holds, rise from 0.9534 (2022 low) would still extend higher. Sustained break of 61.8% retracement of 1.2348 (2021 high) to 0.9534 at 1.1273 will solidify the case of bullish trend reversal and target 1.2348 resistance next (2021 high).
GBP/USD Daily Outlook
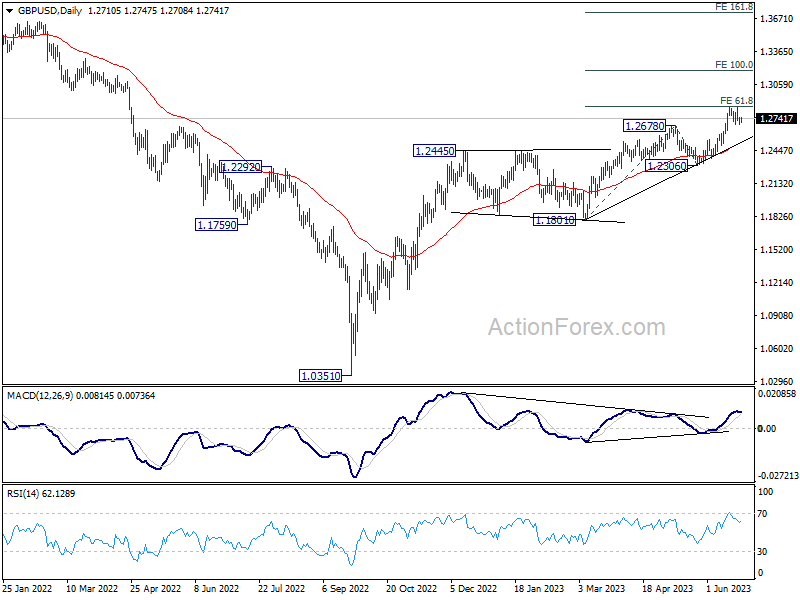
Daily Pivots: (S1) 1.2683; (P) 1.2719; (R1) 1.2753; More...
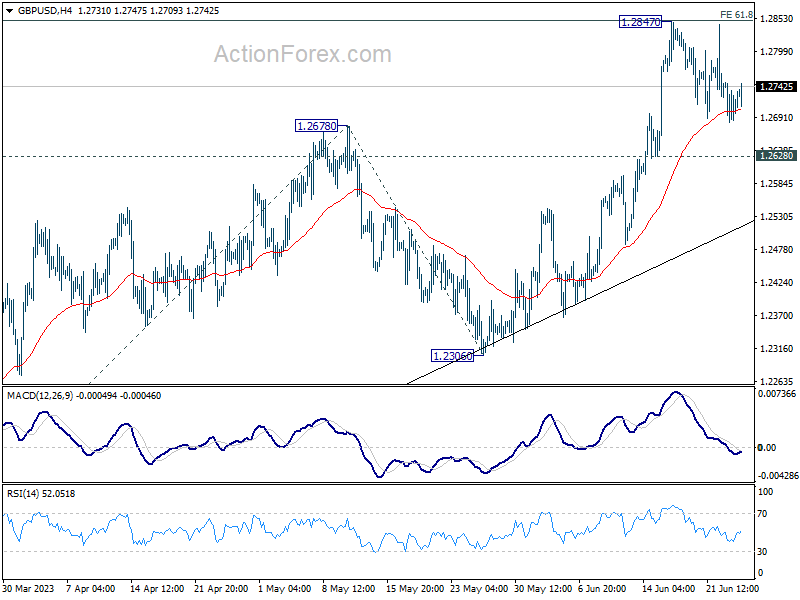
GBP/USD is extending the consolidation from 1.2847 and intraday bias stays neutral at this point. Further rally is expected as long as 1.2628 support holds. On the upside, firm break of 1.2847 will resume larger up trend and target 100% projection of 1.1801 to 1.2678 from 1.2306 at 1.3183 next. However, firm break of 1.2628 will turn bias to the downside, for deeper fall to 1.2306 support instead.
In the bigger picture, the strong support from 55 W EMA (now at 1.2341) is a medium term bullish sign. Outlook will stay bullish as long as 1.2306 support holds. Rise from 1.0351 medium term bottom (2022 low) is expected to extend further to retest 1.4248 key resistance (2021 high).
USD/JPY Daily Outlook
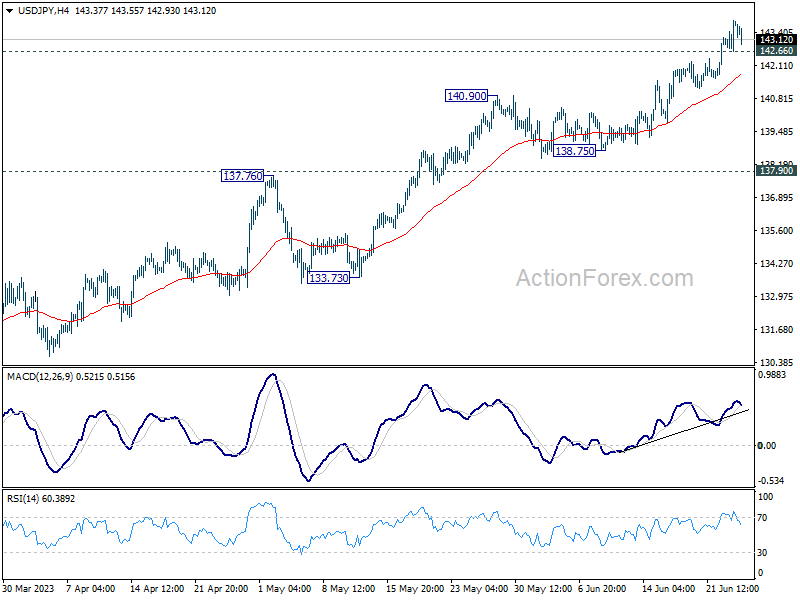
Daily Pivots: (S1) 143.03; (P) 143.45; (R1) 144.14; More...
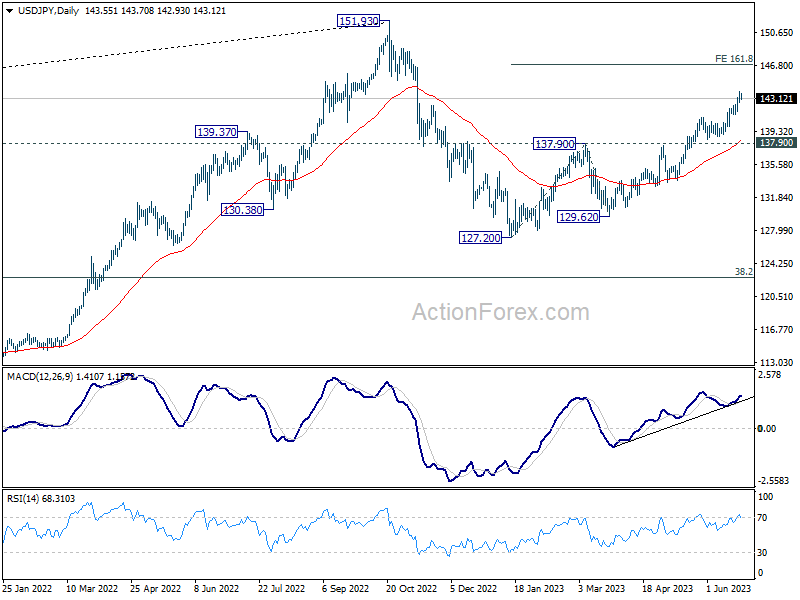
Intraday bias in USD/JPY stays on the upside and current rally from 127.20 should target 161.8% projection of 127.20 to 137.90 from 129.62 at 146.93. On the downside, below 142.66 minor support will turn intraday bias neutral first. But further rally will now remain in favor as long as 137.90 resistance turned support holds.
In the bigger picture, rise from 127.20 is currently seen as the second leg of the corrective pattern from 151.93 high. Further rally is expected as long as 137.90 resistance turned support holds, to retest 151.93. But strong resistance could be seen there to limit upside. Break of 137.90 will indicate the the third leg has started back towards 127.20.
USD/CHF Daily Outlook
Daily Pivots: (S1) 0.8934; (P) 0.8973; (R1) 0.9010; More...
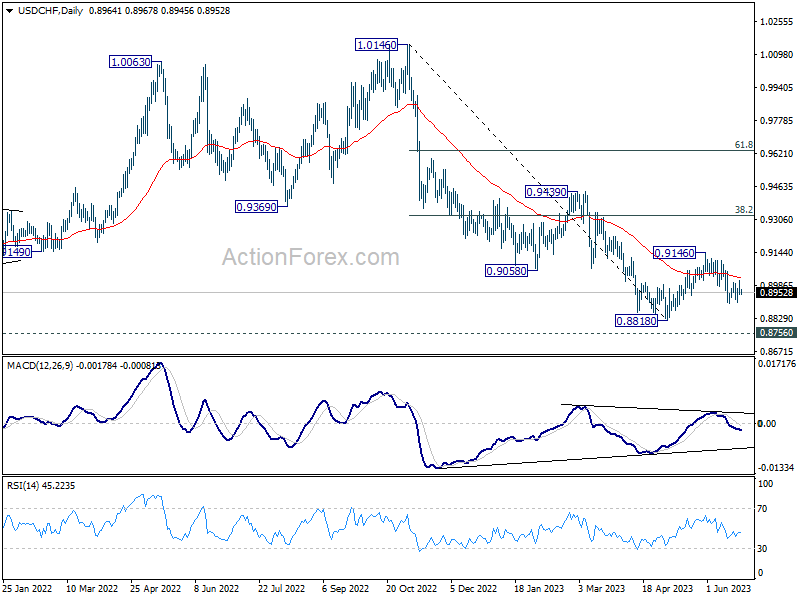
Intraday bias in USD/CHF remains neutral for the moment. On the upside, above 0.9011 will bring stronger rise towards 0.9146 resistance. On the downside, through, break of 0.8900 will target 0.8818 and possibly below.
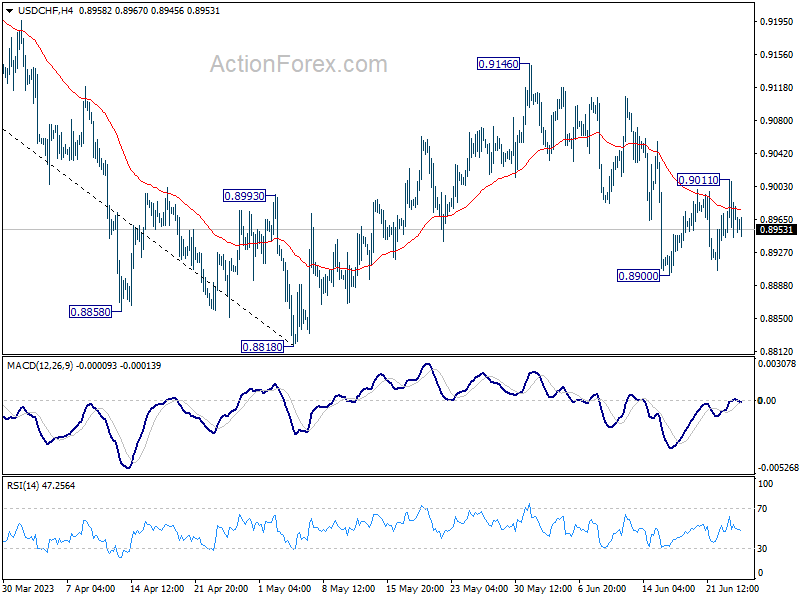
In the bigger picture, fall from 1.1046 (2022 high) is seen as a leg in the long term range pattern from 1.0342 (2016 high), which might have completed at 0.8818 already, just ahead of 0.8756 long term support. Sustained trading above 0.9058 support turned resistance should confirm medium term bottoming.
AUD/USD Daily Report
Daily Pivots: (S1) 0.6637; (P) 0.6703; (R1) 0.6742; More...
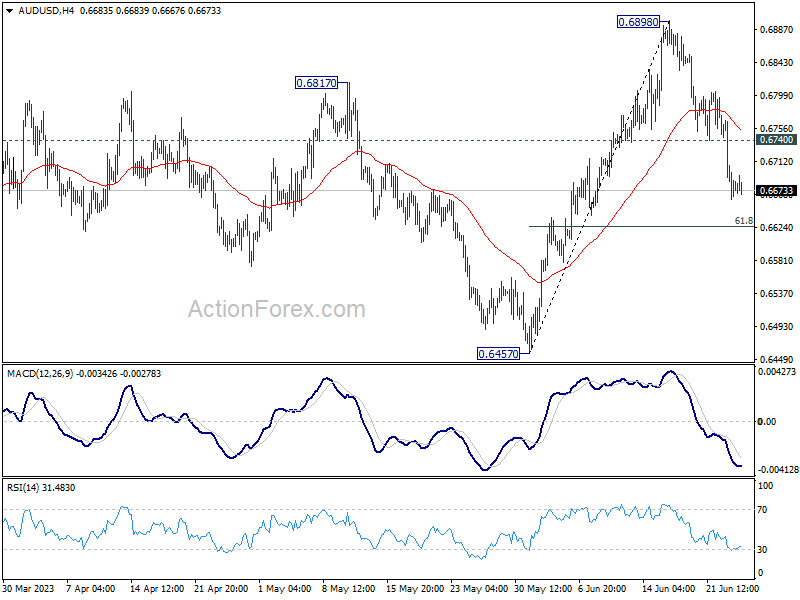
Intraday bias in AUD/USD remains on the downside at this point. Fall from 0.6898 would target 61.8% retracement of 0.6457 to 0.6898 at 0.6625. Sustained break there would bring deeper decline back to 0.6457 support. On the upside, above 0.6740 will turn intraday bias neutral first.
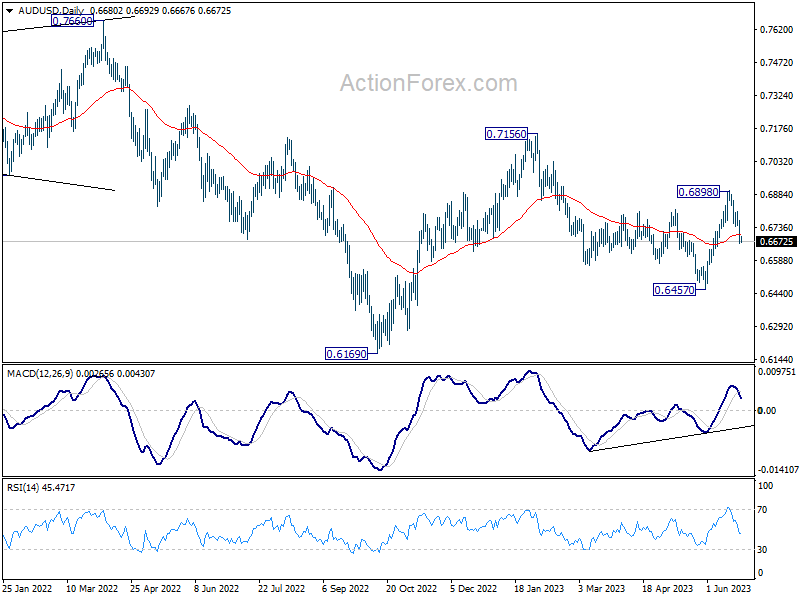
In the bigger picture, price actions from 0.7156 are seen as a correction to the rebound from 0.6169 for now. Break of 55 D EMA (now at 0.6701) raises the chance that it's in progress. Break of 0.6457 will resume the fall form 0.7156. On the upside, though, break of 0.6898 resistance will argue that rise form 0.6169 is ready to resume through 0.7156.
GBP/USD Eyes Fresh Increase, USD/CAD Could Extend Losses
GBP/USD faced resistance near 1.2845 and started a downside correction. USD/CAD is struggling below 1.3210 and might decline further.
Important Takeaways for GBP/USD and USD/CAD
- The British Pound started a downside correction below the 1.2845 zone.
- There is a key bearish trend line forming with resistance near 1.2740 on the hourly chart of GBP/USD at FXOpen.
- USD/CAD declined below the 1.3210 and 1.3185 support levels.
- A connecting bearish trend line is forming with resistance near 1.3185 on the hourly chart at FXOpen.
GBP/USD Technical Analysis
On the hourly chart of GBP/USD at FXOpen, the pair was able to climb above the 1.2800 resistance zone. However, the bears were active near the 1.2845 zone.
As a result, the pair started a downside correction below the 1.2780 and 1.2740 support levels. The pair even spiked below 1.2700 before the bulls appeared near 1.2690. A low is formed near 1.2684 and the pair is now consolidating losses.
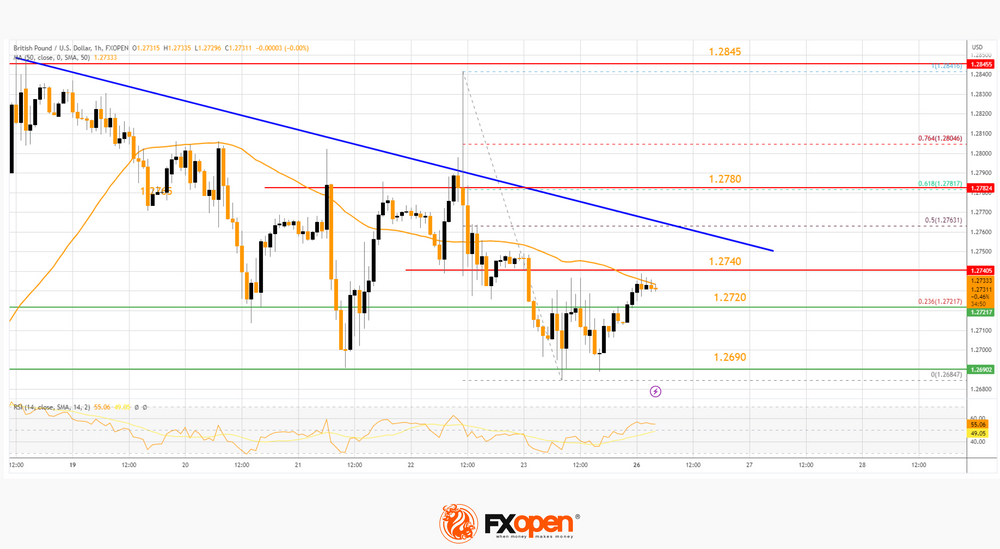
There was a move above the 23.6% Fib retracement level of the downward move from the 1.2841 swing high to the 1.2684 low. Immediate resistance on the GBP/USD chart is forming near the 50-hour simple moving average at 1.2732.
The next resistance is near a key bearish trend line at 1.2740. An upside break above the 1.2740 zone, the pair could rise toward 1.2780. It coincides with the 61.8% Fib retracement level of the downward move from the 1.2841 swing high to the 1.2684 low.
Any more gains might open the doors for a test of 1.2845. On the downside, initial support is near the 1.2720 area. The next major support is near the 1.2690 level. If there is a break below 1.2690, the pair could extend its decline. The next key support is near the 1.2640 level. Any more losses might call for a test of the 1.2580 support.
USD/CAD Technical Analysis
On the hourly chart of USD/CAD at FXOpen, the pair started a fresh decline from the 1.3240 resistance zone. The US Dollar gained bearish momentum below the 1.3210 support against the Canadian Dollar.
The bears were able to push the pair below the 50% Fib retracement level of the upward move from the 1.3138 swing low to the 1.3225 high. It is now trading below the 50-hour simple moving average.
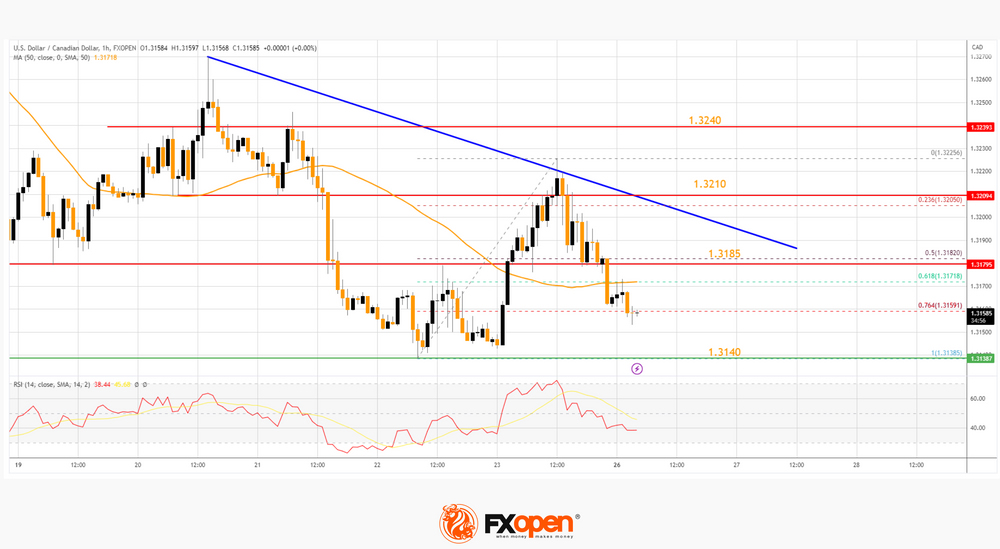
It is also showing bearish signs below the 76.4% Fib retracement level of the upward move from the 1.3138 swing low to the 1.3225 high. Immediate support is near the 1.3140 level. A close below the 1.3140 level might trigger a strong decline.
In the stated case, USD/CAD might test 1.3100. Any more losses may possibly open the doors for a drop toward the 1.3040 support.
On the upside, the pair is facing resistance near a connecting bearish trend line at 1.3185. If there is an upside break above the trend line, the pair could rise toward the 1.3210 resistance.
If the bulls pump USD/CAD above the 1.3210 resistance, there might be a decent increase toward the 1.3240 level. The next major resistance is near the 1.3280 level, above which it could rise steadily toward the 1.3335 resistance zone.
Price of Bitcoin Updates Maximum of the Year, What’s Next?
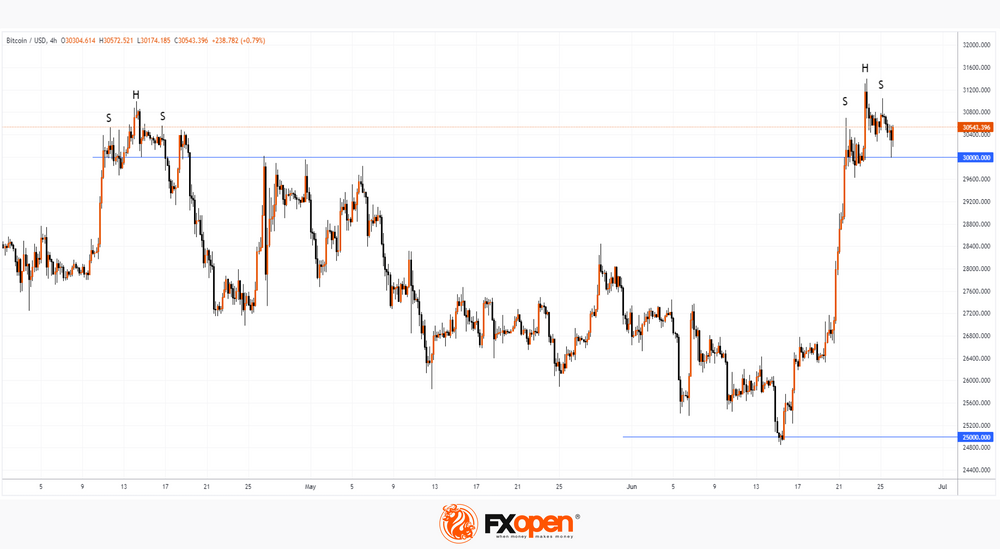
After skyrocketing last week for the 3 reasons we wrote about earlier, the price of bitcoin hit a 2023 high on Friday, surpassing USD 31,400 per bitcoin. This was facilitated by the news that the SEC approved the first exchange-traded fund (ETF) of bitcoin futures with leverage.
In April, the bulls were already above the psychological level of USD 30k per bitcoin, but after that a pullback followed, culminating in the price dropping below the psychological level of USD 25k per bitcoin. The BTC/USD market once again emphasized the emotionality of its participants — this is how you can interpret the tendency of the bitcoin exchange rate to the US dollar to make reversals after the breakdown of psychological levels.
What will happen next? Will the price of bitcoin follow the June breakdown according to the rollback scenario that was realized after the April breakdown? The probability of this is indicated by the bearish SHS patterns (head-and-shoulders), which formed when the price of bitcoin exceeded the level of 30k. You may also have deja vu, as the 2 peaks above 30k in 2023 resemble the 2 peaks (in April and November) above 60k in 2021.
The ability of the price of bitcoin to recover from declines under the 30k level (if any) will give more evidence that the bull market is indeed sustainable.
Gold Price Takes a Breather But Bearish Pressure Persists
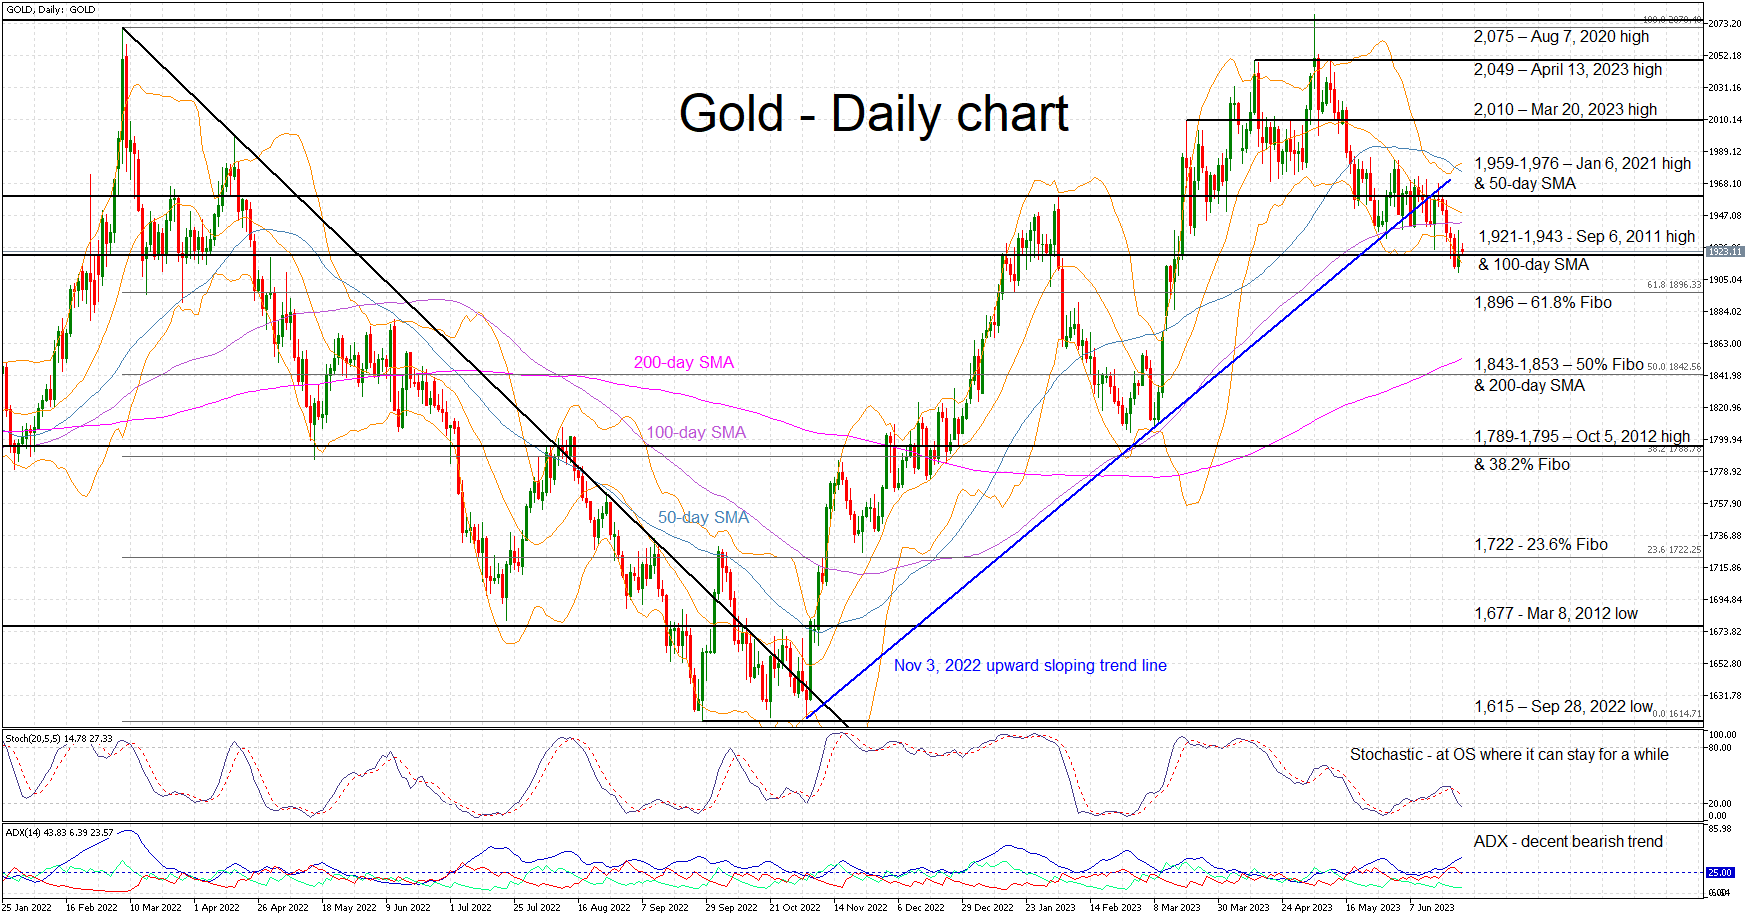
Gold is hovering inside the 1,921-1,943 area, a tad above its 3-month low and around 7.5% lower than the May 5, 2023 high of 2,079. The bulls are anxiously trying to put a temporary stop to the current short-term bearish trend and the bearish series of lower highs and lower lows.
The momentum indicators are still mostly on the bears’ side. The Average Directional Movement Index (ADX) is pointing to a bearish trend, the strongest one since the February-March 2023 correction, and the stochastic oscillator has just moved to its oversold (OS) territory. Although it can stay inside its OS area for a while, allowing gold to record lower lows, this drop is also an early sell-off exhaustion sign.
Should the bears decide to push the gold price even lower, they would quickly try to break the 1,921-1,943 area defined by the September 6, 2011 high and the 100-day simple moving average (SMA). Lower, the 61.8% Fibonacci retracement of March 8, 2022 – September 28, 2022 downtrend at 1,896 is unlikely to trouble the bulls as they would then set their eyes on the key 1,843-1,853 area.
On the other hand, the bulls would love to keep gold above 1,943 and gradually target the busier 1,959-1,976 area that is populated by January 6, 2021 high and the 50-day SMA. If successful, they would then have the chance to record a higher high, breaking the recent bearish pattern of lower highs, and open the door to a move above the 2,000 threshold.
To sum up, the bulls are trying to put a temporary stop to gold’s freefall by defending the 1,921-1,943 level, but there is still some gas left in the bearish tank.
Geopolitical Chaos, FX Intervention, and US Banks’ Stress Test Results
- Russia’s weekend mutiny cast doubts on Putin’s grip on power.
- No major impact on markets but keep a lookout on Gold, which bounced off the key support zone of US$1,913/1,896 per ounce.
- Stern FX verbal intervention from Japan’s top currency official. Watch USD/JPY key near-term support at 142.50/25.
- US banking stocks tumbled ahead of annual key Fed’s banks’ stress test results
Before the start of this new trading week, market participants were being jolted from their weekend leisure activities to shift their focus to the internal coup in Russia that may put President Putin’s power grip in jeopardy.
Yevgeny Prigozhin, leader of the Wagner Group, a Russian key independent military contractor that has played a significant role in the ongoing Russia-Ukraine territorial conflict voiced displeasure with Russia’s top leadership in handling the Russia-Ukraine situation, took over two Russian cities and order his mercenaries to march towards Moscow on Saturday.
Russia’s weekend mutiny started fast and ended fast
Upon reaching 200 km within Moscow, Prigozhin’s troops halted and made a U-turn back to their field camps. In addition, Putin dropped earlier treason charges on the Wagner Group and allowed Prigozhin to head to Belarus, Russia’s western neighbour for exile.
In less than 48 hours, the mutiny in Russia is over without any clear details on what has transpired that led to Prigozhin’s retreat as Putin has not made any official speech or press conference yet. US Secretary of State Blinken commented that the weekend’s uprising by Prigozhin, a former Putin royalist has posed a direct challenge to Putin’s grip on power in Russia and provided a battlefield advantage to Ukraine.
On the other hand, several geopolitical commenters have analyzed the situation to be in favour of Putin in which Wagner Group’s mutiny may be used as a cover for Putin to remove the top brass in Russia’s Ministry of Defence; Shoigu, the defence minister and Gerasimov, chief of the general staff as they posed a threat to Putin’s rule. Thus, the change of Russia’s military leadership may be part of the “deal” package that the Kremlin and Prigozhin agreed on.
No significant movements in markets but watch gold
In today’s Asian session, both the S&P 500 and Nasdaq 100 e-mini futures were up slightly by around +0.20% after posting their worst weekly losses last week in three months. Major Asian stock indices were mixed at this time of the writing, Nikkei 225 (-0.24%), Kospi 200 (+0.60%), Hang Seng Index (-0.14%), Hang Seng China Enterprises Index (+0.13%), and CSI 300 (-0.70%).
The US dollar is almost unchanged on average with the US Dollar Index inching down by a meagre -0.1%. Gold, a traditional safe haven asset that tends to benefit in light of major geopolitical risks upheaval in the past has exhibited some interesting price actions movement from a technical analysis perspective.
Gold’s decline has managed to bounce off from a key support zone of US$1,913/1,896 per ounce
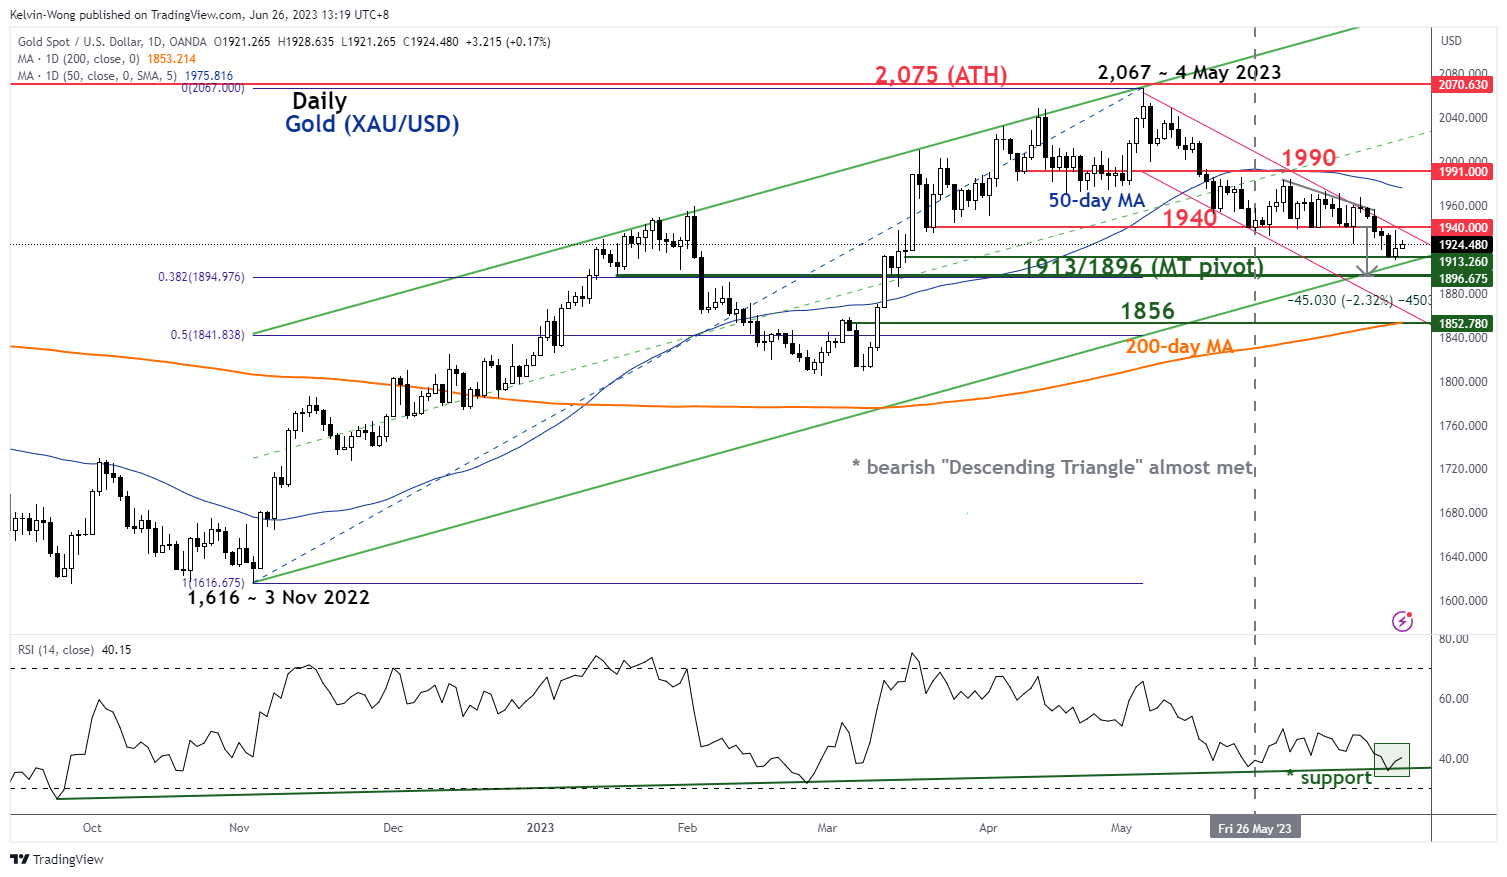
Fig 1: Gold (XAU/USD) medium-term trend as of 26 Jun 2023 (Source: TradingView, click to enlarge chart)
Last week’s decline seen in Gold (XAU/USD) has led its price actions to hit a crucial medium-term pivotal support zone of US$1,913/US$ 1,896 per ounce (printed an intraday low of US$1,910 last Friday, 23 June) which is being defined by a confluence of elements; the lower boundary of the medium-term ascending channel in place since 3 November 2022 low, 38.2% Fibonacci retracement of the prior medium-term up move from 3 November 2022 low to 4 May 2023 high, and approximately the downside price objective of recent “Descending Triangle” bearish breakdown.
Momentum has also improved as the daily RSI oscillator has managed to stage a bounce off the key corresponding support at the 36 level. Watch the US$1,896 key medium-term pivotal support and a clearance above US1,940 intermediate resistance sees the next resistance coming in at US$1,990 (also the 50-day moving average).
FX verbal intervention from Japan
After a strong upside movement seen in the USD/JPY that recorded a weekly gain of +1.3% last week which outperformed other major USD crosses, the US Dollar Index only rose by +0.56% over the same period, Japan’s Vice Finance Minister Masato Kanda, a top currency official that has oversight over foreign exchange market matters has sounded the alarm in today’s morning Asian session.
Based on a Reuters report, Kanda said that the authorities will respond to any excessive moves in the foreign exchange market, warned that the recent yen moves were rapid and will not rule out any chance of an FX intervention.
He said, “Regardless of the direction, it’s generally not good for the economy if exchange rates move excessively in a way that deviates from economic fundamentals.” Today’s verbal intervention was the most pronounced made by any of Japan’s finance ministry officials in the past month when USD/JPY sailed past the prior 141.00 and 142.00 psychological levels “effortlessly”.
USD/JPY has shed -0.2% intraday and broke key near-term support at 143.45 at this time of the writing, the next support to watch will be at 142.50/25 (former swing highs of 11/21/22 November 2022).
Fed’s annual banks stress test results out on Wednesday
The US Federal Reserve will unveil the results of its annual stress tests on the 23 biggest US banks on Wednesday, 28 June. The key focus will be on a section of the test, labelled as “exploratory market shock”, this is the first time such a test is being conducted on the trading books of the largest US banks.
The urgency and significance of the “exploratory market shock” stress test come after the US regional banks’ turmoil. Hence, monitoring of fixed income duration risk is paramount now given that the latest Fed’s hawkish monetary policy guidance is to keep interest rates higher for a longer period.
Last week, the US banking stocks shed by -6.80% as indicated by the SPDR S&P Bank exchange-traded fund, its worse weekly performance in seven weeks and underperformed the S&P 500.
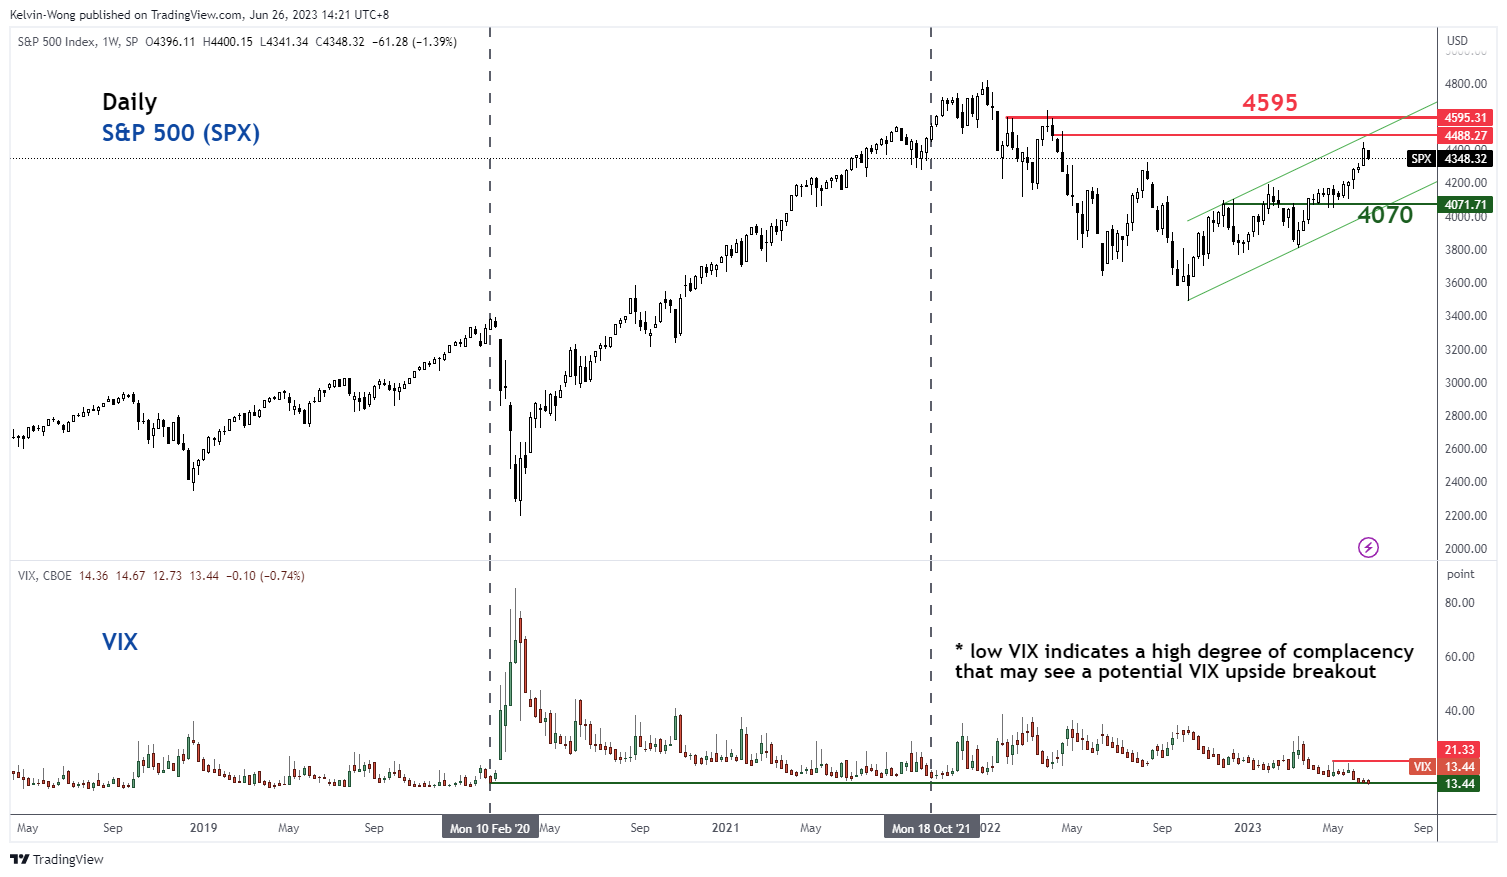
Fig 2: S&P 500 major trend with VIX as of 26 Jun 2023 (Source: TradingView, click to enlarge chart)
If the “exploratory market shock” stress test results come in unfavourable, it may put more downside pressure on US banking stocks which in turn may trigger a volatility upside breakout in the VIX, a measurement of implied volatility on the S&P 500 as it has compressed to a low level of 13.44 not seen since early February 2020 before the pandemic. A sudden spike in VIX may dampen the current bullish mood for US stock indices.