Sample Category Title
USD/JPY Daily Outlook
Daily Pivots: (S1) 139.50; (P) 139.89; (R1) 140.49; More...
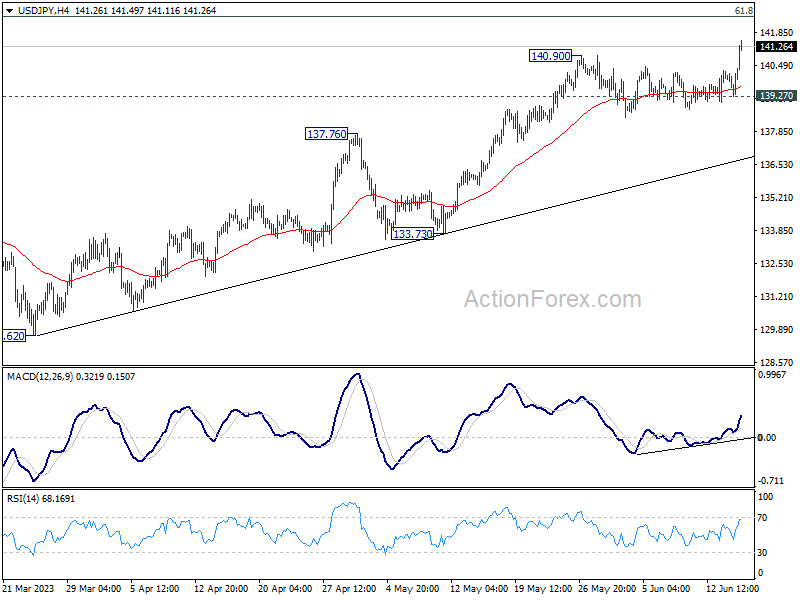
USD/JPY's rally resumed by breaking through 140.90 resistance. Intraday bias is back on the upside. Current rise from 127.20 should now target 142.48 fibonacci level next. For now, outlook will continue to stay bullish as long as 139.27 support holds, in case of retreat.
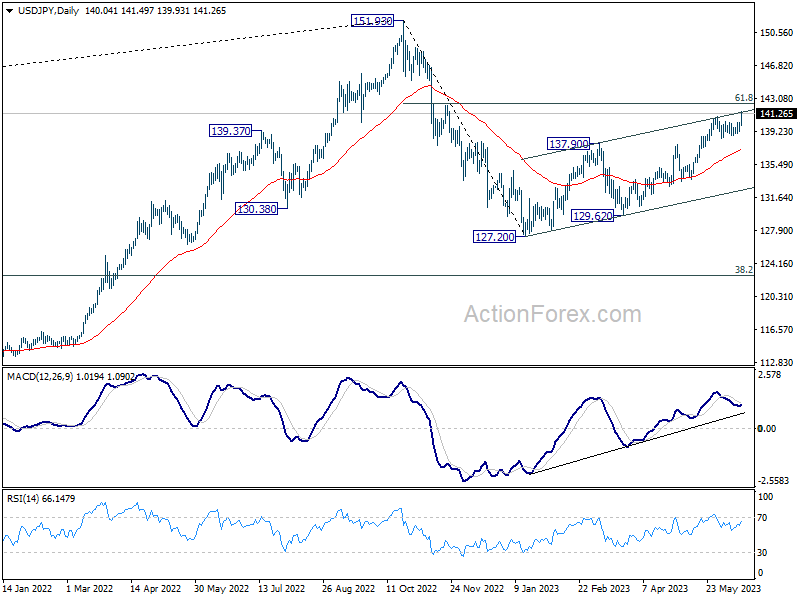
In the bigger picture, rise from 127.20 is seen as the second leg of the corrective pattern from 151.93 high. Stronger rally would be seen to 61.8% retracement of 151.93 to 127.20 at 142.48. Sustained break there will pave the way back to retest 151.93. On the downside, however, break of 133.73 support will argue that the pattern could have started the third leg through 127.20 low.
AUD/USD Daily Report
Daily Pivots: (S1) 0.6755; (P) 0.6796; (R1) 0.6835; More...
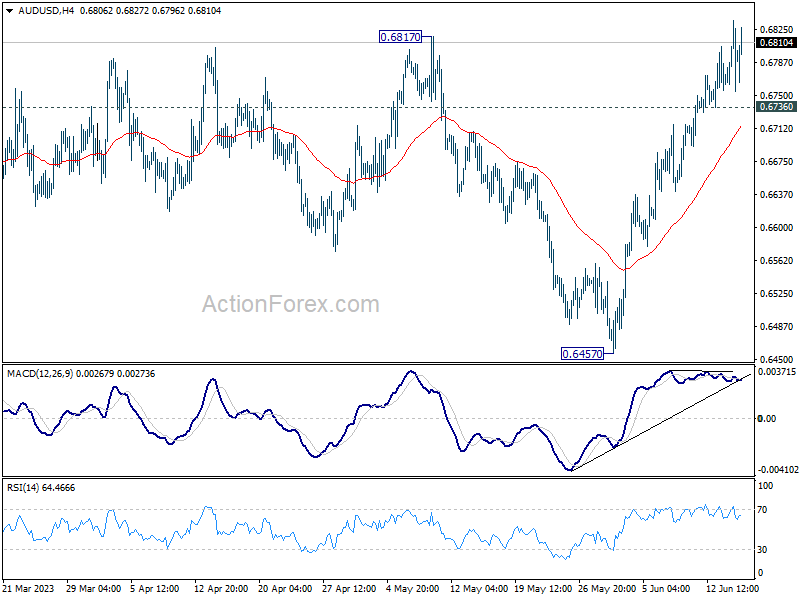
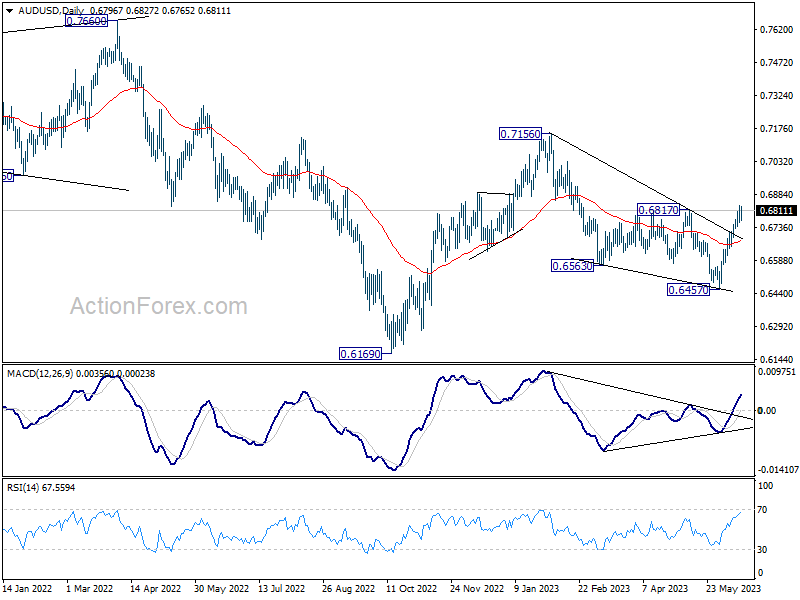
No change in AUD/USD's outlook as rise from 0.6457 is still in progress. Intraday bias stays on the upside for the moment. Decisive break of 0.6817 should confirm near term bullish reversal, and pave the way to retest 0.7156 resistance next. On the downside though, below 0.6736 minor support will turn intraday bias neutral first.
In the bigger picture, as long as 0.6817 resistance holds, the decline from 0.7156, as well as the down trend from 0.8006 (2021) are still in favor to continue through 0.6169 (2022 low) at a later stage. However, firm break of 0.6817 will indicate that fall from 0.7156 has completed in a three-wave corrective structure. Such development will argue that rise from 0.6169 is ready to resume through 0.7156, and add credence to the case that whole down trend from 0.8006 has completed already.
USD/CAD Daily Outlook
Daily Pivots: (S1) 1.3279; (P) 1.3316; (R1) 1.3360; More....
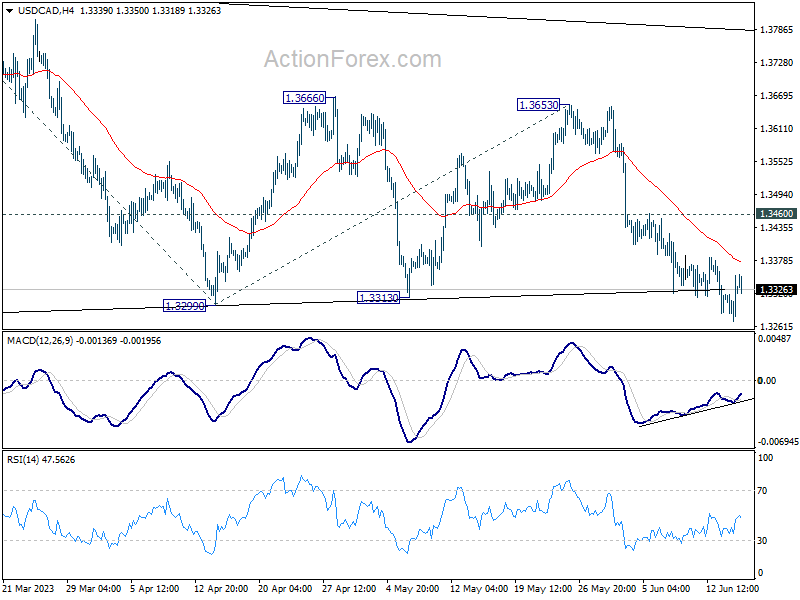
USD/CAD recovered after brief dip to 1.3271, and intraday bias stays neutral first. Strong rebound from current level, followed by break of 1.3460 resistance, should confirm short term bottoming. Intraday bias will be back on the upside for 1.3653 resistance, to extend the consolidation pattern from 1.3976. However, decisive break of 1.3224 support will indicate that larger corrective fall is underway, and target 100% projection of 1.3860 to 1.3299 from 1.3653 at 1.3092.
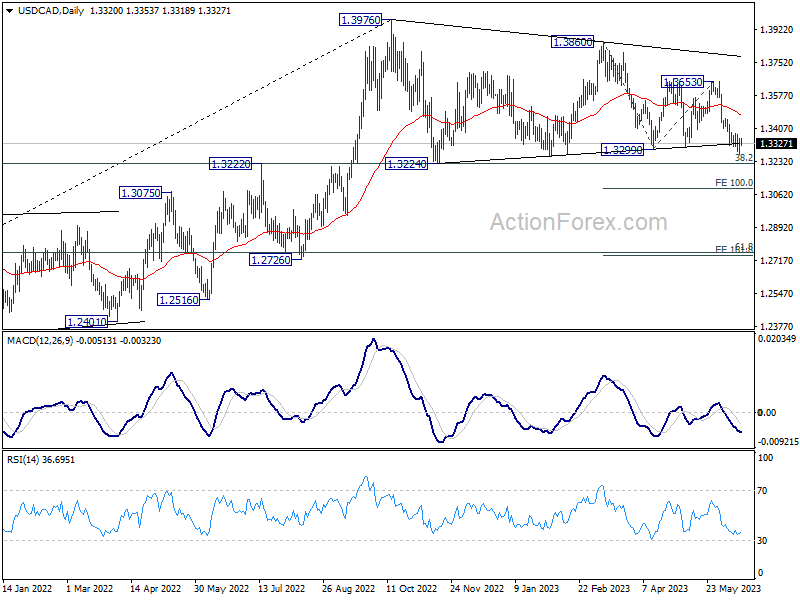
In the bigger picture, rise from 1.2005 (2021 low) is expected to resume through 1.3976 after consolidation from there completes. On decisive break of 1.3976, next target will be 1.4667/89 long term resistance zone. This will remain the favored case as long as 38.2% retracement of 1.2005 to 1.3976 at 1.3233 holds. However, sustained break of 1.3233 will pave the way to 61.8% retracement at 1.2758, and raise the chance of bearish reversal.
EUR/CHF Daily Outlook
Daily Pivots: (S1) 0.9736; (P) 0.9755; (R1) 0.9779; More...
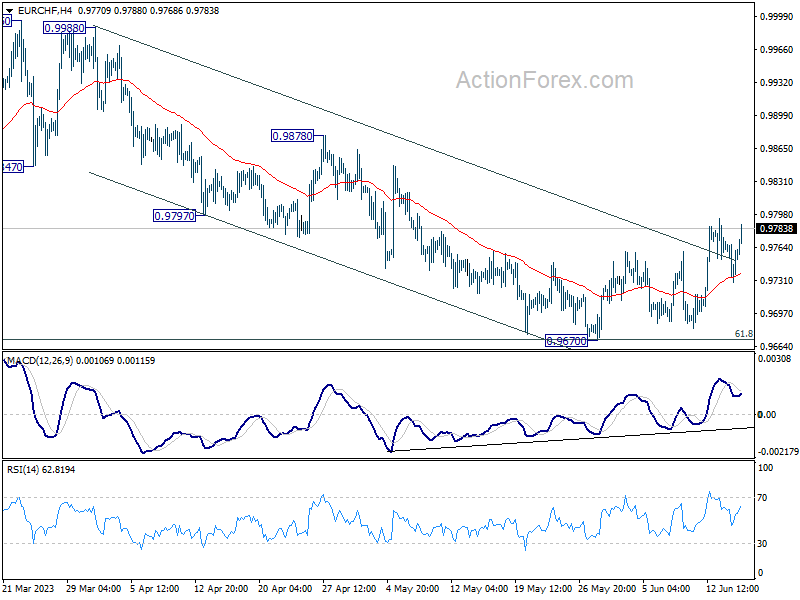
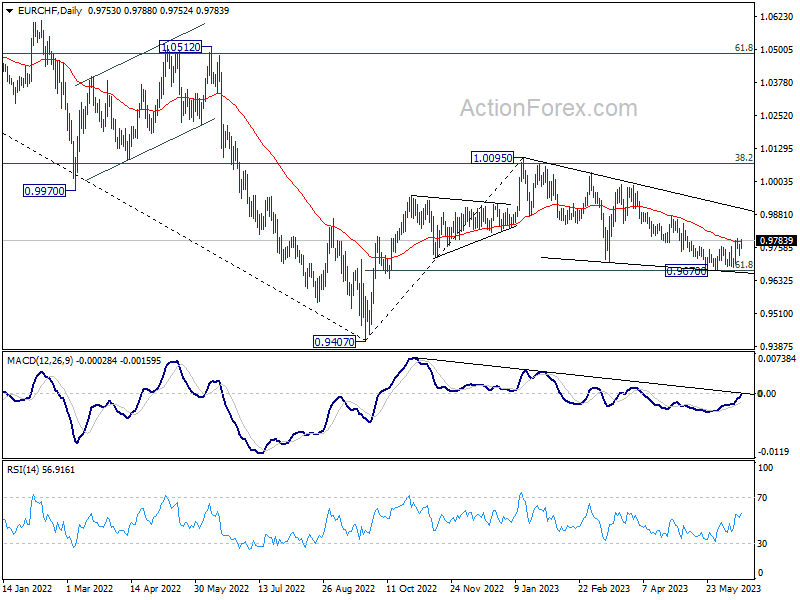
Further rally is still expected in EUR/CHF. Sustained trading above 55 D EMA (now at 0.9778) will add to case that whole correction from 1.0095 has completed, after hitting 61.8% retracement of 0.9407 to 1.0095 at 0.9670. Further rise should then be seen to 0.9878 resistance next. For now, risk will stay on the upside as long as 0.9670 support holds.
In the bigger picture, prior rejection by 38.2% retracement of 1.1149 to 0.9407 at 1.0072 suggests that medium term outlook is staying bearish. The pair is also capped below 55 W EMA (now at 0.9929). Down trend from 1.2004 (2018 high) is not complete yet and is in favor to resume through 0.9407 at a later stage. However, decisive break of 1.0095 resistance will raise the chance of bullish trend reversal. Rise from 0.9407 should then target 1.0505 cluster resistance (2020 low at 1.0505, 61.8% retracement of 1.1149 to 0.9407 at 1.1484).
EUR/GBP Daily Outlook
Daily Pivots: (S1) 0.8543; (P) 0.8552; (R1) 0.8563; More...
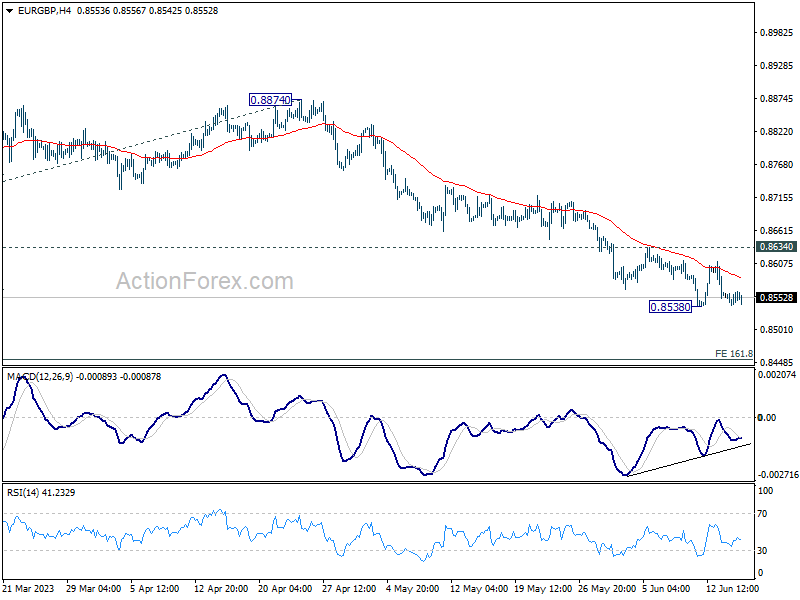
EUR/GBP is still bounded in range above 0.8538 and intraday bias stays neutral. Outlook remains bearish with 0.8634 resistance intact. Break of 0.8538 will resume larger decline from 0.8977 to 161.8% projection of 0.8977 to 0.8717 from 0.8874 at 0.8453. However, considering bullish convergence condition in 4H MACD, firm break of 0.8634 will indicate short term bottoming and turn bias to the upside for stronger rebound.
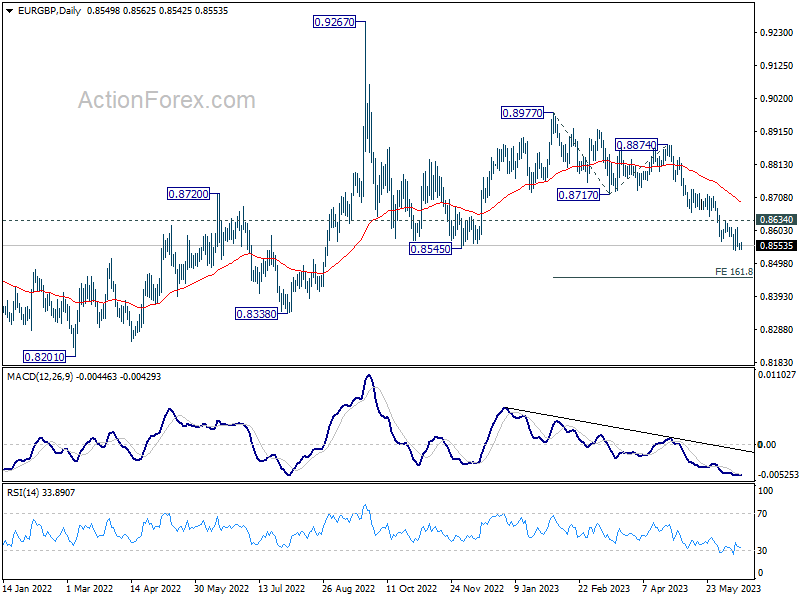
In the bigger picture, the down trend from 0.9267 (2022 high) is still in progress. It's seen as part of the long term range pattern from 0.9499 (2020 high). Deeper fall would be seen towards 0.8201 (2022 low). But strong support should be seen from there to bring reversal. This will now remain the favored case as long as 0.8717 support turned resistance holds.
EUR/AUD Daily Outlook
Daily Pivots: (S1) 1.5878; (P) 1.5938; (R1) 1.6000; More...
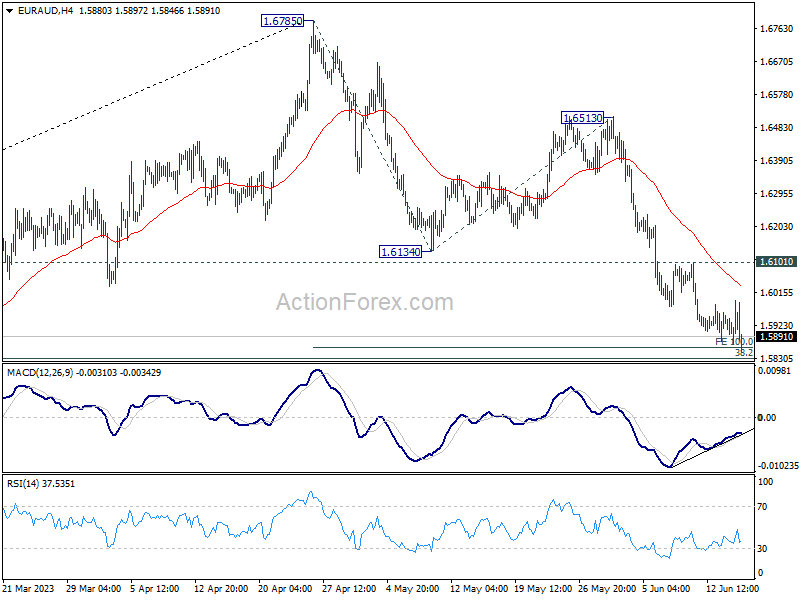
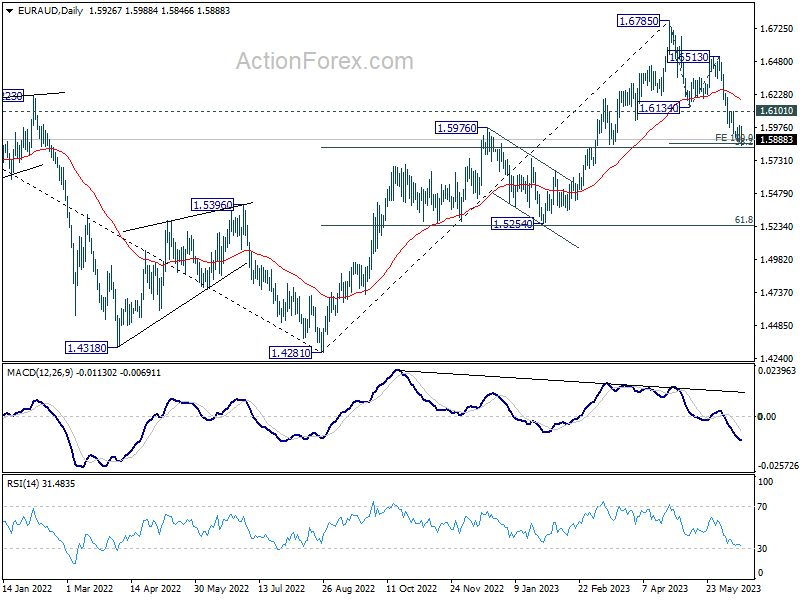
EUR/AUD continues to lose downside momentum as seen in 4H MACD. Strong support is still expected from around 100% projection of 1.6785 to 1.6134 from 1.6513 at 1.5862 to complete the fall from 1.6785. On the upside, break of 1.6101 resistance will confirm short term bottoming, and turn bias back to the upside for rebound.
In the bigger picture, a medium term is possibly in place at 1.6785 already, on bearish divergence condition in D MACD. Fall from there is seen as corrective whole up trend from 1.4281 (2022 low). Deeper decline is expected as long as 1.6513 resistance holds, to 38.2% retracement of 1.4281 to 1.6785 at 1.5828. Strong support could be seen there to complete the first leg of the corrective pattern.
EUR/JPY Daily Outlook
Daily Pivots: (S1) 151.19; (P) 151.48; (R1) 152.05; More....
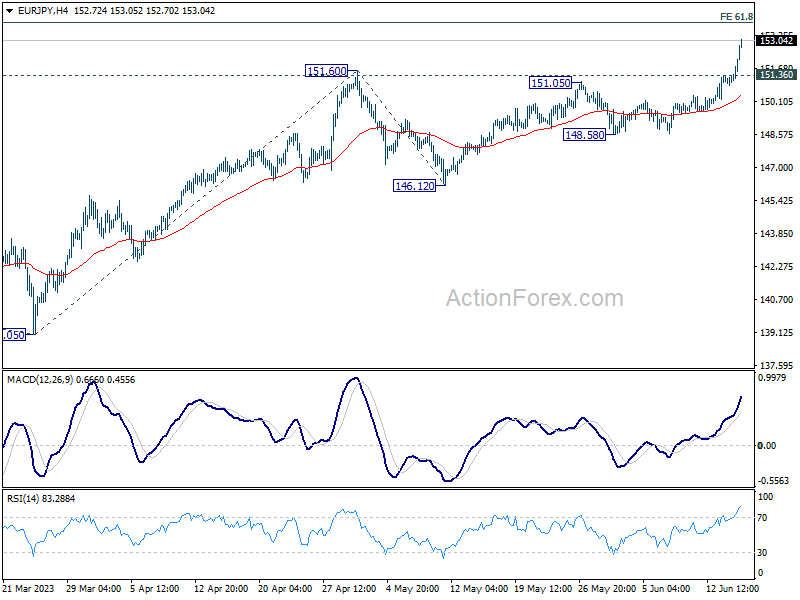
EUR/JPY's strong break of 151.60 resistance confirms larger up trend resumption. Intraday bias remains on the upside for 153.64 projection level. Sustained break there will be a sign of strong medium term momentum. Next target is 100% projection of 139.05 to 151.60 from 146.12 at 158.67. On the downside, below 151.36 minor support will turn intraday bias neutral first.
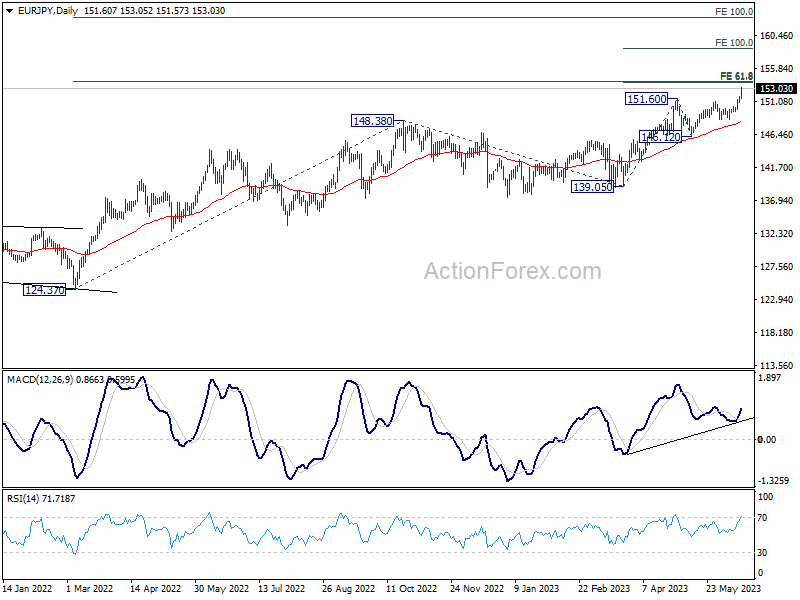
In the bigger picture, rise from 114.42 (2020 low) is in progress. Next target is 61.8% projection of 124.37 to 148.38 from 138.81 at 153.64. Sustained break there will pave the way to 100% projection at 162.82. For now, medium term outlook will remain bullish as long as 146.12 support holds, even in case of deep pull back.
Crypto Market Gives Back March Rally
Market picture
Cryptocurrency market capitalisation fell 3.2% over the past 24 hours to $1,021 trillion, its lowest level since mid-March when cryptocurrencies rallied on concerns about US banks. There is likely to be a reversal now that crypto exchanges have become a target for regulators and the banking system has managed to avoid any new high-profile failures.
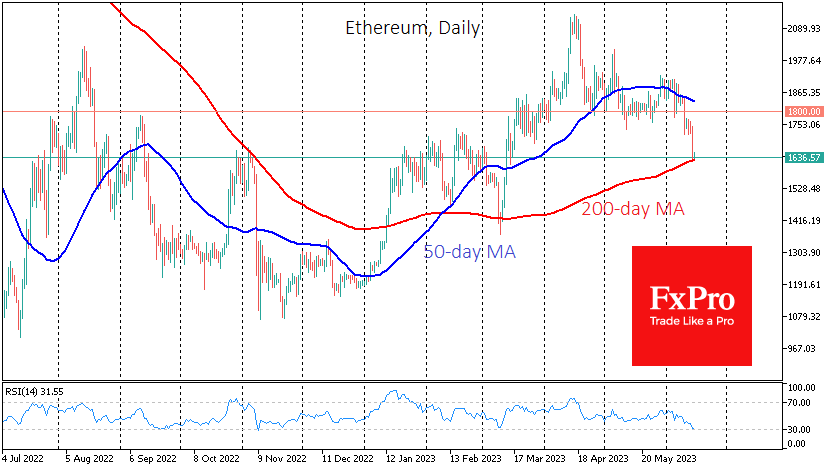
Bitcoin started Thursday’s session below $25K (-3.6% in 24 hours), while Ethereum fell to $1640 (-5.4%). Major altcoins are losing between 0.45% (Tron) and 6% (Litecoin).
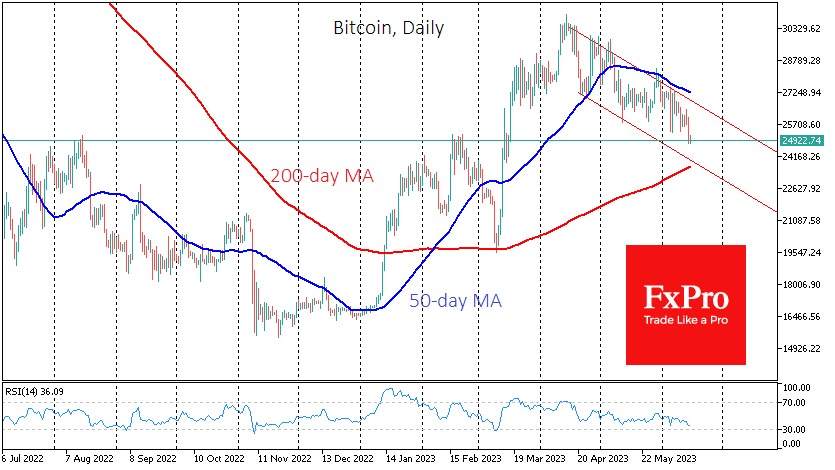
Bitcoin has retreated to local resistance levels from August last year to February this year. The bulls may try to hold the sell-off near this level, but the current decline is still within the descending channel that has been in place since April. More significant support for Bitcoin is near the 200-day average – now at $23.6K and pointing higher.
News background
Michael Saylor, MicroStrategy founder, says the SEC trying to bring regulatory clarity for the crypto market lays the groundwork for a new bitcoin rally. He believes that “confusion & anxiety has been holding back institutional investors.”
The relatively low realisation of gains and losses, coupled with the virtual lack of reaction from holders, suggests that investors are “indifferent” to the SEC’s actions against Binance and Coinbase, Glassnode said. The market reaction has kept Binance’s position as one of the largest holders of BTC and ETH.
The head of the US House Financial Services Committee, Republican Patrick McHenry, said the SEC should have taken strict action against the Binance exchange long ago. He said it should have been shut down years ago.
Mark Cuban, a billionaire, blamed SEC for not having a classification system for cryptocurrencies. Under such circumstances, the regulator can recognise any token as a security.
Binance CEO Changpeng Zhao denied rumours of market manipulation to inflate BNB’s value by selling Bitcoin.
US 30 Cash Index Fails at 34,280 Again; Bearish Pressure Rises
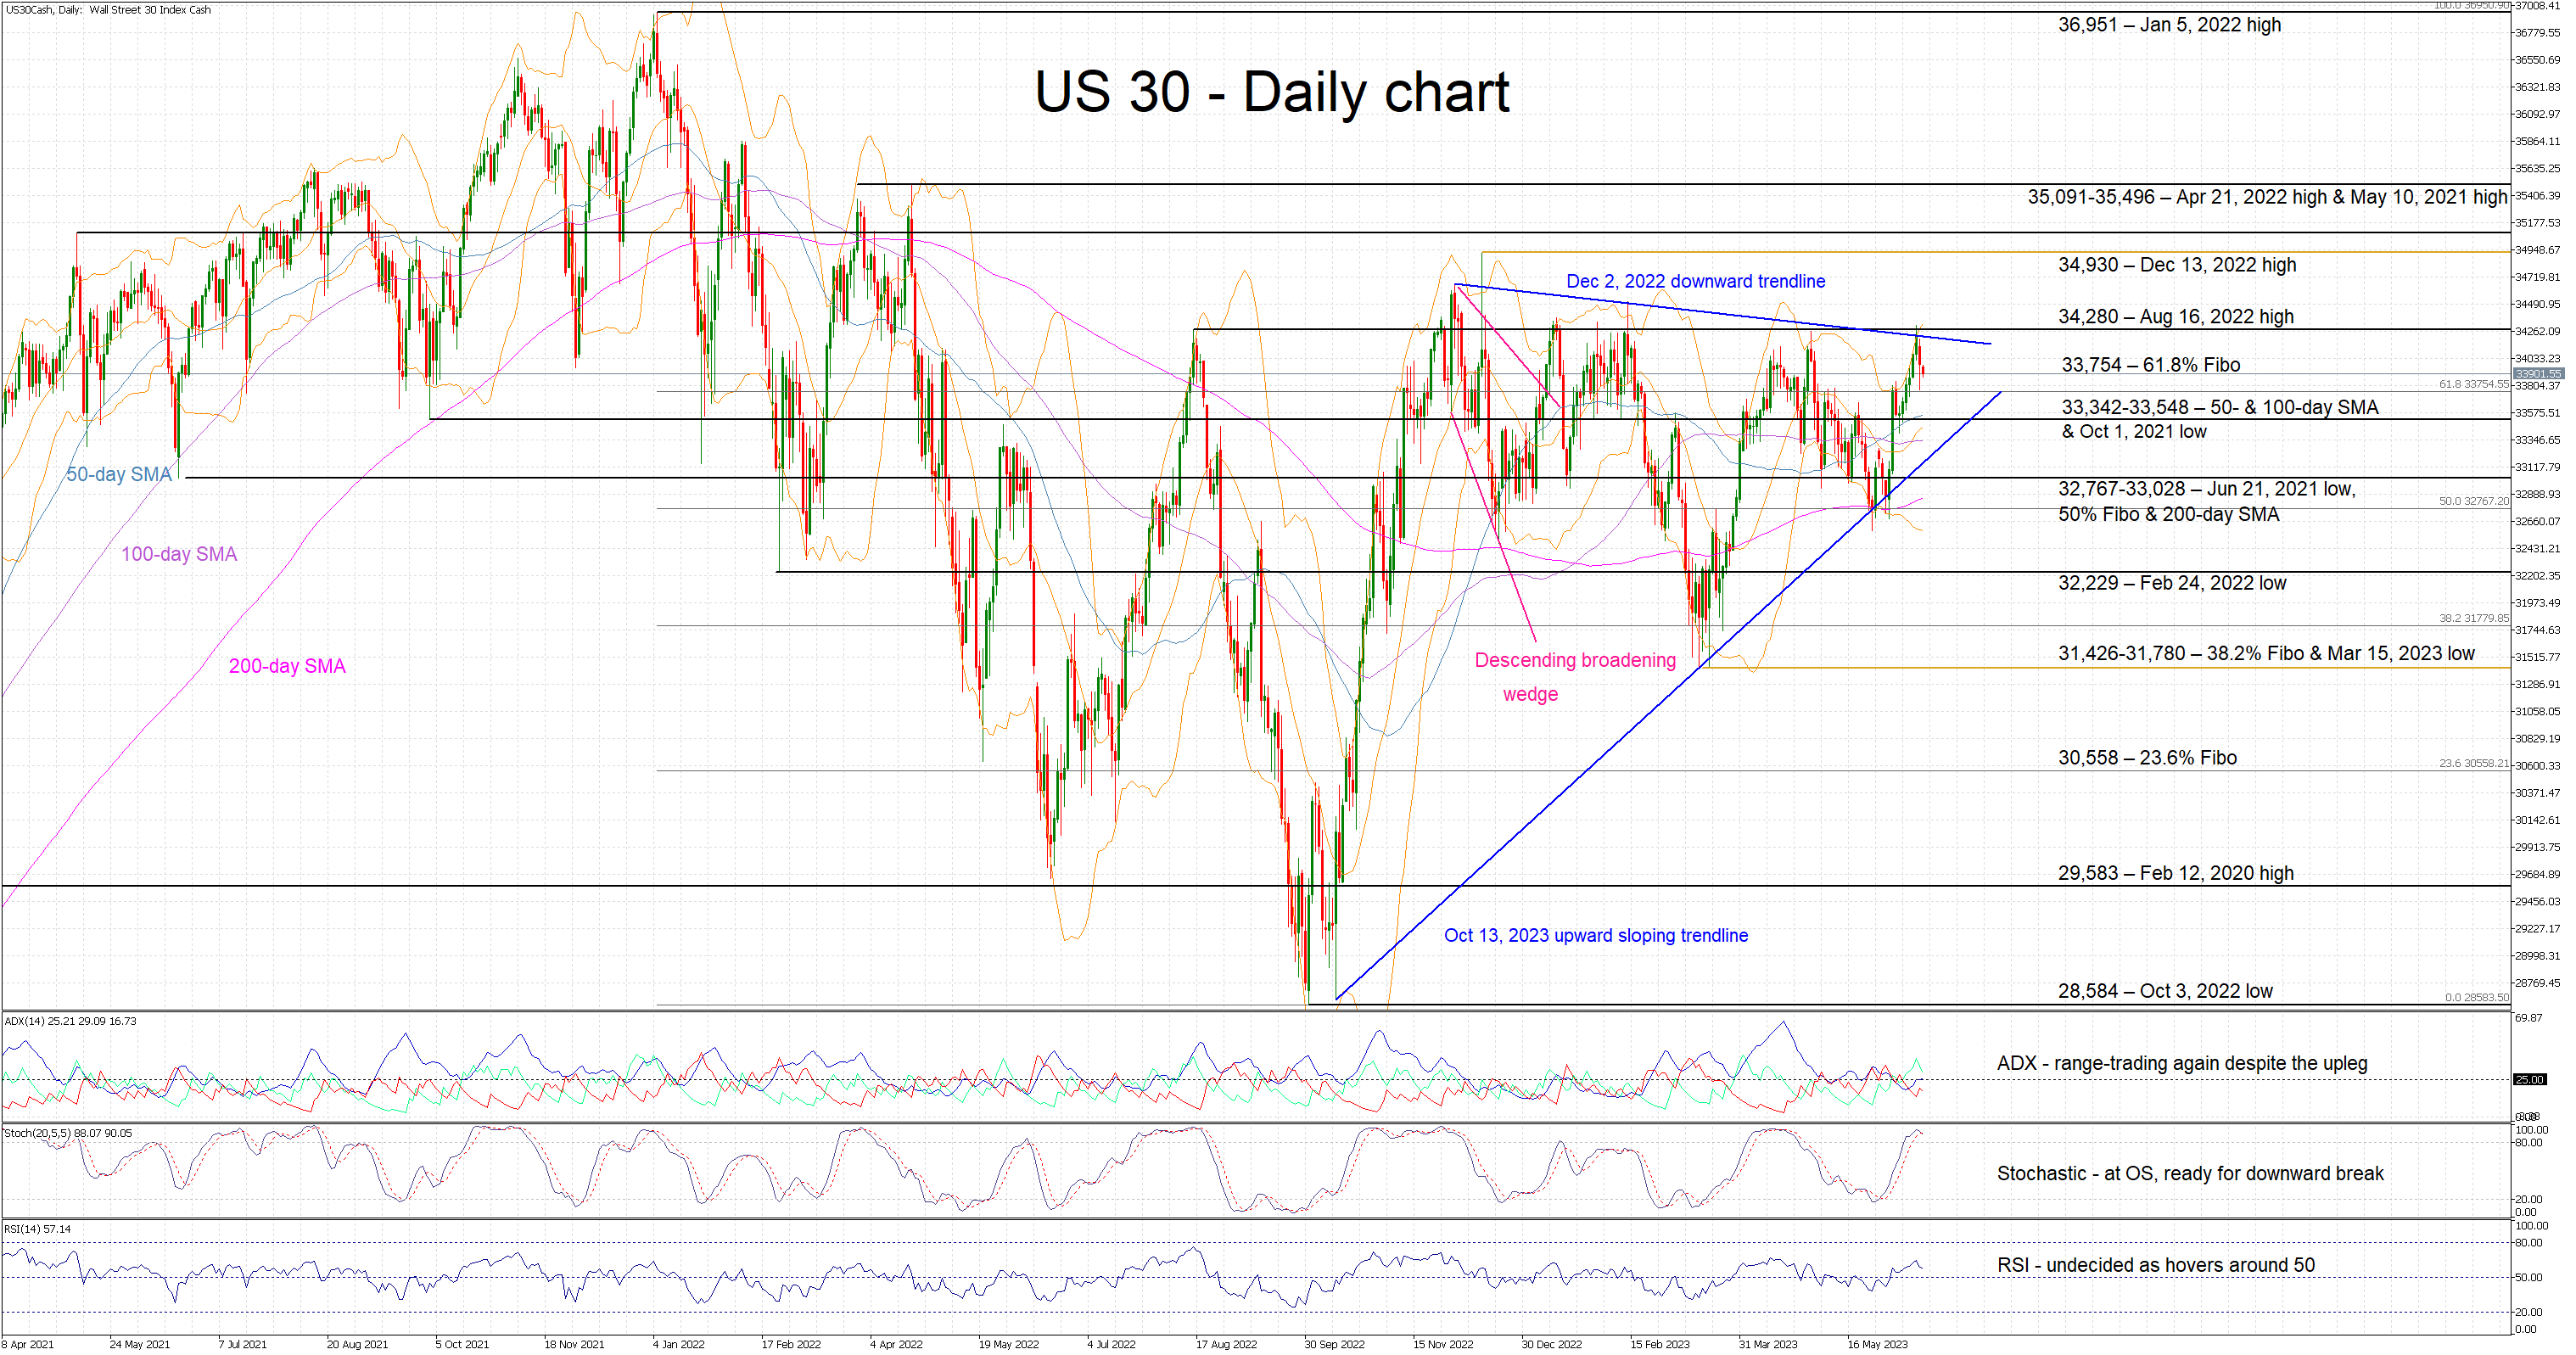
The US 30 cash index is edging lower today after failing again to close above the December 2, 2022 downward trendline and the 34,280 level. The bears appear determined to defend this area, hoping that they can take advantage of any exhaustion signs appearing on the bulls’ side.
With the Average Directional Movement Index (ADX) hovering around its 25-threshold and signaling a range-trading market, the bears are betting on the stochastic oscillator for the much-awaited bearish signal. Indeed, this indicator is trading in its overbought (OB) area and it has just crossed below its moving average. However, a decisive move below its OB territory is needed to support the bears’ intentions.
Should the bulls decide to retest the August 16, 2022 high at 34,280, they would firstly have to break the December 2, 2022 downward trendline. The December 13, 2022 high at 34,930 would be the next aim, a tad below the busier 35,091-35,496 range populated by the April 21, 2022 and May 10, 2021 highs respectively.
On the other hand, the bears would be keen on a break of the 61.8% Fibonacci retracement of the January 5, 2022 – October 3, 2022 downtrend at 33,754 before targeting the, arguably more important, 33,342-33,548 area. The combination of the 50- and 100-day simple moving averages (SMAs), and the October 1, 2021 low means that the bears’ determination would be put to the test there.
To sum up, the US 30 bulls are taking a breather after failing again to break the 34,280 level. Time does not appear to be on their side and a potential correction could be more forceful than they currently anticipate.
Will the Nonstop Rally in AUDUSD Falter?
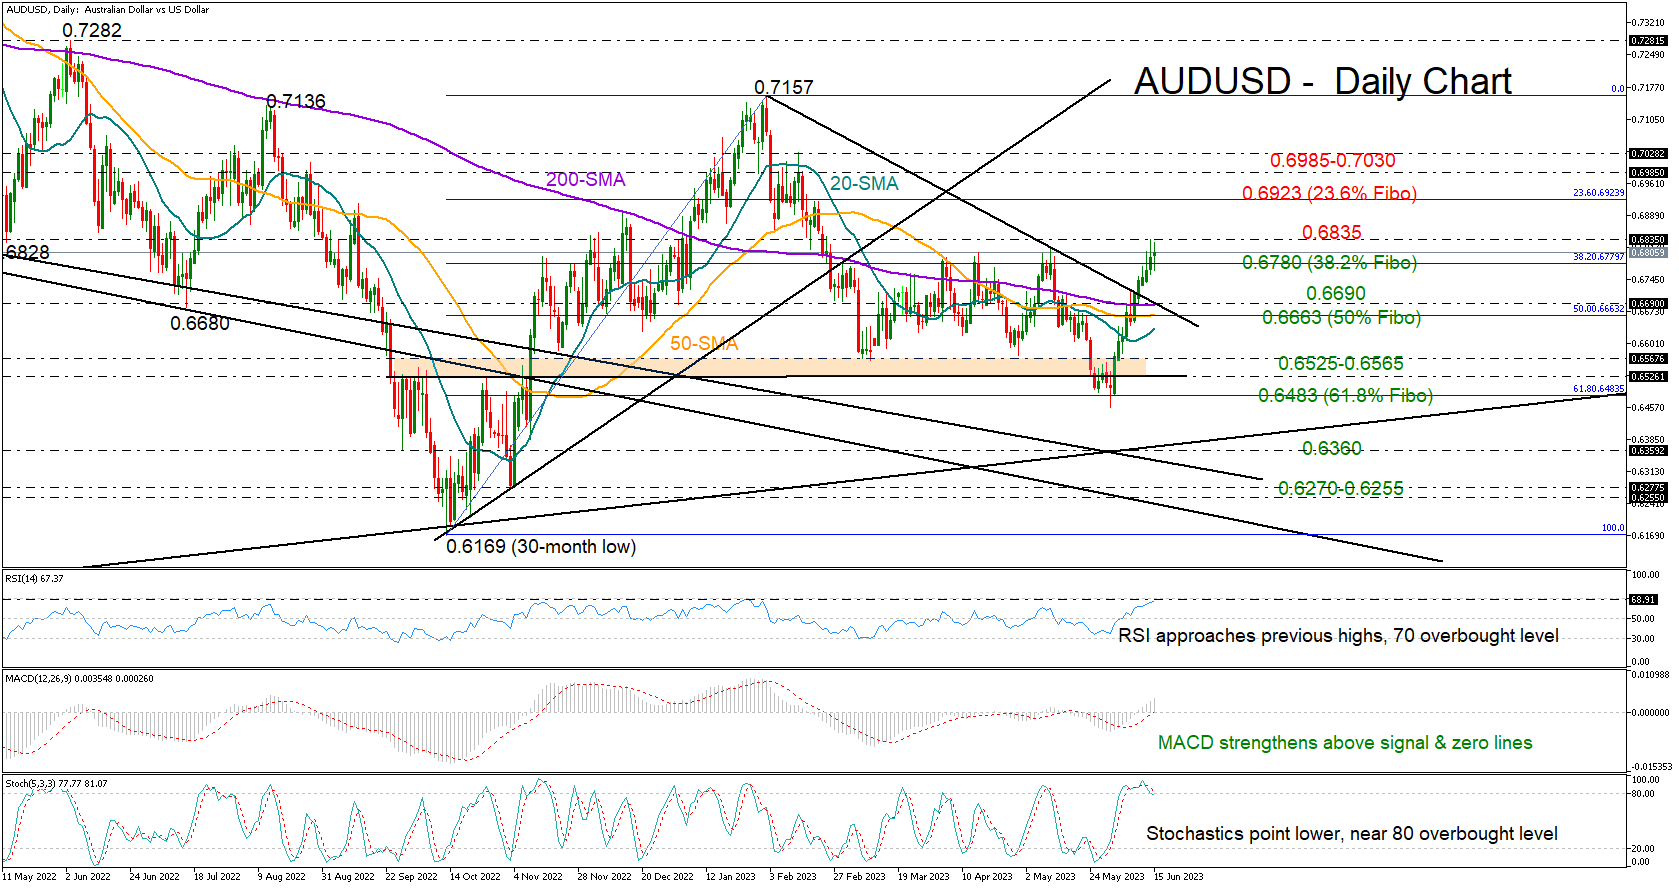
AUDUSD has been enjoying an almost three-week nonstop rally, gaining around 5.0% since the bounce on the 0.6500 level at the end of May.
On Wednesday, the pair reached its highest level since February and closed slightly above the 0.6780 ceiling, which has been capping bullish actions over spring. The impressive ascend could motivate some profit-taking as the RSI and the stochastic oscillator are hovering near overbought territory. Yet, the indicators have yet to show a clear downside reversal, suggesting some extra recovery before the next pivot takes place.
A clear step above yesterday’s high of 0.6835 could push the price up to the 23.6% Fibonacci retracement level of the previous uptrend at 0.6923. Additional increases from here could immediately lose pace somewhere between 0.6985 and 0.7030. If buying interest grows further, the door will open for the February and August highs at 0.7157 and 0.7136 respectively.
In the event the price pulls below 0.6800, the spotlight will fall on the broken 2023 resistance trendline and the 200-day simple moving average (SMA) at 0.6690. The 50% Fibonacci mark and the 50-day SMA are marginally lower, with the 20-day SMA approaching that territory as well. Should the bears breach those lines, selling forces could intensify towards the 0.6565-0.6525 floor. An extension below the 61.8% Fibonacci mark would put the pair back in a downtrend in the medium-term picture.
All in all, AUDUSD is expected to haunt extra gains in the short-term if it stays afloat above 0.6800-0.6780.