Sample Category Title
BTCUSD Analysis: Bears Attack the Psychological Level
Last night, the price of bitcoin fell below USD 25k for the first time since mid-March. And the bitcoin chart this morning shows sellers breaking through yesterday's low.
There can be two fundamental reasons for the dominance of sellers:
→ yesterday's press conference of the head of the US Federal Reserve (more details in the next post);
→ claims against the Binance and Coinbase exchanges by the US SEC regulator, which declared about 60 crypto assets as securities.
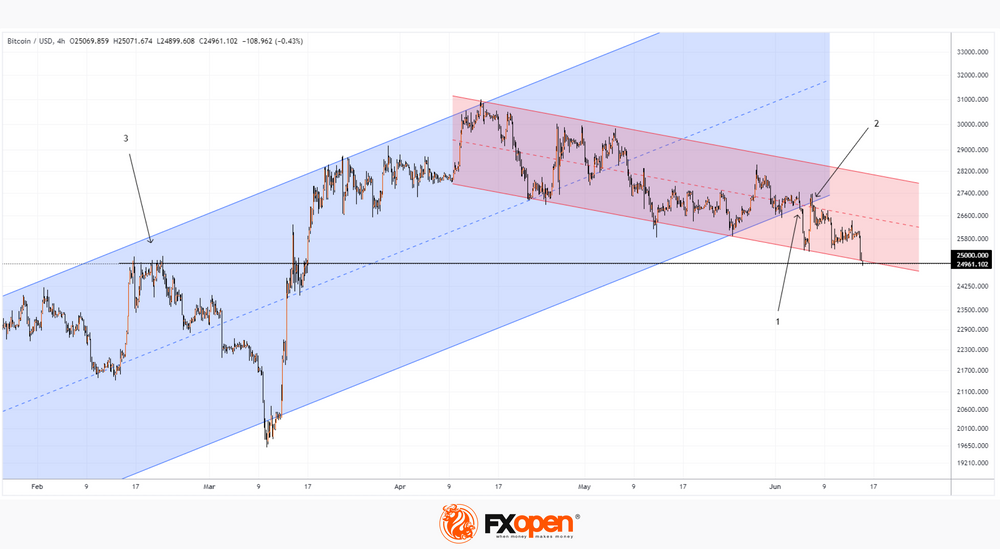
We wrote on June 13 that after the bearish breakout of the ascending channel (1) and the test of this breakout (2), the price of bitcoin could break through the USD 25k support level from top to bottom.
Could the now-forming USD 25k bearish breakout be false?
There are 3 arguments in favor of this idea:
→ previously this level served as resistance – from the point of view of technical analysis, now it should support the market;
→ the price of bitcoin may receive support from the lower border of the channel shown in red;
→ for the price of bitcoin, punctures of psychological levels are quite typical (for example, punctures from bottom to top of USD 25k in the second half of February).
More confidence from the US authorities on this list could add confidence to the bulls, but so far the situation leaves much to be desired.
Market Reaction to Fed’s Decision
Yesterday the Fed (as expected) kept the interest rate unchanged (after a series of 10 increases). However, the opinion of market participants that the rate peak has been reached has been called into question. At the Jerome Powell's press conference, it became known that:
→ the majority of FOMC members are against the rate cut;
→ there may be another increase at the end of the year;
→ high inflation situation may last 2 years.
The markets reacted with a rise in the US dollar. Accordingly, the currencies fell in pairs with the US dollar. Gold also fell in price to a minimum in 3 months — like bitcoin, by the way, and this is not the only similarity in the behavior of the price of gold and the main cryptocurrency.
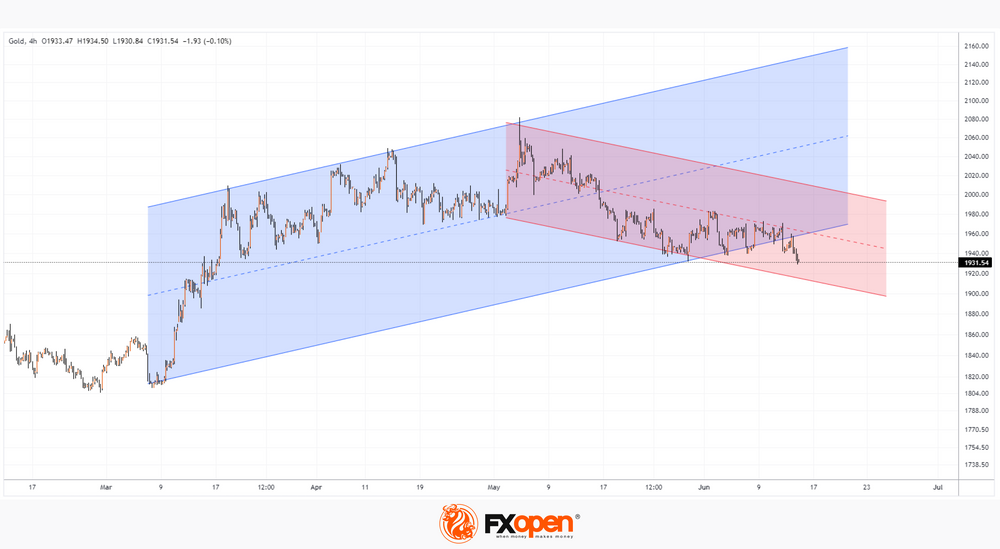
Note that on the XAU/USD chart, a picture is emerging that a few days ago was formed on the bitcoin price chart (see the previous post).
The price of gold has broken through the ascending channel (shown in blue), formed a breakout test and is moving within the descending channel (shown in red). If we see a continuation of the dynamics shown by bitcoin in the gold market, then XAU/USD may drop to the lower border of the descending channel.
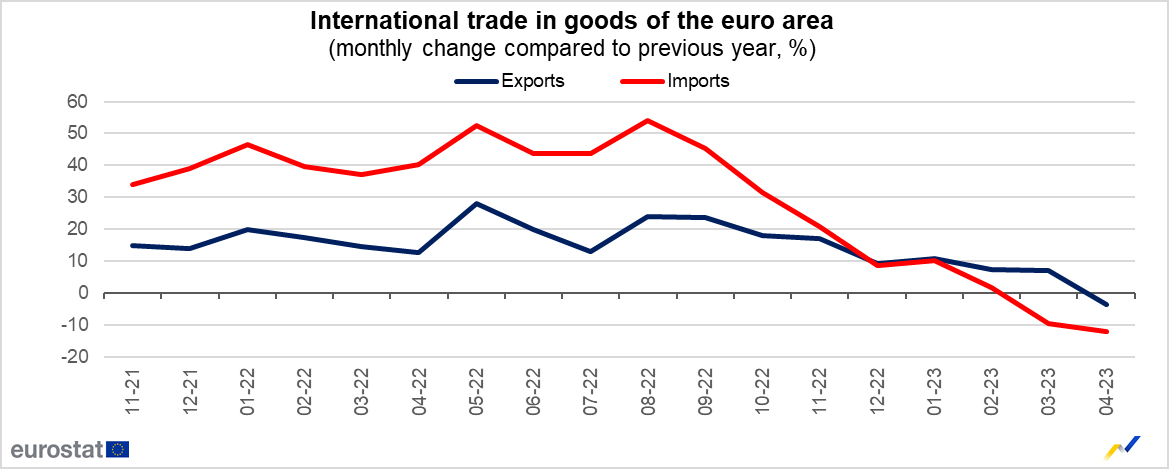
Eurozone exports down -3.6% yoy in Apr, imports down -11.9% yoy
Eurozone exports of goods to the rest of the world decreased -3.6% yoy in April to EUR 216.0B. Imports decreased -11.9% yoy to EUR 227.7B. A EUR -11.7B trade deficit was recorded. Intra-Eurozone trade was also down by -5.2% yoy to EUR 208.3B.
In seasonally adjusted term, exports fell -3.2% mom to EUR 234.5B. Imports rose 5.9% mom to EUR 241.5B. Trade balance turned into EUR -7.1B deficit, versus expectation of EUR 5.7B surplus. Intra-Eurozone trade fell from EUR 224.1B in March to 222.4B in April.
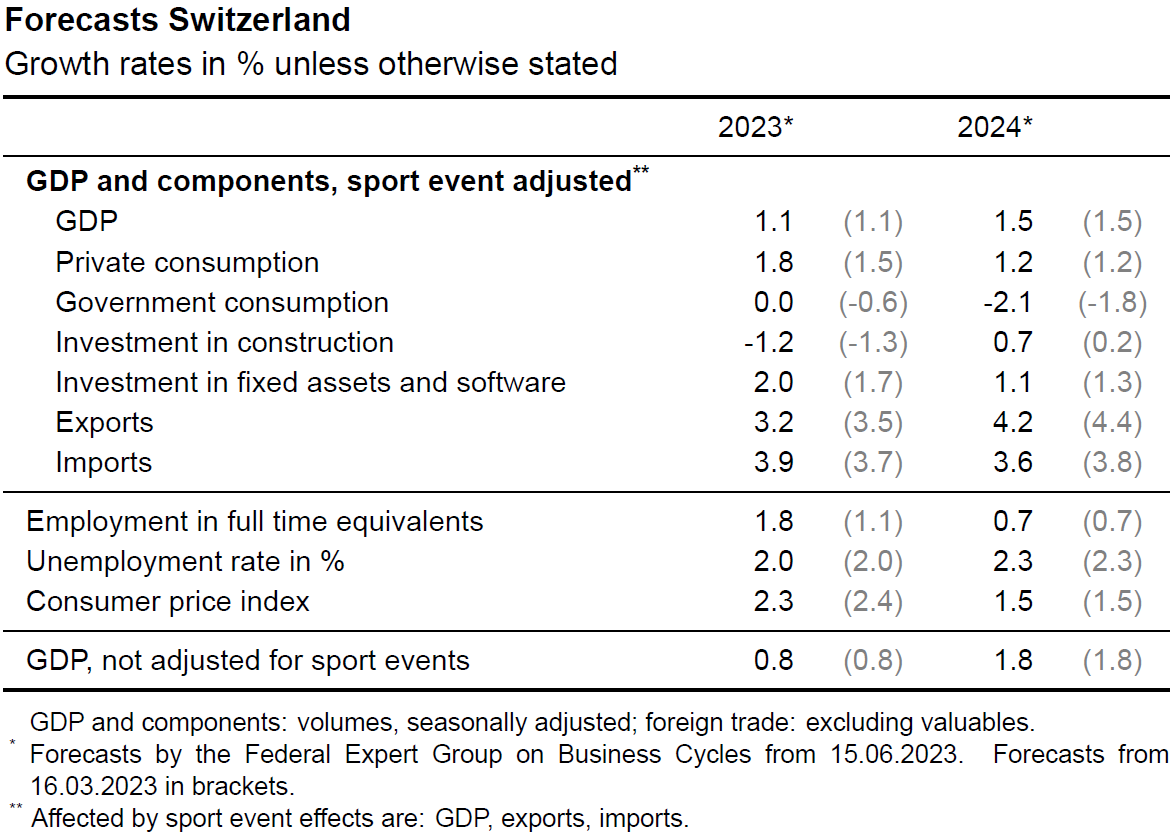
Swiss SECO: Economic growth to be significantly below average
Swiss SECO expert group on business cycles expect "significantly below average growth for the Swiss economy", at 1.1% in 2023, and then 1.5% in 2024. Both were unchanged from prior forecast in March. It added that while the economy started the year "vigorously", "inflationary pressures remain high internationally and there are pronounced economic risks".
Regarding inflation, the group expects inflation to stabilize at 2.3% in 2024 (down from March forecast of 2.4%), and then falls to 1.5% average in 2024 (unchanged from prior forecast). Unemployment rate is expected to average 2.0% in 2023, and then rise to 2.3% in 2024.
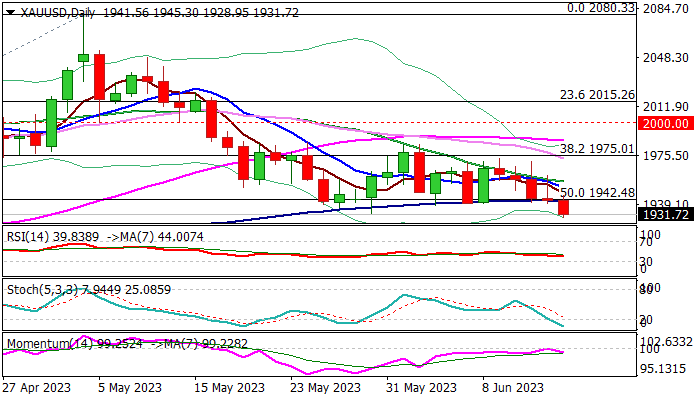
XAU/USD: Gold Falls to Three-month Low as Fed Signals More Rate Hikes
Gold fell to the lowest in almost three months on Thursday, after the Fed kept interest rates unchanged, as widely expected, but signaled more rate hikes towards the end of the year.
The central bank keeps focus on inflation, which still slows below expectations and will probably require more policy tightening in coming months, but stronger than expected performance of the US economy leave space for further rise in borrowing cost.
Hawkish signals from the Fed lifted dollar, making bullion less attractive for investors that increased pressure on gold price.
Fresh weakness broke through strong support provided by 100DMA ($1942) which contained a number of attacks in past weeks, adding to significance of support, also reinforced by the base of rising daily cloud.
Close below $1942 pivot to confirm fresh bearish signal and expose targets at $1909/$1900 (Fibo 61.8% of $1804/$2080 / psychological).
Bearish daily studies add to negative near-term outlook.
Broken $1942 pivot now acts as strong resistance, which should keep the upside protected to maintain fresh bearish bias.
Res: 1939; 1942; 1951; 1970.
Sup: 1918; 1909; 1900; 1871.
USD/JPY – Yen Slides to 7-Month Low after Fed, BOJ Meeting Next
- Fed delivers a hawkish pause
- Bank of Japan meets on Friday
- Japanese yen falls sharply
The Japanese yen has taken a tumble on Thursday. In the European session, USD/JPY is trading at 141.24, up 0.81%. Earlier today, the yen fell as low as 141.50, its lowest level since November.
Fed pauses but hints at more hikes
The markets had widely expected the Federal Reserve to pause at the Wednesday meeting, especially after a favourable inflation release on Tuesday. Jerome Powell delivered a hawkish pause, as the rate statement signalled more rate hikes were on the way and the Fed revised upwards its growth and inflation projections for the fourth quarter. As well, the dot plot indicated two more small rate hikes this year.
Powell said after the decision that the Fed had not made a decision about the July meeting, in keeping with his stance that each rate decision will be determined based on the data. The markets aren’t buying that and have priced in a 71% probability of a July hike, according to CME FedWatch. Inflation is moving slower, but there’s still a way to go before the 2% target is achieved and the markets expect Powell to keep his foot on the rate pedal after yesterday’s brief time out.
BoJ meets on Friday
The markets will shift their attention to the Bank of Japan, which meets on Friday. The BoJ has been an outlier with regard to rate policy, adhering to an ultra-loose monetary policy. The Bank is expected to maintain key policy settings and may comment on the depreciation of the yen. The currency’s sharp drop on Wednesday triggered verbal intervention from Chief Cabinet Secretary Hirokazu Matsuno, who voiced the standard line that excessive moves in the exchange rate were not desirable. The government has warned in the past that it could intervene to prop up the yen and made good on its threats in December, stunning the markets. If the yen’s slide continues, we can expect more warnings out of Tokyo.
USD/JPY Technical
- USD/JPY is testing resistance at 141.21. Above, there is resistance at 141.97
- There is support at 140.29 and 139.53
USD/JPY Technical: Bullish Breakout from 4-Week Range Ahead of BOJ
USD/JPY Technical: Bullish Breakout from 4-Week Range Ahead of BOJ
- Higher interest rates for longer periods from Fed’s latest monetary policy stance reinforced USD/JPY strength.
- USD/JPY staged a bullish breakout from its recent 4-week range.
- The next key intermediate resistances stand at 142.25 and 142.80 ahead of BoJ’s monetary policy decision tomorrow.
Fig 1: USD/JPY medium-term trend as of 15 Jun 2023 (Source: TradingView, click to enlarge chart)
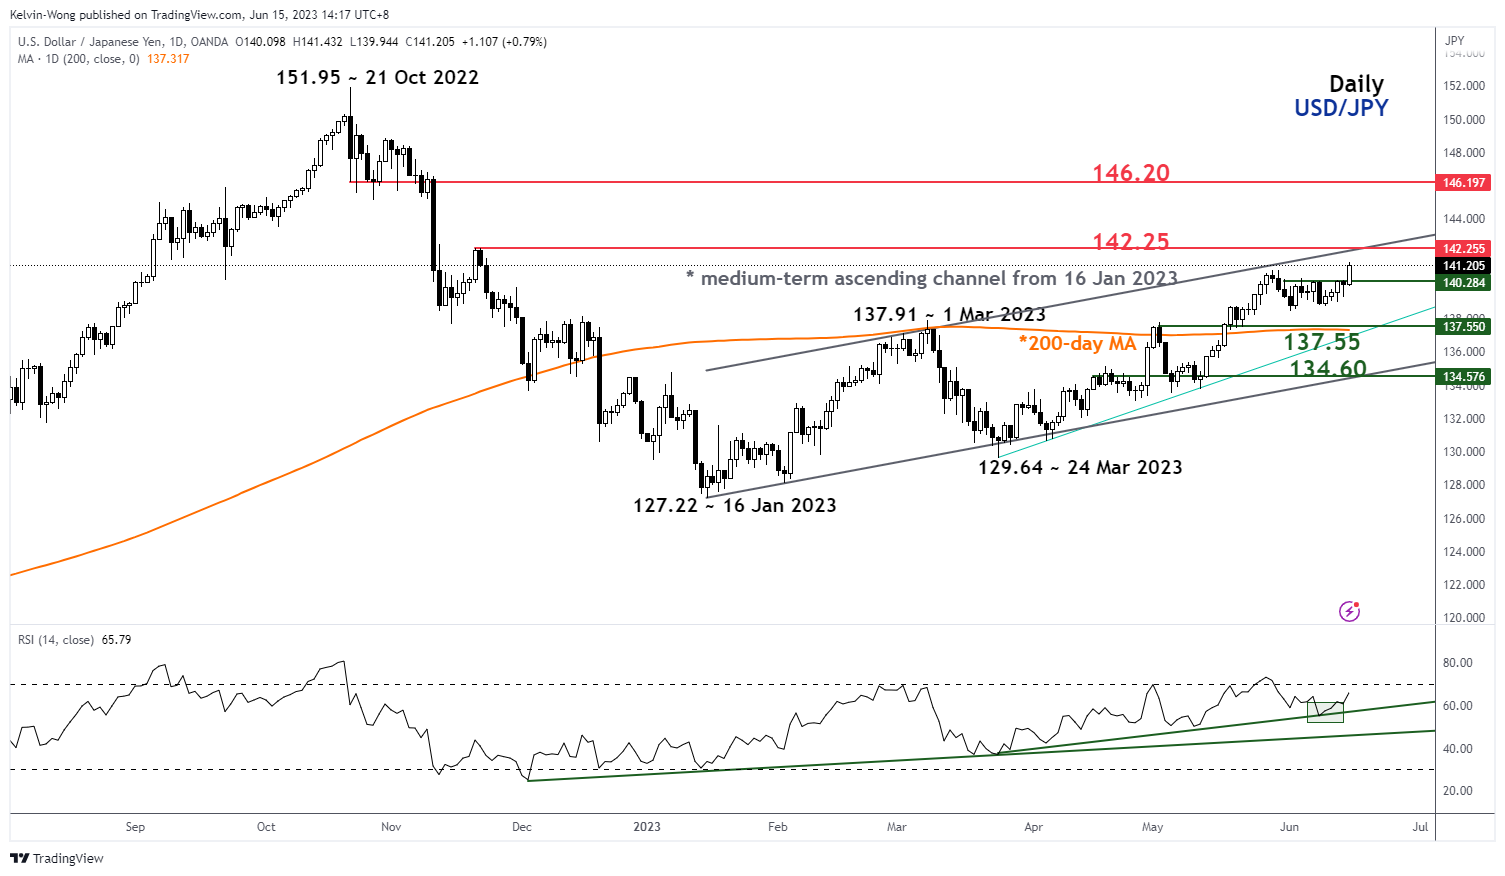
Fig 2: USD/JPY short-term trend as of 15 Jun 2023 (Source: TradingView, click to enlarge chart)
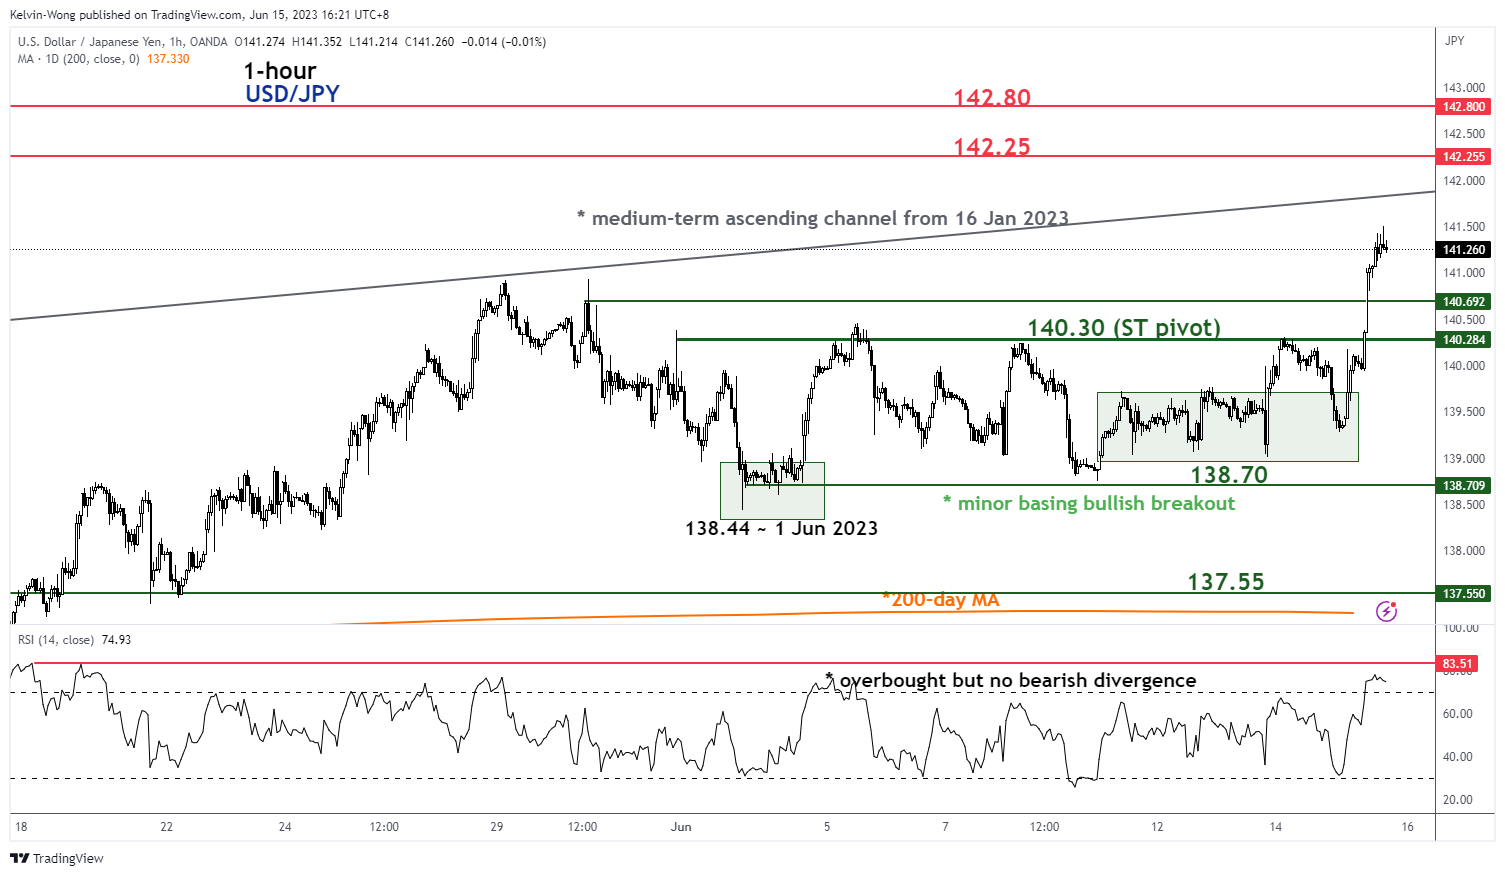
The USD/JPY has staged a breakout from a minor 4-week bullish basing configuration in place since 30 May 2023 minor swing high area of 149.70 reinforced by the latest US central bank, Fed’s monetary policy hawkish guidance that has indicated at least two 25 basis points of hikes to its Fed funds rate to bring the terminal rate of its current interest rate hike cycle to a median projection of 5.6%, an upward revision from its previous “dot plot” projection of 5.1% released on the March’s FOMC meeting.
This latest stance from the Fed has clearly indicated that interest rates in the US are expected to stay higher for a longer period which is a sharp contrast to the recent mixed messages on Japan’s recent inflationary trend conveyed by the Bank of Japan (BoJ) Governor Ueda that has been more skewed towards in favour to maintain the status quo of its current ultra-easy monetary policy.
Potential continuation of its impulsive move within its medium-term uptrend
As seen on its daily chart, yesterday’s post-FOMC bullish breakout above 140.70 former minor range resistance is likely to indicate the continuation of its impulsive up move within its medium-term uptrend phase in place since the 16 January 2023 low of 127.22 (depicted by the ascending channel)
The upper boundary of the medium-term ascending channel is now acting as resistance at around 142.25.
Short-term momentum in overbought condition no clear signs of exhaustion yet
Yesterday’s swift minor up move in price actions has led the 1-hour RSI to hit its overbought region (above 70%) with a value of 78.17, a whisker below an extreme overbought level of 83.51 printed on 18 May 2023. However, it has not flashed any bearish divergence signal at this juncture which suggests that short-term upside momentum may be still intact with a possible minor pull-back in price actions rather than a bearish reversal.
Watch the 140.30 key short-term pivotal support with the next intermediate resistances coming in at 142.25 and 142.80. However, failure to hold above 140.30 invalidates the bullish breakout to expose the next support zone of 138.70/137.55 (minor swing low area of 1 June 2023 & 200-day moving average).
EUR/USD Daily Outlook
Daily Pivots: (S1) 1.0783; (P) 1.0823; (R1) 1.0872; More...
Further rally is expected in EUR/USD with 1.0732 minor support intact. Sustained trading above 55 EMA (now at 1.0810) will extend the rise from 1.0634 to retest 1.1094 high. Nevertheless, break of 1.0732 minor support should resume the fall from 1.1094 through 1.0634 support.
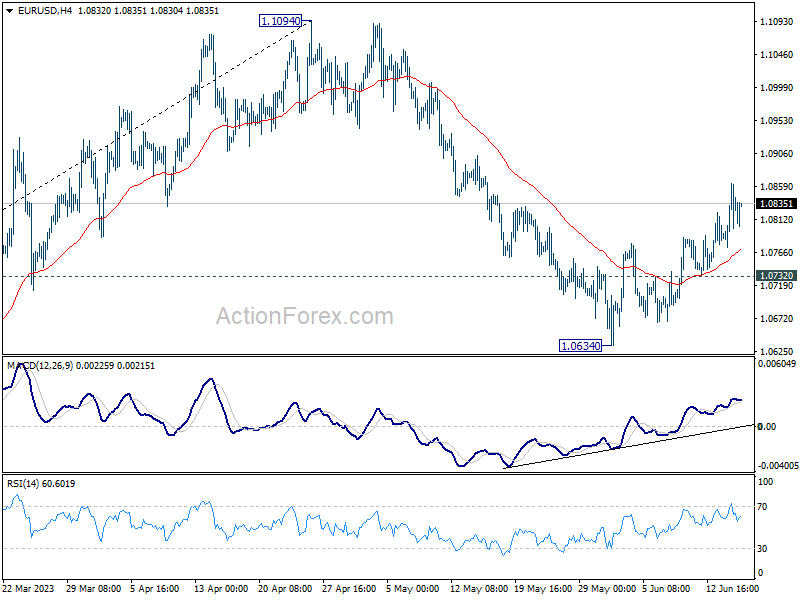
In the bigger picture, as long as 1.0515 support holds, rise from 0.9534 (2022 low) would still extend higher. Sustained break of 61.8% retracement of 1.2348 (2021 high) to 0.9534 at 1.1273 will solidify the case of bullish trend reversal and target 1.2348 resistance next (2021 high).
GBP/USD Daily Outlook
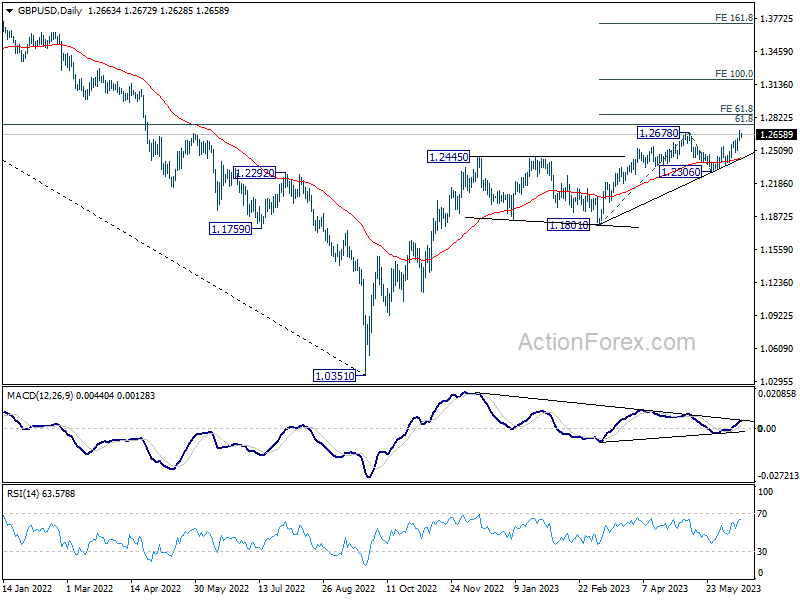
Daily Pivots: (S1) 1.2609; (P) 1.2654; (R1) 1.2707; More...
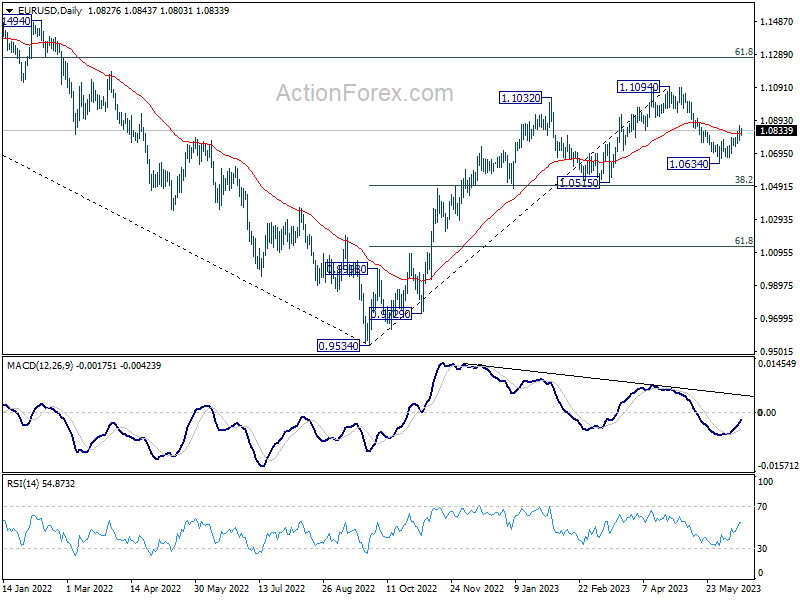
Intraday bias in GBP/USD stays on the upside with 1.2599 minor support intact. Decisive break of 1.2678 resistance will confirm resumption of whole up trend from 1.0351. Further rally should then be seen through 1.2759 fibonacci level to 61.8% projection of 1.1801 to 1.2678 from 1.2306 at 1.2848. On the downside, below 1.2599 minor support will turn intraday bias neutral first.
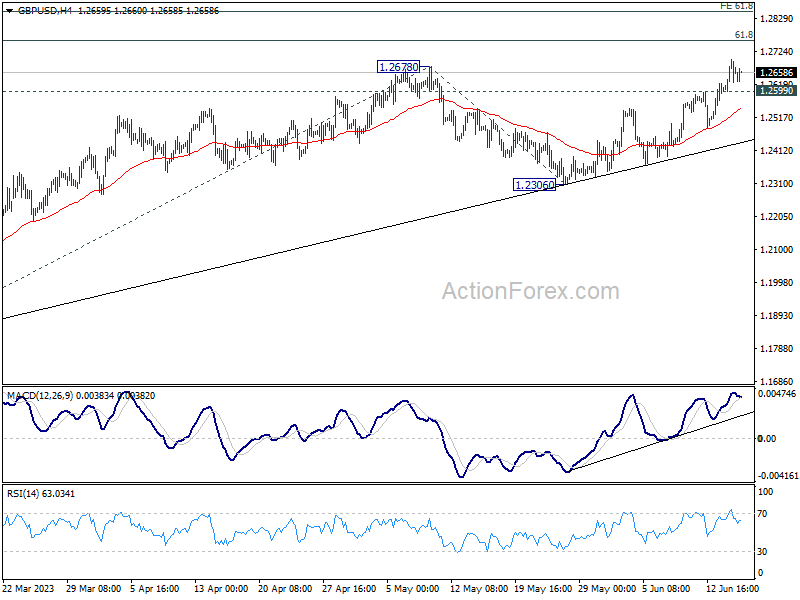
In the bigger picture, as long as 1.2306 support holds, rise from 1.0351 medium term bottom (2022 low) is expected to extend further. Sustained break of 61.8% retracement of 1.4248 (2021 high) to 1.0351 at 1.2759 will add to the case of long term bullish trend reversal. However, firm break of 1.2306 will indicate rejection by 1.2759, and bring deeper decline, even as a correction.
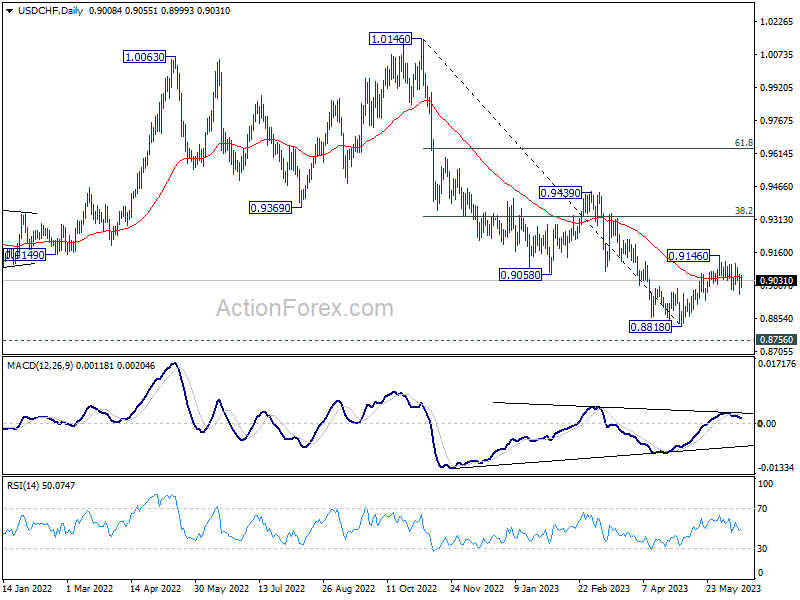
USD/CHF Daily Outlook
Daily Pivots: (S1) 0.8965; (P) 0.9012; (R1) 0.9059; More...
Intraday bias in USD/CHF is turned neutral again as it recovered quickly after dipping to 0.8964. On the upside, break of 0.9146 will resume the rebound from 0.8818. Nevertheless, break of 0.8964 will extend the fall from 0.9146 to retest 0.8818 low.
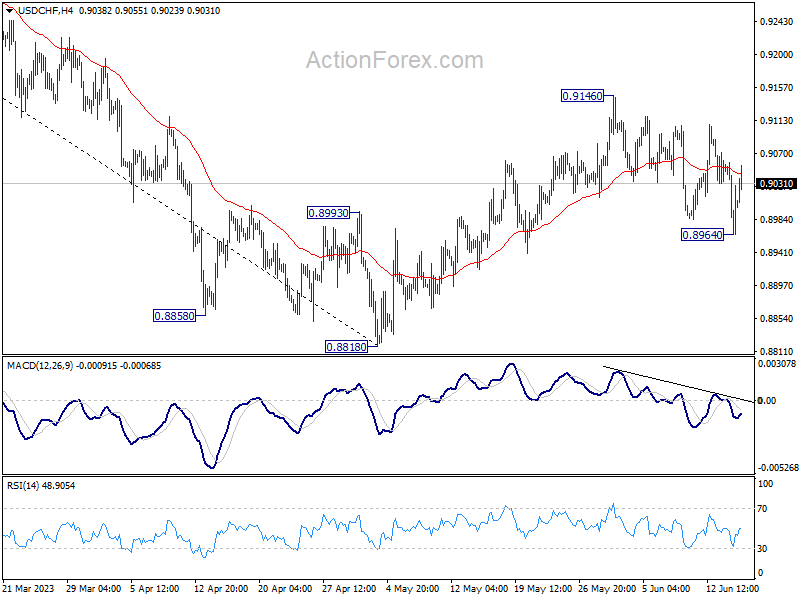
In the bigger picture, fall from 1.1046 (2022 high) is seen as a leg in the long term range pattern from 1.0342 (2016 high), which might have completed at 0.8818 already, just ahead of 0.8756 long term support. Sustained trading above 0.9058 support turned resistance should confirm medium term bottoming. Further break of 0.9439 resistance will confirm bullish trend reversal.