Sample Category Title
ECB Preview – Looking Beyond Next Week
The ECB meeting next week will be a peculiar one, with a risk of no market reaction. On the one hand, the decision has already been well telegraphed (25bp hike and APP reinvestments to end from 1 July) and on the other hand guidance (with new staff projections) is likely a 'one-sided' risk for markets. Hawkish tunes from Lagarde on the back staff projections is at risk of being largely disregarded by markets.
ECB's stance and market pricing are more harmonious for policy hikes than what we have seen during the past year and after the June meeting we find it challenging for markets to price in more than 40bp of additional until we get close to the July meeting.
We continue to expect ECB to hike to 4% by September, but risks may be slightly skewed to 3.75% in July as the burden of proof have been reversed. We expect ECB to guide for further tightening although providing a non-committal statement as they stay data dependent.
US Dollar at Crucial Zone: What Next?
Let's dive into the recent debt ceiling saga in the US and its implications for the economy, deficit, and inflation. The good news is that a new debt deal is on the horizon, saving us from a potential default on June 5. Phew! This deal will impact the economy by providing stability and avoiding a financial catastrophe. It should also help keep the deficit in check, preventing further debt accumulation. As for inflation, the deal aims to address the budget outlook, which could impact inflation rates. However, we'll need to monitor future developments to see how things play out and ensure the US finds solid financial footing. Stay tuned for updates and keep your trading strategies adaptable. Happy trading!
US DOLLAR - Daily Timeframe
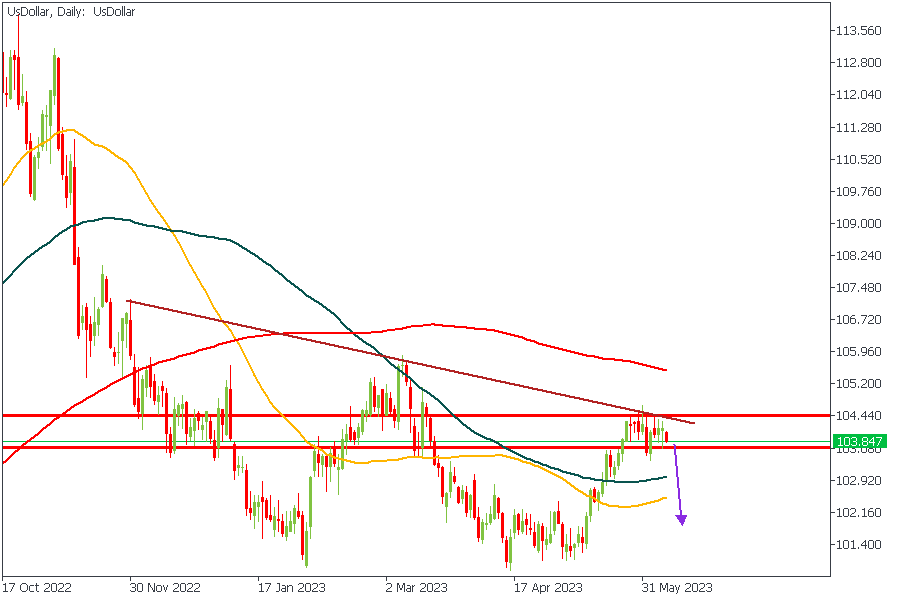
The rejection from the trendline resistance has been clearly established, but we’re yet to see the price trade clear of the pivot zone. Looking at the scenario, my sentiment is bearish based on the following factors;
- Trendline resistance
- Pivot zone acting as supply
- The moving average array is bearish
Analyst’s Expectations:
- Direction: Bearish
- Target: 103.252
- Invalidation: 104.249
EURUSD - Daily Timeframe
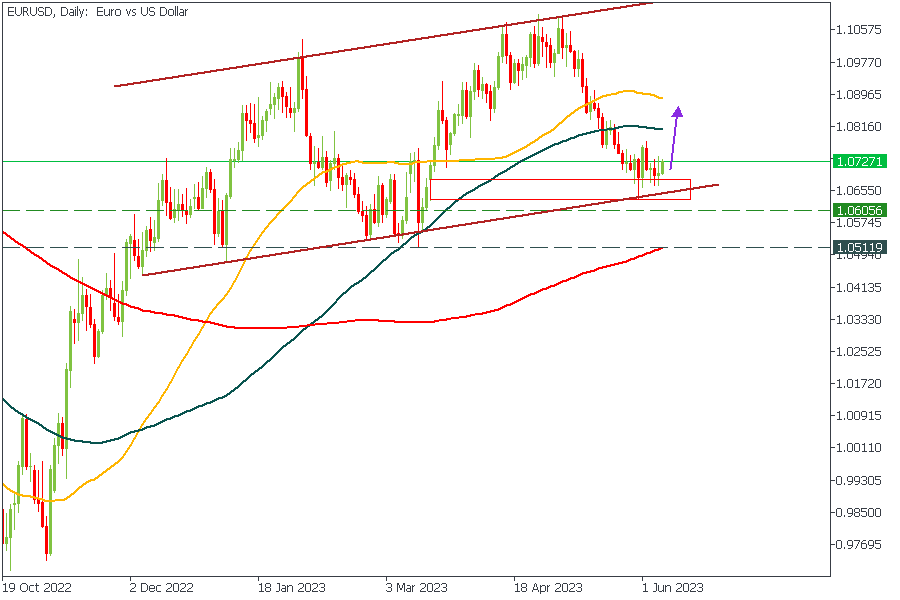
EURUSD has been rejected from the demand zone and the trendline support. Based on the additional confluence from the bullish moving average array, I will uphold my bullish sentiment on EURUSD until the US Dollar reverses its structure. As long as the US Dollar indicates a bearish price action, I will remain bullish on the EURUSD.
Analyst’s Expectations:
- Direction: Bullish
- Target: 1.08481
- Invalidation: 1.06599
AUDUSD - Daily Timeframe
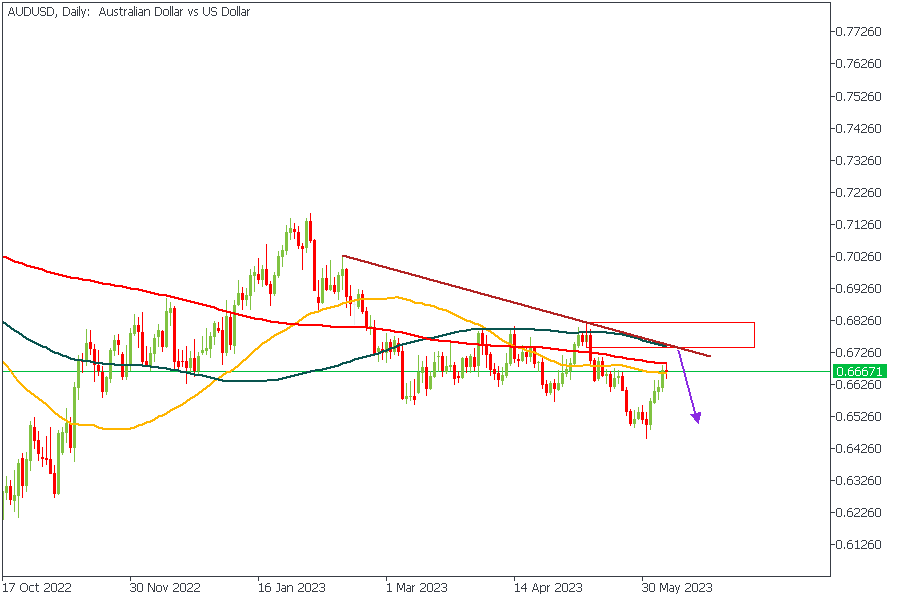
AUDUSD has not yet reached the major resistance zone I have in mind. However, pending the time, I will aim for a clear break of structure (BoS) in the 1Hour timeframe to consolidate my bearish sentiment. The confluences for this trade are;
- Resistance trendline
- Rally-base-drop supply zone
- The bearish array of the moving averages
- 200-Day moving average resistance
Analyst’s Expectations:
- Direction: Bearish
- Target: 0.65435
- Invalidation: 0.68251
GBPUSD - Daily Timeframe
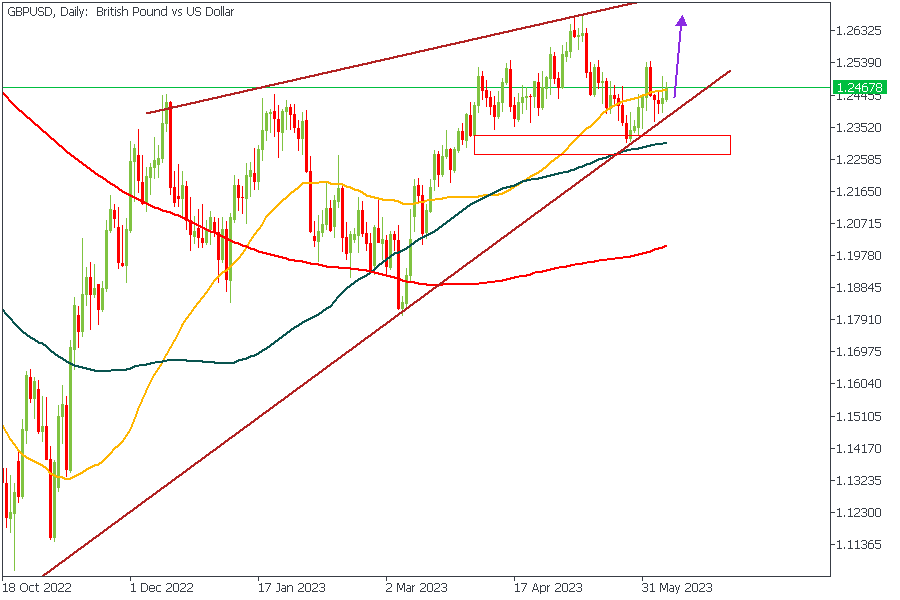
GBPUSD is trading within a rising wedge and has recently seen a clear rejection from the rally-base-rally demand zone and the moving average support. The moving average array also looks clearly bullish, and the 100-Day moving average provided ample support to confirm bullish sentiment.
Analyst’s Expectations:
- Direction: Bullish
- Target: 1.25740
- Invalidation: 1.23679
CONCLUSION
The trading of CFDs comes at a risk. Thus, to succeed, you have to manage risks properly. To avoid costly mistakes while you look to trade these opportunities, be sure to do your due diligence and manage your risk appropriately.
SEC Crackdown and the Future of Crypto
Are you aware of the recent crackdown by the SEC on major cryptocurrency exchanges, Binance US and Coinbase? Surprisingly, savvy Bitcoin traders seem unfazed, as options-based implied volatility metrics indicate. It appears that the lawsuits were anticipated and already factored into the market. Implied volatility reflects investors' expectations of price turbulence, but little evidence of heightened concern exists. Bitcoin's implied volatility has increased slightly since the SEC news, mainly in short-duration options. The impact seems more significant on alternative cryptocurrencies rather than Bitcoin and Ethereum. While the SEC's actions have affected certain altcoins, bitcoin has experienced relatively stable daily price moves. Stay vigilant and watch market developments as you navigate the exciting world of forex trading!
US DOLLAR - Daily Timeframe
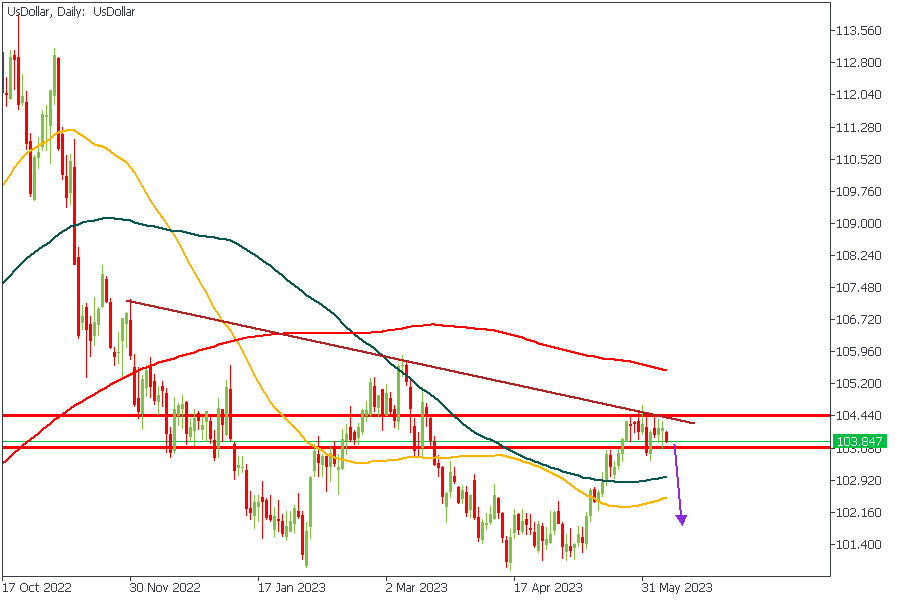
The rejection from the trendline resistance has been clearly established, but we’re yet to see the price trade clear of the pivot zone. My sentiment is bearish based on the following factors;
- Trendline resistance
- Pivot zone acting as supply
- The moving average array is bearish
Analyst’s Expectations:
- Direction: Bearish
- Target: 103.252
- Invalidation: 104.249
BTCUSD - Daily Timeframe
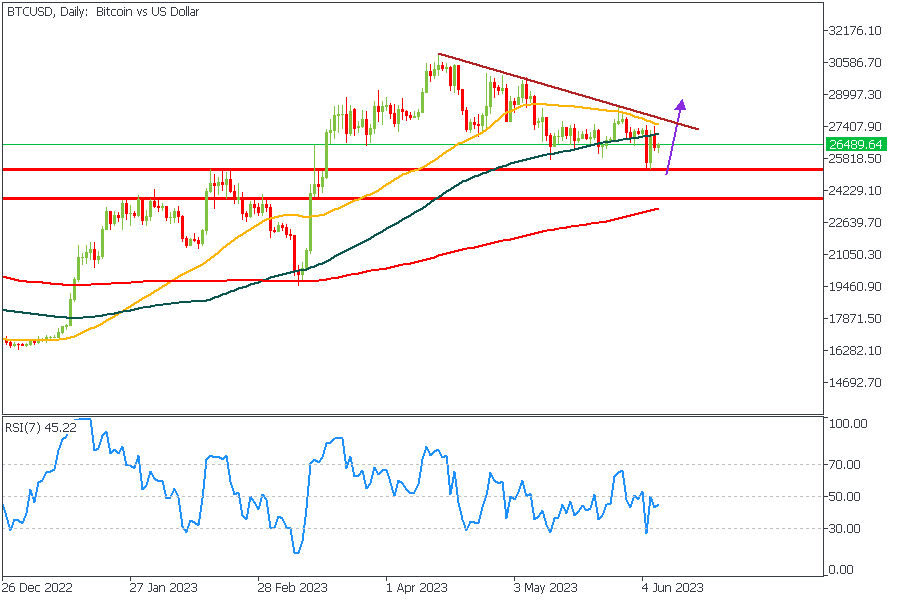
BTCUSD has been rejected from the pivot zone; however, more convincing is needed. Considering the confluence from the 200-Day moving average support, bullish moving average array, as well as the possibility of the RSI being oversold, I will patiently wait for the price to retest the pivot zone once more and then take a trigger from the lower timeframe change of structure.
Analyst’s Expectations:
- Direction: Bullish
- Target: 27618.24
- Invalidation: 24068.47
ETHUSD - Weekly Timeframe
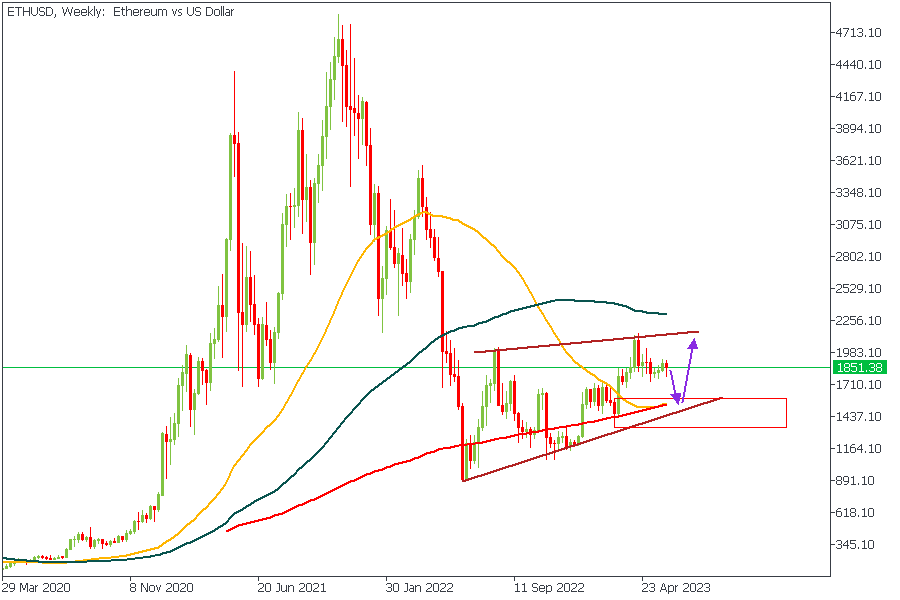
Ethereum requires a bit of patience because the price is currently trading within a wedge pattern, and there hasn’t been a breakout of the wedge yet to signal a clear direction. However, I have a few factors pointing to the possibility of bullish price action in the nearest future, including;
- Support trendline
- Drop-base-rally demand zone
- 50-Day moving average support
- 200-Day moving average support
Analyst’s Expectations:
- Direction: Bullish
- Target: 1996.36
- Invalidation: 1341.44
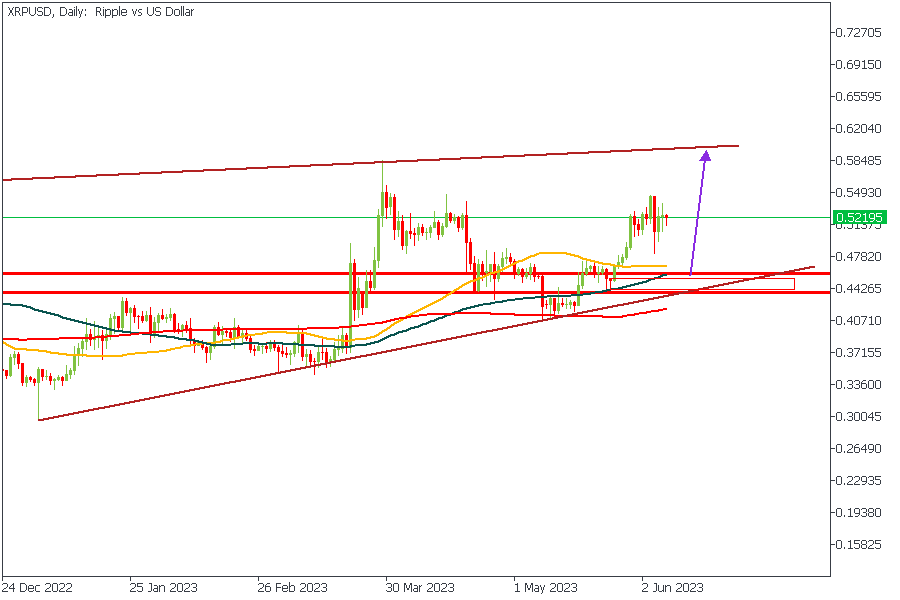
XRPUSD - Daily Timeframe
XRPUSD is trading within a rising wedge with the possibility of a retest of the trendline support. The moving average array also looks bullish, and the 50, 100, and 200 Day moving averages provided ample support to confirm bullish sentiment.
Analyst’s Expectations:
- Direction: Bullish
- Target: 0.55081
- Invalidation: 0.43797
CONCLUSION
The trading of CFDs comes at a risk. Thus, to succeed, you have to manage risks properly. To avoid costly mistakes while you look to trade these opportunities, be sure to do your due diligence and manage your risk appropriately.
WTI Futures Retest Restrictive Trendline
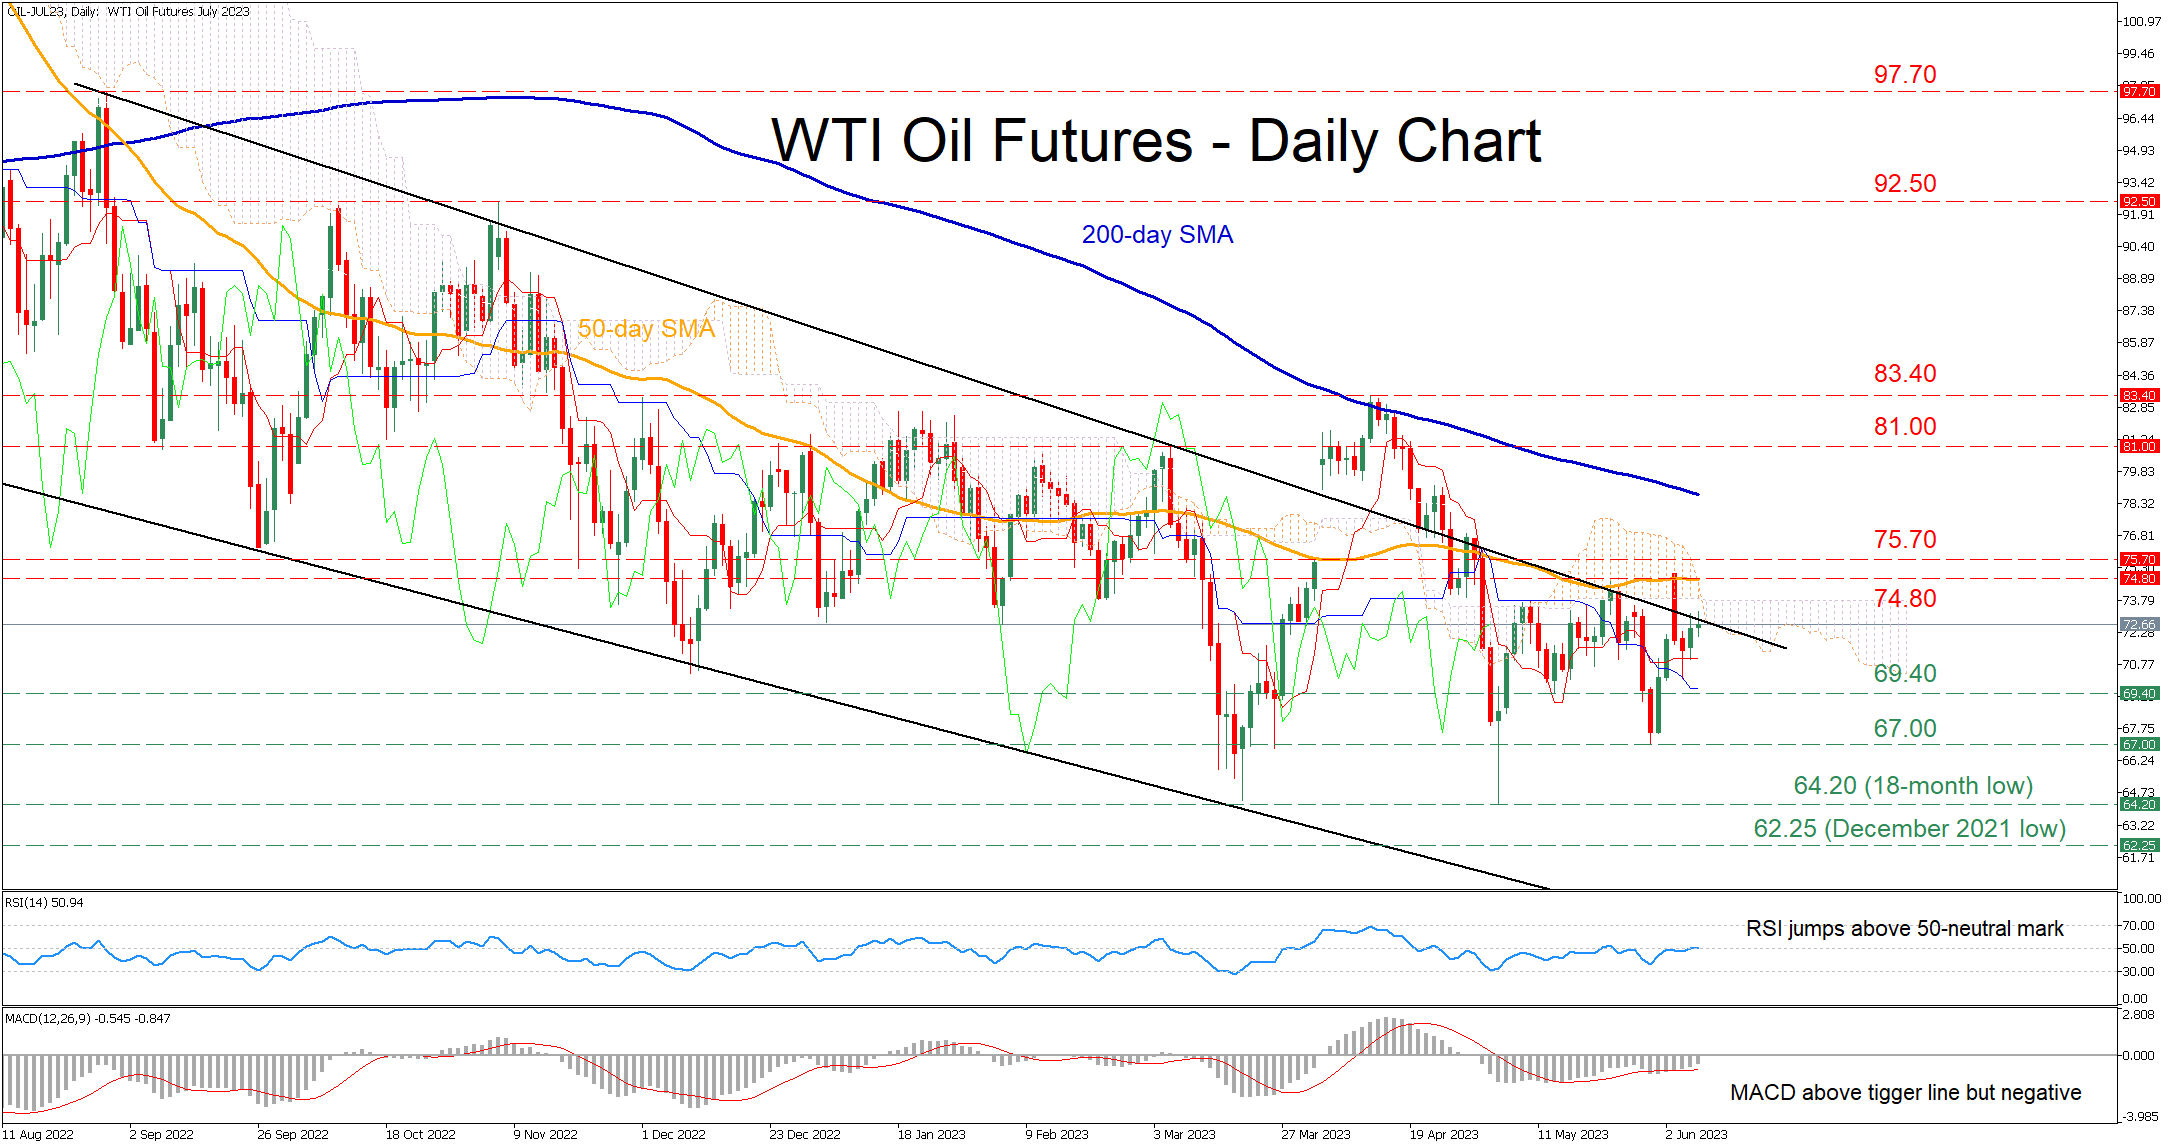
WTI oil futures (July delivery) have been moving without a clear direction in the last month. Even though the commodity managed to spike above the upper end of its downward sloping channel after OPEC’s decision to cut output, the price quickly retraced lower and re-entered its long-term bearish pattern.
The momentum indicators are reflecting a cautiously positive tone. Specifically, the RSI jumped above its 50-neutral mark, while the MACD is strengthening above its red signal line but remains in the negative zone.
Should the price manage to close above its restrictive trendline, immediate resistance could be met at the 50-day simple moving average (SMA), currently at 74.80. Jumping above that zone, WTI futures may ascend towards 75.70 or higher to test the March peak of 81.00. A break above the latter could pave the way for the 2023 high of 83.40.
On the flipside, if the bulls fail to conquer the crucial technical region, the price could reverse towards the May support of 69.40. Should that barricade get violated, the spotlight could turn to the recent bottom of 67.00. A dive below that floor could open the door for the double-bottom of 64.20, which is also an 18-month low.
In brief, WTI oil futures are trading very close to the upper boundary of their long-term descending channel, attempting to post a bullish breakout. However, a failure to do so could trigger a significant retreat towards the recent lows.
EURUSD Shows Signs of Bottoming Out
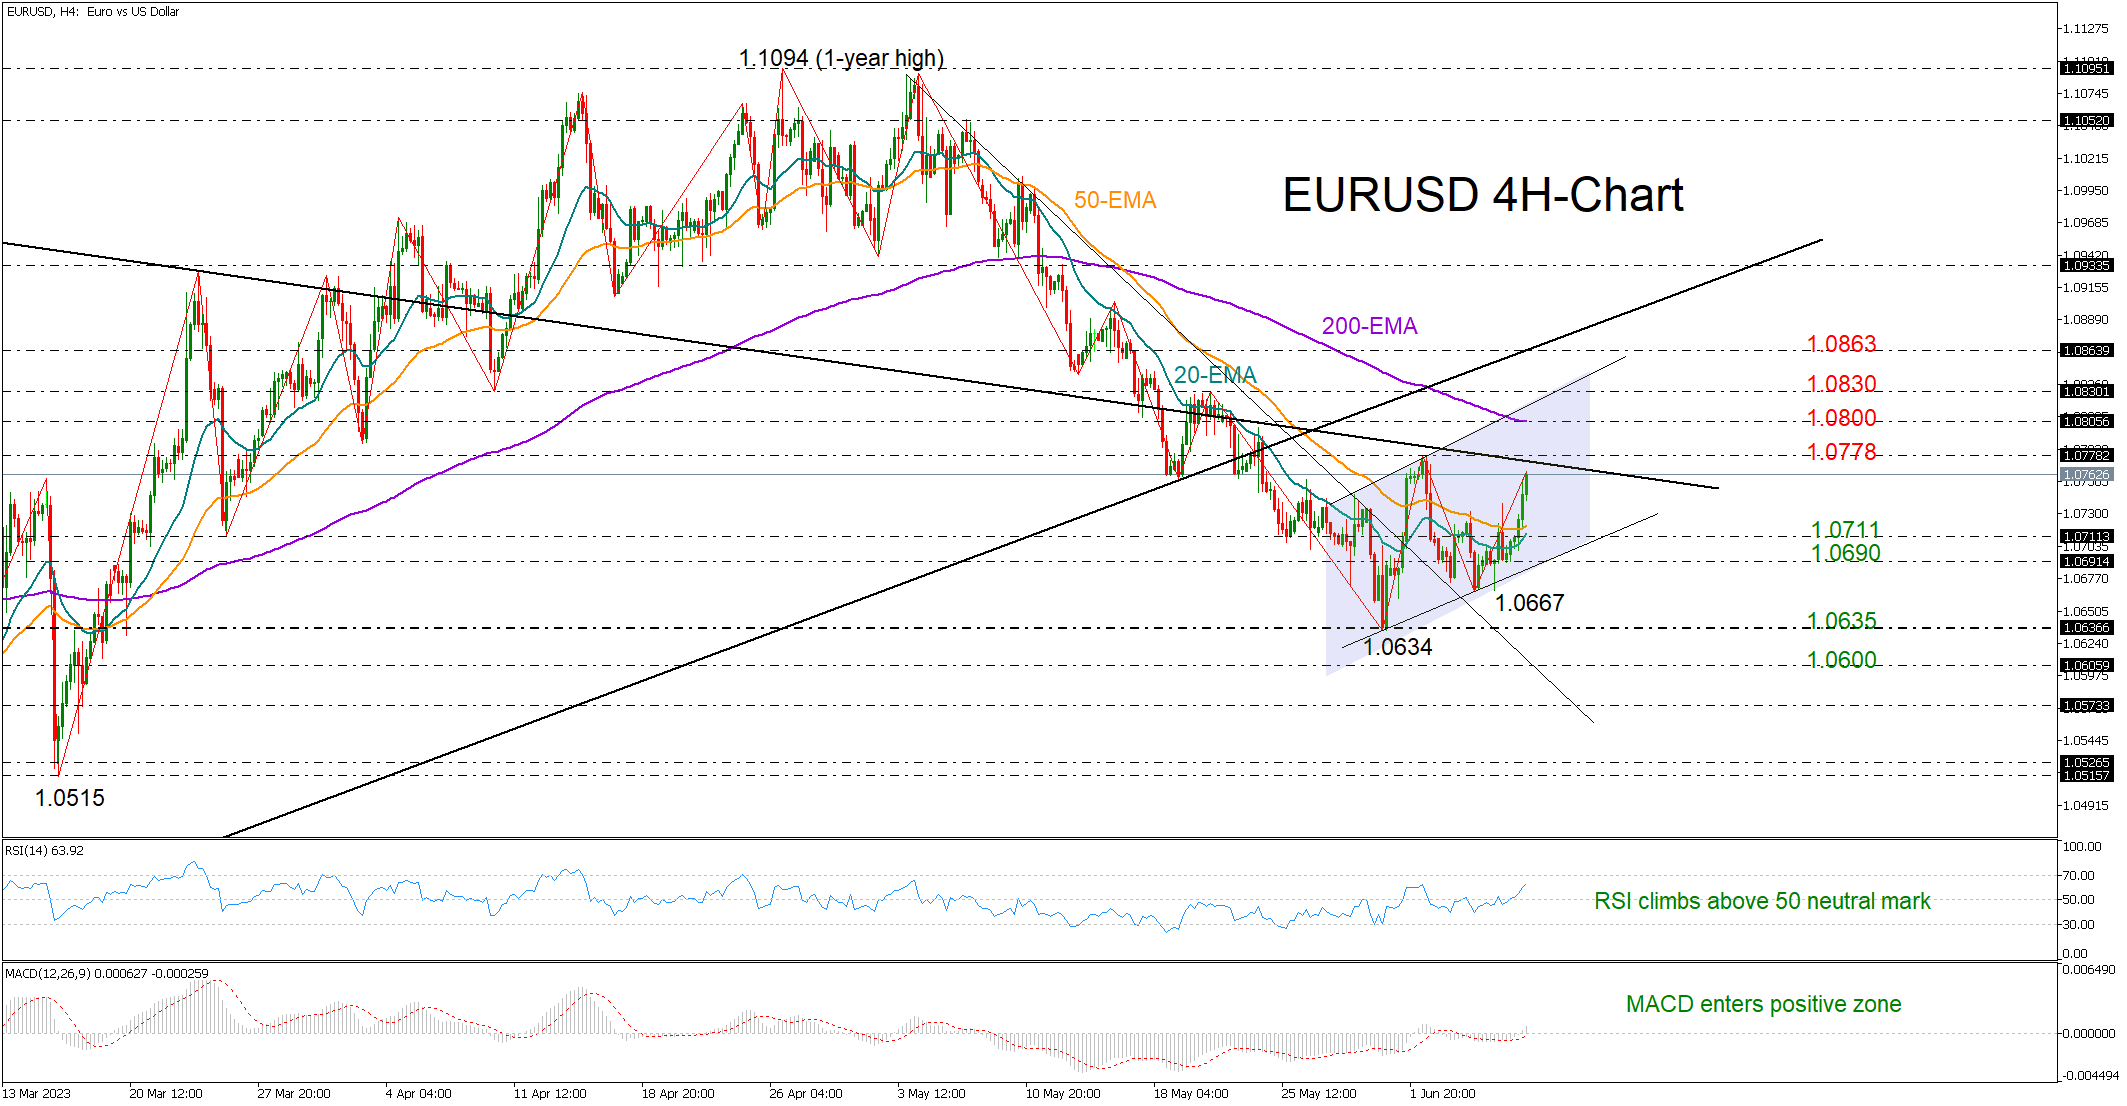
EURUSD strengthened its positive momentum on Thursday, rising as high as 1.0758 despite disappointing GDP data out of the eurozone.
The market structure has improved in the four-hour chart, with the pair marking a higher high at 1.0778 and a higher low at 1.0666, flagging a potential bullish trend reversal.
A sustainable recovery above June’s high of 1.0778, where the long-term resistance line from May 2021 is placed, could further boost optimism for a bullish trend reversal, likely bringing the 200-period exponential moving average (EMA) under examination. If the rally stretches above the short-term tentative resistance line and beyond the 1.0830 barrier too, the next stop could be near the broken ascending trendline from the 2022 lows seen around 1.0863.
Encouragingly, the RSI has climbed back above its 50 neutral mark and the MACD has entered the positive area, both reflecting improving sentiment in the market. Still, if the price drifts back below its 20- and 50-period EMAs, selling pressures may intensify towards the short-term support line at 1.0690. A continuation lower would shift the spotlight towards May’s trough of 1.0634, while a step below 1.0600 could confirm an extension towards the 2023 base of 1.0515.
Summing up, May’s sell-off seems to have found a bottom. An extension above June’s high of 1.0778 is now needed to further bolster buying appetite.
GBP/USD: Rises on Weaker Dollar, Bulls Look for Confirmation on Close Above Thick Daily Cloud
Cable accelerates higher on Thursday, lifted by weaker dollar as markets are still not sure what the Fed will decide in the next week’s policy meeting.
The latest surprises from RBA and BOC raise hopes that the US central bank would opt for another 25 basis points hike, against signals of pause in hiking cycle, although it is still unclear what the US policymakers will decide.
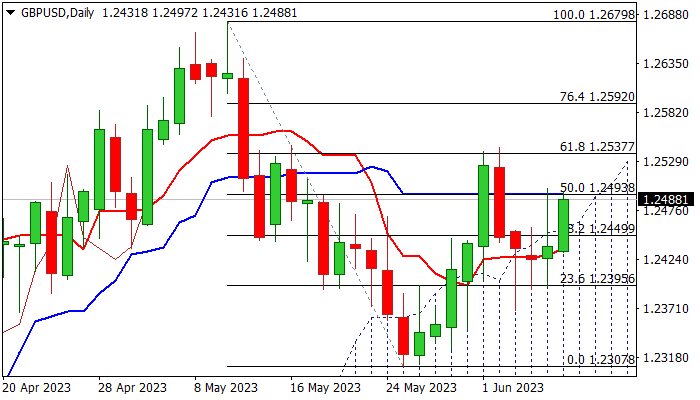
Fresh strength emerges again above the top of rising daily cloud following false breaks higher in past two days but needs to sustain gains above the cloud and close above 1.2493 pivot (50% retracement of 1.2679/1.2307 / daily Kijun-sen) to generate fresh direction signal after two consecutive long-legged daily Doji candles signaled strong indecision.
Improving daily studies (14-d momentum is back to positive territory / MA’s turning to bullish configuration) support the action, however, another failure to clearly break out from rising and thickening daily cloud would weaken near-term structure and keep the downside vulnerable.
Res: 1.2431; 1.2472; 1.2493; 1.2544.
Sup: 1.2450; 1.2435; 1.2397; 1.2368.
Sunset Market Commentary
Markets
Question today was whether markets would build on yesterday’s post-BoC repositioning. Team Tiff Macklem concluded they had no other option but to restart the tightening cycle. The demand/supply balance remained too stretched. It simply wasn’t justifiable anymore to reasonably hope that the 4.5% policy rate in place since January would be restrictive enough to bring inflation back to 2% in a sustainable manner. A similar analysis applies to multiple developed economies, reinforcing the case for a widespread ‘higher for longer’ scenario. At the start in Europe, EMU yields tentatively tried some follow-through action on yesterday’s rise, but the move immediately stalled. There was too little ‘news’. The revision of EMU Q1 GDP growth (-0.1% from 0.1%) officially put the EMU economy in a (mild) recession at the turn of the year (-0.1% in Q4 2022 as well). This doesn’t change the picture going forward, but also didn’t help. German yields gradually nearing key resistance at 2.96/3% (2-y) and 2.55% (10-y) probably also put a lid on a further rise (for now). US jobless claims jumped sharply from 233k to 261k. Continuing claims declined further (157k from 1794k). It evidently won’t change the Fed’s assessment at next week’s policy meeting. Still, US yields after the release dropped in the negative territory (except for the very long end). The 2-y yield eases 4 bps. The 30-y trades more or less unchanged. German yields shed less than 2 bps across the curve. Equities (both in the Europe and in the US) are keeping up well (Eurostoxx 50 +0.15%, S&P opens little changed). In this respect, we keep an eye at real yields. For now, the recent rise doesn’t hurt sentiment too much. Still, the US (10-y) real yield is on the verge of breaking out of a consolidation/bull flag pattern (cf graph infra).
On FX markets, the dollar gives tentative signs of a topping off pattern, but first relevant technical support hasn’t been broken yet. DXY dropped to 103.65 (ST neckline at 103.38). EUR/USD rebounds to 1.0745, but last week’s ‘minor’ top (1.0779) survives. EUR/GBP held a tight range near 0.86. The Swiss franc this afternoon jumped sharply from EUR/CHF 0.976 to fill bids just below the 0.7 big figure. SNB’s Jordan warned on second and third round effects. As Swiss yields are relatively low, Jordan advocated that it’s not a good idea to wait with raising rates. An additional hike at the June 22 SNB meeting can be taken for granted.
News & Views
The IMF concluded its regular country review of Norway, releasing the statement of this year’s so-called Article lV mission. Output grew strongly in 2022 and it is projected to expand this year, albeit at a slower pace. While high inflation and interest rates weigh on activity, the labor market has been resilient, and Norway has enjoyed very favorable terms of trade. Risks to growth remain balanced, but there are upside risks to inflation. The IMF added that supervisory authorities should remain vigilant to potential pressures in the real estate markets and global turbulence. Fiscal policy should be more supportive of the Norges Bank’s disinflationary efforts. Last month, the government did the opposite by announcing plans to raise spending of its sovereign wealth fund, widening the structural non-oil deficit for 2023 from NOK 317bn to NOK 373bn. Monetary policy has been responding in a timely manner, but to bring inflation durably towards the medium-term target of 2%, further tightening is needed.
Hungarian inflation decreased by 0.4% M/M in April (vs +0.5% expected) with the Y/Y figure dropping more than forecast, from 24% to 21.5%. Prices were mainly dragged lower by electricity, gas and other fuels (-3% M/M; 37.2% Y/Y). Food prices rose by 0.1% M/M (33.5% Y/Y) while services became 0.9% more expensive in April (14.3% Y/Y). Earlier this month, Hungarian Q1 GDP growth was downwardly revised to -0.3% Q/Q. Both April retail sales (-12.6% Y/Y) and industrial production (-2.5% M/M & -5.8% Y/Y) also fell more sharply than anticipated. The recessionary environment and accelerating disinflationary tendencies allow the Hungarian central bank to continue efforts to reduce emergency deposit rate towards the 13% base rate. The forint stomachs the data well, holding near strongest levels against the euro since April of last year (EUR/HUF 368).
USD/CHF Mid-Day Outlook
Daily Pivots: (S1) 0.9062; (P) 0.9084; (R1) 0.9125; More...
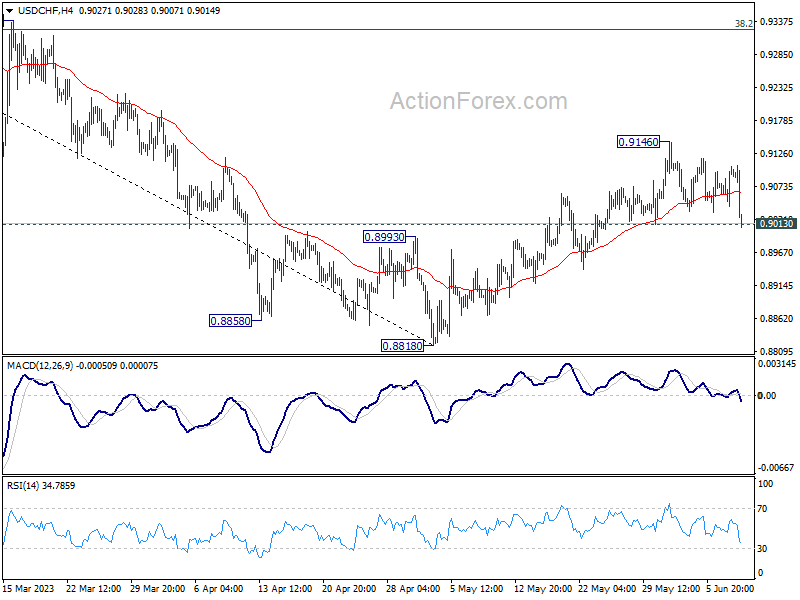
Immediate focus is now on 0.9013 minor support in USD/CHF with today's fall. Sustained break there will argue that corrective recovery from 0.8818 has completed at 0.9146 already. Intraday bias will turn back to the downside for retesting 0.8818 low. On the upside, though, above 0.9146 will resume the rebound towards 38.2% retracement of 1.0146 to 0.8818 at 0.9325.
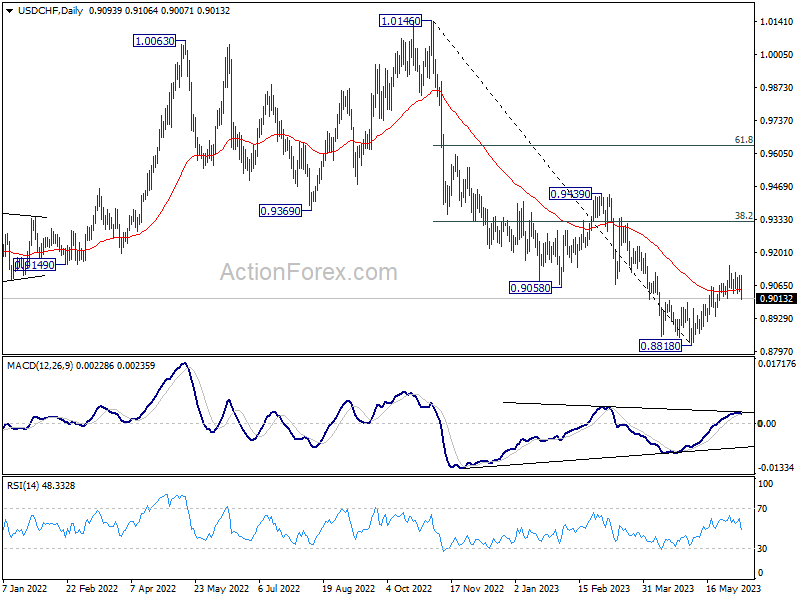
In the bigger picture, fall from 1.1046 (2022 high) is seen as a leg in the long term range pattern from 1.0342 (2016 high), which might have completed at 0.8818 already, just ahead of 0.8756 long term support. Sustained trading above 0.9058 support turned resistance should confirm medium term bottoming. Further break of 0.9439 resistance will confirm bullish trend reversal.
USD/JPY Mid-Day Outlook
Daily Pivots: (S1) 139.39; (P) 139.82; (R1) 140.61; More...
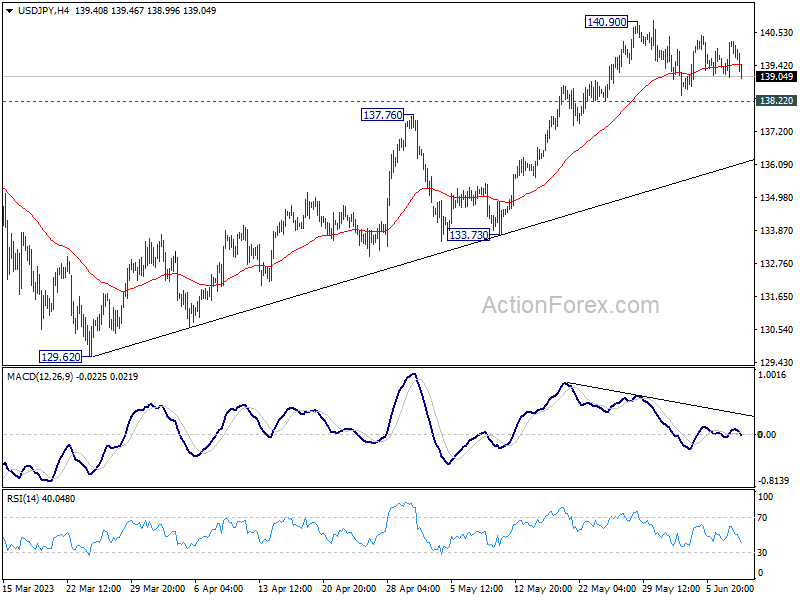
No change in USD/JPY's outlook and intraday bias remains neutral. With 138.22 minor support intact, further rally is expected. On the upside, break of 140.90 will resume larger rise from 127.20 to 142.48 fibonacci level. However, considering bearish divergence condition in 4 hour MACD, break of 138.22 will confirm short term topping, and turn bias back to the downside for 55 D EMA (now at 136.62).
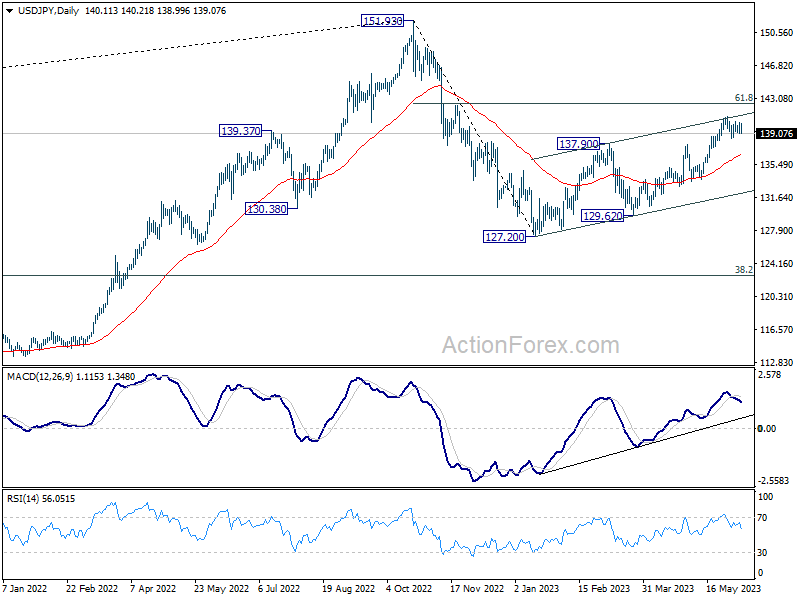
In the bigger picture, rise from 127.20 is seen as the second leg of the corrective pattern from 151.93 high. Stronger rally would be seen to 61.8% retracement of 151.93 to 127.20 at 136.34. Sustained break there will pave the way back to retest 151.93. On the downside, however, break of 133.73 support will argue that the pattern could have started the third leg through 127.20 low.
GBP/USD Mid-Day Outlook
Daily Pivots: (S1) 1.2389; (P) 1.2444; (R1) 1.2494; More...
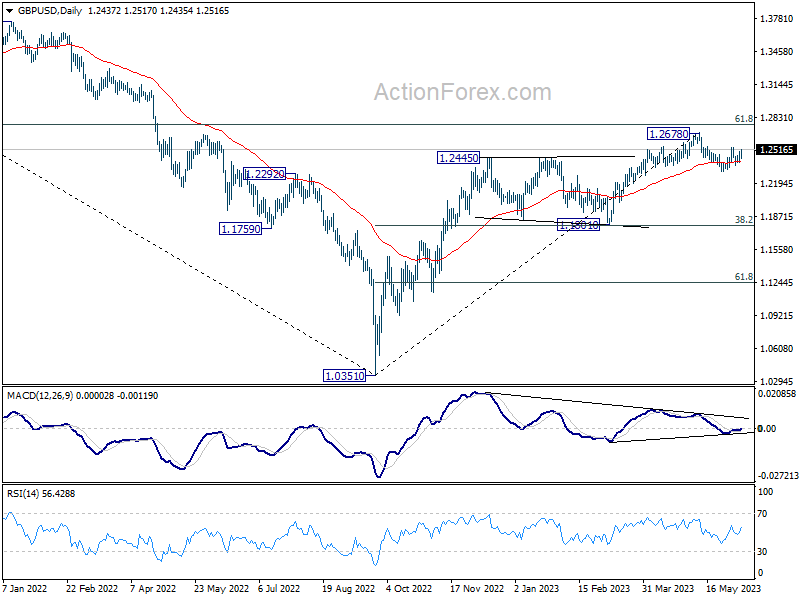
Intraday bias in GBP/USD stays neutral at this point. On the upside, break of 1.2543 will resume the rebound from 1.2306. Further rally should then be seen to retest 1.2678 high. On the downside, break of 1.2306 will resume the correction from 1.2678. Deeper decline would then be seen to 1.1801 cluster support (38.2% retracement of 1.0351 to 1.2678 at 1.1789).
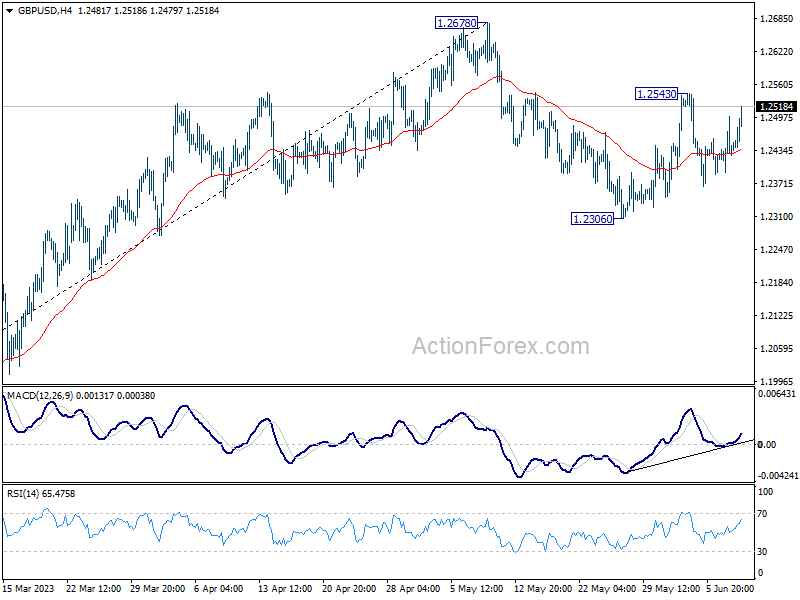
In the bigger picture, as long as 1.1801 support holds, rise from 1.0351 medium term bottom (2022 low) is expected to extend further. Sustained break of 61.8% retracement of 1.4248 (2021 high) to 1.0351 at 1.2759 will add to the case of long term bullish trend reversal. However, firm break of 1.1801 will indicate rejection by 1.2759, and bring deeper decline, even as a correction.