Sample Category Title
EUR/JPY Daily Outlook
Daily Pivots: (S1) 149.56; (P) 149.94; (R1) 150.57; More....
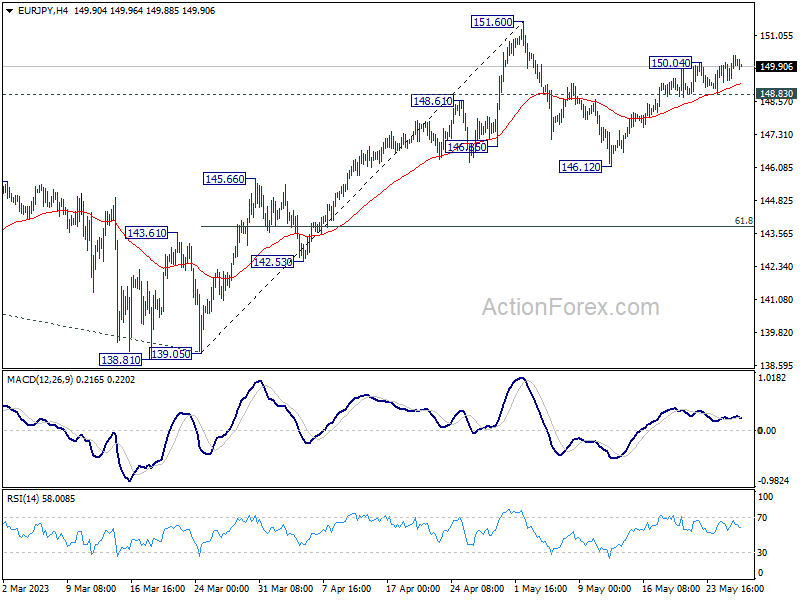
Intraday bias in EUR/JPY is back on the upside with break of 150.04 temporary top. Rebound from 146.12 is in progress for retesting 151.60 high. Decisive break there will resume larger up trend. On the downside, however, break of 148.83 minor support should extend the corrective pattern from 151.60 with another falling leg towards 146.12.
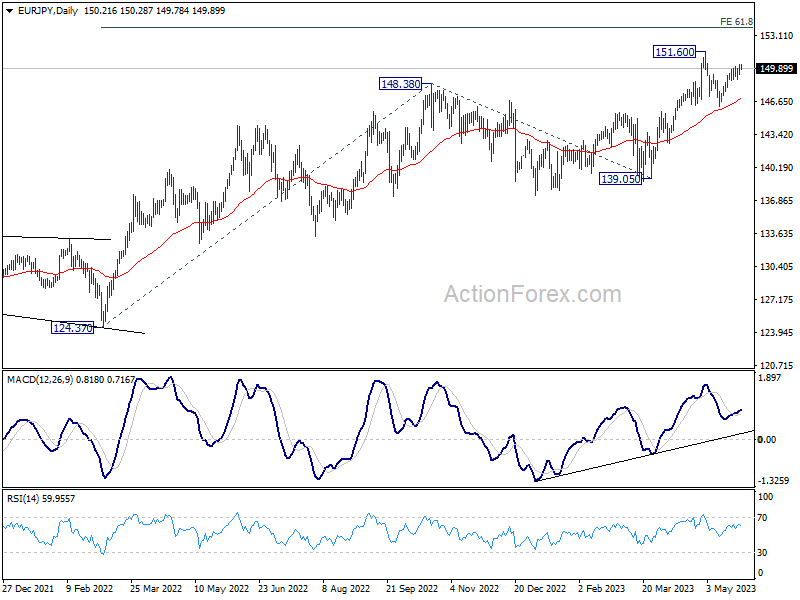
In the bigger picture, rise from 114.42 (2020 low) is in progress. Next target is 61.8% projection of 124.37 to 148.38 from 138.81 at 153.64. Sustained break there will pave the way to 100% projection at 162.82. For now, medium term outlook will remain bullish as long as 139.05 support holds, even in case of deep pull back.
EUR/GBP Daily Outlook
Daily Pivots: (S1) 0.8678; (P) 0.8692; (R1) 0.8718; More...
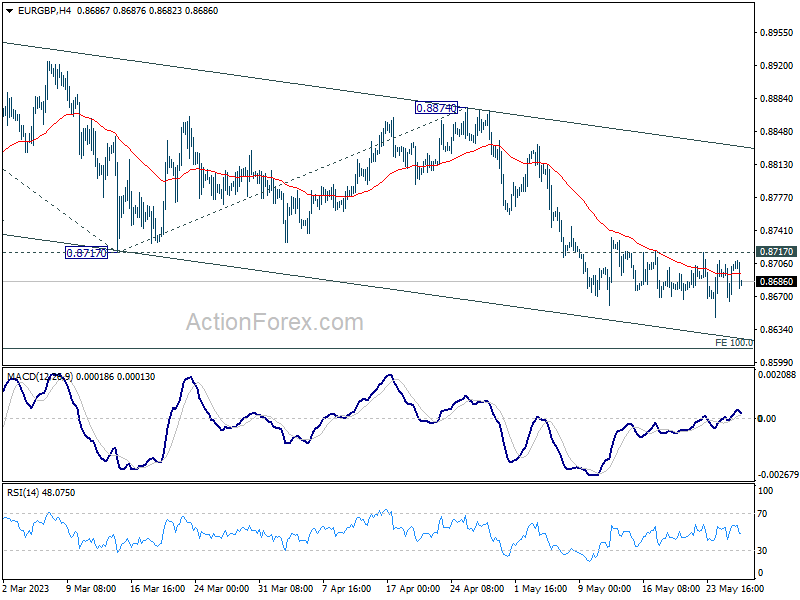
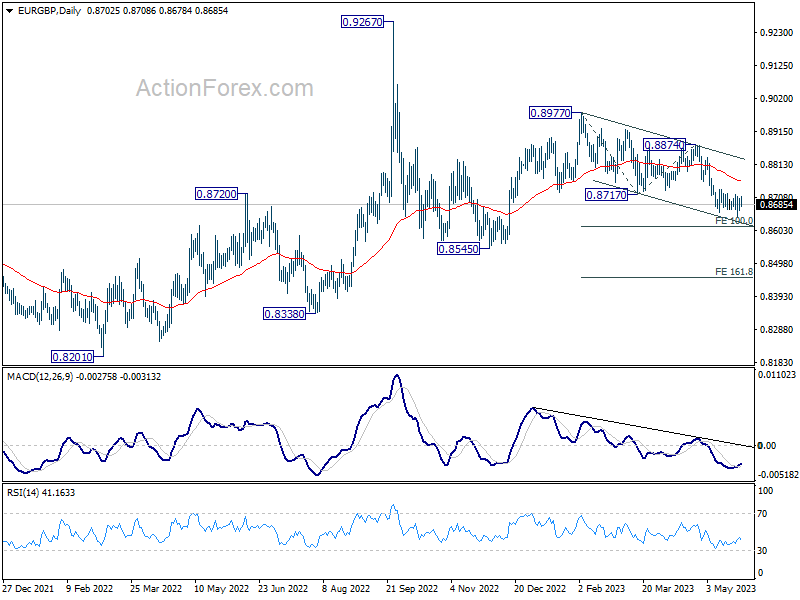
Further decline is still in favor in EUR/GBP with 0.8717 resistance intact. Current fall from 0.8977 should target 100% projection of 0.8977 to 0.8717 from 0.8874 at 0.8614. On the upside, however, break of 0.8717 will indicate short term bottoming, and turn bias back to the upside for stronger rebound.
In the bigger picture, current development argues that whole decline from 0.9267 (2022 high) is still in progress. This is part of the long term range pattern from 0.9499 (2020 high). Deeper fall would be seen through 0.8545 support. This will now remain the favored case as long as 0.8874 resistance holds.
EUR/AUD Daily Outlook
Daily Pivots: (S1) 1.6430; (P) 1.6464; (R1) 1.6520; More...
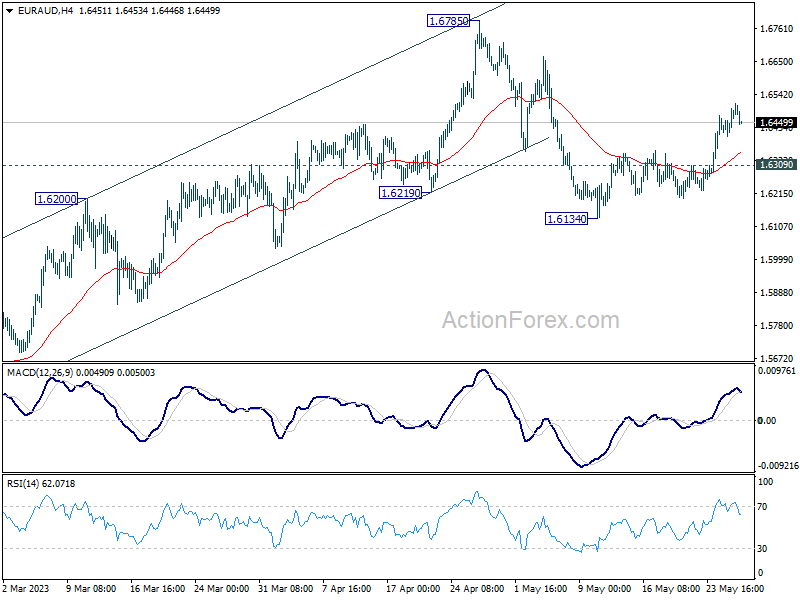
Intraday bias in EUR/AUD stays on the upside for the moment. Pull back from 1.6785 should have completed at at 1.6134, after drawing support from 55 D EMA (now at 1.6222). Further rally should be seen to retest 1.6785 high next. On the downside, however, break of 1.6309 minor support will dampen this view and turn bias neutral first.
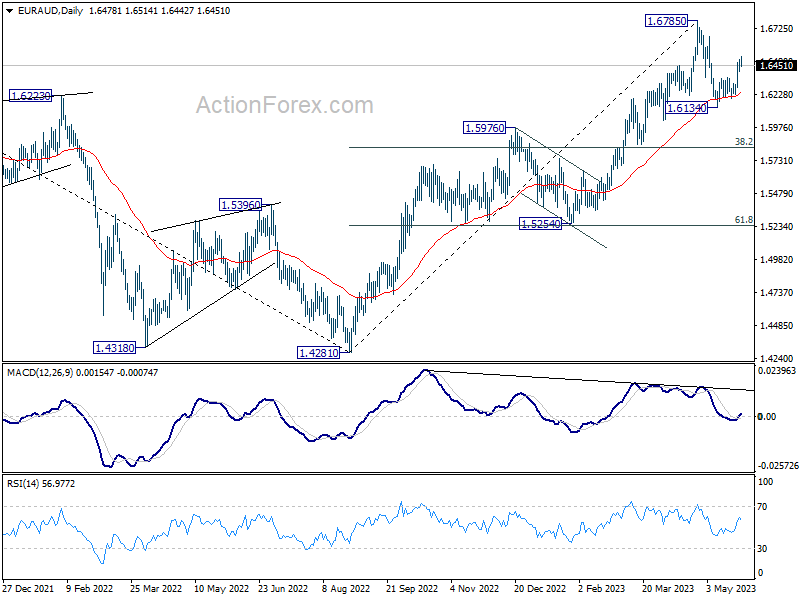
In the bigger picture, whole down trend from 1.9799 (2020 high) should have completed at 1.4281 (2022 low). Further rise should be seen to 61.8% retracement of 1.9799 to 1.4281 at 1.7691 next. For now, outlook will stay bullish as long as 1.5976 resistance turned support holds, even in case of deep pull back.
EUR/CHF Daily Outlook
Daily Pivots: (S1) 0.9699; (P) 0.9717; (R1) 0.9733; More...
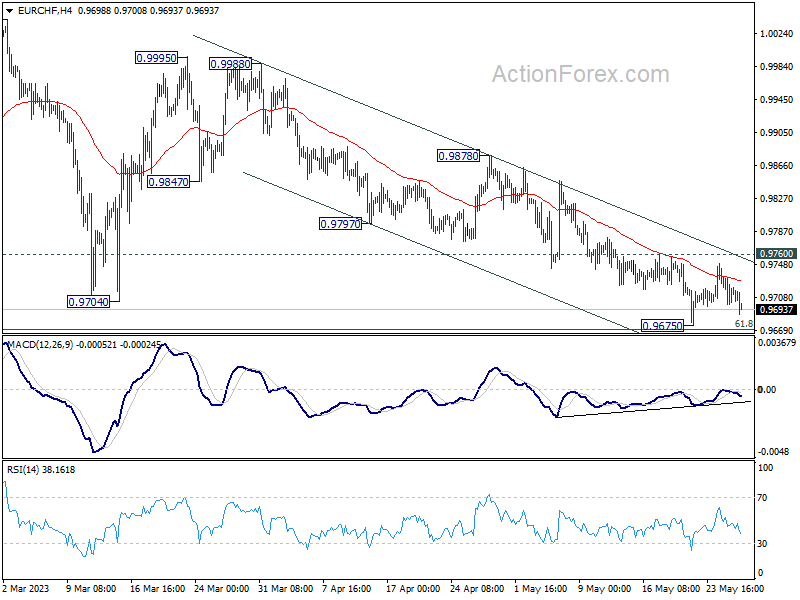
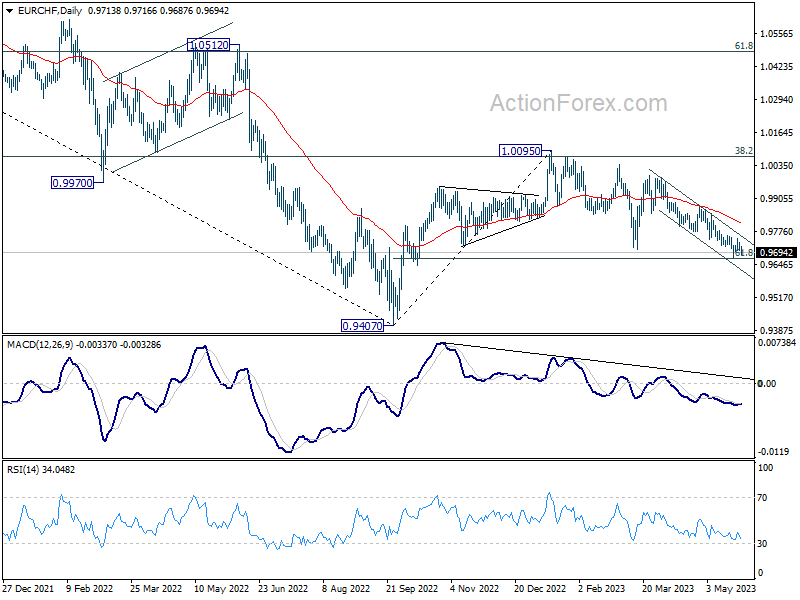
Intraday bias in EUR/CHF remains neutral for the moment. Strong support should still be seen around 61.8% retracement of 0.9407 to 1.0095 at 0.9670 to complete the whole corrective pattern from 1.0095. On the upside, firm break of 0.9760 resistance will confirm short term bottoming, and turn bias back to the upside for 0.9878 resistance next. However, sustained break of 0.9670 will pave the way back to 0.9407 low instead.
In the bigger picture, prior rejection by 38.2% retracement of 1.1149 to 0.9407 at 1.0072 suggests that medium term outlook is staying bearish. The pair is also capped below 55 W EMA (now at 0.9963). Down trend from 1.2004 is not completed yet and is in favor to resume through 0.9407 at a later stage. However, decisive break of 1.0095 resistance will raise the chance of bullish trend reversal. Rise from 0.9407 should then target 1.0505 cluster resistance (2020 low at 1.0505, 61.8% retracement of 1.1149 to 0.9407 at 1.1484).
Gold and Crude Oil At Risk of More Losses
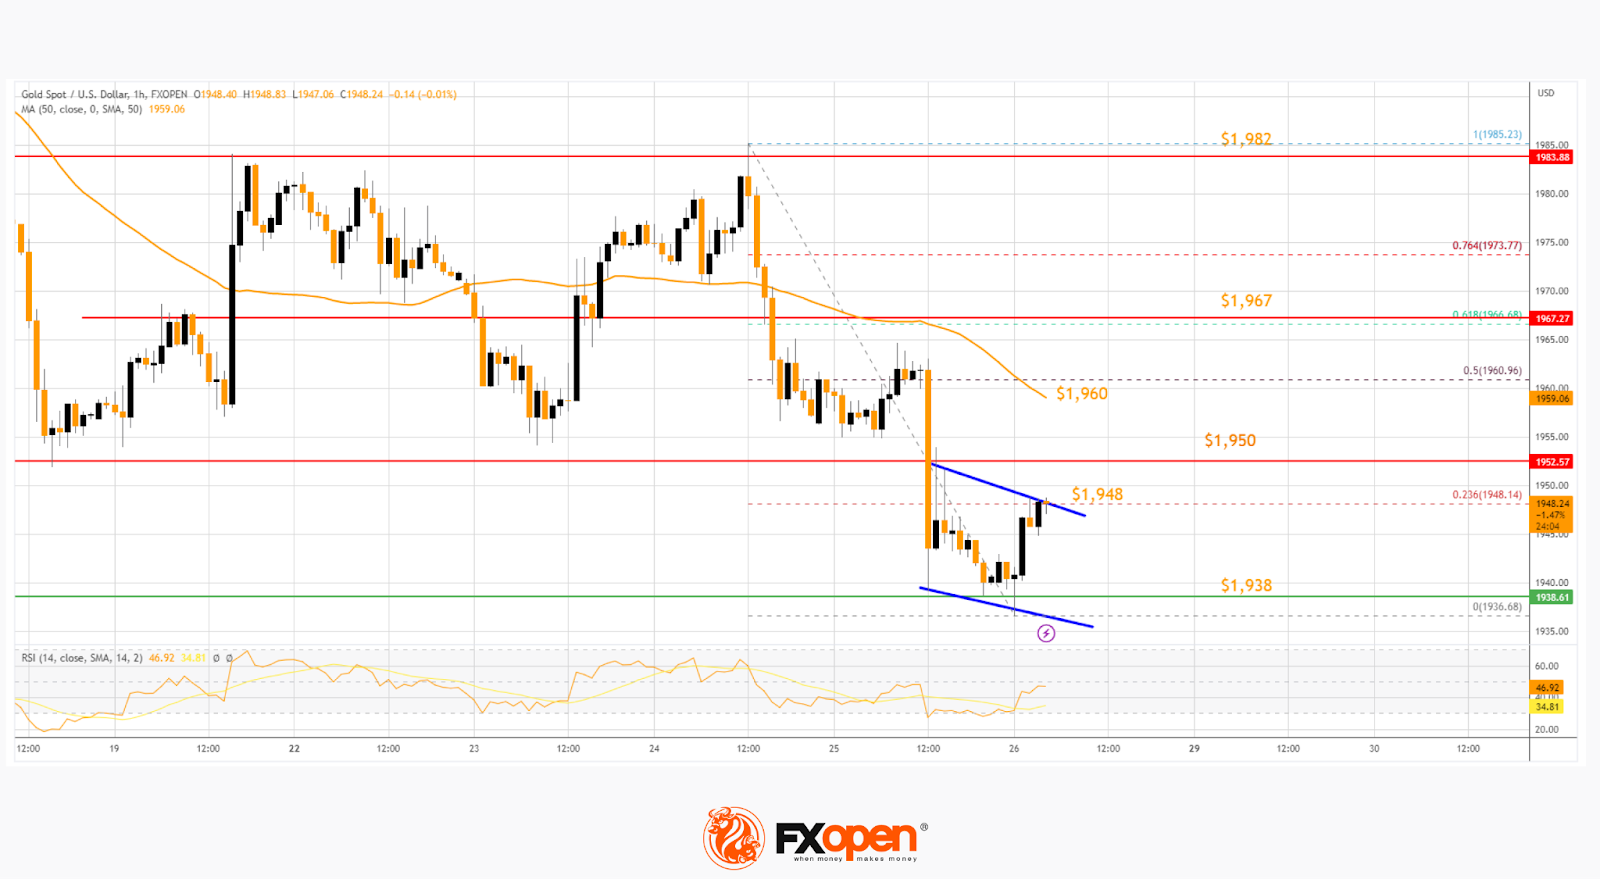
Gold price is struggling below the $1,967 support level. Crude oil price is also declining and remains at a risk of more losses below $70.75.
Important Takeaways for Gold and Oil Prices Analysis Today
- Gold price failed to clear the $1,982 resistance and trimmed gains against the US Dollar.
- It is now following a short-term declining channel with resistance near $1,948 on the hourly chart of gold at FXOpen.
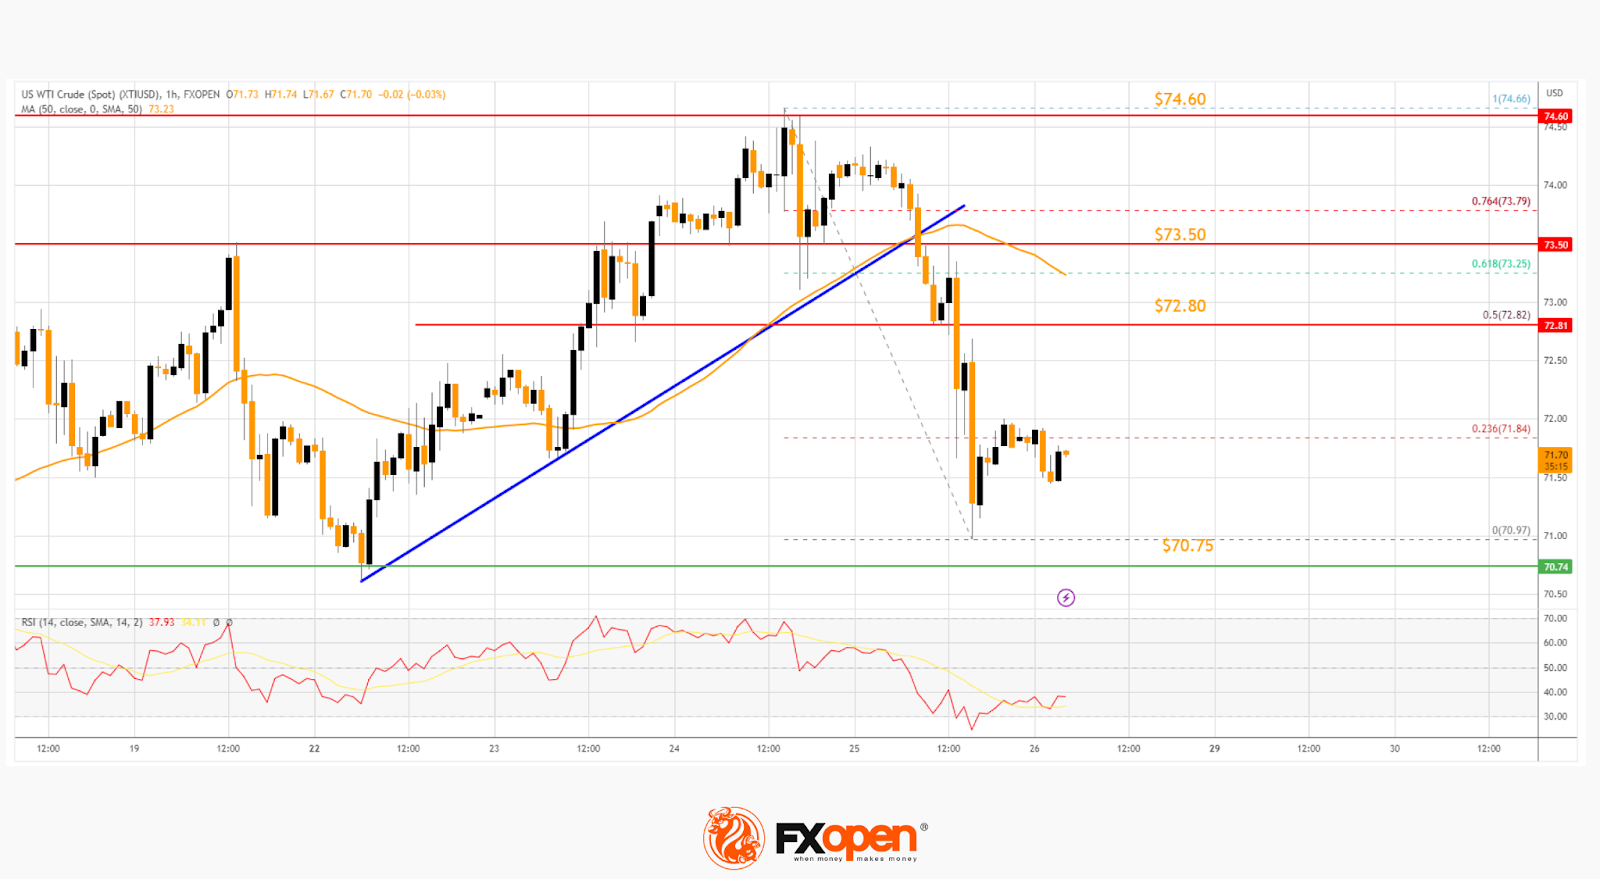
- Crude oil prices are also moving lower below $72.80 and $72.00 levels.
- There was a break below a major bullish trend line with support near $73.50 on the hourly chart of XTI/USD at FXOpen.
Gold Price Technical Analysis
On the hourly chart of Gold at FXOpen, the price struggled to start a fresh increase above the $1,982 resistance. The price started a fresh decline below the $1,967 support.
There was a close below the 50-hour simple moving average and $1,950. The price tested the $1,938 support zone. A low is formed at $1,936.68, and the price is now consolidating losses. It is following a short-term declining channel with resistance near $1,948.
The channel resistance is near the 23.6% Fib retracement level of the downward move from the $1,982 swing high to the $1,938 low. The next major resistance is near the $1,950 level.
If the breakout occurs, the price will target resistance of $1,960 near the 50% Fib retracement level of the downward move from the $1,982 swing high to the $1,938 low and the 50-hour simple moving average. An upside break above $1,960 could send the Gold price toward $1,967. Any more gains may perhaps set the pace for an increase toward the $1,982 level.
Initial support on the downside is near the $1,938 level. The first major support is near the $1,932 level. The next support sits near the $1,920 level. If there is a downside break below $1,920, the price might decline heavily towards $1,900, below which the bulls could aim for a test of $1,880.
Oil Price Technical Analysis
On the hourly chart of WTI Crude Oil at FXOpen, the price struggled to rise above the $74.60 resistance against the US Dollar. A high was formed near $74.66, and the price moved down.
There was a break below a major bullish trend line with support near $73.50. The price declined below the 50-hour simple moving average, and the RSI dropped to 25. A low is formed near $70.97, and the price is now consolidating losses.
It is trading near the 23.6% Fib retracement level of the recent decline from the $74.66 swing high to the $70.75 low, above which the price might attempt a recovery.
The first major resistance is near the 50% Fib retracement level of the recent decline from the $74.66 swing high to the $70.75 low at $72.80. Any more gains might send the price toward the $73.50 level in the coming days.
On the downside, support is near the $70.75 level. The next major support on the WTI crude oil chart is near $70.20. If there is a downside break, the price might decline toward $68.80. Any more losses may perhaps open the doors for a move toward the $66.50 support zone.
EUR/USD Approaches Important Support
Yesterday, EUR/USD hit new May’s lows. This week’s latest news contributed to the decline:
→ Germany's GDP in Q1 2023 decreased by 0.3% compared to the previous three months. German media write about the official start of the recession.
→ The US economy in Q1 grew by 1.3% in annual terms.
→ Worrying opinions are spreading about a possible crisis due to the situation in the US housing market. According to JPMorgan analysts, the next shock to the US banking system could be loans for commercial real estate.
→ Traders see the dollar as a reliable asset in the face of the not yet raised US government debt ceiling.
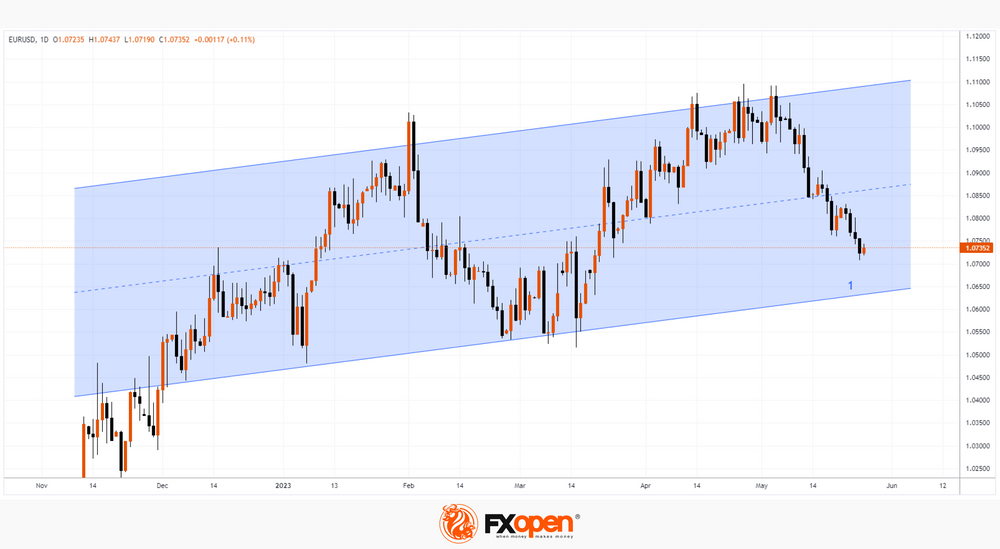
The EUR/USD chart shows that the rate has already fallen by 3.3% from the peaks of May. The rate is approaching the psychological mark of USD 1.07 per euro, which may support the market.
The technical analysis of EUR/USD gives reason to count on another potential support level. We are talking about the lower line (1) of an important ascending channel that has been operating since last year — if it is reached, buyers may become more active using the rebound trading strategy on the EUR/USD market.
USDCAD in Bullish Mode; Resistance at 1.3650
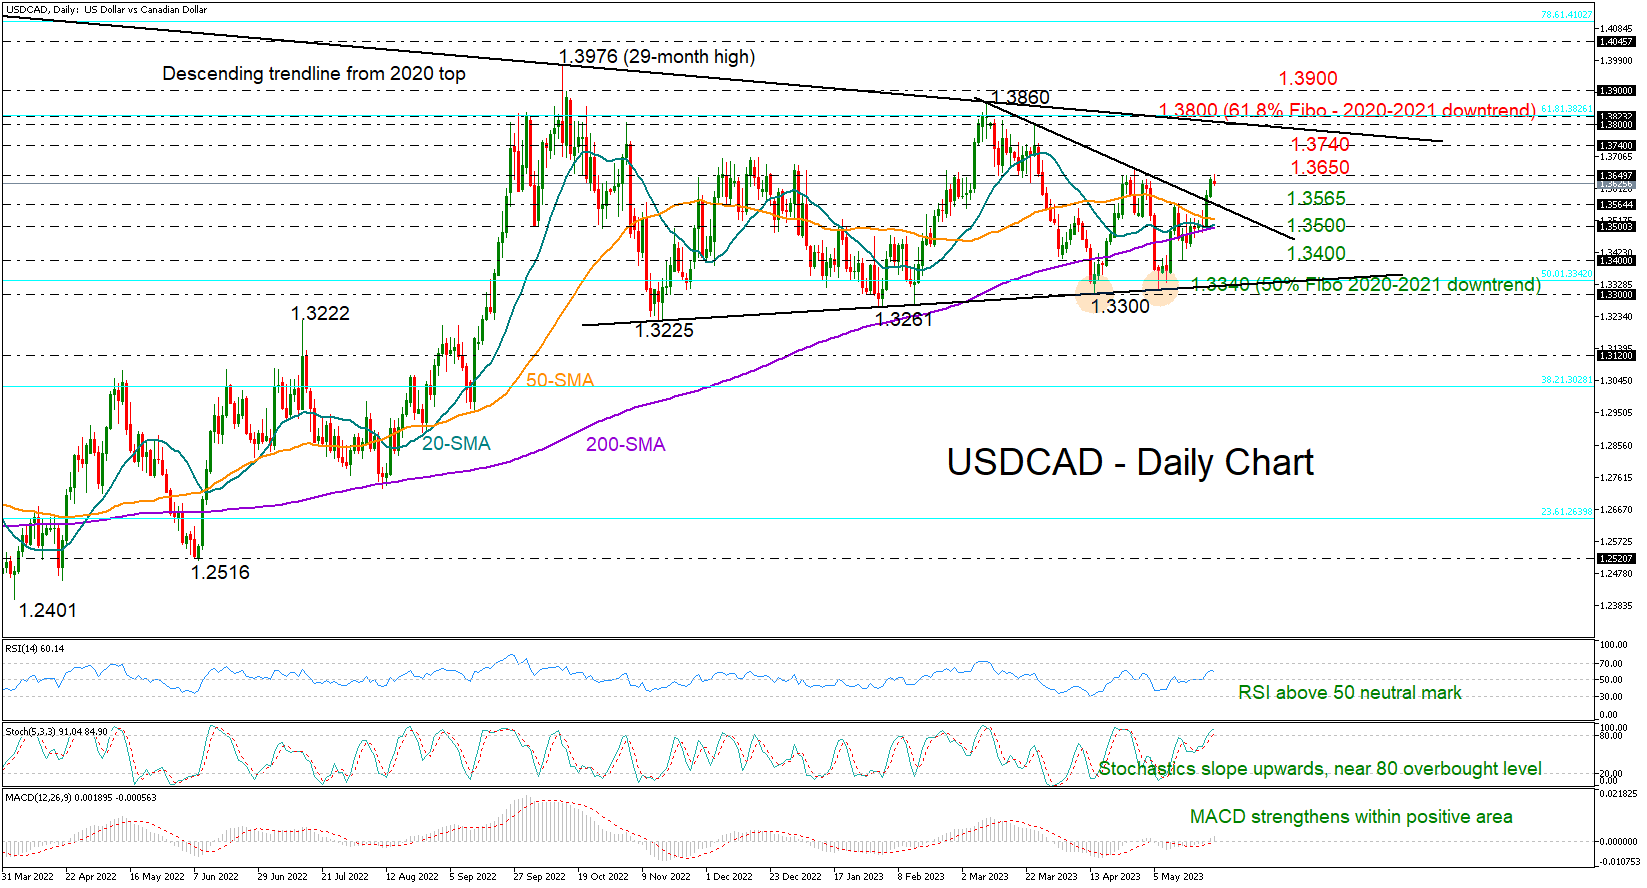
USDCAD bounced off its 200-day simple moving average (SMA) and went as high as 1.3653, surpassing a resistance line that had been in effect since March.
The technical picture is feeding optimism for a bullish continuation. The price has bottomed out twice around 1.3300 before drifting higher and beyond its simple moving averages (SMAs). Traders are currently waiting for a decisive close above the 1.3650 neckline to confirm the positive structure.
In momentum indicators, the RSI has crossed above its 50 neutral mark and the MACD has strengthened above its red signal and zero lines, both reflecting improving sentiment in the market.
Should the pair climb the 1.3650 wall, it may initially challenge the 1.3740 barrier and then push towards the crucial 1.3800-1.3830 zone, where the long-term descending line from the 2020 top is placed. The 61.8% Fibonacci retracement of the 2020-2021 downtrend is in the neighborhood as well. Therefore, a successful penetration higher could be the key for a rally towards the 1.3900 mark.
Alternatively, a downside reversal may take a breather near the broken resistance line at 1.3565. If the bears breach that base, the spotlight will fall immediately on the 200-day SMA at 1.3500. Moving lower, the price could retest the 1.3400 region ahead of the important 1.3340-1.3300 area. Notably, the 50% Fibonacci level and the almost flat support line from November are located here.
In brief, USDCAD has been trading within a broad range area for seven months now. While the short-term bias looks positive, the pair will need to claim the 1.3650 barricade in order to post new gains. In the big picture, a decisive rally above the 2022 peak of 1.3976 is required to change the market direction back to an uptrend.
AUDJPY Remains Above Key Area as Bearish Pressure Intensifies
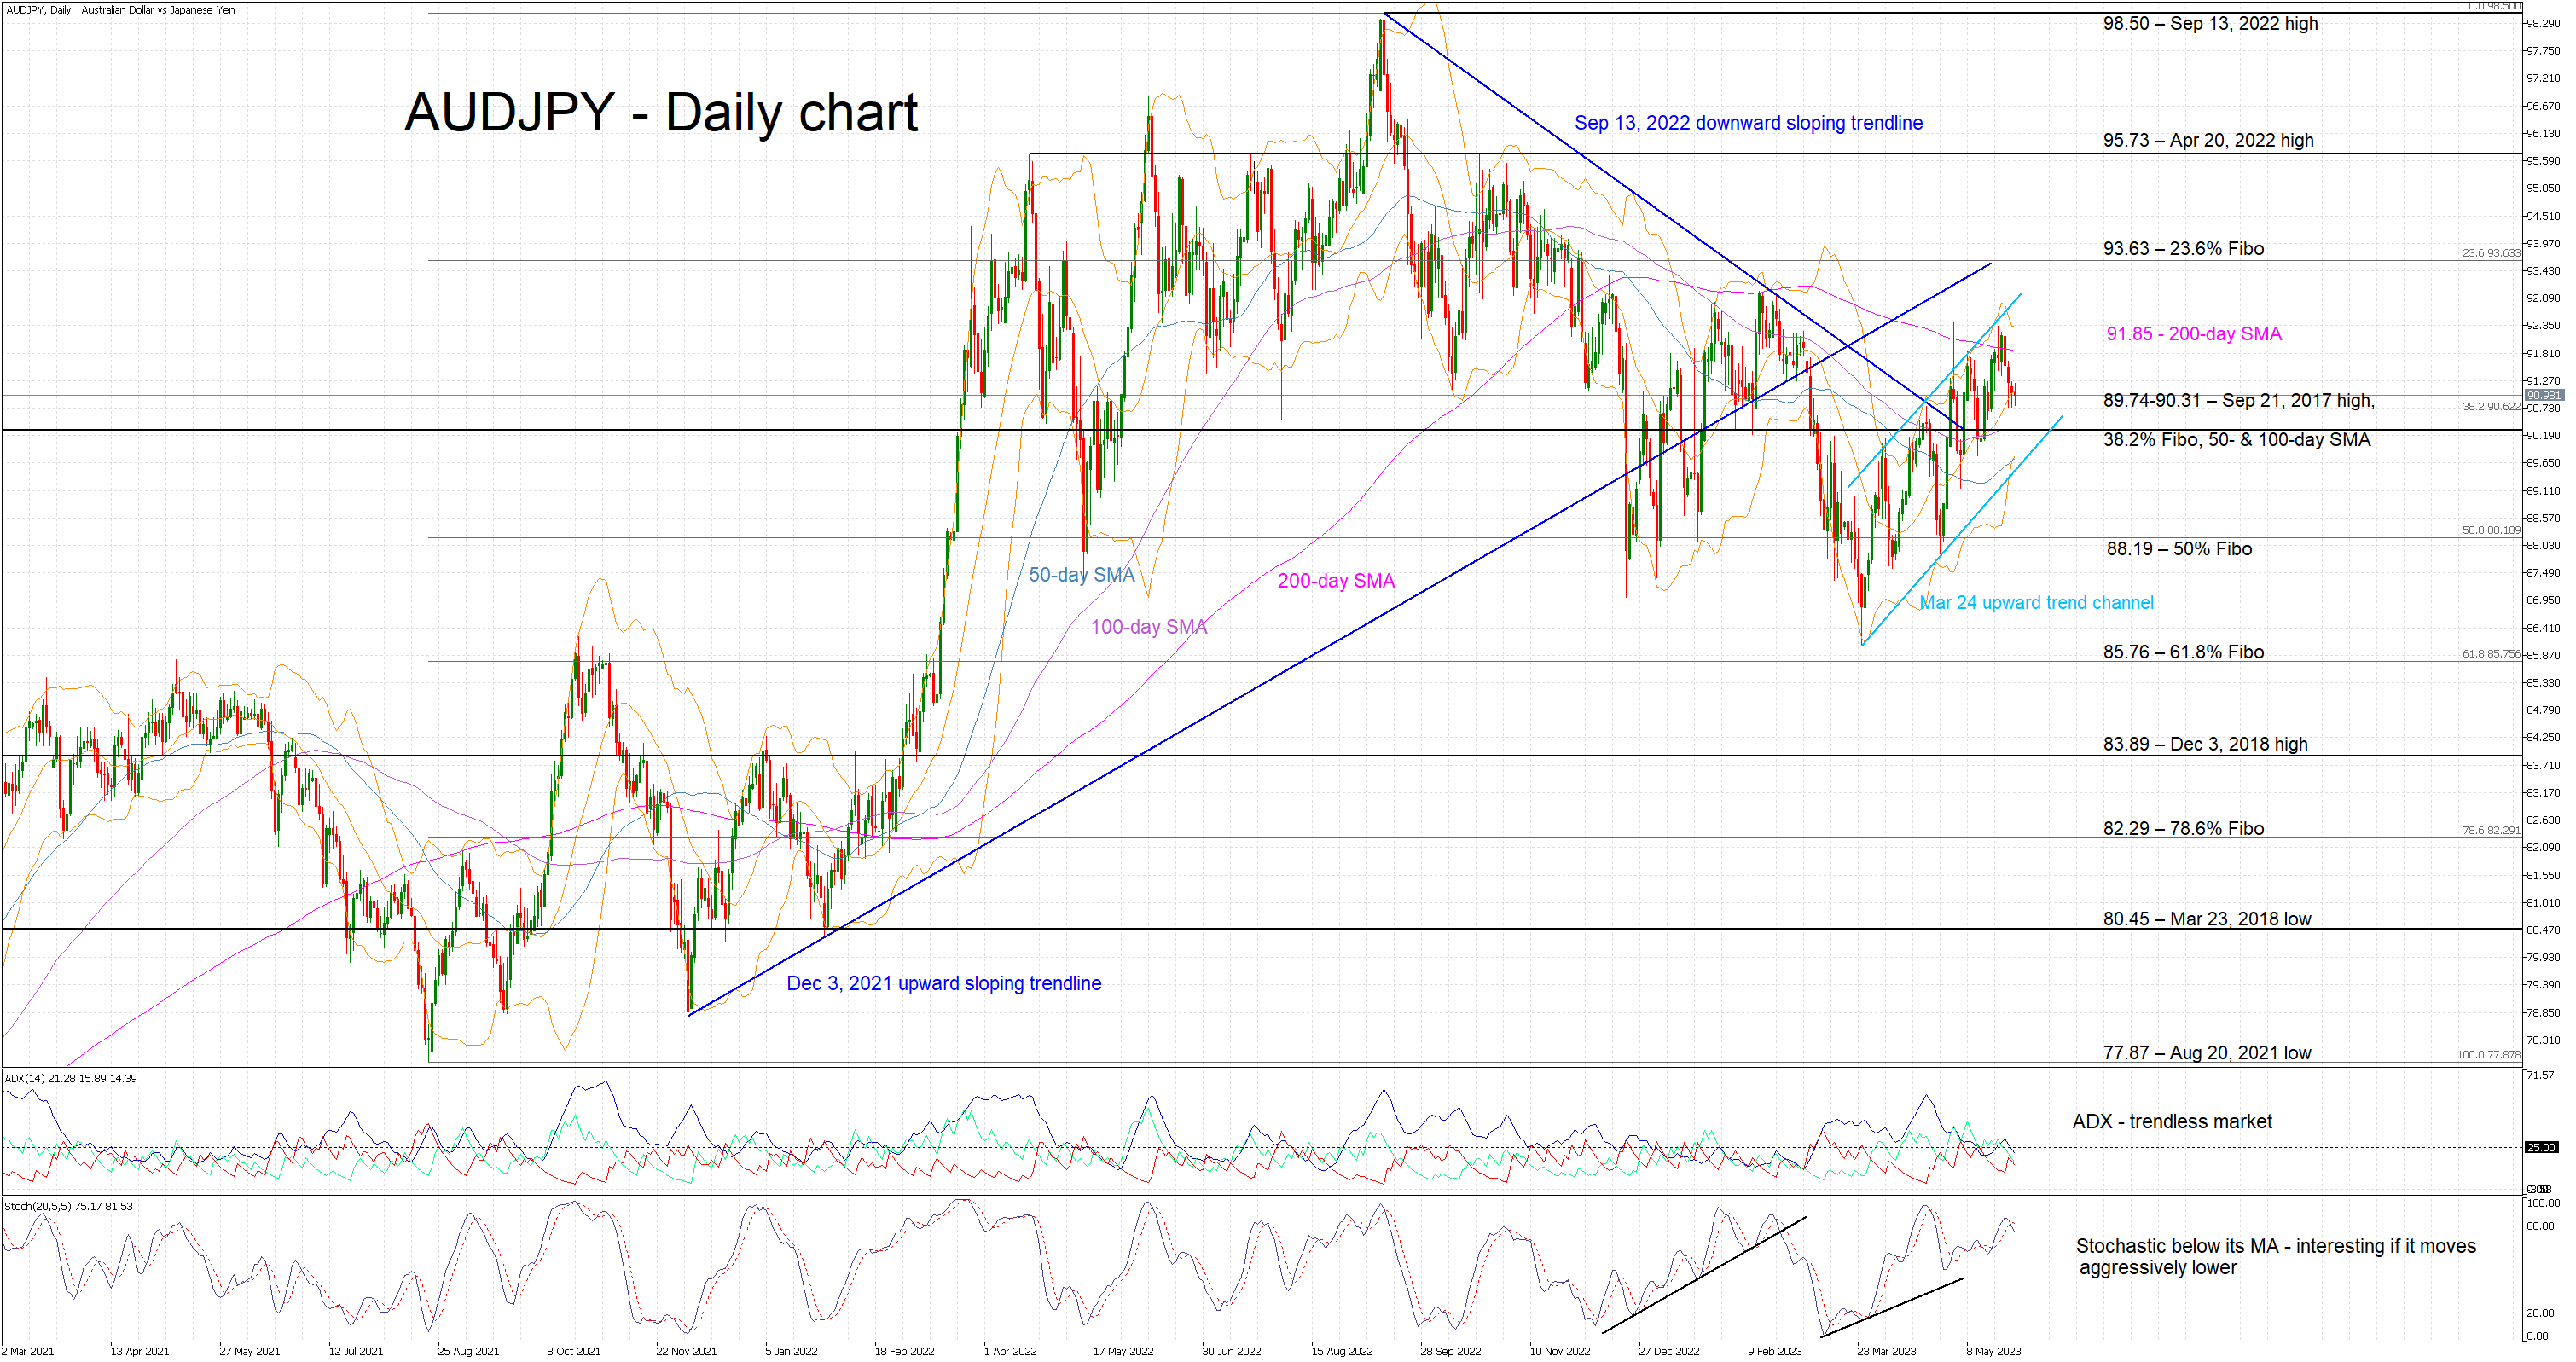
AUDJPY is hovering around the 91 level, just a tad above a rather busy area that is key for market sentiment. This pair has actually been trading inside an aggressive upward sloping trend channel, but its upside is currently being capped by the 200-day simple moving average (SMA). Therefore, AUDJPY has failed to record a higher high, which means that the bearish pattern of lower highs and lower lows that started on September 13, 2022 remains in place.
The momentum indicators are mixed at this stage as the Average Directional Movement Index (ADX) is pointing to a range-trading market. More interestingly, the stochastic oscillator has moved below both its moving average and overbought territory. Should this continue and the stochastic edges much lower, it could be a strong bearish signal.
If this stochastic move takes place, the bears would come up against a key area. The 89.74-90.31 range is populated by the September 21, 2017 high, the 38.2% Fibonacci retracement of the August 20, 2021 – September 13, 2022 downtrend, and the 50- and 100-day SMAs. If the bears managed to break this area, the path then looks clear until the 50% Fibonacci retracement at 88.19.
On the other hand, should the bulls try to register a higher high, they would have to overcome the 200-day SMA at 91.85. The 23.6% Fibonacci retracement at 93.63 appears to be the next key resistance point, with the ultimate target being the April 20, 2022 high at 95.73.
To sum up, AUDJPY bulls’ attempt to record a higher high appears to have run out of gas as the stochastic oscillator is ready to signal the start of another short-term bearish move.
GBPJPY Hovers Around 7-Year High
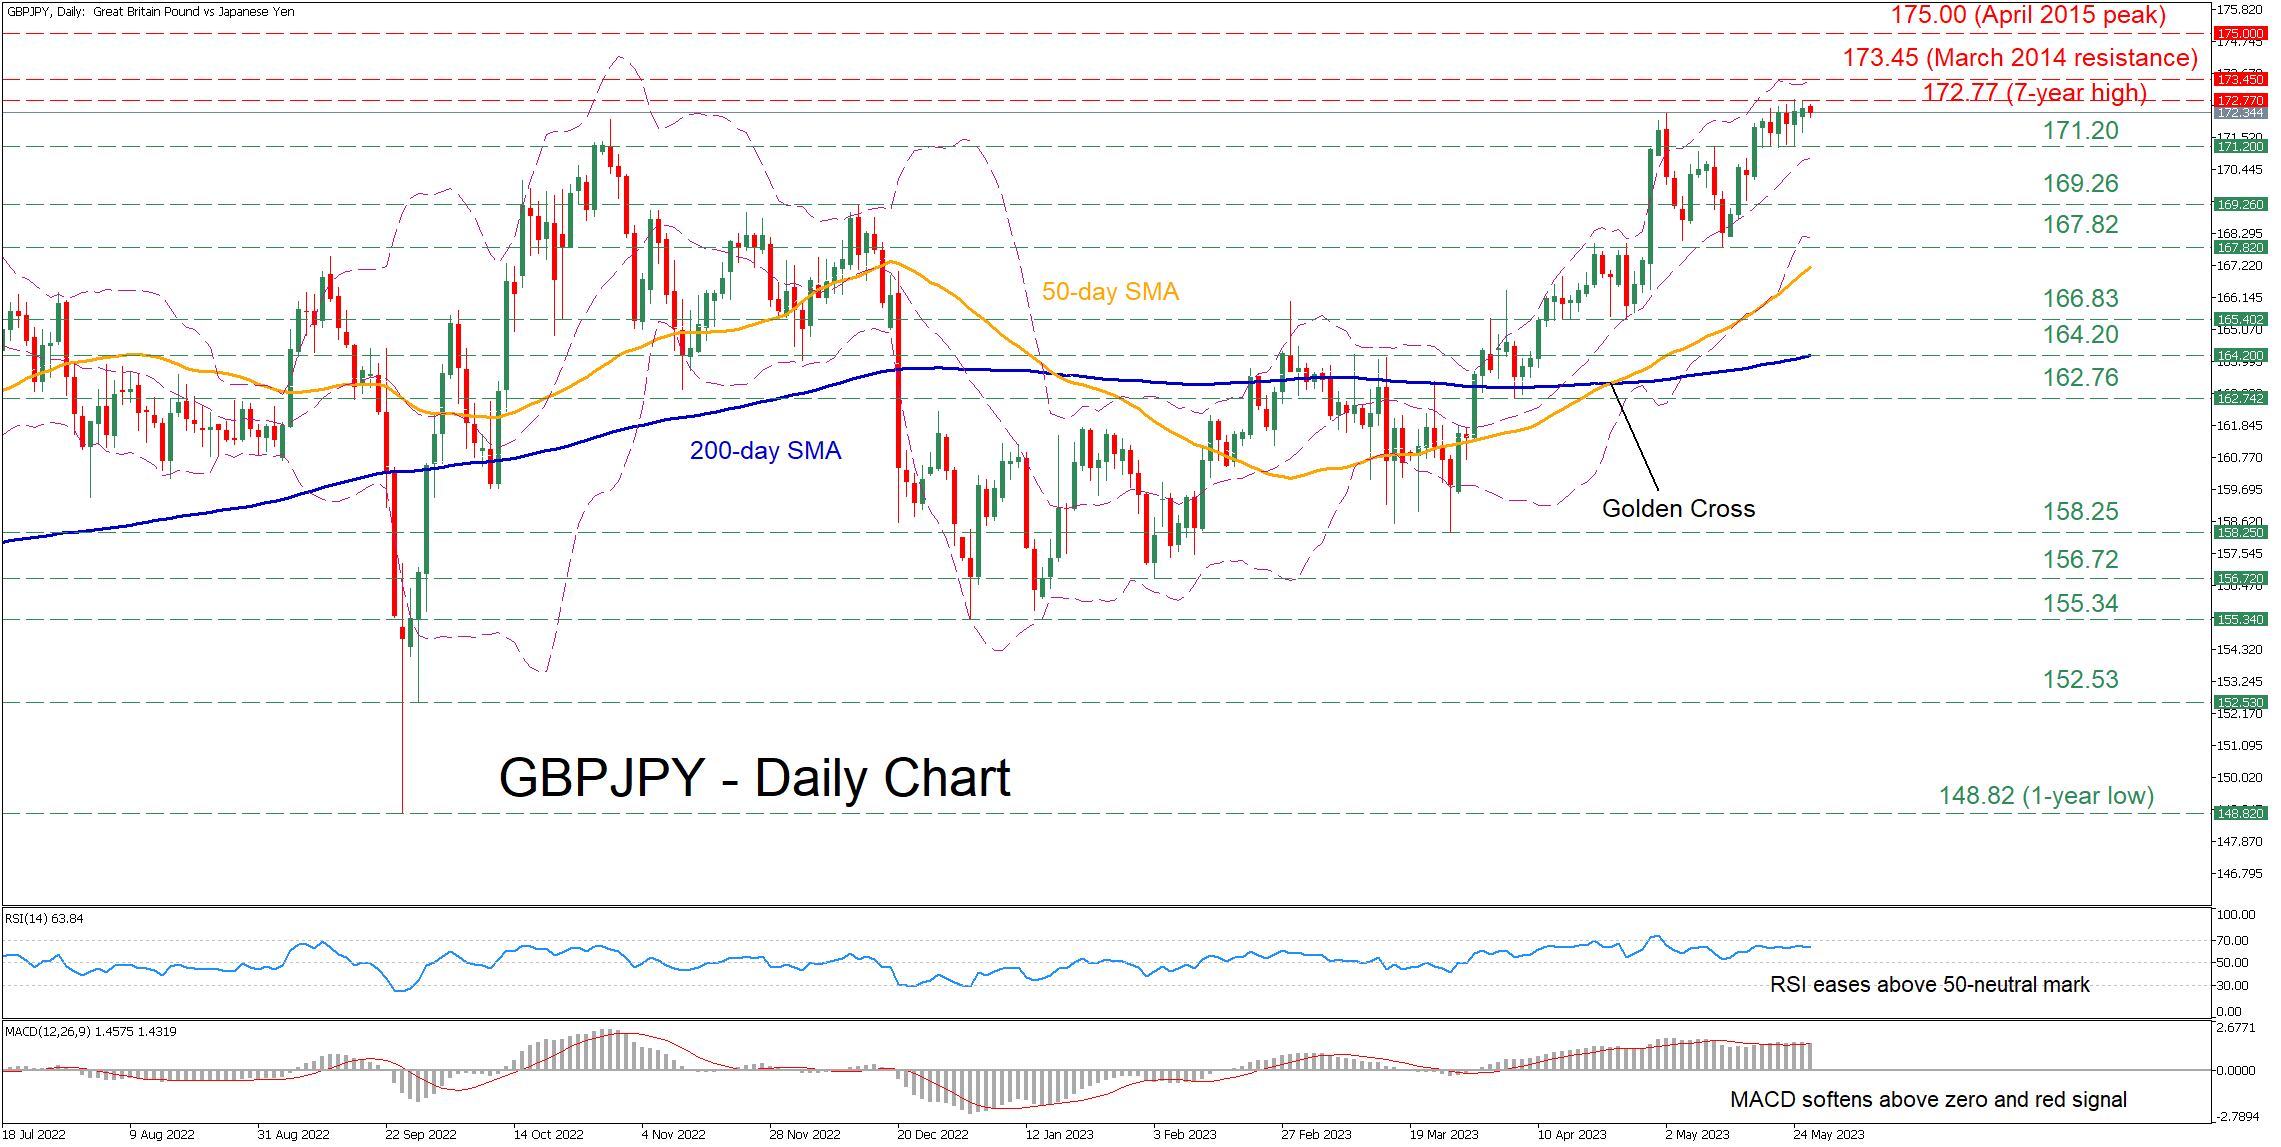
GBPJPY has been stuck in an uptrend since the beginning of the year, generating a seven-year peak of 172.77 last Wednesday. However, the pair has been flat since then, appearing to be unable to extend its recent rally.
The short-term oscillators currently suggest that bullish forces are waning but remain in control. Specifically, the RSI has flatlined above its 50-neutral mark, while the MACD histogram is softening above both zero and its red signal line.
Should buying pressures intensify, the seven-year high of 172.77 could be the first barricade for the bulls to clear. Slicing through that barricade, the pair could ascend towards levels not seen in years, where the March 2014 resistance of 173.45 could curb any upside attempts. If that barricade fails, the bulls might then attack the April 2015 high of 175.00.
Alternatively, if the positive momentum wanes and the price reverses lower, the recent support of 171.20 could act as the first line of defence. Further declines could then cease at the December resistance of 169.26, which could serve as support in the future. A dive beneath that region could trigger a decline towards the 166.83 support.
In brief, GBPJPY has been rangebound after its advance peaked at a seven-year high of 172.77. Therefore, a failure to create a fresh higher high may open the door for a moderate downside correction.
Crude Oil is Healthy for a Bigger Recovery after a Correction, Support is 70-68
Crude oil has been trading south for the last couple of months, but looks like market is now healthy for a recovery.
Recent strong drop in the 4-hour chart, can be also considered as a final spike into new lows, meaning it can be the end of wave (5) of A, so be aware of recovery, especially now when we have nice intrday impulse from the lows that is also trying to break the trendline resistance. So we think that more upside is coming after a current pullback in wave 2, which can be still in progress as an irregular/expanded flat correction that can retest 70-68 support before a continuation higher.
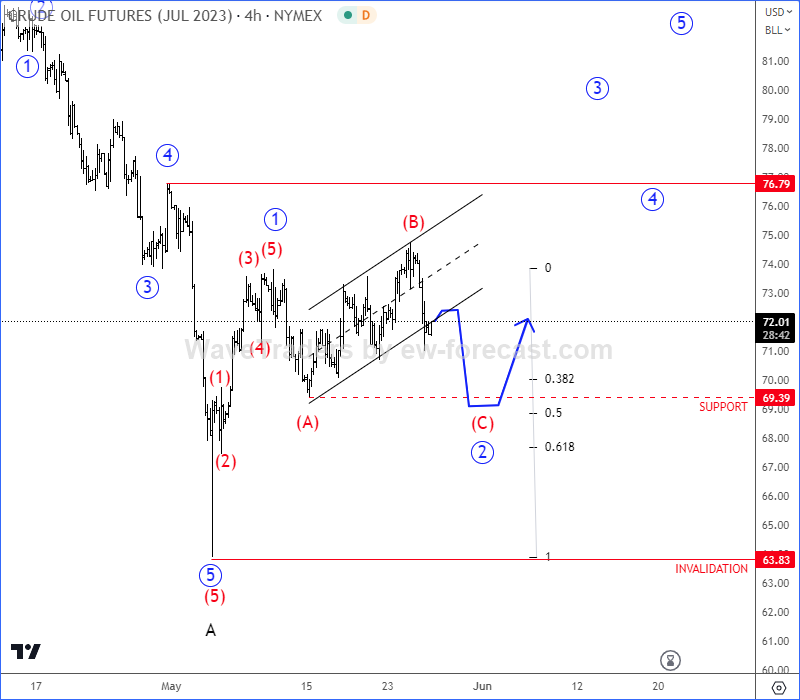
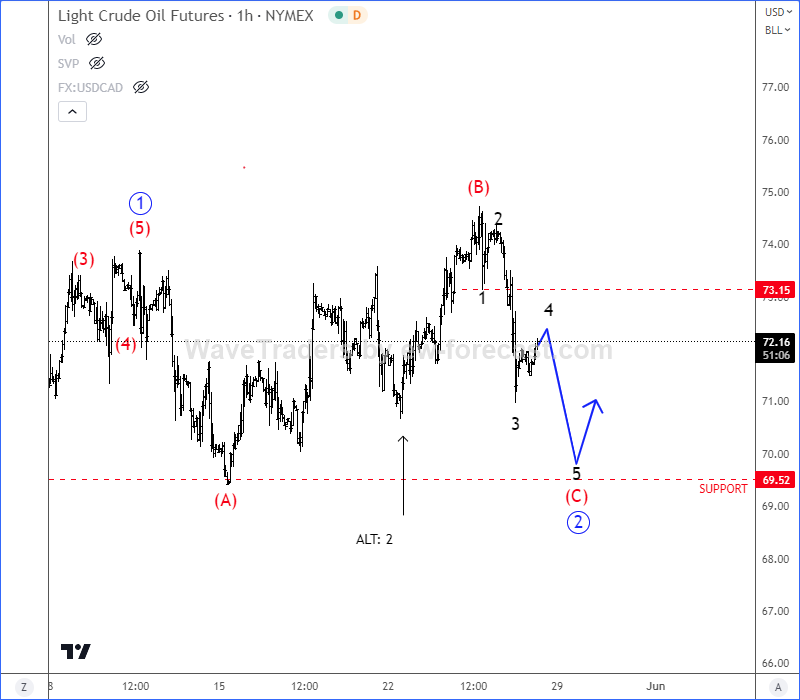
Looking at the intraday hourly chart, Crude oil is coming back down, ideally for wave (C) of a flat correction in wave 2 that can retest 70 – 68 support zone. Wave (C) is a motive wave and it should be completed by a five-wave cycle of the lower degree, so after current subwave 4 pullback, be aware of another intraday sell-off for wave 5 of (C) before a bullish continuation.